Embed Size (px)
Citation preview
Reserve Price Analysis Task: Performed for RGGI Inc. on behalf
of the Participating States
By
Dr. William Shobe
Center for Economic & Policy Studies
University of Virginia
November 2010
2
This report was prepared by Dr. William Shobe, the contractor, in the course of performing work contracted for and sponsored by RGGI, Inc. on behalf of the RGGI Participating States (Connecticut, Delaware, Maine, Maryland, Massachusetts, New Hampshire, New Jersey, New York, Rhode Island, and Vermont). The opinions expressed in this report do not necessarily reflect those of RGGI, Inc. or any of the Participating States, and reference to any specific product, service, process, or method does not constitute an implied or expressed recommendation or endorsement of it. Further, RGGI, Inc., the Participating States, and the contractor make no warranties or representations, expressed or implied, as to the fitness for particular purpose or merchantability of any product, apparatus, or service, or the usefulness, completeness, or accuracy of any processes, methods, or other information contained, described, disclosed, or referred to in this report. RGGI, Inc., the Participating States, and the contractor make no representation that the use of any product, apparatus, process, method, or other information will not infringe privately owned rights and will assume no liability for any loss, injury, or damage resulting from, or occurring in connection with, the use of information contained, described, disclosed, or referred to in this report. The Regional Greenhouse Gas Initiative (RGGI) is a cooperative effort by participating states to reduce emissions of carbon dioxide (CO2), a greenhouse gas that causes global warming. RGGI, Inc. is a non‐profit corporation created to provide technical and administrative services to the CO2 Budget Trading Programs of Connecticut, Delaware, Maine, Maryland, Massachusetts, New Hampshire, New Jersey, New York, Rhode Island, and Vermont.
The author would like to acknowledge valuable contributions from Dallas Burtraw and Charles Holt in the preparation of this report. Naturally, all remaining errors and omissions are solely the responsibility of the author.
3
Table of Contents
Executive Summary ................................................................................................................................................. 5
1. RGGI Current Market Price .......................................................................................................................... 8
1.1 The Importance of Market Volume and Volatility .................................................................... 8
1.2 Sources of RGGI Current Market Price Information ............................................................. 10
1.3 Assessing the Sources of Information on RGGI Current Market Price ......................... 11
2. Sufficiency of Market Data ........................................................................................................................ 18
2.1 Volatility in the Futures and Options Market .......................................................................... 18
2.2 Closeness in Futures and Auction Prices ................................................................................... 22
2.3 A Measure of ‘Closeness’ between Auctions and Futures Prices .................................... 25
3. Calculating Current Market Reserve Prices ...................................................................................... 27
3.1 CMRP Components and Methodologies ..................................................................................... 27
3.2 Transition to a CMRP ......................................................................................................................... 30
3.3 A One‐time Transition ....................................................................................................................... 30
3.4 CMRP Announcement Timing ........................................................................................................ 31
3.5 Applying the CMRP Methodology ................................................................................................. 34
4. Conclusions ..................................................................................................................................................... 35
5. References ....................................................................................................................................................... 36
4
List of Figures
Figure 1: Price of COATS Transfers by Date……………………………………………………………………14
Figure 2: Percent Difference in COATS & Futures Prices…………………………………………………15
Figure 3: Volume‐weighted Price of COATS Transfers by Date………………………………………..16
Figure 4: RGGI Futures and Auction Prices……………………………………………………………………..19
Figure 5: Futures Price Variance and Volume…………………………………………………………………20
Figure 6: Price Variance as a function of Trading Volume………………………………………………21
Figure 7: Estimate of Actual Emissions vs. RGGI budget………………………………..........................24
Figure 8: CMRP Forecast Errors: Prior Week & Two Week Prior……………………………............33
Figure 9: Prior Week CMRP Analysis……………………………………………………………………………...35
5
Executive Summary
The report has two purposes:
1) To evaluate and determine if there is sufficient reliable market data to transition to a current market reserve price (CMRP) for both current and future control period allowances and
2) To recommend a methodology for establishing a CMRP consistent with state rules and regulations.
1. Findings
A. Sufficiency of Market Data: The report finds that the RGGI allowance market currently provides an adequate basis to establish a CMRP for current compliance period allowances. This report evaluates the volatility of allowance prices and the dispersion between auction prices and secondary market prices. Based on a pattern of declining volatility of prices and a significant reduction in the dispersion between auction closing prices and futures prices, the report concludes that the eight auctions and nearly two years of secondary market activity have eliminated substantial amounts of early uncertainty. While uncertainty remains, it is of smaller magnitude and is driven more by exogenous economic factors than by uncertainties over compliance costs.
The report also finds that a CMRP is appropriate for future vintages as well.1 Since the RGGI auction price for future control period allowances has been resting at or near the reserve price for the last four auctions, measures of dispersion between auction closing and future prices do not provide a reliable indication of the closeness of auction and futures prices for future vintages. However, because current and future allowance prices are linked through the opportunity for allowance banking, it is reasonable to conclude that the differences between current and future allowances will arise primarily due to market discounting for time and risk.
B. Calculation of a CMRP: The report identifies the auctions and futures trading on
the Chicago Climate Futures Exchange (CCFE) as the two most reliable data sources for calculating CMRP.2 The report recommends a volume weighted CMRP using both prior auction and recent futures prices. A combined auction and futures CMRP calculation gives all participants in the RGGI market confidence that the reserve
1 In the short run, with allowance prices at very close to the $1.86 minimum reserve price the CMRP is unlikely to be above $1.86 and so will not be binding. 2 The report finds that prices recorded in the RGGI CO2 Allowance Tracking System (COATS) for transactions excluding auction sales may reflect special circumstances that do not generalize to a larger market and are therefore not reliable in terms of a CMRP. Data from NYMEX trading in RGGI futures may be added to the CMRP calculations if desired, but this will usually not have a large impact on the calculated CMRP.
6
price is being set by a mechanism that takes advantage of the efficient price discovery provided by active allowance markets. The volume weighted auction and futures CMRP could be made public as early as two weeks prior to the auction. There will likely be a small increased error in estimating the market price for a CMRP two weeks prior to the auction as opposed to the prior week. While economic theory does not provide a rationale for an earlier announcement, practical consideration may provide some justification for doing so.
2. Discussion of Finding A: Sufficiency of Market Data
2.1 Volatility in the Futures and Options Markets
At the time of this report eight auctions have been held and the RGGI allowance market has been in existence for nearly two years. The report analyzes data from the CCFE and finds that prices for RGGI allowances were highly volatile during the first few months of futures trading but that volatility has fallen dramatically. Trading volumes in the secondary market rose dramatically during mid‐2009 but have since fallen back to relatively low levels due to a projected inventory of surplus allowances and to regulatory uncertainty. Price volatility did not rise with these declining volumes. This is consistent with patterns observed early in other emission markets. Early trading helps reveal considerable amounts of previously private information about compliance costs thus reducing much of the technological uncertainty inherent in new compliance regimes. Following the resolution of this early uncertainty, much of the remaining volatility is driven by shared uncertainty over the future path of economic factors that affect the value of RGGI allowances. The decline in the volatility of allowance prices is a strong signal of a maturing market for RGGI allowances.
2.2 Closeness in Futures and Auction Prices
A large difference between futures prices and auction closing prices indicates that the price signals do not hold enough information for calculating a CMRP that is ‘close’ to the true market price. Closeness is determined by examining the dispersion between observed auction closing prices and contemporaneous CCFE futures prices. While dispersion between the two price signals was initially quite high, it has fallen markedly over time. At current levels, the observed differences between the two price signals imply a low likelihood of a binding auction reserve due only to normal random variation in allowance prices. External economic factors may still drive relatively sharp movements in allowance prices and can result in a binding CMRP. However, the lower dispersion between auction and futures prices and the commensurate reduction in the likelihood that a CMRP would bind due to normal price volatility indicate that the auction and futures prices are close enough to support the use of a CMRP.
7
3. Discussion of Finding B: Calculating a CMRP for Allowances
Next the report identifies what combination of price signals produces the best forecast of future auction outcomes. This is done by using the mean absolute percent error (MAPE) measurement. For the current control period the report suggests a prior‐week (or possibly a two week prior) volume weighted CMRP using both auction and futures prices. The MAPE calculation for future compliance period allowances indicates that the weighted combination of prior auction and futures prices yield a forecast of auction closing prices with an error rate well within the CMRP 20% range. This implies that the forecast itself is unlikely to result in a binding CMRP. 3.1 Volume Weighting & One‐Time CMRP Transition Once the decision is made to use a combined auction and futures CMRP, the decision need not be revisited as long as the auctions have sufficient participation to be judged as competitive by the RGGI market monitor. Volume weighting automatically gives the greatest weight to the most actively traded market venues. Auction volume is the number of allowances sold at the previous auction and price is the clearing price. Futures volume is the number of CCFE contracts traded during the selected ten trading days and price is determined by averaging the closing prices during the selected ten trading days. 3.2 Two Week Prior and Prior Week CMRP Methodologies Two Week Prior CMRP – 80% of: (i) The previous auction price multiplied by the proportion of total volume; plus (ii) the ten‐day average price of the futures contract for the current vintage allowances for the ten trading days ending the Friday two weeks before the next auction multiplied by the proportion of total volume. Prior Week CMRP – 80% of: (i) The previous auction price multiplied by the proportion of total volume; plus (ii) the ten‐day average price of the futures contract for the current vintage allowance for the ten trading days ending the Friday prior to the auction multiplied by the proportion of total volume. The prior week CMRP is the most accurate, but if it is determined that bidders need additional notice, the two‐week prior CMRP could be used with a relatively small impact on accuracy.
8
1. RGGI Current Market Price
The term market price refers to a theoretical idea. It is the price that equates the supply and demand of allowances at any given moment. We also know that, under ideal circumstances, this price should be related to the generally expected cost of additional emission reductions but will also depend on a multitude of institutional factors. We cannot directly observe either the market price or the marginal cost of reductions, if we could, then we would not need to auction allowances at all, rather we would simply sell them at the market price. It is because we cannot observe the market price that auctions are necessary. And it is the possible failure of auctions to close at a price near the market price that warrants the setting of a reserve price.
On the surface, this might appear to be an insoluble dilemma. We can’t observe market prices, but we want to make sure that any auctions of allowances close at a price not too far below this unobservable price. So setting a reserve price seems to depend on knowing the answer that the auction is designed to help discover. It is one of the central insights of economics that the solution to this paradox rests with the nature of competitive markets themselves. If the costs of trading are reasonably low and the number of participants sufficiently large, then the activities of traders in the market will reveal a good estimate of the marginal value of the good being traded even if none of the traders know the correct value.
Markets effectively summarize the knowledge of market participants concerning the value of the thing traded. Since we can observe a significant share of the trades made in allowance markets and, in some cases we have information about the prices at which the trades are made then we can use this information to make reasonable inferences about the marginal value of allowances at a given point in time. This provides the information needed for setting the reserve price for the auction. And since setting a reasonable reserve price increases the likelihood that bidders will bid their true values for allowances, this, in turn, contributes to the power of the allowance market to signal the true social value of allowances.
1.1 The Importance of Market Volume and Volatility
The operation of markets depends on a mutually beneficial exchange of assets between trading partners. The price discovery function depends on there being a sufficient number of trades so that the valuations of all likely traders are reasonably well represented. If only a few traders participate, then the prices at which assets are traded will reflect the particular characteristics of the traders present. For example, suppose a market opens for allowance trading and only two traders participate. The price at which trades take place between these participants may be quite different from the true marginal cost to society of reducing carbon emissions. If both traders face relatively high costs of
9
reducing emissions, then their trades will result in reported prices well above those that would be achieved if a wide range of traders were participating.
Thin markets also present an increased risk of market manipulation because only a small investment in trades can cause relatively large movements in prices. It only requires small transactions to generate relatively large price movements, which makes detection of intentional price manipulation very hard to distinguish from competitive behavior. The expense and risk associated with attempts to manipulate market prices rise rapidly with the level of participation and volume of trading.
For the reasons described, thin, or illiquid, markets tend to have more volatile prices than relatively thick, or liquid, markets. In illiquid markets, the current price depends on who happens to be trading on a given day. When a market has sufficient participation and activity, then we can have a reasonable assurance that the trades represent the actual distribution of valuations in the wider economy and that market manipulation is likely to be unprofitable or too risky.
The volatility of market prices depends on the uncertainty that market participants face regarding the value of the asset. Even with broad participation in the market, the value of a RGGI emission allowance will vary as estimates of the cost of emission reductions vary. This uncertainty is a combination of ‘internal’ or technological uncertainty and an ‘external’ uncertainty over economic conditions. The internal uncertainty reflects the incomplete information that traders have about the marginal costs of emission reductions among RGGI compliance entities. This information is private to the individual compliance entities. The external uncertainty arises from our incomplete information about the future path of economic variables such as fuel prices, the general level of economic activity, and the state of other state and federal policies.
One of the great advantages of market‐like regulations like the RGGI cap and trade program is that the market for emission allowances acts to effectively summarize any private information that market participants have about their own costs of emission reduction. This is true because compliance entities have a strong incentive to trade whenever the price is above or below their individual cost of emission reductions. This implies that there is a significant component of market uncertainty that will be much greater at the outset of the allowance market, since before the start of the market there is no mechanism for giving compliance entities incentive to act in a way that reveals information about industry compliance costs to the public. Pre‐market estimates are based on engineering studies and trade press inquiries that do not have the power of markets to induce firms to carefully evaluate their costs and then act in a way that reveals the industry marginal cost to the public.
This distinction between public and private uncertainty is important in thinking about a CMRP because it implies that price uncertainty will be higher at the outset of the market as some of the uncertainty over the private marginal cost of control is resolved by early market activity. So early trading can be expected to be more volatile as initial
10
uncertainties are resolved. Early volatility can be made much worse by thin trading, since at any point in time, only entities with high or low relative compliance costs may be participating in the trading. These wide swings will tend to fall as liquidity increases and as the uncertainty over the private costs of control are revealed in the market. Much of the remaining uncertainty will be due to the public uncertainties about future fuel prices, economic activity, policies, and other things. Accordingly, we might expect to see relatively high volatility at the outset of the RGGI allowance market due to both the technological uncertainty and the relatively thin early trading.
In the next section, we will discuss the sources of information about the market price of allowances and how useful each of these sources might be in setting a CMRP that needs to be based on the market price of allowances.
1.2 Sources of RGGI Current Market Price Information
For those RGGI participating states for which it applies, the current market price is based on any one or some combination of the following sources: (1) awards of allowances in previous auctions; (2) transfers reported to RGGI (i.e. transfers recorded in the RGGI CO2 Allowance Tracking System (COATS) database); and/or (3) prices reported publicly through reputable sources. Current market reserve price is the monetary amount calculated to be 80% of the current market price.
In between the quarterly auctions, interested parties can buy and sell interests in allowances, activity often referred to as the secondary allowance market. Many of these transactions will result in a transfer of title recorded on the COATS allowance tracking database along with a record of the price at which the transaction occurred, if it is available. So, the COATS database provides a second source of information about the market price of allowances.
For COATS‐recorded transactions (and for over‐the‐counter transactions discussed below) the immediate transfer of allowance ownership in exchange for a negotiated money price between arms‐length buyers and sellers represents only a part of the routine exchange of ownership interests in allowances. For example, traders may exchange allowances bundles with fossil fuels or other related commodities, in which case there may not be an explicit, meaningful price for the allowances alone; instead, the value is implicit. Firms may move allowances between divisions for compliance purposes or for other reasons. In these cases the actual market value of the allowances may be implicit in the transfer.
Of the publicly available sources of market activity, the exchange of future interests in allowances on commodity exchanges is generally thought to provide effective, public price discovery. In exchanges such as the New York Mercantile Exchange (NYMEX) and the Chicago Climate Futures Exchange (CCFE), traders exchange standardized contracts for promises of future delivery of allowances and for options for the future purchase (a call) or
11
sale (a put) of allowances at a set price.3 The value of these ‘derivative’ contracts depend on the expected value of the underlying asset, allowances. Since the contracts are standardized, the risk of default is minimized,4 and the costs of transaction are low. This supports a general view that derivatives prices depend less on unobservable transaction risks and costs and more on the value of the underlying asset. The trade in options has the added advantage of providing signals about the perceived risk of future changes in the value of the underlying asset due to changes in outside economic factors.
Contracts for immediate or future delivery of allowances, or spot and forward contracts respectively, are routinely traded outside of exchanges in what is referred to as over‐the‐counter (OTC) trading. This provides a fourth possible source of market price information. Unlike exchange transactions, these trades, usually mediated by brokers, lack the standard terms and conditions of derivatives and are thus subject to higher trading costs and unknown (at least to the outside observer) default risk. These factors can lead to significant differences between the reported transaction price and the price reported in standardized exchanges. Further, the price of the trade is not required to be made public, although, as noted, the transfers of ownership recorded on the COATS system do require the recording of a price when one is available. Reporting of OTC transactions is often provided as a service by private firms that collect and report on these trades as a service to clients. For example, in the case of RGGI allowances, Point Carbon publishes aggregate information on OTC trades.
Some information is reported on OTC transactions, but, for RGGI allowances and many other commodities, market information is incomplete. In spite of these sources of uncertainty, OTC prices still track futures market prices very closely. As time passes, forward contracts for RGGI allowances will turn into delivered allowances and, hence, into recorded transactions in COATS. At any point in time there will be an unknown amount of overlap between OTC transactions and COATS transactions. Primarily due to the very strong link between OTC and futures prices, there is little to be gained from using OTC prices as a separate source of information regarding the current market price of allowances.
1.3 Assessing the Sources of Information on RGGI Current Market Price
For those RGGI participating states for which it applies, the current market price must be based on the volume‐weighted average of one or some combination of previous auction results, RGGI COATS transfers, and reputable market sources. In this section, we evaluate what combination of these three sources provides the best measure of current
3 Since most trading currently takes place on the CCFE and since the NYMEX and CCFE prices are closely linked, we limit our analysis to data from CCFE trading. 4 The risk of default is very low for traders because all contracts are with the exchange rather than with other traders.
12
market price for the purposes of setting the CMRP.
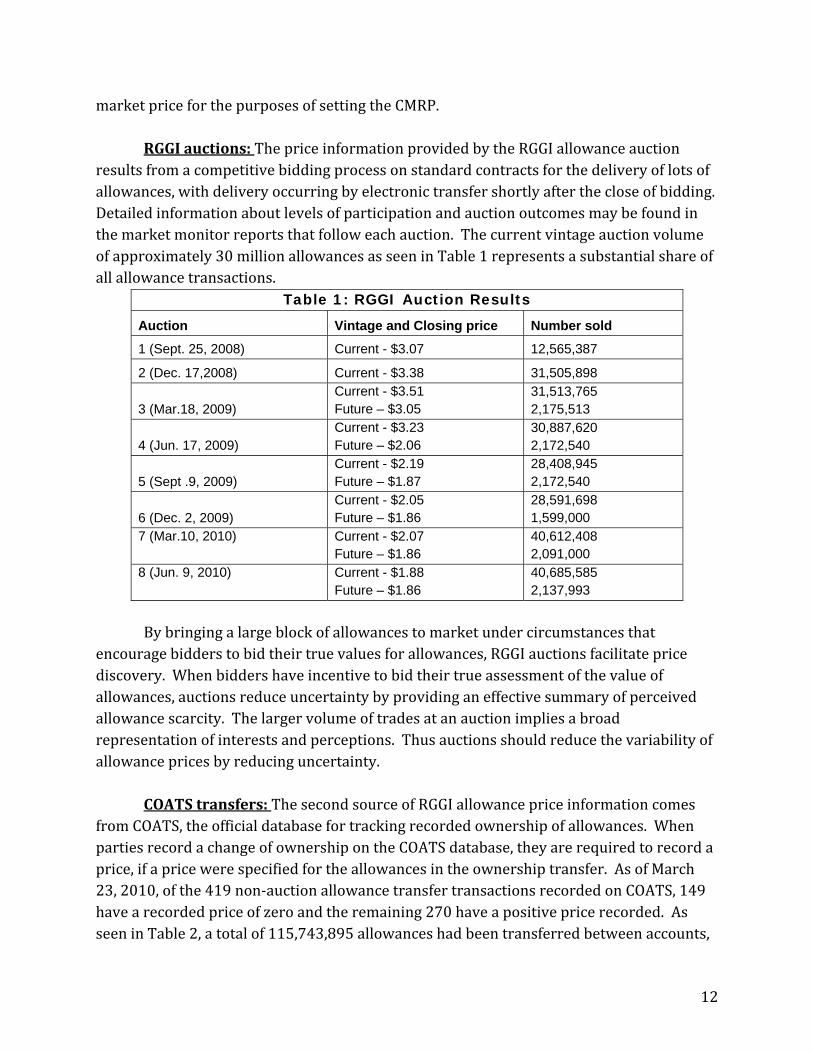
RGGI auctions: The price information provided by the RGGI allowance auction results from a competitive bidding process on standard contracts for the delivery of lots of allowances, with delivery occurring by electronic transfer shortly after the close of bidding. Detailed information about levels of participation and auction outcomes may be found in the market monitor reports that follow each auction. The current vintage auction volume of approximately 30 million allowances as seen in Table 1 represents a substantial share of all allowance transactions.
Table 1: RGGI Auction Results
Auction Vintage and Closing price Number sold
1 (Sept. 25, 2008) Current - $3.07 12,565,387
2 (Dec. 17,2008) Current - $3.38 31,505,898
3 (Mar.18, 2009) Current - $3.51 Future – $3.05
31,513,765 2,175,513
4 (Jun. 17, 2009) Current - $3.23 Future – $2.06
30,887,620 2,172,540
5 (Sept .9, 2009) Current - $2.19 Future – $1.87
28,408,945 2,172,540
6 (Dec. 2, 2009) Current - $2.05 Future – $1.86
28,591,698 1,599,000
7 (Mar.10, 2010) Current - $2.07 Future – $1.86
40,612,408 2,091,000
8 (Jun. 9, 2010) Current - $1.88 Future – $1.86
40,685,585 2,137,993
By bringing a large block of allowances to market under circumstances that
encourage bidders to bid their true values for allowances, RGGI auctions facilitate price discovery. When bidders have incentive to bid their true assessment of the value of allowances, auctions reduce uncertainty by providing an effective summary of perceived allowance scarcity. The larger volume of trades at an auction implies a broad representation of interests and perceptions. Thus auctions should reduce the variability of allowance prices by reducing uncertainty.
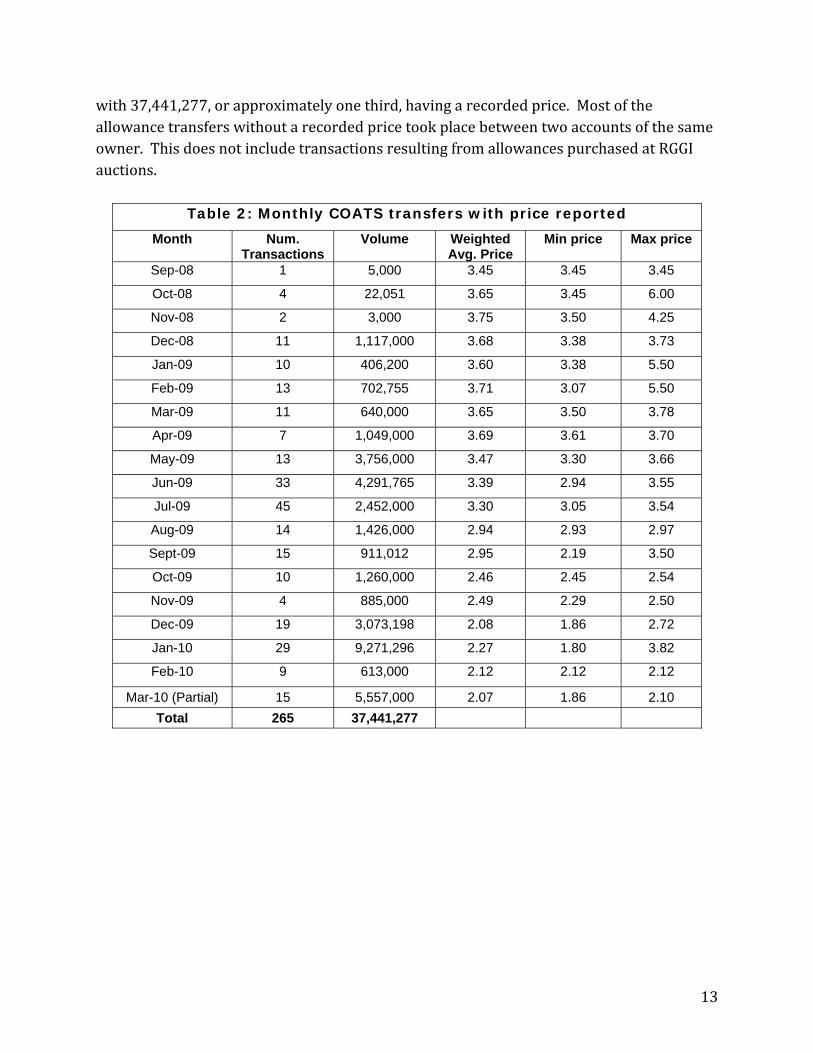
COATS transfers: The second source of RGGI allowance price information comes from COATS, the official database for tracking recorded ownership of allowances. When parties record a change of ownership on the COATS database, they are required to record a price, if a price were specified for the allowances in the ownership transfer. As of March 23, 2010, of the 419 non‐auction allowance transfer transactions recorded on COATS, 149 have a recorded price of zero and the remaining 270 have a positive price recorded. As seen in Table 2, a total of 115,743,895 allowances had been transferred between accounts,
13
with 37,441,277, or approximately one third, having a recorded price. Most of the allowance transfers without a recorded price took place between two accounts of the same owner. This does not include transactions resulting from allowances purchased at RGGI auctions.
Table 2: Monthly COATS transfers with price reported
Month Num. Transactions
Volume Weighted Avg. Price
Min price Max price
Sep-08 1 5,000 3.45 3.45 3.45
Oct-08 4 22,051 3.65 3.45 6.00
Nov-08 2 3,000 3.75 3.50 4.25
Dec-08 11 1,117,000 3.68 3.38 3.73
Jan-09 10 406,200 3.60 3.38 5.50
Feb-09 13 702,755 3.71 3.07 5.50
Mar-09 11 640,000 3.65 3.50 3.78
Apr-09 7 1,049,000 3.69 3.61 3.70
May-09 13 3,756,000 3.47 3.30 3.66
Jun-09 33 4,291,765 3.39 2.94 3.55
Jul-09 45 2,452,000 3.30 3.05 3.54
Aug-09 14 1,426,000 2.94 2.93 2.97
Sept-09 15 911,012 2.95 2.19 3.50
Oct-09 10 1,260,000 2.46 2.45 2.54
Nov-09 4 885,000 2.49 2.29 2.50
Dec-09 19 3,073,198 2.08 1.86 2.72
Jan-10 29 9,271,296 2.27 1.80 3.82
Feb-10 9 613,000 2.12 2.12 2.12
Mar-10 (Partial) 15 5,557,000 2.07 1.86 2.10
Total 265 37,441,277
14
Pricing data from COATS has the advantage of being readily available but is subject to significant uncertainty in interpretation. First, the exchange that results in the transfer of allowances between accounts is not standardized. This means that the price of the transaction may reflect particular aspects of the transaction which might result in a price above or below the current market value of the day of the transfer. For example, parties may agree on delayed delivery, or may carry out a sequence of trades, or may bundle allowance exchanges with other exchanges. It is likely that how a transaction is structured will affect the tax treatment of the transaction. The allocation of the risk of default between buyers and sellers is known to affect the price of exchange. The date of the recording of the transfer may not be the same as the date that the price of the transaction is established by the parties. Since the transactions represented in the COATS data are not standardized with respect to these characteristics, the recorded price may appear to vary from current market prices for allowances for reasons that are not related to the values placed on the allowances by the trading partners. We would expect, then, that the COATS reported prices may display significant variation away from other measures of market price. In sum, COATS non‐auction allowance transactions have relatively high transaction costs, and the prices reported may reflect the special circumstances of the particular trade, circumstances that do not generalize to the larger market.
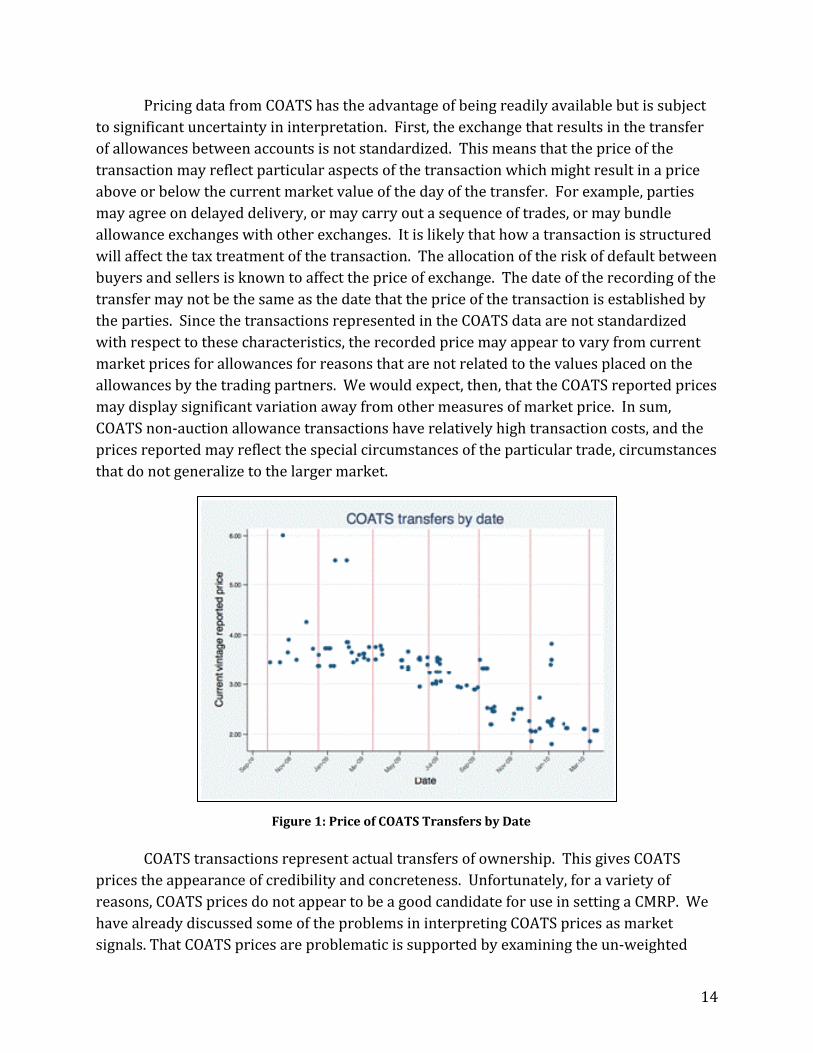
COATS transactions represent actual transfers of ownership. This gives COATS
prices the appearance of credibility and concreteness. Unfortunately, for a variety of reasons, COATS prices do not appear to be a good candidate for use in setting a CMRP. We have already discussed some of the problems in interpreting COATS prices as market signals. That COATS prices are problematic is supported by examining the un‐weighted
Figure 1: Price of COATS Transfers by Date
15
COATS transactions reported to date.5 One striking point about these transactions is how dispersed they are even on a single day. Such dispersion, in the presence of an active secondary market is consistent with the concern that the reported prices reflect idiosyncratic circumstances, many of which would not likely be reflected in bidding behavior in an auction.
COATS transactions have been intermittent. There are many periods where little trading activity occurs and intermittent surges in activity. For example, there were no COATS transactions recorded between April 3 and May 4 in 2009. The first transfer of vintage 2012 allowances recorded on COATS with a price reported occurred on December 4, 2009 with a price of $1.86. The next vintage 2012 transaction recorded on COATS was on January 5, 2010 with a price of $3.40. The infrequency of COATS transfers greatly reduces the value of these transfers for predicting the closing prices of upcoming auctions. In fact, for vintages being auctioned for the first time, no COATS prices can have been reported.
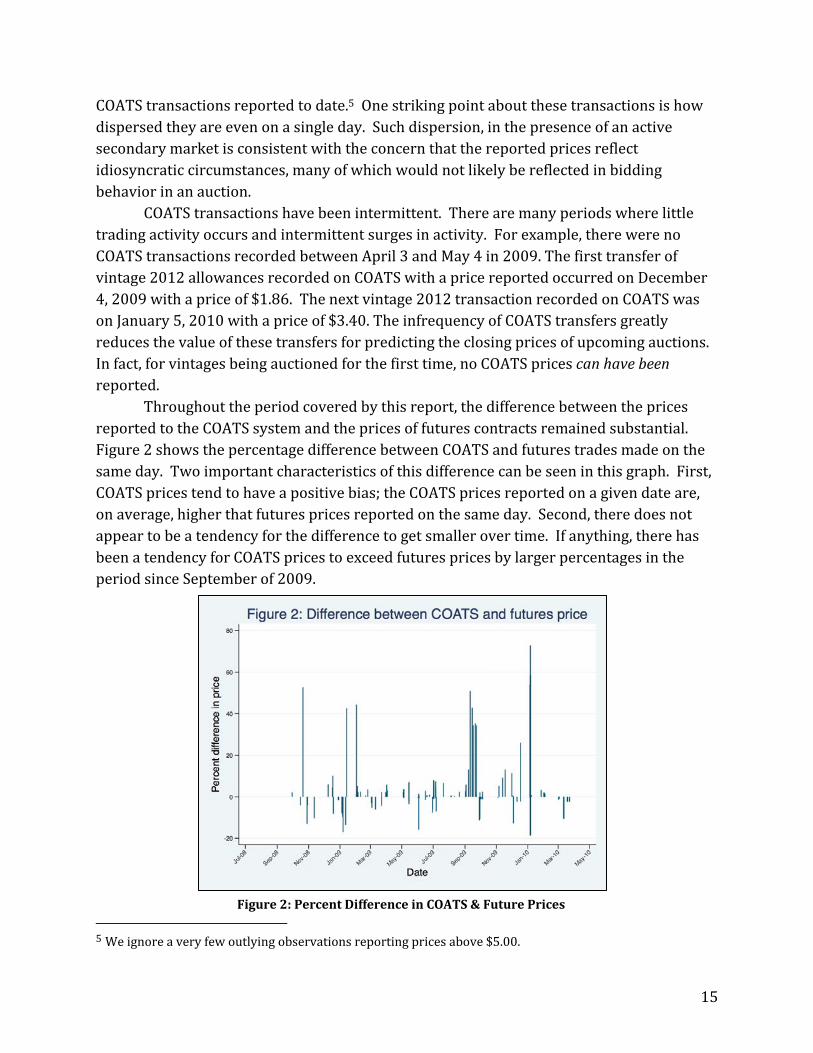
Throughout the period covered by this report, the difference between the prices reported to the COATS system and the prices of futures contracts remained substantial. Figure 2 shows the percentage difference between COATS and futures trades made on the same day. Two important characteristics of this difference can be seen in this graph. First, COATS prices tend to have a positive bias; the COATS prices reported on a given date are, on average, higher that futures prices reported on the same day. Second, there does not appear to be a tendency for the difference to get smaller over time. If anything, there has been a tendency for COATS prices to exceed futures prices by larger percentages in the period since September of 2009.
5 We ignore a very few outlying observations reporting prices above $5.00.
Figure 2: Percent Difference in COATS & Future Prices
16
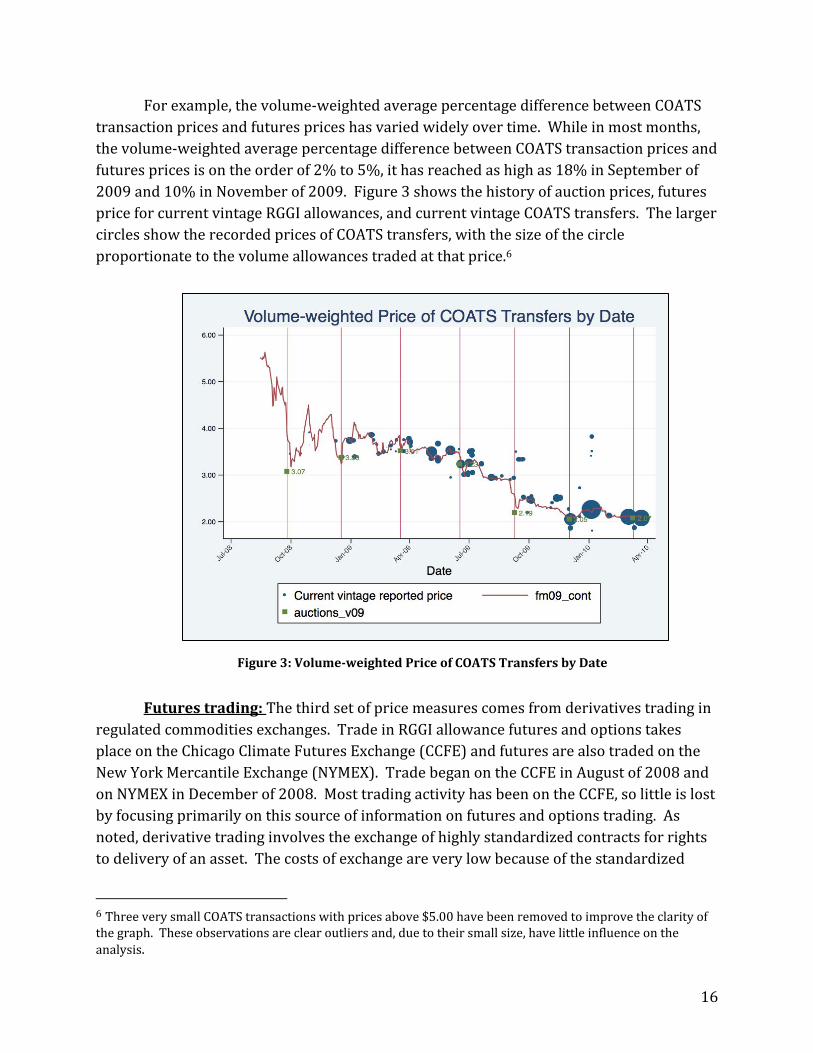
For example, the volume‐weighted average percentage difference between COATS transaction prices and futures prices has varied widely over time. While in most months, the volume‐weighted average percentage difference between COATS transaction prices and futures prices is on the order of 2% to 5%, it has reached as high as 18% in September of 2009 and 10% in November of 2009. Figure 3 shows the history of auction prices, futures price for current vintage RGGI allowances, and current vintage COATS transfers. The larger circles show the recorded prices of COATS transfers, with the size of the circle proportionate to the volume allowances traded at that price.6
Futures trading: The third set of price measures comes from derivatives trading in
regulated commodities exchanges. Trade in RGGI allowance futures and options takes place on the Chicago Climate Futures Exchange (CCFE) and futures are also traded on the New York Mercantile Exchange (NYMEX). Trade began on the CCFE in August of 2008 and on NYMEX in December of 2008. Most trading activity has been on the CCFE, so little is lost by focusing primarily on this source of information on futures and options trading. As noted, derivative trading involves the exchange of highly standardized contracts for rights to delivery of an asset. The costs of exchange are very low because of the standardized
6 Three very small COATS transactions with prices above $5.00 have been removed to improve the clarity of the graph. These observations are clear outliers and, due to their small size, have little influence on the analysis.
Figure 3: Volumeweighted Price of COATS Transfers by Date
17
nature of the contracts being traded and because there is no bilateral negotiation between buyer and seller. All traders interact only with the exchange. The exchange guarantees performance of contracts virtually eliminating the risk of default on futures contracts.
When trading in physical commodities such as oil or pork bellies, derivatives traders do not normally exchange their contract for actual delivery of the underlying asset, but rather terminate their interest by arranging an offsetting transaction with the exchange that extinguishes the open interest. RGGI allowance purchases are settled by the electronic transfer of ownership between two COATS accounts and do not involve the complications of physical delivery. Consequently, a significant number of purchases of RGGI allowances take place just after the expiration date of a futures contract. Even the transactions that do not result in actual changes of ownership provide traders with strong financial incentives to correctly anticipate the future price of allowances. Because considerable economic value is at stake, exchanges are thought to provide an excellent platform for revealing information about the market value of goods. Options involve rights to future sale or purchase of interests and provide information about traders’ perceived risks of future price changes in the underlying asset.
18
2. Sufficiency of Market Data
2.1 Volatility in the Futures and Options Market
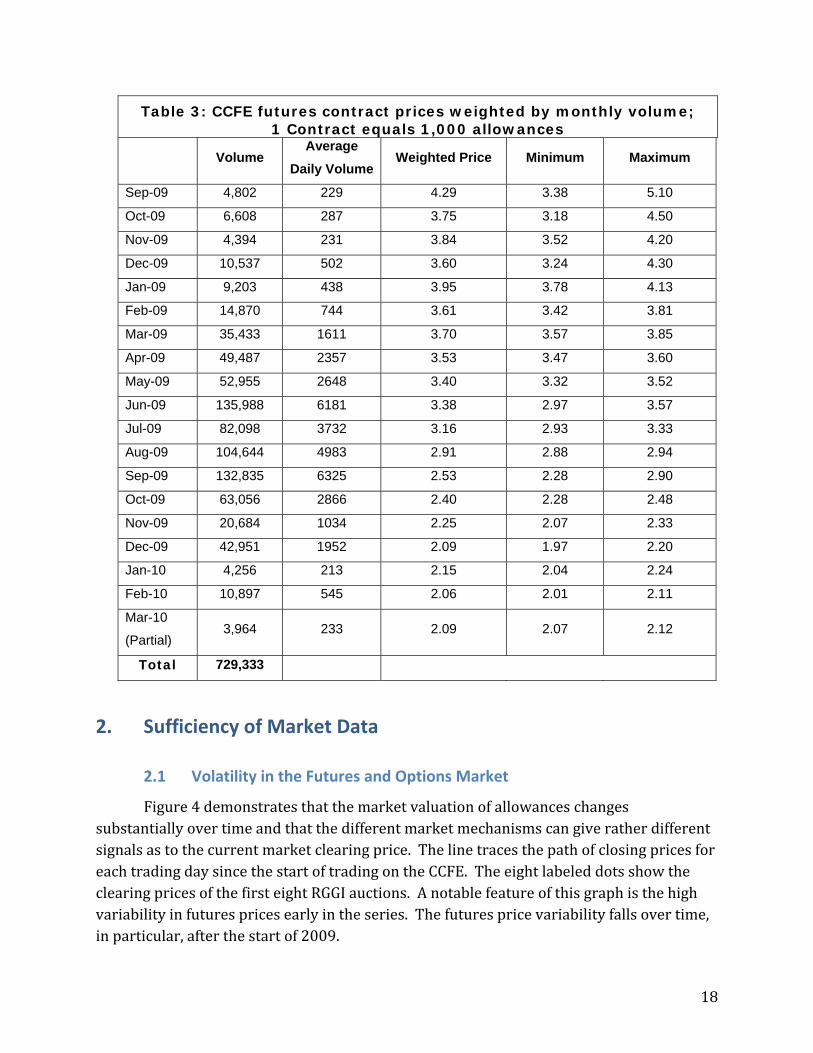
Figure 4 demonstrates that the market valuation of allowances changes substantially over time and that the different market mechanisms can give rather different signals as to the current market clearing price. The line traces the path of closing prices for each trading day since the start of trading on the CCFE. The eight labeled dots show the clearing prices of the first eight RGGI auctions. A notable feature of this graph is the high variability in futures prices early in the series. The futures price variability falls over time, in particular, after the start of 2009.
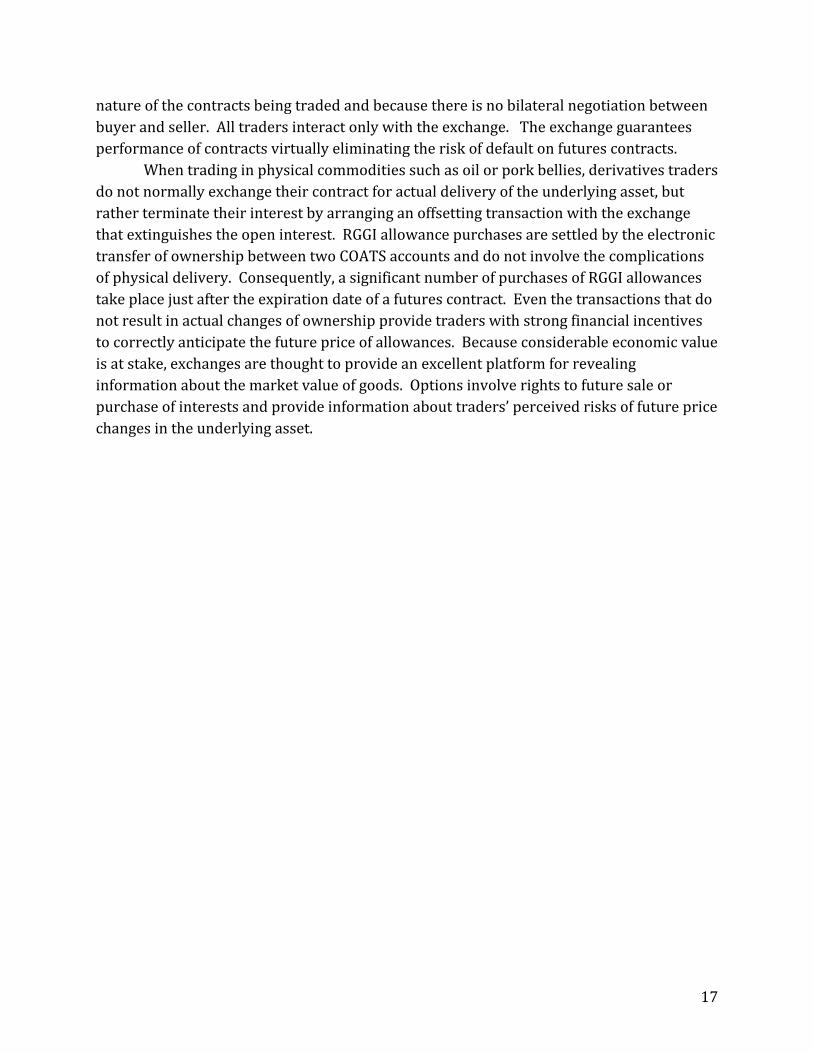
Table 3: CCFE futures contract prices weighted by monthly volume; 1 Contract equals 1,000 allowances
Volume Average
Daily VolumeWeighted Price Minimum Maximum
Sep-09 4,802 229 4.29 3.38 5.10
Oct-09 6,608 287 3.75 3.18 4.50
Nov-09 4,394 231 3.84 3.52 4.20
Dec-09 10,537 502 3.60 3.24 4.30
Jan-09 9,203 438 3.95 3.78 4.13
Feb-09 14,870 744 3.61 3.42 3.81
Mar-09 35,433 1611 3.70 3.57 3.85
Apr-09 49,487 2357 3.53 3.47 3.60
May-09 52,955 2648 3.40 3.32 3.52
Jun-09 135,988 6181 3.38 2.97 3.57
Jul-09 82,098 3732 3.16 2.93 3.33
Aug-09 104,644 4983 2.91 2.88 2.94
Sep-09 132,835 6325 2.53 2.28 2.90
Oct-09 63,056 2866 2.40 2.28 2.48
Nov-09 20,684 1034 2.25 2.07 2.33
Dec-09 42,951 1952 2.09 1.97 2.20
Jan-10 4,256 213 2.15 2.04 2.24
Feb-10 10,897 545 2.06 2.01 2.11
Mar-10
(Partial) 3,964 233 2.09 2.07 2.12
Total 729,333
19
As we discussed in section 1.1, this pattern is not unexpected. It is familiar because it is a pattern that has also been true of earlier emission markets. The most studied cases are the U.S. SO2 allowance trading program and the European Union Emissions Trading Scheme. In the case of RGGI, exogenous economic factors almost certainly exagerated the expected pattern of high early volatility. And the clear downward trend primarily reflects a substantial excess supply of RGGI allowances in the short run.
The striking variability of the early futures price signals the presence of considerable uncertainty over the value of allowances. This same pattern occurred in the early days of the U.S. SO2 trading program and partly reflects the wide dispersion of opinions about the cost of abating emissions. RGGI allowance trades began at the outset of a severe recession at a time of major disruptions in the normal operation of asset markets worldwide. Table 4 shows how the price volatility, the standard deviation as a percentage of the price, falls from 5.5% in 2008 to 1.2% in 2010.
Figure 4: RGGI Futures and Auction Prices
20
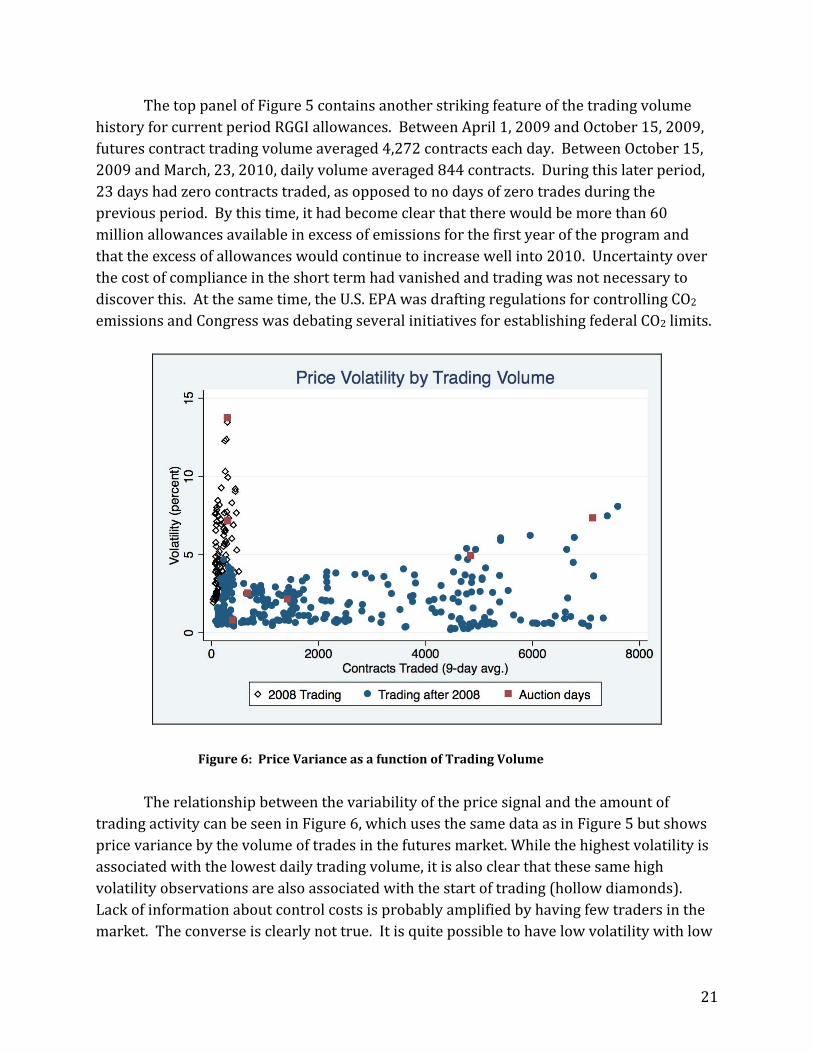
Figure 5 clearly suggests an association between declining variance and increased
trading volume at the start of the allowance market. However, the reason for this pattern is not immediately obvious. It is as likely that reduced uncertainty encouraged more trading as it is that increased trading reduced volatility. It is also possible that changes in variance and volume are responding to some external influence. In the top panel, the average daily trading volume is represented by the height of the bars. The bottom panel shows a rolling 9‐day estimate of the volatility of the futures price.
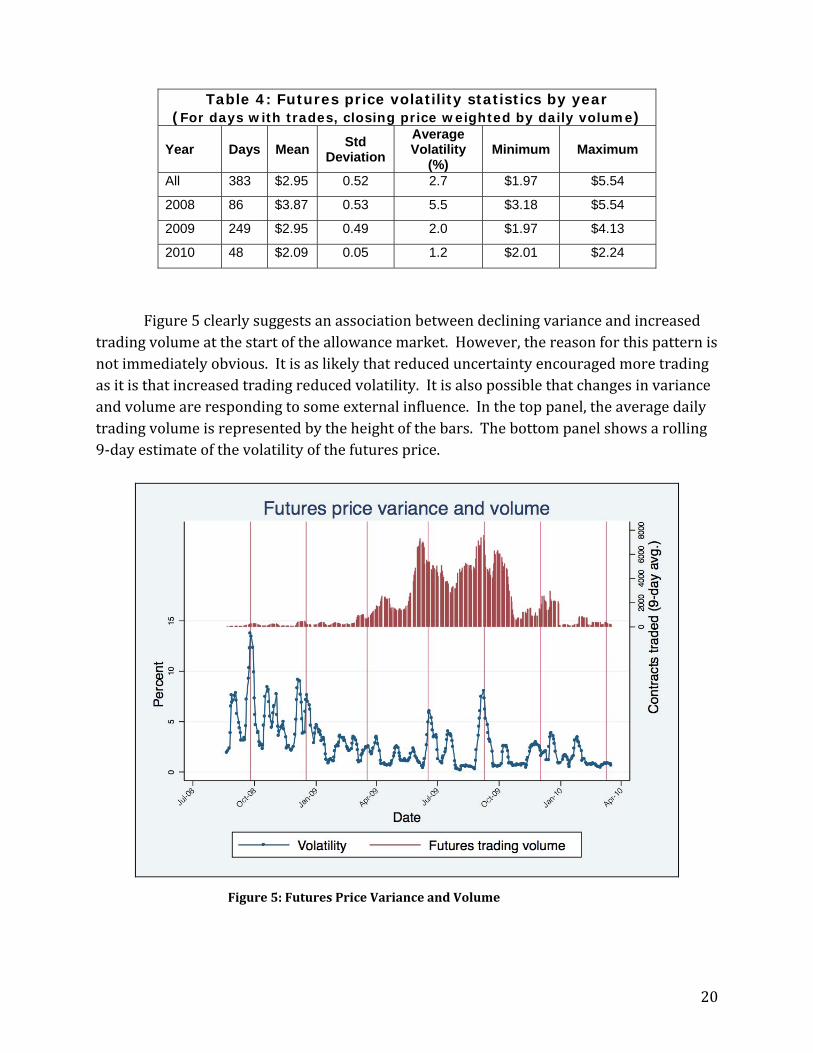
Table 4: Futures price volatility statistics by year (For days with trades, closing price weighted by daily volume)
Year Days Mean Std
Deviation
Average Volatility
(%) Minimum Maximum
All 383 $2.95 0.52 2.7 $1.97 $5.54
2008 86 $3.87 0.53 5.5 $3.18 $5.54
2009 249 $2.95 0.49 2.0 $1.97 $4.13
2010 48 $2.09 0.05 1.2 $2.01 $2.24
Figure 5: Futures Price Variance and Volume
21
The top panel of Figure 5 contains another striking feature of the trading volume history for current period RGGI allowances. Between April 1, 2009 and October 15, 2009, futures contract trading volume averaged 4,272 contracts each day. Between October 15, 2009 and March, 23, 2010, daily volume averaged 844 contracts. During this later period, 23 days had zero contracts traded, as opposed to no days of zero trades during the previous period. By this time, it had become clear that there would be more than 60 million allowances available in excess of emissions for the first year of the program and that the excess of allowances would continue to increase well into 2010. Uncertainty over the cost of compliance in the short term had vanished and trading was not necessary to discover this. At the same time, the U.S. EPA was drafting regulations for controlling CO2 emissions and Congress was debating several initiatives for establishing federal CO2 limits.
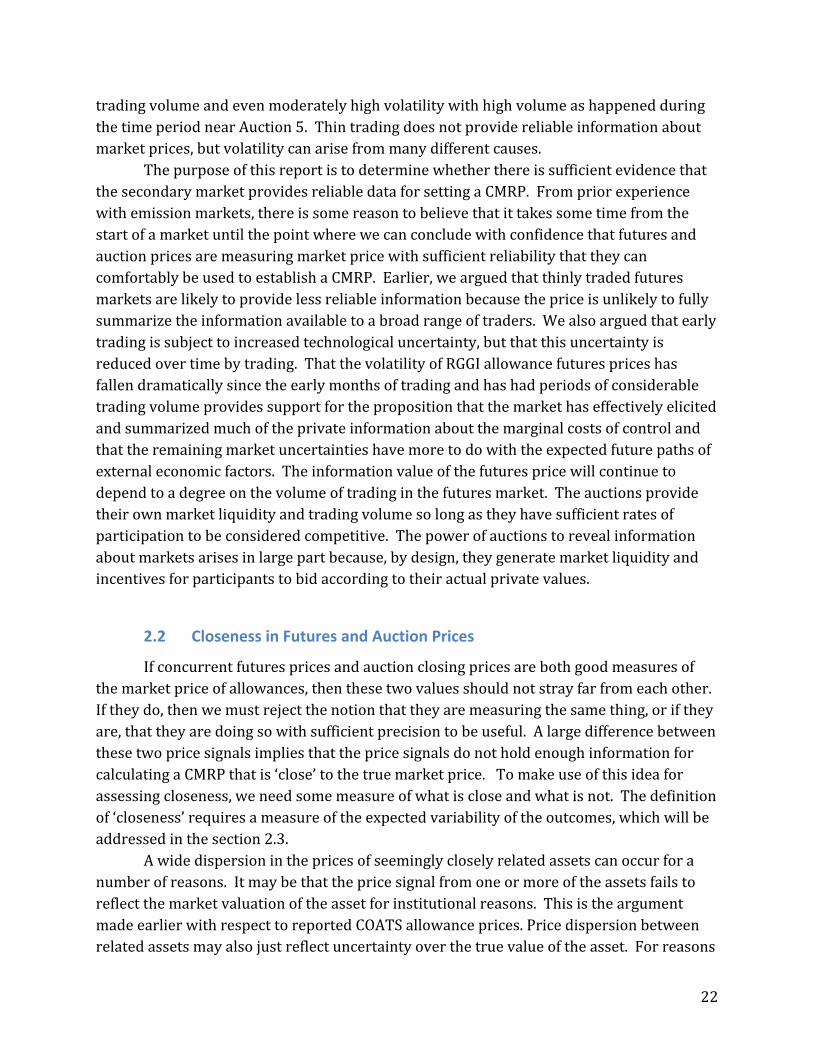
The relationship between the variability of the price signal and the amount of trading activity can be seen in Figure 6, which uses the same data as in Figure 5 but shows price variance by the volume of trades in the futures market. While the highest volatility is associated with the lowest daily trading volume, it is also clear that these same high volatility observations are also associated with the start of trading (hollow diamonds). Lack of information about control costs is probably amplified by having few traders in the market. The converse is clearly not true. It is quite possible to have low volatility with low
Figure 6: Price Variance as a function of Trading Volume
22
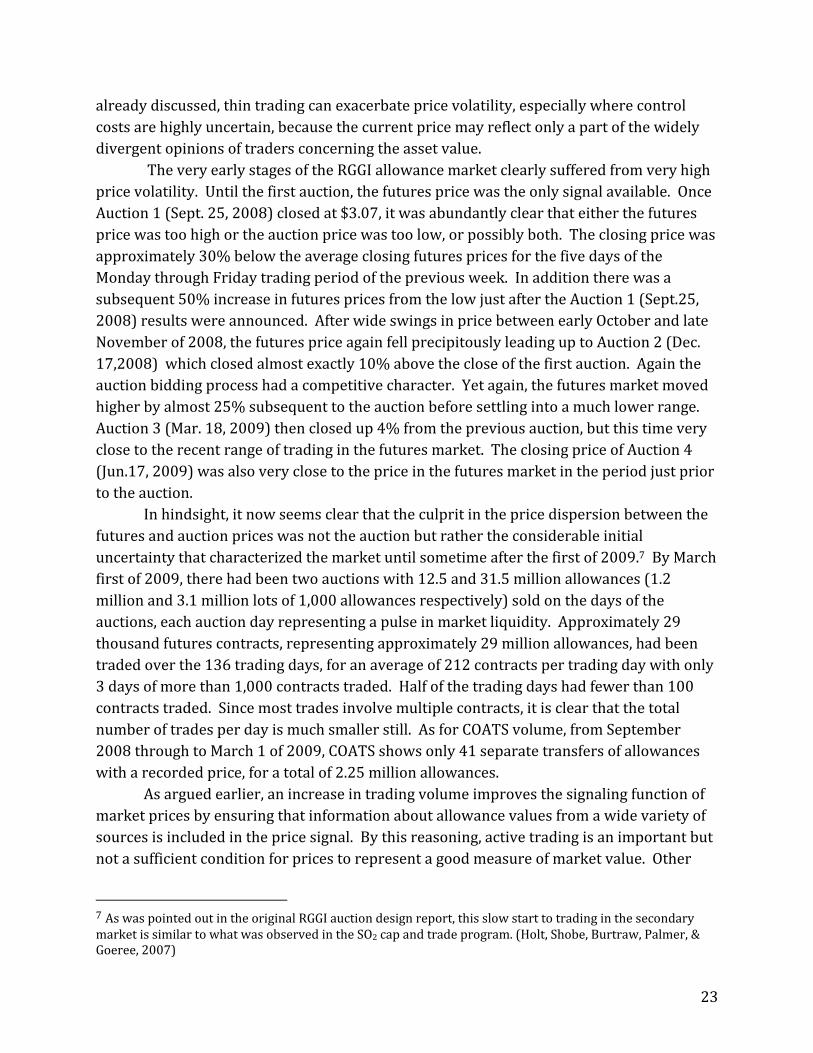
trading volume and even moderately high volatility with high volume as happened during the time period near Auction 5. Thin trading does not provide reliable information about market prices, but volatility can arise from many different causes.
The purpose of this report is to determine whether there is sufficient evidence that the secondary market provides reliable data for setting a CMRP. From prior experience with emission markets, there is some reason to believe that it takes some time from the start of a market until the point where we can conclude with confidence that futures and auction prices are measuring market price with sufficient reliability that they can comfortably be used to establish a CMRP. Earlier, we argued that thinly traded futures markets are likely to provide less reliable information because the price is unlikely to fully summarize the information available to a broad range of traders. We also argued that early trading is subject to increased technological uncertainty, but that this uncertainty is reduced over time by trading. That the volatility of RGGI allowance futures prices has fallen dramatically since the early months of trading and has had periods of considerable trading volume provides support for the proposition that the market has effectively elicited and summarized much of the private information about the marginal costs of control and that the remaining market uncertainties have more to do with the expected future paths of external economic factors. The information value of the futures price will continue to depend to a degree on the volume of trading in the futures market. The auctions provide their own market liquidity and trading volume so long as they have sufficient rates of participation to be considered competitive. The power of auctions to reveal information about markets arises in large part because, by design, they generate market liquidity and incentives for participants to bid according to their actual private values.
2.2 Closeness in Futures and Auction Prices
If concurrent futures prices and auction closing prices are both good measures of the market price of allowances, then these two values should not stray far from each other. If they do, then we must reject the notion that they are measuring the same thing, or if they are, that they are doing so with sufficient precision to be useful. A large difference between these two price signals implies that the price signals do not hold enough information for calculating a CMRP that is ‘close’ to the true market price. To make use of this idea for assessing closeness, we need some measure of what is close and what is not. The definition of ‘closeness’ requires a measure of the expected variability of the outcomes, which will be addressed in the section 2.3.
A wide dispersion in the prices of seemingly closely related assets can occur for a number of reasons. It may be that the price signal from one or more of the assets fails to reflect the market valuation of the asset for institutional reasons. This is the argument made earlier with respect to reported COATS allowance prices. Price dispersion between related assets may also just reflect uncertainty over the true value of the asset. For reasons
23
already discussed, thin trading can exacerbate price volatility, especially where control costs are highly uncertain, because the current price may reflect only a part of the widely divergent opinions of traders concerning the asset value.
The very early stages of the RGGI allowance market clearly suffered from very high price volatility. Until the first auction, the futures price was the only signal available. Once Auction 1 (Sept. 25, 2008) closed at $3.07, it was abundantly clear that either the futures price was too high or the auction price was too low, or possibly both. The closing price was approximately 30% below the average closing futures prices for the five days of the Monday through Friday trading period of the previous week. In addition there was a subsequent 50% increase in futures prices from the low just after the Auction 1 (Sept.25, 2008) results were announced. After wide swings in price between early October and late November of 2008, the futures price again fell precipitously leading up to Auction 2 (Dec. 17,2008) which closed almost exactly 10% above the close of the first auction. Again the auction bidding process had a competitive character. Yet again, the futures market moved higher by almost 25% subsequent to the auction before settling into a much lower range. Auction 3 (Mar. 18, 2009) then closed up 4% from the previous auction, but this time very close to the recent range of trading in the futures market. The closing price of Auction 4 (Jun.17, 2009) was also very close to the price in the futures market in the period just prior to the auction.
In hindsight, it now seems clear that the culprit in the price dispersion between the futures and auction prices was not the auction but rather the considerable initial uncertainty that characterized the market until sometime after the first of 2009.7 By March first of 2009, there had been two auctions with 12.5 and 31.5 million allowances (1.2 million and 3.1 million lots of 1,000 allowances respectively) sold on the days of the auctions, each auction day representing a pulse in market liquidity. Approximately 29 thousand futures contracts, representing approximately 29 million allowances, had been traded over the 136 trading days, for an average of 212 contracts per trading day with only 3 days of more than 1,000 contracts traded. Half of the trading days had fewer than 100 contracts traded. Since most trades involve multiple contracts, it is clear that the total number of trades per day is much smaller still. As for COATS volume, from September 2008 through to March 1 of 2009, COATS shows only 41 separate transfers of allowances with a recorded price, for a total of 2.25 million allowances.
As argued earlier, an increase in trading volume improves the signaling function of market prices by ensuring that information about allowance values from a wide variety of sources is included in the price signal. By this reasoning, active trading is an important but not a sufficient condition for prices to represent a good measure of market value. Other
7 As was pointed out in the original RGGI auction design report, this slow start to trading in the secondary market is similar to what was observed in the SO2 cap and trade program. (Holt, Shobe, Burtraw, Palmer, & Goeree, 2007)
24
factors can cause a divergence between auction closing and futures price signals. In the case of RGGI allowances, the combination of a severe national recession and an oversupply of allowances and the potential for federal action on climate change represents just such an influence. Futures volume was quite robust during the period leading up to Auction 5 (Sept. 9, 2009), but there was a large drop in price between July and September, a fall that accelerated just prior to the auction. By the time of the Auction 6(Dec. 2, 2009), futures volume had fallen to very low levels.
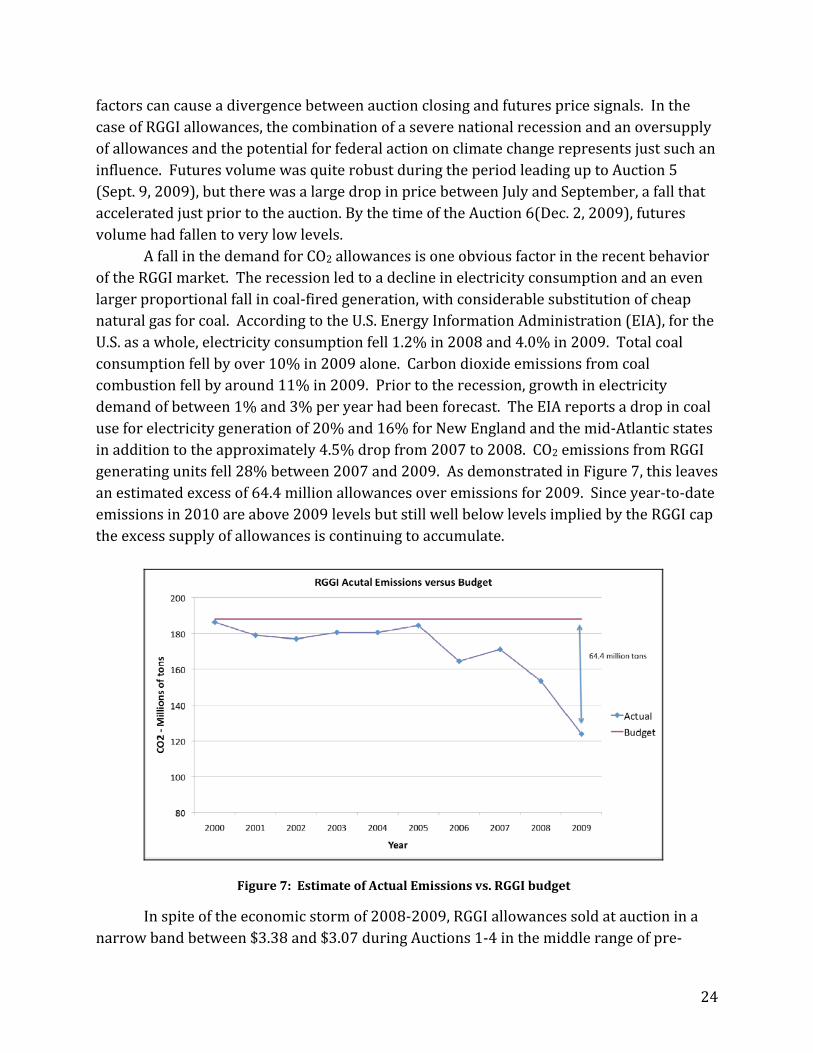
A fall in the demand for CO2 allowances is one obvious factor in the recent behavior of the RGGI market. The recession led to a decline in electricity consumption and an even larger proportional fall in coal‐fired generation, with considerable substitution of cheap natural gas for coal. According to the U.S. Energy Information Administration (EIA), for the U.S. as a whole, electricity consumption fell 1.2% in 2008 and 4.0% in 2009. Total coal consumption fell by over 10% in 2009 alone. Carbon dioxide emissions from coal combustion fell by around 11% in 2009. Prior to the recession, growth in electricity demand of between 1% and 3% per year had been forecast. The EIA reports a drop in coal use for electricity generation of 20% and 16% for New England and the mid‐Atlantic states in addition to the approximately 4.5% drop from 2007 to 2008. CO2 emissions from RGGI generating units fell 28% between 2007 and 2009. As demonstrated in Figure 7, this leaves an estimated excess of 64.4 million allowances over emissions for 2009. Since year‐to‐date emissions in 2010 are above 2009 levels but still well below levels implied by the RGGI cap the excess supply of allowances is continuing to accumulate.
In spite of the economic storm of 2008‐2009, RGGI allowances sold at auction in a
narrow band between $3.38 and $3.07 during Auctions 1‐4 in the middle range of pre‐
Figure 7: Estimate of Actual Emissions vs. RGGI budget
25
program estimates. By the time of the Auction 5 (Sept. 9, 2009) prices for current control period allowances settled to a point just above $2.00.
2.3 A Measure of ‘Closeness’ between Auctions and Futures Prices
Since we cannot directly observe ‘market price’, then any estimate of this value will be made with some error. In this case, we are interested in the differences observed between the futures price and auction measures of market price. Our object is to identify a standard of closeness that gives a reasonable level of confidence that futures prices and auctions are indeed measuring the same thing: market price. But the measure of closeness should also accommodate the considerable variation in price signals that is common to most commodity markets. We need to construct a measure of the expected variability in the allowance futures price and then compare the difference between the futures price and the auction price at the time of the auction to see whether that difference is reasonably within the expected range of variation.
Volatility is a commonly used measure of the variability in the price of assets traded on markets. Volatility is simply the standard deviation in the price of an asset expressed as a percentage of the asset price. This measure is particularly useful in the context of the CMRP since RGGI rules express the CMRP as a 20% discount from the measure of the current market price. If we can conclude that the auction price is sufficiently unlikely to be as much as 20% below the estimate of current market price, then we would expect that the reserve price will be unlikely to be binding purely as a result of the random differences between the current measure of market price and auction closing prices.
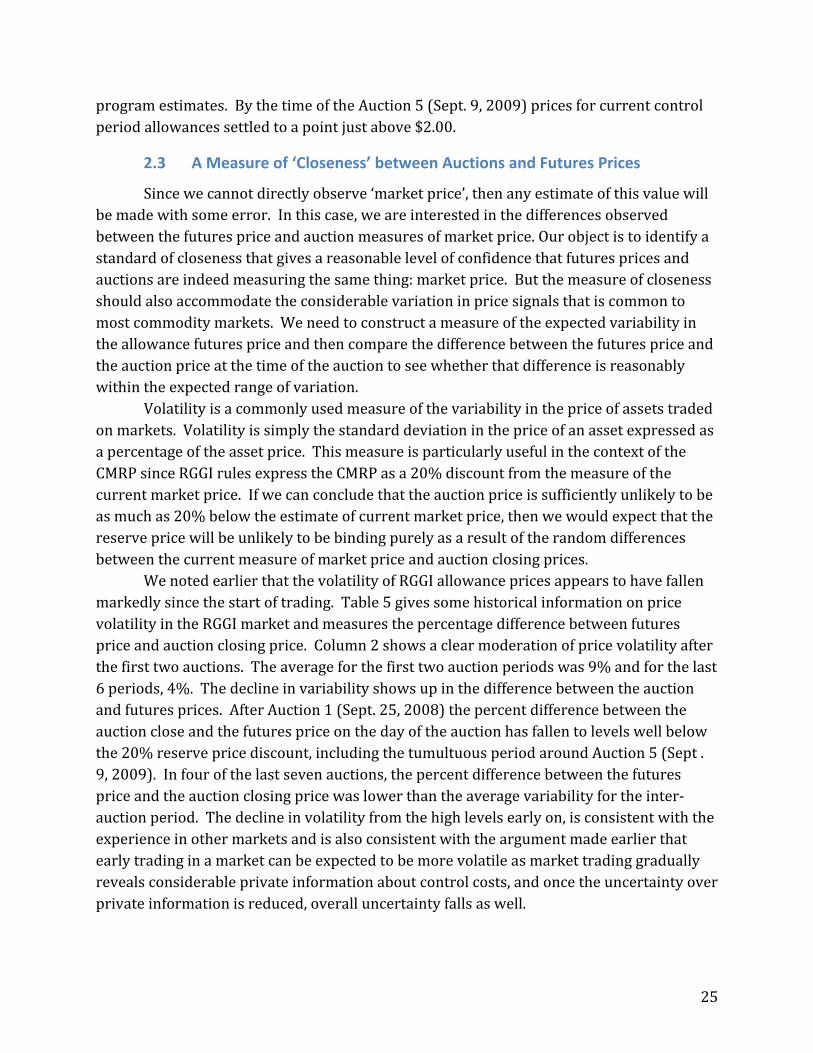
We noted earlier that the volatility of RGGI allowance prices appears to have fallen markedly since the start of trading. Table 5 gives some historical information on price volatility in the RGGI market and measures the percentage difference between futures price and auction closing price. Column 2 shows a clear moderation of price volatility after the first two auctions. The average for the first two auction periods was 9% and for the last 6 periods, 4%. The decline in variability shows up in the difference between the auction and futures prices. After Auction 1 (Sept. 25, 2008) the percent difference between the auction close and the futures price on the day of the auction has fallen to levels well below the 20% reserve price discount, including the tumultuous period around Auction 5 (Sept . 9, 2009). In four of the last seven auctions, the percent difference between the futures price and the auction closing price was lower than the average variability for the inter‐auction period. The decline in volatility from the high levels early on, is consistent with the experience in other markets and is also consistent with the argument made earlier that early trading in a market can be expected to be more volatile as market trading gradually reveals considerable private information about control costs, and once the uncertainty over private information is reduced, overall uncertainty falls as well.
26
Table 5: Futures price volatility in periods prior to Auctions 1-8 & Dispersion with Auction Prices
Auction Period
Average Volatility (%)
Auction close ($)
Futures price ($)
Pct. price difference: auction day (%)
1 9.11 3.07 3.84 -20.05 2 8.94 3.38 3.24 4.32 3 4.73 3.51 3.59 -2.23 4 3.02 3.23 3.41 -5.28 5 6.39 2.19 2.55 -14.12 6 5.19 2.05 2.04 0.49 7 3.27 2.07 2.08 -0.48 8 2.23 1.88 2.03 -7.39
The decline in futures price volatility from 9% to 2% and the decline in the difference between auction closing prices and the same‐day futures price from an average of 12% in the first 2 auctions to an average of 5% in the last 6 both signal that the allowance market has effectively eliminated much of the technological uncertainty at the opening of the market. The remaining uncertainty, and hence price volatility, arises more from uncertainty over future values of externl economic factors, a feature common to all commodity markets. Especially since the volatility levels are well below levels that would cause reserve prices to bind under normal conditions, we conclude that the market for RGGI allowances is mature enough to provide the basis for setting a CMRP.
To summarize:
1) Volume and volatility in the secondary market: Even though the RGGI allowance market currently has a volume of trading and a level of open interest that are both low relative to the highly active period of 2009, the active trading that did occur was sufficient to allow the market to reduce initial levels of market uncertainty. The volume weighting mechanism built into the RGGI CMRP ensures that less weight is given to futures market prices during periods of low activity. Thus, the low current volume does not by itself prevent the use of the futures market in establishing a CMRP.
2) Closeness of futures and auction prices: The early volatility apparent in early RGGI allowance futures trading has fallen in a way that is consistent with early experience in other emission markets. The volatility of futures prices has fallen from 8.9% for the first three auctions to 2.8% for the last three. As a consequence, the expected difference between futures and auction prices has fallen to a level comfortably
27
within the CMRP 20% band. While the possibility remains that the remaining volatility could occasionally cause a binding reserve price, this risk is low enough to justify using a combination of prior auctions and futures prices to set a CMRP. There does not appear to be a compelling reason not to move to the use of a CMRP
that is calculated on the basis of activity in the RGGI allowance futures market and the RGGI allowance auctions.
3. Calculating Current Market Reserve Prices
If the market is operating with reasonable efficiency, then today’s price for an asset reflects the combined forecasting abilities and efforts of all interested parties. As a result, the best forecast of tomorrow’s value for a given commodity is simply today’s price. If this were not true, then there would be profitable trades left on the table. This is not to say that commodity prices do not follow patterns, only that today’s futures prices for future delivery of a given commodity will already reflect our best collective guess about that pattern. Any divergence of what is actually observed from that price expectation should be a random process with a zero expected error around the current market price.
Since there is reason to believe that, in active markets, the current price is a good estimate of the near‐term future price, and since we have identified both previous auctions and futures contract prices as appropriate measures of the true market price, then a strategy of using recent futures market and auction prices for setting the auction reserve immediately suggests itself.
3.1 CMRP Components and Methodologies
RGGI auctions: Up to the time of this report, RGGI allowance auction prices for current allowances have been relatively stable compared to variation in futures prices. This is especially true if the Auction 1 is not used due to its novelty and the disarray in the futures market and capital markets generally during the period leading up to the auction. Using the previous auction to predict the value of the subsequent auction has a mean absolute percent error (MAPE) of 12.4% for the last 7 auctions of current control period allowances.
The statistical error rate for future vintage allowances cannot be determined because the price of these allowances at auction is being determined by the reserve price of $1.86. It is not that the auction mechanism is any less robust. The perceived risk of holding future vintages is higher than for the current vintage, hence the market price of the future vintage fell to the fixed reserve price sooner than for the current vintage. It may also take longer to rise above the fixed reserve once demand for allowances strengthens.
28
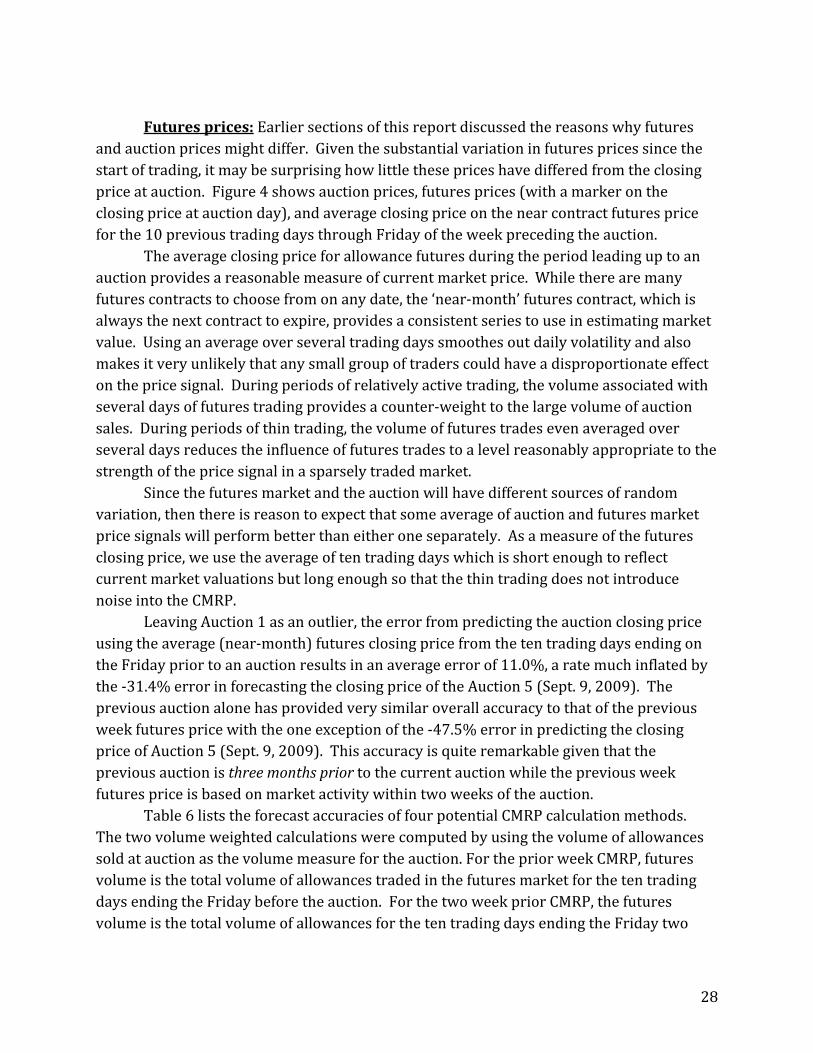
Futures prices: Earlier sections of this report discussed the reasons why futures and auction prices might differ. Given the substantial variation in futures prices since the start of trading, it may be surprising how little these prices have differed from the closing price at auction. Figure 4 shows auction prices, futures prices (with a marker on the closing price at auction day), and average closing price on the near contract futures price for the 10 previous trading days through Friday of the week preceding the auction.
The average closing price for allowance futures during the period leading up to an auction provides a reasonable measure of current market price. While there are many futures contracts to choose from on any date, the ‘near‐month’ futures contract, which is always the next contract to expire, provides a consistent series to use in estimating market value. Using an average over several trading days smoothes out daily volatility and also makes it very unlikely that any small group of traders could have a disproportionate effect on the price signal. During periods of relatively active trading, the volume associated with several days of futures trading provides a counter‐weight to the large volume of auction sales. During periods of thin trading, the volume of futures trades even averaged over several days reduces the influence of futures trades to a level reasonably appropriate to the strength of the price signal in a sparsely traded market.
Since the futures market and the auction will have different sources of random variation, then there is reason to expect that some average of auction and futures market price signals will perform better than either one separately. As a measure of the futures closing price, we use the average of ten trading days which is short enough to reflect current market valuations but long enough so that the thin trading does not introduce noise into the CMRP.
Leaving Auction 1 as an outlier, the error from predicting the auction closing price using the average (near‐month) futures closing price from the ten trading days ending on the Friday prior to an auction results in an average error of 11.0%, a rate much inflated by the ‐31.4% error in forecasting the closing price of the Auction 5 (Sept. 9, 2009). The previous auction alone has provided very similar overall accuracy to that of the previous week futures price with the one exception of the ‐47.5% error in predicting the closing price of Auction 5 (Sept. 9, 2009). This accuracy is quite remarkable given that the previous auction is three months prior to the current auction while the previous week futures price is based on market activity within two weeks of the auction.
Table 6 lists the forecast accuracies of four potential CMRP calculation methods. The two volume weighted calculations were computed by using the volume of allowances sold at auction as the volume measure for the auction. For the prior week CMRP, futures volume is the total volume of allowances traded in the futures market for the ten trading days ending the Friday before the auction. For the two week prior CMRP, the futures volume is the total volume of allowances for the ten trading days ending the Friday two
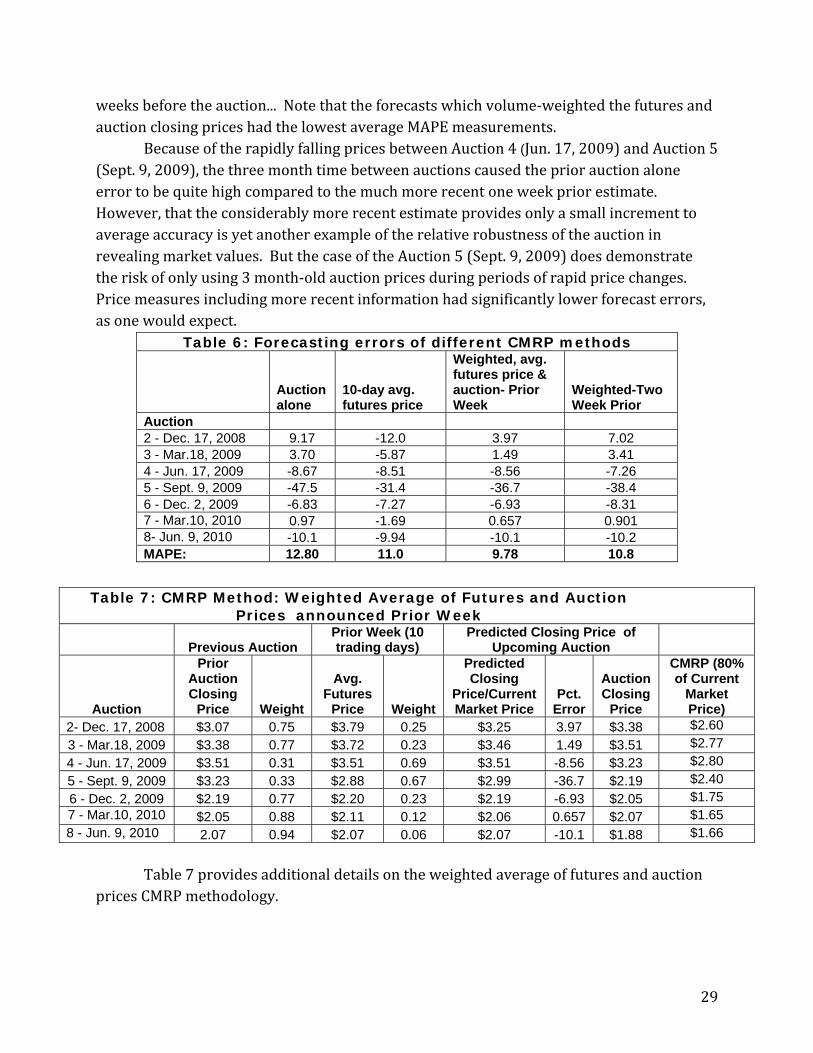
29
weeks before the auction... Note that the forecasts which volume‐weighted the futures and auction closing prices had the lowest average MAPE measurements.
Because of the rapidly falling prices between Auction 4 (Jun. 17, 2009) and Auction 5 (Sept. 9, 2009), the three month time between auctions caused the prior auction alone error to be quite high compared to the much more recent one week prior estimate. However, that the considerably more recent estimate provides only a small increment to average accuracy is yet another example of the relative robustness of the auction in revealing market values. But the case of the Auction 5 (Sept. 9, 2009) does demonstrate the risk of only using 3 month‐old auction prices during periods of rapid price changes. Price measures including more recent information had significantly lower forecast errors, as one would expect.
Table 6: Forecasting errors of different CMRP methods
Auction alone
10-day avg. futures price
Weighted, avg. futures price & auction- Prior Week
Weighted-Two Week Prior
Auction 2 - Dec. 17, 2008 9.17 -12.0 3.97 7.02 3 - Mar.18, 2009 3.70 -5.87 1.49 3.41 4 - Jun. 17, 2009 -8.67 -8.51 -8.56 -7.26 5 - Sept. 9, 2009 -47.5 -31.4 -36.7 -38.4 6 - Dec. 2, 2009 -6.83 -7.27 -6.93 -8.31 7 - Mar.10, 2010 0.97 -1.69 0.657 0.901 8- Jun. 9, 2010 -10.1 -9.94 -10.1 -10.2 MAPE: 12.80 11.0 9.78 10.8
Table 7 provides additional details on the weighted average of futures and auction
prices CMRP methodology.
Table 7: CMRP Method: Weighted Average of Futures and Auction Prices announced Prior Week
Previous Auction Prior Week (10 trading days)
Predicted Closing Price of Upcoming Auction
Auction
Prior Auction Closing
Price Weight
Avg. Futures
Price Weight
Predicted Closing
Price/Current Market Price
Pct. Error
Auction Closing
Price
CMRP (80% of Current
Market Price)
2- Dec. 17, 2008 $3.07 0.75 $3.79 0.25 $3.25 3.97 $3.38 $2.60
3 - Mar.18, 2009 $3.38 0.77 $3.72 0.23 $3.46 1.49 $3.51 $2.77
4 - Jun. 17, 2009 $3.51 0.31 $3.51 0.69 $3.51 -8.56 $3.23 $2.80
5 - Sept. 9, 2009 $3.23 0.33 $2.88 0.67 $2.99 -36.7 $2.19 $2.40
6 - Dec. 2, 2009 $2.19 0.77 $2.20 0.23 $2.19 -6.93 $2.05 $1.75 7 - Mar.10, 2010 $2.05 0.88 $2.11 0.12 $2.06 0.657 $2.07 $1.65 8 - Jun. 9, 2010 2.07 0.94 $2.07 0.06 $2.07 -10.1 $1.88 $1.66
30
3.2 Transition to a CMRP
As demonstrated above there is a significant benefit to blending price information from the futures market and auctions once the early, technical uncertainty has been resolved and once the differences between futures and auction prices are close enough to avoid frequent binding reserves have been met. Since the the prior auction is a relatively good predictor of the closing price of the subsequent auction, and since the volume weighting requirement ensures that the futures market will only receive significant weight when volume is robust, then there appears to be little risk to moving ahead with a volume weighted CMRP.
The prior auction has been a relatively good predictor of the closing price of the subsequent auction since the earliest days of the RGGI program, however the auction alone presents some additional risk of a binding reserve when market prices make significant downward adjustments. One other concern over an auctions only strategy regards the levels of participation in the auction. If participation falls to sufficiently low levels there could be concerns about the competitiveness of bidding. Up to this point, the RGGI market monitor has not raised any concerns over the competitiveness of bidding. In the short run, however, the generally low level of participation in the futures market are echoed in the lower levels of over‐subscription int the auctions. Robust levels of participation generally result in greater competitiveness, which in turn supports more reliable price discovery. We know that at the time of the prior auction, the auction closing price appears to be a better long‐run predictor of future prices than the day‐of‐auction closing price on futures contracts. By the weeks just prior to the auction, an active futures market provides important additional information about market values. The volume‐weighting of the futures and auction closing price signals has much to recommend it in reducing the error in forecasting the closing price of the next auction, but the benefits of this blending will only be fully realized as trading volume returns to the futures exchanges.
The setting of the CMRP should generally not have a significant effect on auction outcomes. If the auction is competitive, then only a large downward shift in expectations about the future value of RGGI allowances can cause a CMRP to bind. Should such an event occur sometime in the future, then some allowances may go unsold. However, without a market‐based reserve price, the RGGI auctions will not have the advantage of a credible limitation on the benefits of collusive behavior by a group of bidders. There is much to gain in moving to a CMRP, and there would appear to be little risk that establishing a CMRP will harm the performance of RGGI auctions.
3.3 A One‐time Transition
A clear advantage of using volume weighting is that, once the decision is made to transition to a CMRP, the decision need not be revisited as long as the auctions have sufficient participation to be judged as competitive by the RGGI market monitor. The
31
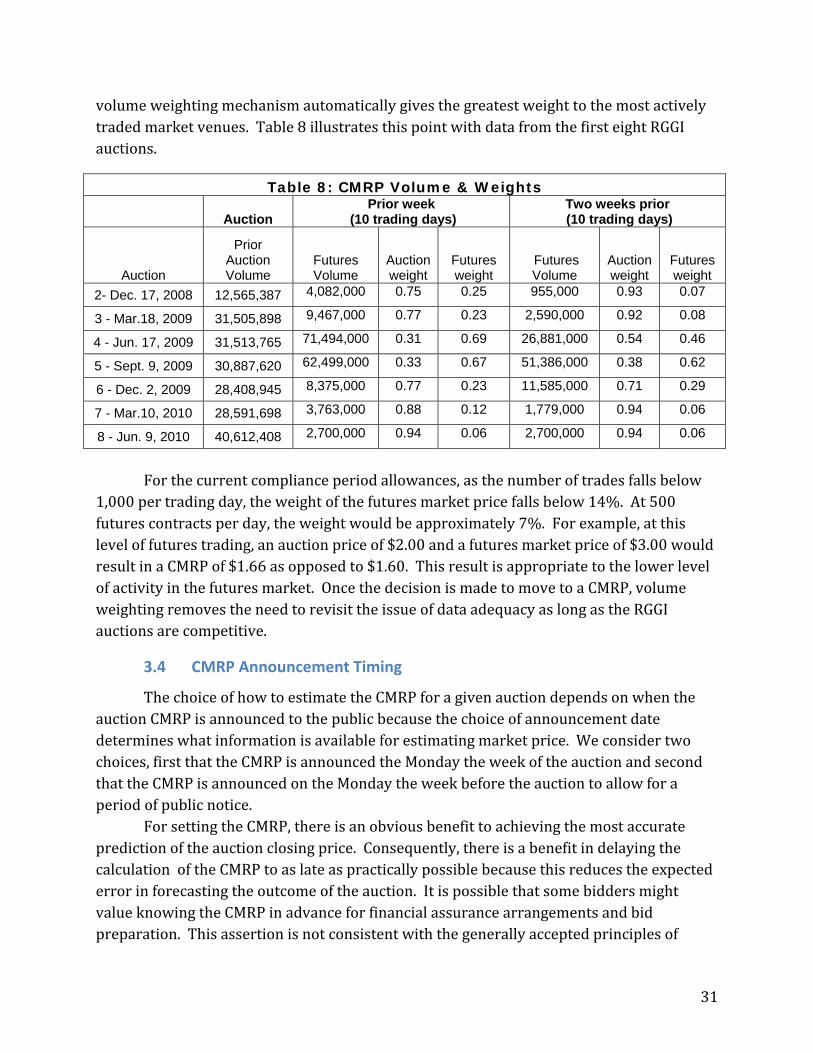
volume weighting mechanism automatically gives the greatest weight to the most actively traded market venues. Table 8 illustrates this point with data from the first eight RGGI auctions.
For the current compliance period allowances, as the number of trades falls below
1,000 per trading day, the weight of the futures market price falls below 14%. At 500 futures contracts per day, the weight would be approximately 7%. For example, at this level of futures trading, an auction price of $2.00 and a futures market price of $3.00 would result in a CMRP of $1.66 as opposed to $1.60. This result is appropriate to the lower level of activity in the futures market. Once the decision is made to move to a CMRP, volume weighting removes the need to revisit the issue of data adequacy as long as the RGGI auctions are competitive.
3.4 CMRP Announcement Timing
The choice of how to estimate the CMRP for a given auction depends on when the auction CMRP is announced to the public because the choice of announcement date determines what information is available for estimating market price. We consider two choices, first that the CMRP is announced the Monday the week of the auction and second that the CMRP is announced on the Monday the week before the auction to allow for a period of public notice.
For setting the CMRP, there is an obvious benefit to achieving the most accurate prediction of the auction closing price. Consequently, there is a benefit in delaying the calculation of the CMRP to as late as practically possible because this reduces the expected error in forecasting the outcome of the auction. It is possible that some bidders might value knowing the CMRP in advance for financial assurance arrangements and bid preparation. This assertion is not consistent with the generally accepted principles of
Table 8: CMRP Volume & Weights
Auction Prior week
(10 trading days) Two weeks prior (10 trading days)
Auction
Prior Auction Volume
Futures Volume
Auction weight
Futures weight
Futures Volume
Auction weight
Futures weight
2- Dec. 17, 2008 12,565,387 4,082,000 0.75 0.25 955,000 0.93 0.07
3 - Mar.18, 2009 31,505,898 9,467,000 0.77 0.23 2,590,000 0.92 0.08
4 - Jun. 17, 2009 31,513,765 71,494,000 0.31 0.69 26,881,000 0.54 0.46
5 - Sept. 9, 2009 30,887,620 62,499,000 0.33 0.67 51,386,000 0.38 0.62
6 - Dec. 2, 2009 28,408,945 8,375,000 0.77 0.23 11,585,000 0.71 0.29
7 - Mar.10, 2010 28,591,698 3,763,000 0.88 0.12 1,779,000 0.94 0.06
8 - Jun. 9, 2010 40,612,408 2,700,000 0.94 0.06 2,700,000 0.94 0.06
32
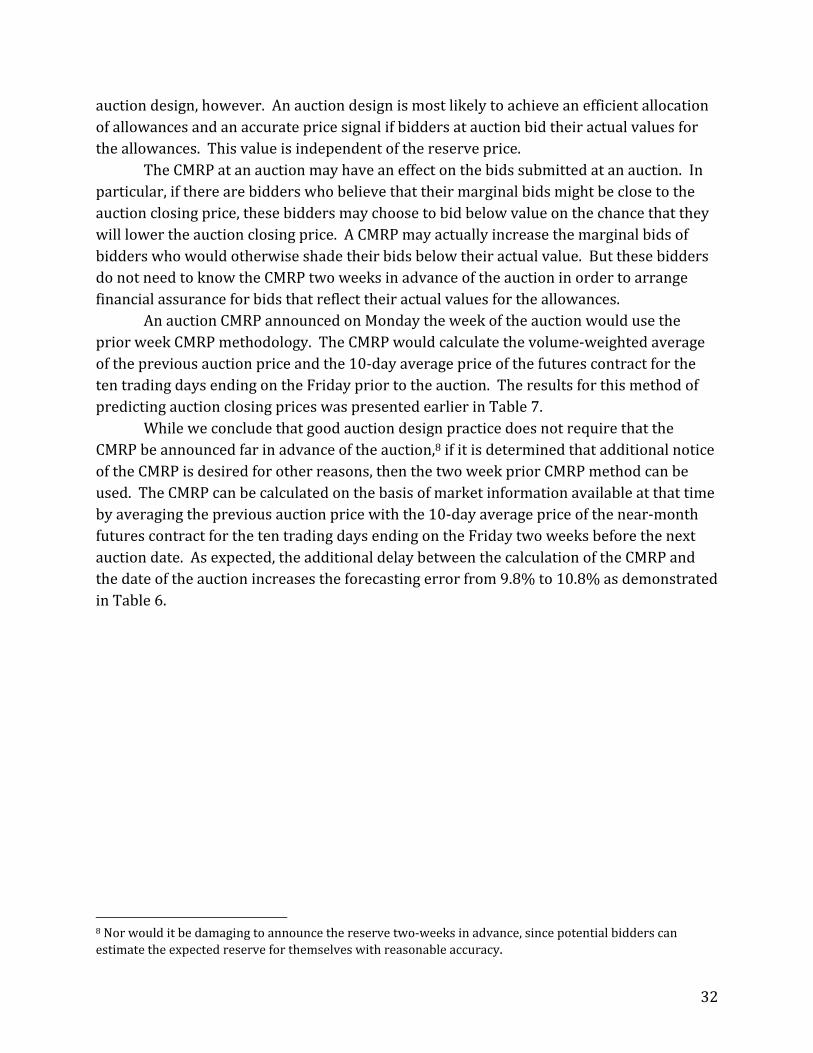
auction design, however. An auction design is most likely to achieve an efficient allocation of allowances and an accurate price signal if bidders at auction bid their actual values for the allowances. This value is independent of the reserve price.
The CMRP at an auction may have an effect on the bids submitted at an auction. In particular, if there are bidders who believe that their marginal bids might be close to the auction closing price, these bidders may choose to bid below value on the chance that they will lower the auction closing price. A CMRP may actually increase the marginal bids of bidders who would otherwise shade their bids below their actual value. But these bidders do not need to know the CMRP two weeks in advance of the auction in order to arrange financial assurance for bids that reflect their actual values for the allowances.
An auction CMRP announced on Monday the week of the auction would use the prior week CMRP methodology. The CMRP would calculate the volume‐weighted average of the previous auction price and the 10‐day average price of the futures contract for the ten trading days ending on the Friday prior to the auction. The results for this method of predicting auction closing prices was presented earlier in Table 7.
While we conclude that good auction design practice does not require that the CMRP be announced far in advance of the auction,8 if it is determined that additional notice of the CMRP is desired for other reasons, then the two week prior CMRP method can be used. The CMRP can be calculated on the basis of market information available at that time by averaging the previous auction price with the 10‐day average price of the near‐month futures contract for the ten trading days ending on the Friday two weeks before the next auction date. As expected, the additional delay between the calculation of the CMRP and the date of the auction increases the forecasting error from 9.8% to 10.8% as demonstrated in Table 6.
8 Nor would it be damaging to announce the reserve two‐weeks in advance, since potential bidders can estimate the expected reserve for themselves with reasonable accuracy.
33
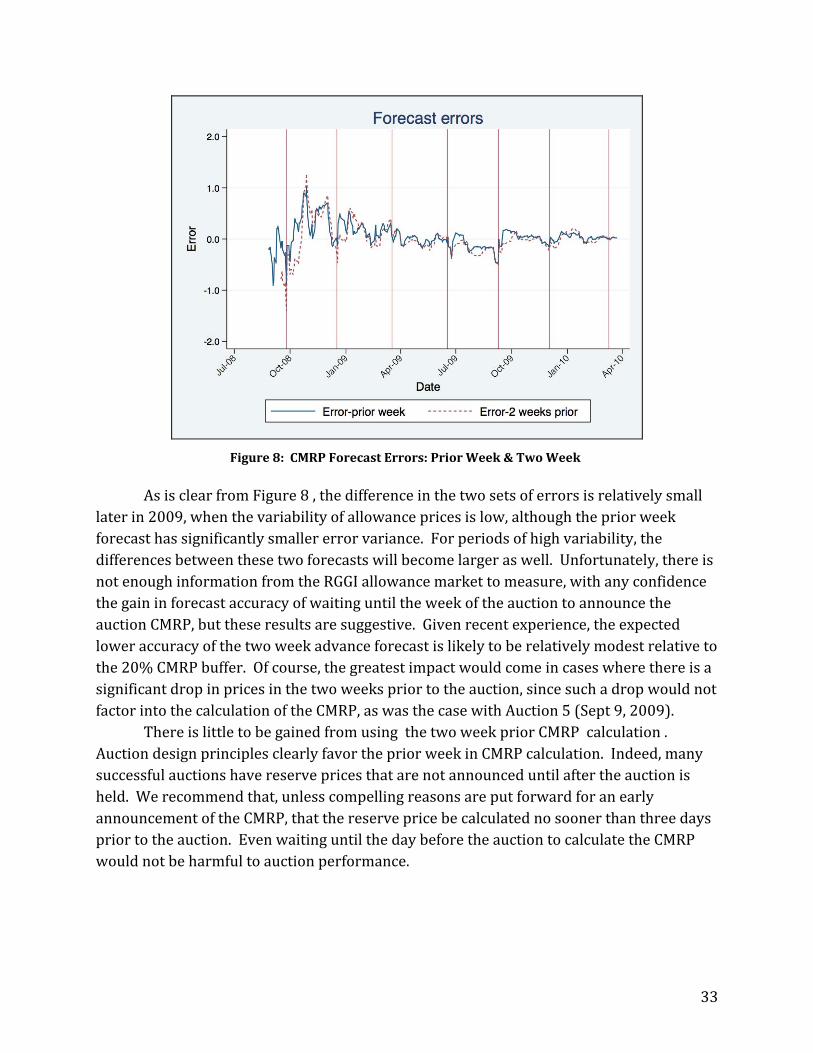
As is clear from Figure 8 , the difference in the two sets of errors is relatively small
later in 2009, when the variability of allowance prices is low, although the prior week forecast has significantly smaller error variance. For periods of high variability, the differences between these two forecasts will become larger as well. Unfortunately, there is not enough information from the RGGI allowance market to measure, with any confidence the gain in forecast accuracy of waiting until the week of the auction to announce the auction CMRP, but these results are suggestive. Given recent experience, the expected lower accuracy of the two week advance forecast is likely to be relatively modest relative to the 20% CMRP buffer. Of course, the greatest impact would come in cases where there is a significant drop in prices in the two weeks prior to the auction, since such a drop would not factor into the calculation of the CMRP, as was the case with Auction 5 (Sept 9, 2009).
There is little to be gained from using the two week prior CMRP calculation . Auction design principles clearly favor the prior week in CMRP calculation. Indeed, many successful auctions have reserve prices that are not announced until after the auction is held. We recommend that, unless compelling reasons are put forward for an early announcement of the CMRP, that the reserve price be calculated no sooner than three days prior to the auction. Even waiting until the day before the auction to calculate the CMRP would not be harmful to auction performance.
Figure 8: CMRP Forecast Errors: Prior Week & Two Week
34
3.5 Applying the CMRP Methodology
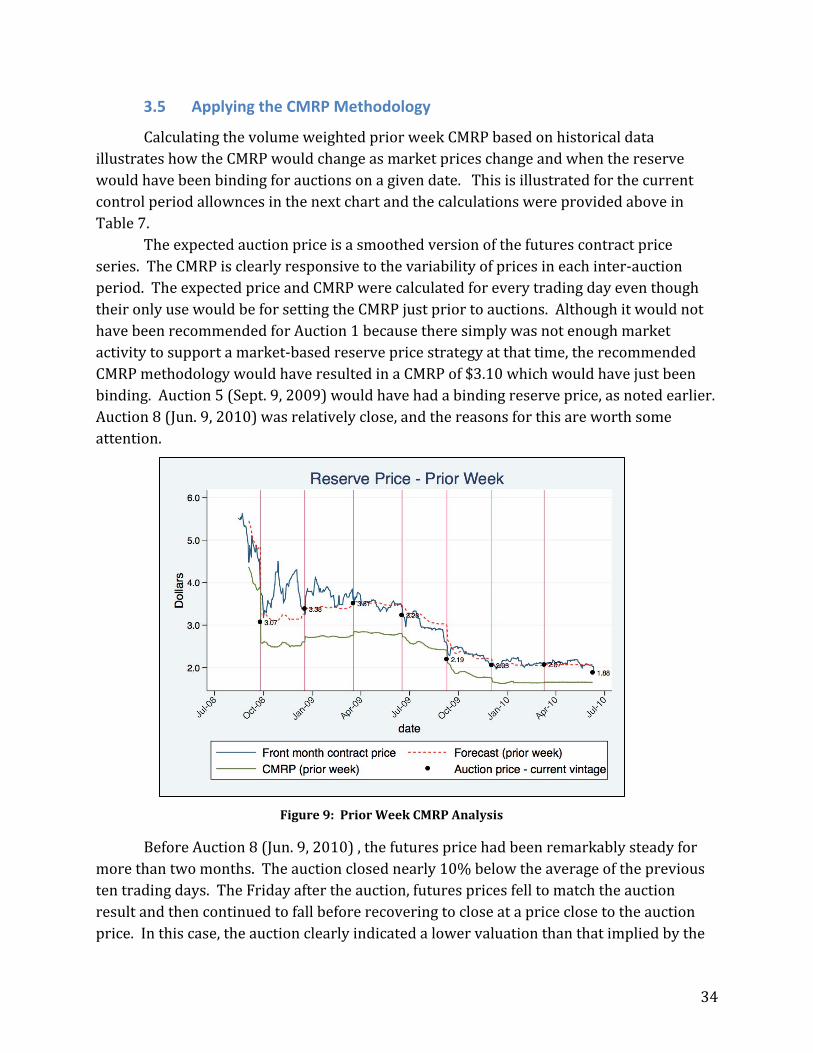
Calculating the volume weighted prior week CMRP based on historical data illustrates how the CMRP would change as market prices change and when the reserve would have been binding for auctions on a given date. This is illustrated for the current control period allownces in the next chart and the calculations were provided above in Table 7.
The expected auction price is a smoothed version of the futures contract price series. The CMRP is clearly responsive to the variability of prices in each inter‐auction period. The expected price and CMRP were calculated for every trading day even though their only use would be for setting the CMRP just prior to auctions. Although it would not have been recommended for Auction 1 because there simply was not enough market activity to support a market‐based reserve price strategy at that time, the recommended CMRP methodology would have resulted in a CMRP of $3.10 which would have just been binding. Auction 5 (Sept. 9, 2009) would have had a binding reserve price, as noted earlier. Auction 8 (Jun. 9, 2010) was relatively close, and the reasons for this are worth some attention.
Before Auction 8 (Jun. 9, 2010) , the futures price had been remarkably steady for
more than two months. The auction closed nearly 10% below the average of the previous ten trading days. The Friday after the auction, futures prices fell to match the auction result and then continued to fall before recovering to close at a price close to the auction price. In this case, the auction clearly indicated a lower valuation than that implied by the
Figure 9: Prior Week CMRP Analysis
35
futures market and the futures prices followed suit. It is apparent from Figure 9 that the 20% discount from the forecast closing price calculated the prior week to the auction give an ample margin to avoid binding reserves that are due primarily to random market fluctuations. These results generally hold for the two week prior forecast as well, although the variability of the forecast error is slightly larger than for the prior week forecast.
4. Conclusions
This report finds that there are two candidate measures of the current market price for RGGI allowances: prior auction closing prices and average allowance futures prices (from the ten trading days ending the Friday before the auction or the ten trading days ending the Friday two weeks before the auction). After analyzing the variability of allowance prices and the dispersion between auction and futures prices, this report finds that there is sufficient market data to justify using a CMRP based on a volume‐weighted combination of prior auction and recent futures prices. The high price volatility evident in early allowance trading has moderated, although allowances have continued to follow a clear downward trend as the inventory of surplus unused allowances has risen. In addition to the lower price variability, there has also been a degree of convergence between the auction closing prices and the contemporaneous futures price indicating an improved consensus among traders about the costs of compliance. Four possible CMRP calculation methods were considered: auction alone, prior ten‐day average futures price alone, a volume‐weighted combination of the prior auction and average futures price, and finally a volume‐weighted combination of the prior auction and ten‐day average futures price from the week ending two weeks prior to the auction. The volume‐weighted combination of the prior auction and the one week prior average futures price provides the best balance of accuracy and responsiveness to market conditions. While, neither auction theory nor financial assurance considerations require that the CMRP be announced on the Monday the week before the auction rather than the Monday the week of the auction, the two week prior CMPR method would be a satisfactory alternative should the decision be made that additional notice of the reserve price is needed.
36
5. References Ausubel, L., & Crampton, P. (1998). Demand Reduction and Inefficiency in Multi‐unit
Auctions. Ausubel, L. M., & Crampton, P. (2004). Vickrey auctions with reserve pricing. Economic
Theory, 23(3), 493‐505. Binmore, K., & Klemperer, P. (2002). The Biggest Auction Ever: The Sale of the British 3G
Telecom Licences. The Economic Journal, 112, C74‐C76. Holt, C., Shobe, W., Burtraw, D., Palmer, K., & Goeree, J. K. (2007). Auction Design for Selling
CO2 Emission Allowances under the Regional Greenhouse Gas Initiative, RGGI Reports. Albany: New York State Energy Research and Development Authority.
Levin, D., & Smith, J. L. (1996). Optimal reservation prices in auctions. Economic Journal, 106(438), 1271‐1283.
McMillan, J. (1994). Selling Spectrum Rights. Journal of Economic Perspectives, 8(3), 145‐162.