Embed Size (px)
Citation preview

Federal Energy Regulatory Commission, Washington DC, June 25 2013
Price Responsive Demand for Operating Reserves in Co-Optimized Electricity Markets with Wind Power
Zhi Zhou, Audun Botterud Decision and Information Sciences Division Argonne National Laboratory [email protected], [email protected]

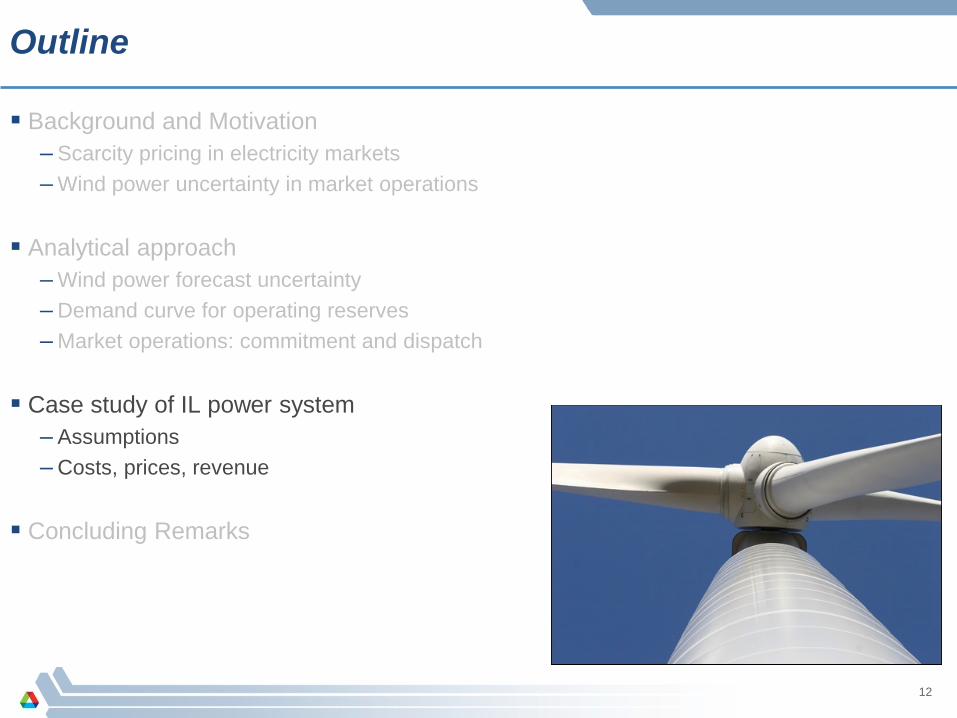
Outline
Background and Motivation – Scarcity pricing in electricity markets – Wind power uncertainty in market operations
Analytical approach
– Wind power forecast uncertainty – Demand curve for operating reserves – Market operations: commitment and dispatch
Case study of IL power system
– Assumptions – Costs, prices, revenue
Concluding Remarks
2

Prices and Investments in the Electricity Market
3
Price, P
Quantity, QQ1
P1
P2
Q2
Demand1 Demand2
Supply1+2
Highest bidScarcity rent
1 - base load 2 - peak load
In a perfect market: Scarcity rent covers investment
costs for the optimal mix of new generation Investments should come in
time to meet demand
Potential problems for adequate generation investments: Limited demand response, price caps and poor scarcity pricing (“missing money”),
high investment risks difficult to hedge, market power
How does a large-scale wind power expansion influence investments? - Resource variability and ramping, forecast uncertainty, low marginal costs
Source: Botterud 2003

Electricity Prices in MISO node 2006 and 2012
Historical day-ahead prices for ALTW.FOXLK1 node in Lakefield, MN
4
Price 2006 2012 Average [$/MWh] 46.1 21.3
Rel. St.Dev. [%] 64.0 92.3
Wind power increases the need for adequate scarcity pricing

Handling Uncertainties in System/Market Operation
A demand curve for operating reserves can address forecast uncertainty in short-term operations and improved scarcity pricing for long-term resource adequacy
Source of uncertainty
Operating Reserve
Δ Load
Δ Generating capacity
Operating Reserves (spin and non-spin)
Δ Wind Power
?? ??
[MW]
5
Wind power forecasting
Increase operating reserves?
Change reserve procurement method?
Stochastic unit commitment?

Outline
Background and Motivation – Scarcity pricing in electricity markets – Wind power uncertainty in market operations
Analytical approach
– Wind power forecast uncertainty – Demand curve for operating reserves – Market operations: commitment and dispatch
Case study of IL power system
– Assumptions – Costs, prices, revenue
Concluding Remarks
6

Probabilistic Forecasting - Kernel Density Estimation
Conditional wind power probabilistic forecasting Kernel density estimation (KDE)
– Advantages • Forecasts the full probability density function • Nonparametric
– Example
7
( ) ( )( )tktX
tktktXPtktktP xf
xpfxXpf
|
|,|
,|
+
++++ ==
Joint or multivariate density function of p and x
Marginal density of x

Probabilistic Forecasting - Quantile-Copula Estimator
8
Copula Definition multivariate distribution function separated in: •marginal functions •dependency structure between the marginals modeled by a copula
copula density function
KDE ESTIMATOR
Ui=FXe(Xi) and Vi=FY
e(Yi)
KDE ESTIMATOR
empirical cum. dist.
8 [Bessa et al. 2012]

Demand Curve for Operating Reserves – Overview
Basic idea – Consider the uncertainties from load and supply (thermal and wind) – Estimate the risk of supply shortage for system – Link the expected cost of this risk to the price to pay for reserves (Hogan, 2005)
Uncertainty sources: – Wind power: probabilistic forecast – Load: forecasting error – Thermal units: forced outage rates
9

From Generation Margin to Demand Curve
10
Generation Margin Distribution
Stepwise Operating Reserve Demand Curve
LOLP: Loss of load probability VOLL: Value of loss load
Price(reserve) = LOLP(reserve,gen.margin) * VOLL

Simulating Electricity Market Operations
11
DA: Day-ahead RAC: Reliability Assessment Commitment RT: Real Time UC: Unit Commitment ED: Economic Dispatch
Outline
Background and Motivation – Scarcity pricing in electricity markets – Wind power uncertainty in market operations
Analytical approach
– Wind power forecast uncertainty – Demand curve for operating reserves – Market operations: commitment and dispatch
Case study of IL power system
– Assumptions – Costs, prices, revenue
Concluding Remarks
12

Case Study Assumptions
210 thermal units: 41,380 MW – Base, intermediate, peak units
Peak load: 37,419 MW
– 2006 load series from Illinois Wind power: 14,000 MW
– 2006 wind series from 15 sites in Illinois (NREL EWITS dataset)
– 20% of load Simulation periods
(1) High load period (July); (2) Low load period (Oct)
Curtailment assumptions Value of Lost Load: $3500/MWh Value of operating reserve shortfall: $1100/MWh
13
0
5000
10000
15000
20000
25000
30000
35000
40000
111
122
133
144
155
166
177
188
199
111
0112
1113
2114
3115
4116
5117
6118
7119
8120
9122
0123
1124
2125
3126
4127
5128
61
Loa
d/W
ind
Pow
er (M
W)
Hour
Wind and Load in July-October 2006
Load
Wind
4.78%
20.60%
19.71%
30.95%
Generation Capacity
Combine Cycle Turbine
Gas Turbine
Nuclear
Steam Turbine

Demand for Operating Reserves is Dynamic
Demand curve examples – Hourly demand curves for the sum of spinning and non-spinning reserves – Contributions to reserve demand for two selected hours:
14
0
500
1000
1500
2000
2500
0 1000 2000 3000 4000 5000Pr
ices (
$/M
W)
Demand (MW)
High Load and Low Wind Power Uncertainty
Thermal+Load+Wind
Thermal+Load
Thermal
0
500
1000
1500
2000
2500
0 1000 2000 3000 4000 5000
Price
s ($/
MW
)
Demand (MW)
Low Load and High Wind Power Uncertainty
Thermal+Load+Wind
Thermal+Load
Thermal

Average OR Demand in July
Total demand for reserves is higher in DA than in RAC and RT.
15

Simulated Cases
Case Description Wind power forecast
Operating reserves
Generator contingency
Load forecast error
Wind forecast error
PF Perfect forecast Perfect 1146 MW No No
FR Fixed reserve 50 % quantile 1146 MW No Avg. 50-1 quant.
DR Dynamic reserve 50 % quantile 1146 MW No 50-1 quant.
DC Demand curve 50 % quantile Joint demand curve
16
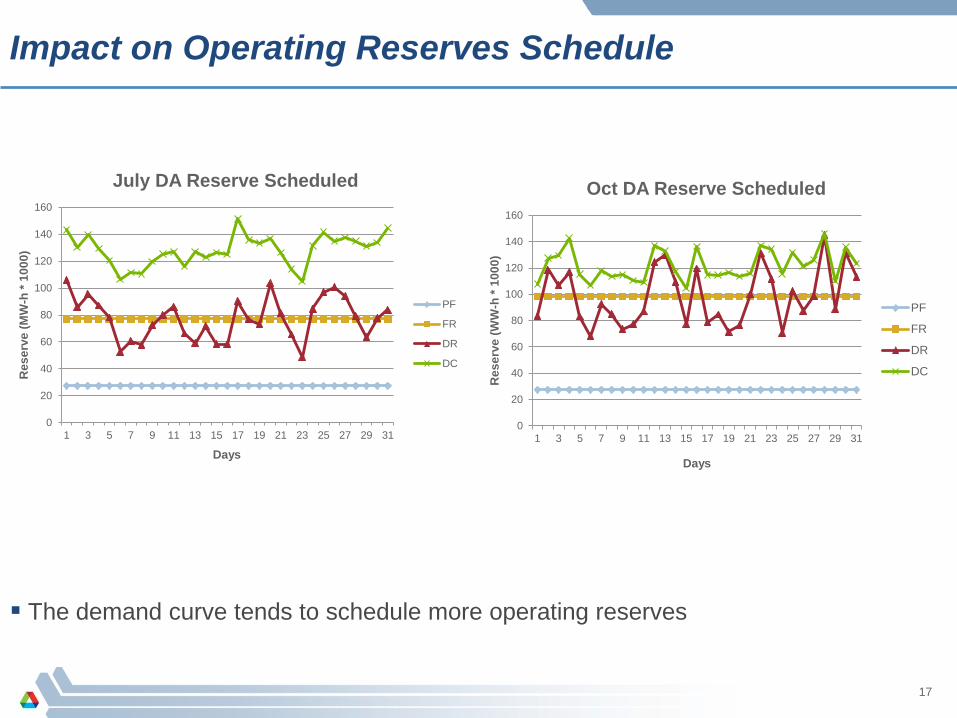
Impact on Operating Reserves Schedule
17
0
20
40
60
80
100
120
140
160
1 3 5 7 9 11 13 15 17 19 21 23 25 27 29 31
Res
erve
(MW
-h *
1000
)
Days
July DA Reserve Scheduled
PF
FR
DR
DC
0
20
40
60
80
100
120
140
160
1 3 5 7 9 11 13 15 17 19 21 23 25 27 29 31
Res
erve
(WW
-h *
1000
)
Days
Oct DA Reserve Scheduled
PF
FR
DR
DC
The demand curve tends to schedule more operating reserves
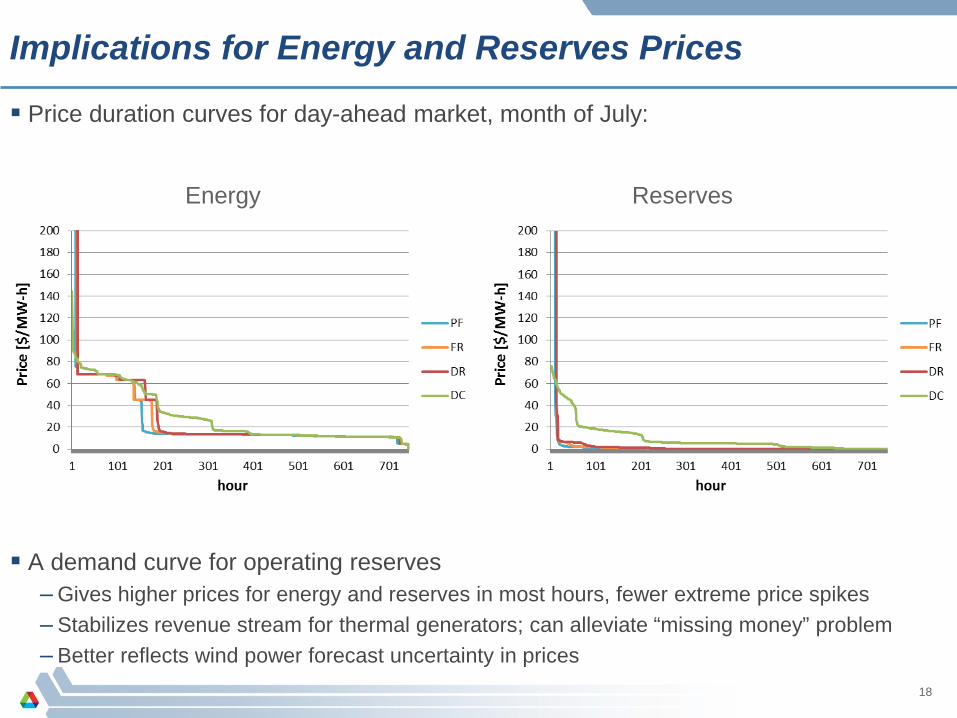
Implications for Energy and Reserves Prices
Price duration curves for day-ahead market, month of July: A demand curve for operating reserves
– Gives higher prices for energy and reserves in most hours, fewer extreme price spikes – Stabilizes revenue stream for thermal generators; can alleviate “missing money” problem – Better reflects wind power forecast uncertainty in prices
18
Energy Reserves

Average Daily Operating Reserves Prices
19
0
20
40
60
80
100
120
140
160
180
1 3 5 7 9 11 13 15 17 19 21 23 25 27 29 31
Pric
es ($
/MW
h)
Days
July DA Average Daily Energy Prices
PF
FR
DR
DC
0
20
40
60
80
100
120
140
160
1 3 5 7 9 11 13 15 17 19 21 23 25 27 29 31
Pric
es ($
/MW
-h)
Days
July DA Average Daily Reserve Prices
PF
FR
DR
DC
0
10
20
30
40
50
60
70
1 3 5 7 9 11 13 15 17 19 21 23 25 27 29 31
Pric
es ($
/MW
h)
Days
Oct DA Average Daily Energy Prices
PF
FR
DR
DC
0
10
20
30
40
50
60
1 3 5 7 9 11 13 15 17 19 21 23 25 27 29 31
Pric
es ($
/MW
-h)
Days
Oct DA Daily Average Reserve Prices
PF
FR
DR
DC

Impact on Operating Reserve Revenue
20
0
1
2
3
4
5
6
1 3 5 7 9 11 13 15 17 19 21 23 25 27 29 31
Res
erve
Rev
enue
(M$)
Days
July DA Daily Total Reserve Revenue
PF
FR
DR
DC
0
0.5
1
1.5
2
2.5
3
3.5
4
4.5
5
1 3 5 7 9 11 13 15 17 19 21 23 25 27 29 31
Res
erve
Rev
enue
(M$)
Days
Oct DA Daily Total Reserve Revenue
PF
FR
DR
DC
A demand curve for operating reserves stabilizes the revenue stream

Overview of Total Operating Cost
High load period (July) Low load period (October)
21
RT-Cost (M$) PF FR DR DC
Total 198.74 212.91 209.02 215.07
Fuel 189.39 202.08 199.58 207.03
Startup 9.33 9.67 8.93 8.04
Curtailment 0.02 1.16 0.51 NA
RT-Cost (M$) PF FR DR DC
Total 96.46 117.68 115.71 110.67
Fuel 89.63 106.31 107.93 102.30
Startup 6.83 8.57 7.58 8.37
Curtailment 0.00 2.80 0.20 NA
Outline
Background and Motivation – Scarcity pricing in electricity markets – Wind power uncertainty in market operations
Analytical approach
– Wind power forecast uncertainty – Demand curve for operating reserves – Market operations: commitment and dispatch
Case study of IL power system
– Assumptions – Costs, prices, revenue
Concluding Remarks
22

Conclusion and Future Work
A demand curve for operating reserves – Provides prices that better reflect the marginal reliability of the system as a function of the
reserve level, accounting for multiple uncertainties (load, outages, wind). – Contributes towards more efficient market operations through improved price signals for short-
term operation and maintenance, and long-term system expansion. – Is a solution that is compatible with current market designs. – Tends to schedule more reserves than price-inelastic reserve requirements in case study.
Future work – Introduce transmission network / locational operating reserve demand curves. – Reserve provision from wind power and demand. – Supply curves from ancillary service providers.
23

References and Acknowledgements
References for more information
– Zhou Z., Botterud A., “Price Responsive Demand for Operating Reserves and Energy in Electricity Markets with Wind Power,” IEEE Power & Energy Society Annual Meeting, Vancouver, Canada, July 2013.
– Zhou Z., Botterud A., Wang J., Bessa R.J., Keko H., Sumaili J., Miranda V., “Application of Probabilistic Wind Power Forecasting in Electricity Markets,” Wind Energy, Vol. 16, No. 3, pp.321-338, 2013.
– Bessa R.J., Miranda V., Botterud A., Zhou Z., Wang J., “Time-Adaptive Quantile-Copula for Wind Power Probabilistic Forecasting,” Renewable Energy, Vol. 40, No. 1, pp. 29-39, 2012.
Acknowledgements – INESC Porto for collaboration on probabilistic wind power forecasting. – DOE’s wind program for sponsoring this research.
24
Project website: http://www.dis.anl.gov/projects/windpowerforecasting.html

Federal Energy Regulatory Commission, Washington DC, June 25 2013
Price Responsive Demand for Operating Reserves in Co-Optimized Electricity Markets with Wind Power
Zhi Zhou, Audun Botterud Decision and Information Sciences Division Argonne National Laboratory [email protected], [email protected]