Embed Size (px)
Citation preview
Price forecast September 30, 2018 Resource Evaluation & Advisory

This page has been intentionally left blank
22
3
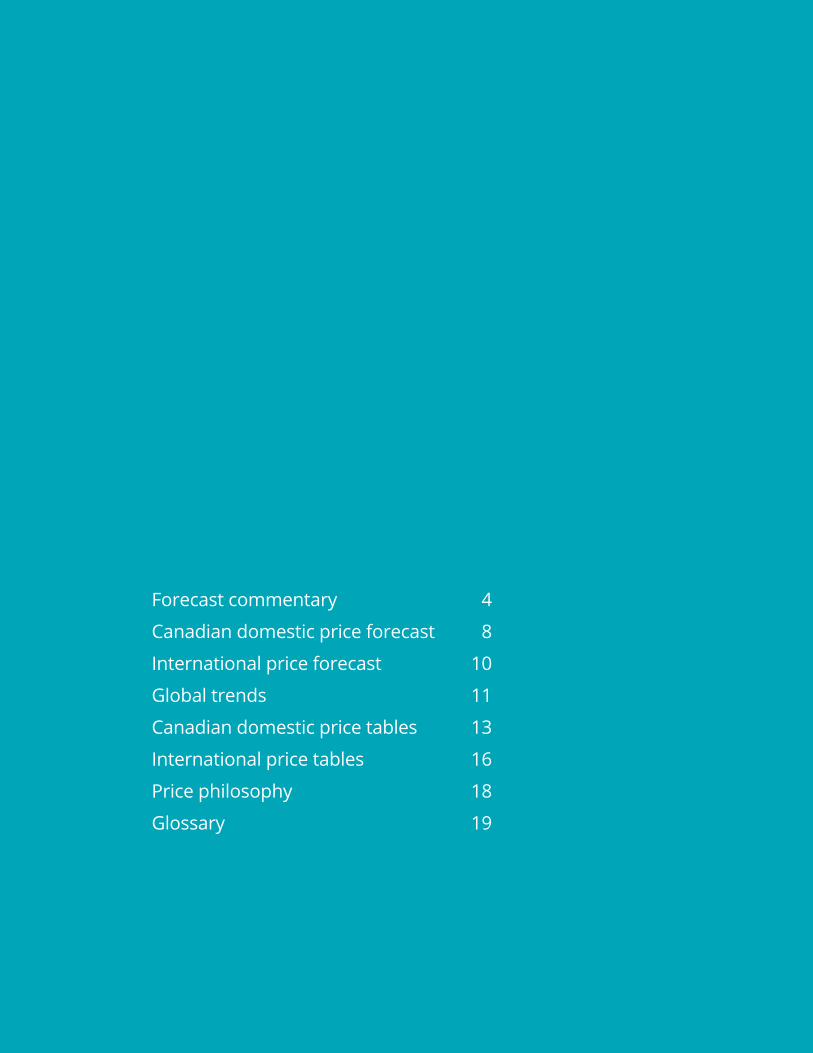
Forecast commentary 4
Canadian domestic price forecast 8
International price forecast 10
Global trends 11
Canadian domestic price tables 13
International price tables 16
Price philosophy 18
Glossary 19
Forecast commentary
Global oil supply and production disruptions have been a source of some volatility this past quarter. WTI and Brent prices have increased as global crude oil supply and inventories in the United States have decreased. Venezuela continues to reduce oil production, hitting historically low rates due to economic and political instability, and Iranian oil exports have declined as refiners around the globe struggle to find alternative crude sources ahead of the imposition of US sanctions in early November. Months of underproduction by Venezuela and other participating countries have pushed OPEC oil output to much lower than its targeted cut in production. As a result, OPEC and non-OPEC members are in the midst of determining modified country production volumes to try to increase rates and return to 100 percent compliance. The discussions should help determine which members will step in to produce increased volumes to help alleviate current global supply shortages.
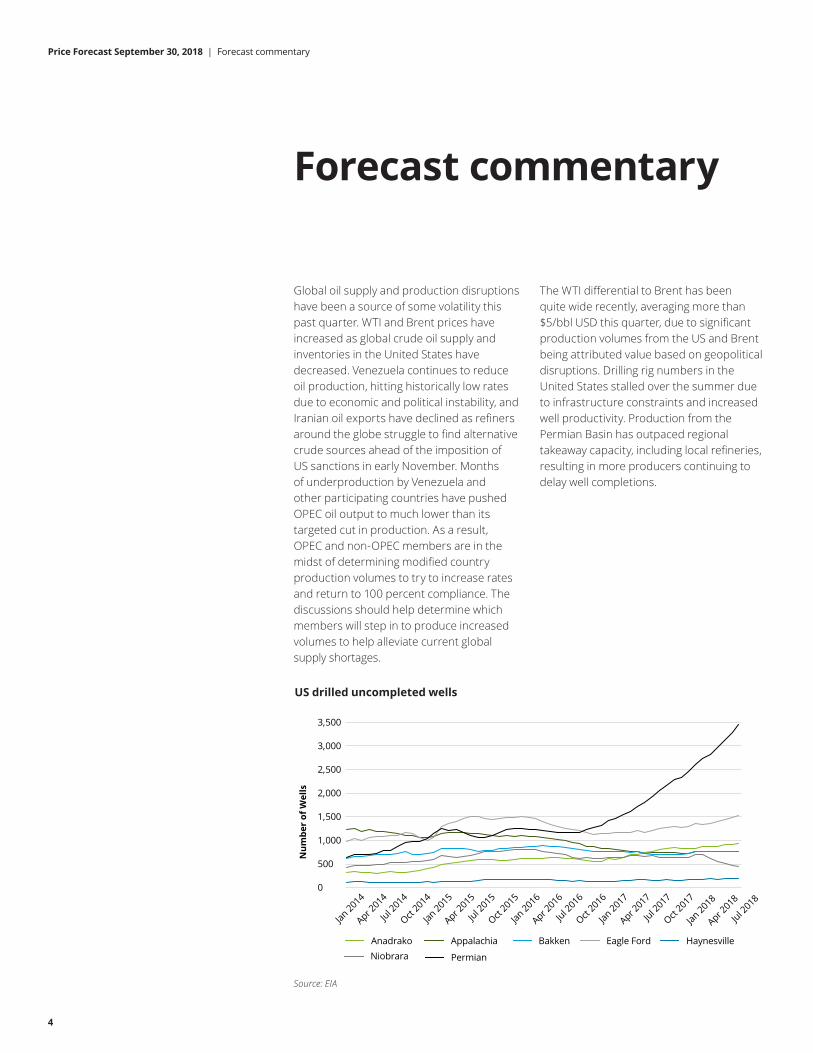
The WTI differential to Brent has been quite wide recently, averaging more than $5/bbl USD this quarter, due to significant production volumes from the US and Brent being attributed value based on geopolitical disruptions. Drilling rig numbers in the United States stalled over the summer due to infrastructure constraints and increased well productivity. Production from the Permian Basin has outpaced regional takeaway capacity, including local refineries, resulting in more producers continuing to delay well completions.
US drilled uncompleted wells
Source: EIA
4
0
500
1,000
1,500
2,000
2,500
3,000
3,500
Jan 2014
Apr 2014
Jul 2014
Oct 2014
Jan 2015
Apr 2015
Jul 2015
Oct 2015
Jan 2016
Apr 2016
Jul 2016
Oct 2016
Jan 2017
Apr 2017
Jul 2017
Oct 2017
Jan 2018
Apr 2018
Jul 2018
Num
ber
of W
ells
AnadrakoNiobrara
Appalachia Bakken Eagle Ford Haynesville
Permian
Price Forecast September 30, 2018 | Forecast commentary
5
Price Forecast September 30, 2018 | Forecast commentary
In addition, increased domestic crude oil demand, primarily for gasoline, is forecast as the US economy continues to grow. Decreased tight oil production from the slowed activity and increased domestic demand should aid WTI prices and allow for recovery to average historical differentials nearer $2/bbl USD.
North of the border, Canadian crude discounts also widened over the summer as limited transportation options continued to restrict the export of crude oil to the United States. With the addition of new Greenfield oil sands projects coming on-stream in September and multiple producers achieving nameplate capacities at existing sites, Canadian crude supply volumes increased over the period, with volumes forecast to increase by an additional 265,000 bbl/d for the remainder of 2018. Canadian crude production recently surpassed pipeline capacity, but despite rail shipments increasing to record levels, rail shipment capacities remain insufficient to fully alleviate transportation bottlenecks and clear the glut of oil in Western Canada.
Canadian heavy crude prices are likely to face further pressure as a large number of US refineries are scheduled to undergo maintenance over the next six months, leading to offline periods where a portion of Canadian heavy crude will have nowhere to go. In September, the WCS differential to WTI widened to a five-year high, primarily due to increased inventory levels. Canadian light crude prices have also taken a hit over the summer as Edmonton light differentials swelled to over $20/bbl CAD. The extreme differentials and lack of major projects on the horizon indicate that market optimism for Canadian crude has declined over the past few months as infrastructure projects continue to remain
in limbo and transportation capacity issues remain unsolved.
Natural gas prices have been steady at Henry Hub over the last few months, but AECO has continued to show remarkable volatility with a very large differential to Henry Hub. With a final investment decision on the LNG Canada project now made, Deloitte has performed a preliminary supply study to estimate the long-term effects the planned facility may have on the AECO gas price. We reviewed the current production, land base, and drilling potential of the five members of the LNG Canada project to estimate the capacity of the facility the participating members can fill. This included an estimate of the remaining inventory on each partner’s land base and, using average production profiles in the area, an estimate of future production that could be achieved from each partner’s future drilling and existing wells.
Based on this analysis, we expect that the partners in LNG Canada will, on aggregate, be able to fill a two-train facility for more than 20 years solely with their existing production and future drilling. The partners’ combined production is already approximately 1.6 Bcf/d, which is more than 85 percent of the expected capacity of a two-train facility. It is likely each partner will ramp up activity to fill the facility in its first year of operation. Volumes will likely not be required from other producers to fill the facility unless LNG Canada decides to expand the facility to three or four trains (which would be well beyond the current 2022 timeline) or if a significant amount of its partners’ existing production is allocated to take or pay commitments.
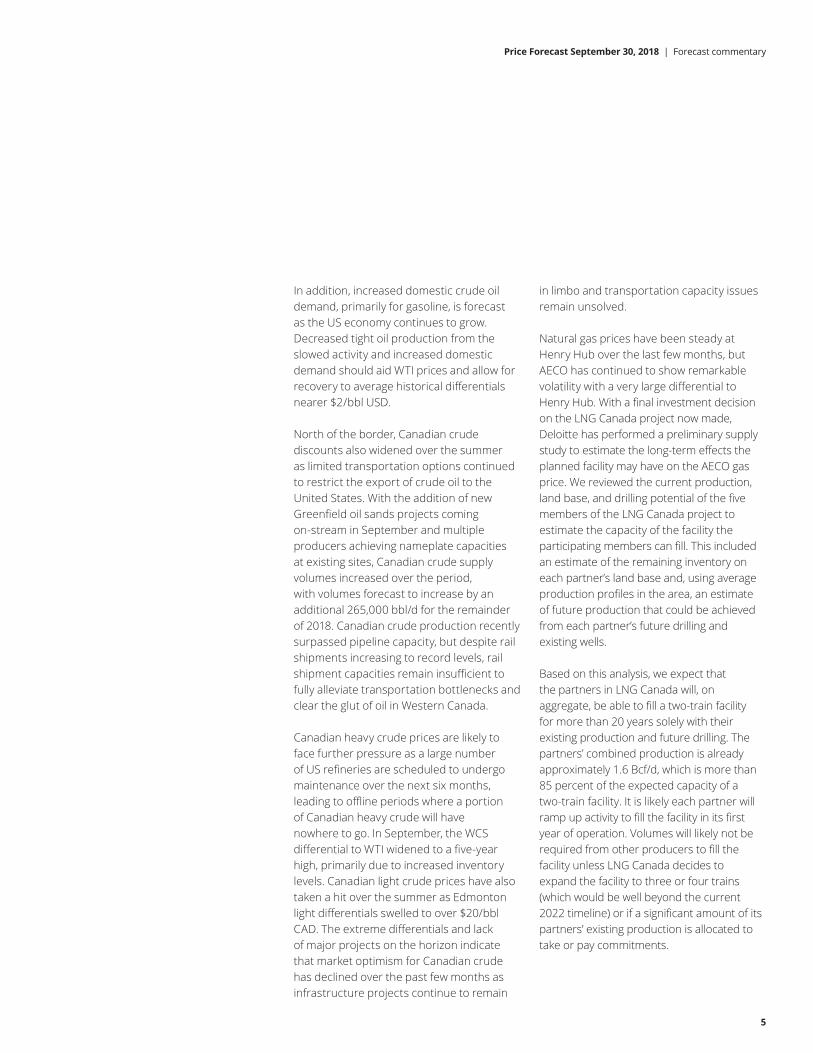
Forecast natural gas production
Source: public data, NEB
The production volumes needed for the two-train facility will require production from BC to increase by approximately 30 percent above the NEB’s production forecast given current drilling rates. While this is a significant increase, Deloitte’s analysis suggests that the partners in LNG Canada can generate this additional production within their existing land base. As a result, we do not expect a two-train facility to put significant upward pressure on gas prices in Alberta and BC, as the majority of the volumes will be filled with drilling that is contingent on the facility being built. While demand for natural gas will grow due to the
LNG export capacity, we expect supply will grow by approximately the same amount. As a result, we do not expect any positive buoy to the basin’s prices unless LNG Canada expands to three or four trains or additional LNG facilities are approved. We are in an oversupply market right now, and this first major LNG project will only temper that oversupply. While many gas producers in Canada look to LNG to provide a reprieve for the sector, our analysis indicates it is more likely that this significant LNG facility will only reap benefits to the key partners involved.
6
0
2,000
4,000
8,000
10,000
12,000
14,000
2005 2010 2015 2020 2025 2030 2035 2040
MM
cf/d
16,000
18,000
20,000
Alberta BC Two Train LNG
Price Forecast September 30, 2018 | Forecast commentary
This page has been intentionally left blank
7
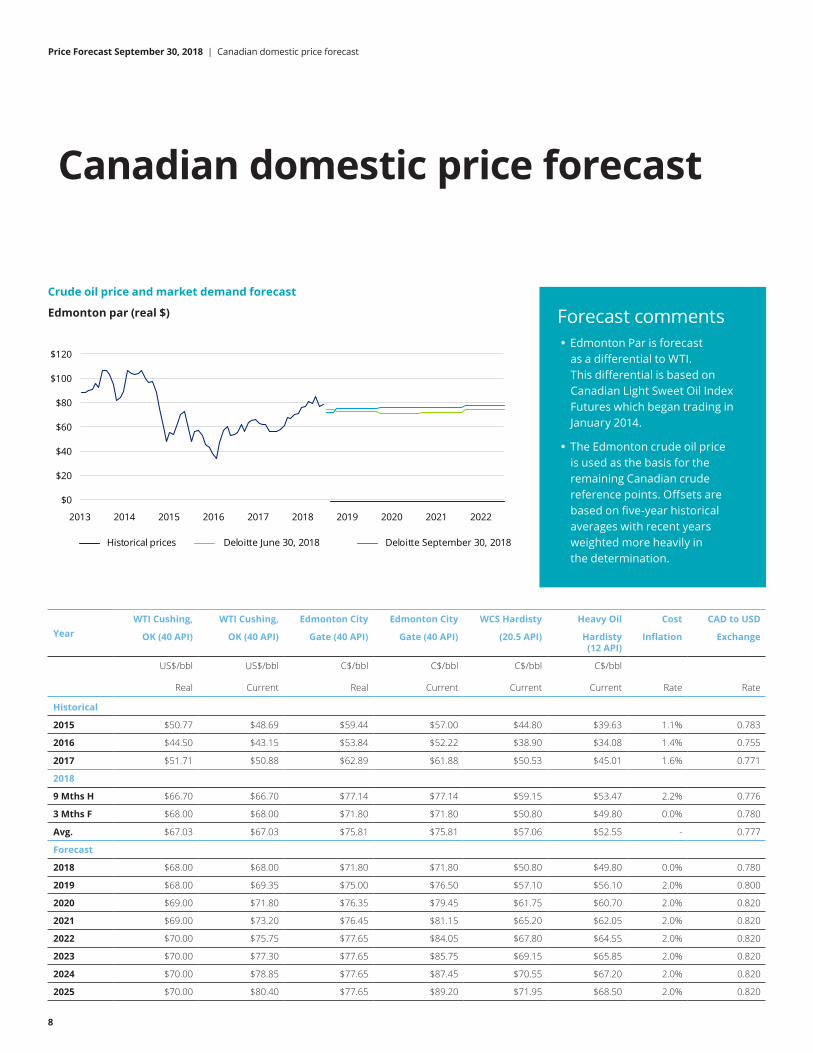
Canadian domestic price forecast
Crude oil price and market demand forecast
Forecast comments • Edmonton Par is forecast
as a differential to WTI.This differential is based onCanadian Light Sweet Oil IndexFutures which began trading inJanuary 2014.
• The Edmonton crude oil priceis used as the basis for theremaining Canadian crudereference points. Offsets arebased on five-year historicalaverages with recent yearsweighted more heavily inthe determination.
Year WTI Cushing,
OK (40 API)
WTI Cushing,
OK (40 API)
Edmonton City
Gate (40 API)
Edmonton City
Gate (40 API)
WCS Hardisty
(20.5 API)
Heavy Oil
Hardisty (12 API)
Cost
Inflation
CAD to USD
Exchange
US$/bbl
Real
US$/bbl
Current
C$/bbl
Real
C$/bbl
Current
C$/bbl
Current
C$/bbl
Current Rate Rate
Historical
2015 $50.77 $48.69 $59.44 $57.00 $44.80 $39.63 1.1% 0.783
2016 $44.50 $43.15 $53.84 $52.22 $38.90 $34.08 1.4% 0.755
2017 $51.71 $50.88 $62.89 $61.88 $50.53 $45.01 1.6% 0.771
2018
9 Mths H $66.70 $66.70 $77.14 $77.14 $59.15 $53.47 2.2% 0.776
3 Mths F $68.00 $68.00 $71.80 $71.80 $50.80 $49.80 0.0% 0.780
Avg. $67.03 $67.03 $75.81 $75.81 $57.06 $52.55 - 0.777
Forecast
2018 $68.00 $68.00 $71.80 $71.80 $50.80 $49.80 0.0% 0.780
2019 $68.00 $69.35 $75.00 $76.50 $57.10 $56.10 2.0% 0.800
2020 $69.00 $71.80 $76.35 $79.45 $61.75 $60.70 2.0% 0.820
2021 $69.00 $73.20 $76.45 $81.15 $65.20 $62.05 2.0% 0.820
2022 $70.00 $75.75 $77.65 $84.05 $67.80 $64.55 2.0% 0.820
2023 $70.00 $77.30 $77.65 $85.75 $69.15 $65.85 2.0% 0.820
2024 $70.00 $78.85 $77.65 $87.45 $70.55 $67.20 2.0% 0.820
2025 $70.00 $80.40 $77.65 $89.20 $71.95 $68.50 2.0% 0.820
8
Price Forecast September 30, 2018 | Canadian domestic price forecast
Edmonton par (real $)
$0
$20
$40
$60
$80
$100
$120
2013 2014 2015 2016 2017 2018 2019 2020 2021 2022
Historical prices Deloitte June 30, 2018 Deloitte September 30, 2018

Natural gas price and market demand forecast
Forecast comments The AECO natural gas price is forecast based on historical differentials to Henry Hub and future contracts traded on the NGX based in Calgary.
Year AB Ref.
Avg. Price
AB AECO
Avg. Price
AB AECO
Avg. Price
BC Direct
Station 2 Sales
NYMEX
Henry Hub
NYMEX
Henry Hub
C$/Mcf
Current
C$/Mcf
Real
C$/Mcf
Current
C$/Mcf
Current
US$/Mcf
Real
US$/Mcf
Current
Historical
2015 $2.56 $2.81 $2.69 $1.81 $2.74 $2.63
2016 $1.93 $2.23 $2.16 $1.75 $2.59 $2.52
2017 $2.13 $2.23 $2.19 $1.56 $3.03 $2.99
2018
9 Mths H $1.27 $1.50 $1.50 $1.42 $2.95 $2.95
3 Mths F $1.40 $1.60 $1.60 $1.30 $2.90 $2.90
Avg. $1.30 $1.52 $1.52 $1.39 $2.94 $2.94
Forecast
2018 $1.40 $1.60 $1.60 $1.30 $2.90 $2.90
2019 $1.60 $1.75 $1.80 $1.50 $2.90 $2.95
2020 $2.20 $2.30 $2.40 $2.10 $3.10 $3.25
2021 $2.55 $2.60 $2.75 $2.45 $3.30 $3.50
2022 $2.70 $2.70 $2.90 $2.60 $3.40 $3.70
2023 $3.00 $2.90 $3.20 $2.85 $3.55 $3.90
2024 $3.25 $3.10 $3.50 $3.15 $3.75 $4.20
2025 $3.55 $3.30 $3.80 $3.45 $3.90 $4.50
Price Forecast September 30, 2018 | Canadian domestic price forecast
9
•
AECO natural gas (real $)
$0
$1
$2
$3
$4
$5
$6
2013 2014 2015 2016 2017 2018 2019 2020 2021 2022
$7
$8
Historical prices Deloitte June 30, 2018 Deloitte September 30, 2018
10
Price Forecast September 30, 2018 | International price forecast
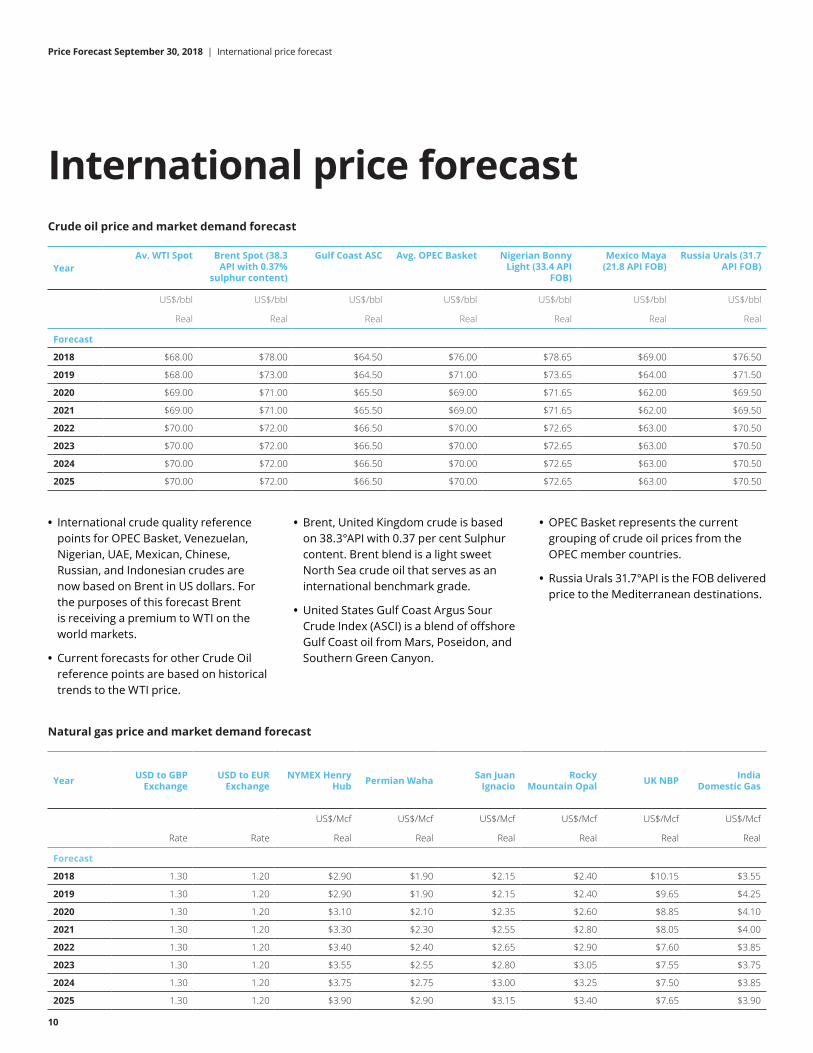
International price forecast Crude oil price and market demand forecast
Year Av. WTI Spot Brent Spot (38.3
API with 0.37% sulphur content)
Gulf Coast ASC Avg. OPEC Basket Nigerian Bonny Light (33.4 API
FOB)
Mexico Maya (21.8 API FOB)
Russia Urals (31.7 API FOB)
US$/bbl
Real
US$/bbl
Real
US$/bbl
Real
US$/bbl
Real
US$/bbl
Real
US$/bbl
Real
US$/bbl
Real
Forecast
2018 $68.00 $78.00 $64.50 $76.00 $78.65 $69.00 $76.50
2019 $68.00 $73.00 $64.50 $71.00 $73.65 $64.00 $71.50
2020 $69.00 $71.00 $65.50 $69.00 $71.65 $62.00 $69.50
2021 $69.00 $71.00 $65.50 $69.00 $71.65 $62.00 $69.50
2022 $70.00 $72.00 $66.50 $70.00 $72.65 $63.00 $70.50
2023 $70.00 $72.00 $66.50 $70.00 $72.65 $63.00 $70.50
2024 $70.00 $72.00 $66.50 $70.00 $72.65 $63.00 $70.50
2025 $70.00 $72.00 $66.50 $70.00 $72.65 $63.00 $70.50
• International crude quality reference points for OPEC Basket, Venezuelan, Nigerian, UAE, Mexican, Chinese, Russian, and Indonesian crudes are now based on Brent in US dollars. For the purposes of this forecast Brent is receiving a premium to WTI on the world markets.
• Current forecasts for other Crude Oil reference points are based on historical trends to the WTI price.
• Brent, United Kingdom crude is based on 38.3°API with 0.37 per cent Sulphur content. Brent blend is a light sweet North Sea crude oil that serves as an international benchmark grade.
• United States Gulf Coast Argus Sour Crude Index (ASCI) is a blend of offshore Gulf Coast oil from Mars, Poseidon, and Southern Green Canyon.
• OPEC Basket represents the current grouping of crude oil prices from the OPEC member countries.
• Russia Urals 31.7°API is the FOB delivered price to the Mediterranean destinations.
Natural gas price and market demand forecast
Year USD to GBP Exchange
USD to EUR Exchange
NYMEX Henry Hub Permian Waha San Juan
Ignacio Rocky
Mountain Opal UK NBP India Domestic Gas
Rate Rate
US$/Mcf
Real
US$/Mcf
Real
US$/Mcf
Real
US$/Mcf
Real
US$/Mcf
Real
US$/Mcf
Real
Forecast
2018 1.30 1.20 $2.90 $1.90 $2.15 $2.40 $10.15 $3.55
2019 1.30 1.20 $2.90 $1.90 $2.15 $2.40 $9.65 $4.25
2020 1.30 1.20 $3.10 $2.10 $2.35 $2.60 $8.85 $4.10
2021 1.30 1.20 $3.30 $2.30 $2.55 $2.80 $8.05 $4.00
2022 1.30 1.20 $3.40 $2.40 $2.65 $2.90 $7.60 $3.85
2023 1.30 1.20 $3.55 $2.55 $2.80 $3.05 $7.55 $3.75
2024 1.30 1.20 $3.75 $2.75 $3.00 $3.25 $7.50 $3.85
2025 1.30 1.20 $3.90 $2.90 $3.15 $3.40 $7.65 $3.90
11
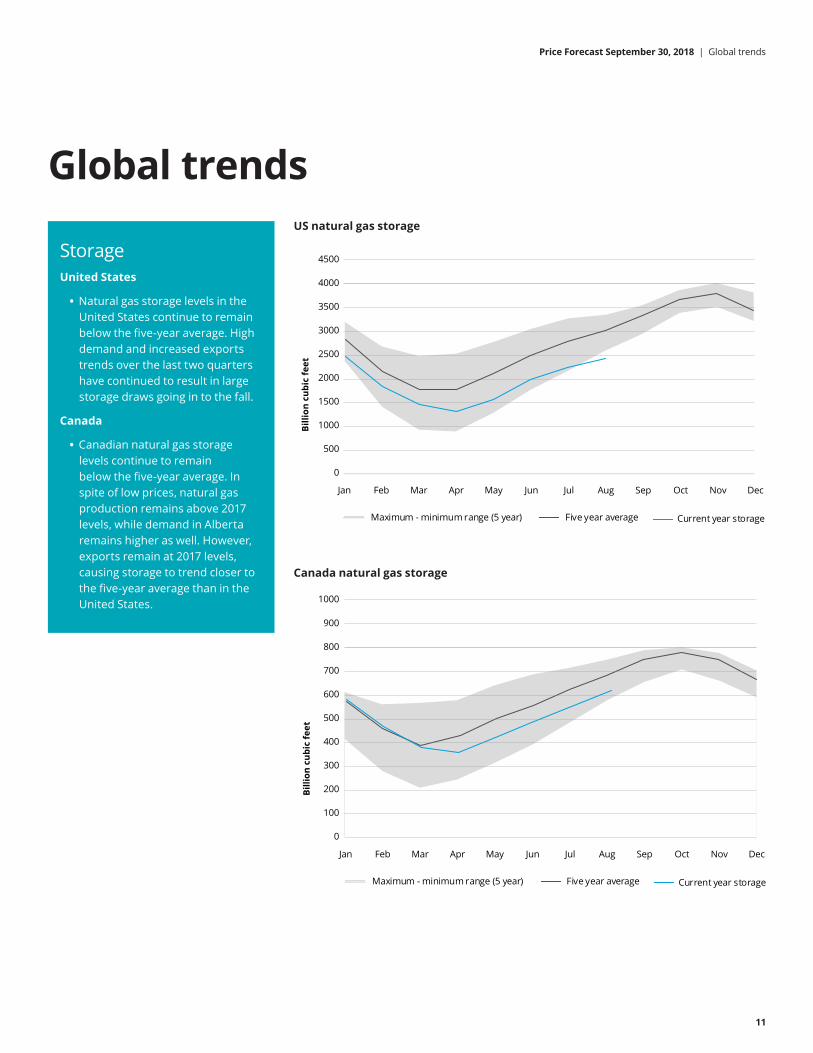
Global trends
Storage United States
Natural gas storage levels in the United States continue to remain below the five-year average. High demand and increased exports trends over the last two quarters have continued to result in large storage draws going in to the fall.
Canada
Canadian natural gas storage levels continue to remain below the five-year average. In spite of low prices, natural gas production remains above 2017 levels, while demand in Alberta remains higher as well. However, exports remain at 2017 levels, causing storage to trend closer to the five-year average than in the United States.
US natural gas storage
Canada natural gas storage
0
500
1000
1500
2000
2500
3000
Jan Feb Mar Apr May Jun Jul Aug Sep Oct Nov Dec
Billi
on c
ubic
feet
3500
4000
4500
Maximum - minimum range (5 year) Five year average Current year storage
0
100
200
300
400
500
600
Jan Feb Mar Apr May Jun Jul Aug Sep Oct Nov Dec
Billi
on c
ubic
feet
700
800
900
1000
Maximum - minimum range (5 year) Five year average Current year storage
•
•
Price Forecast September 30, 2018 | Global trends
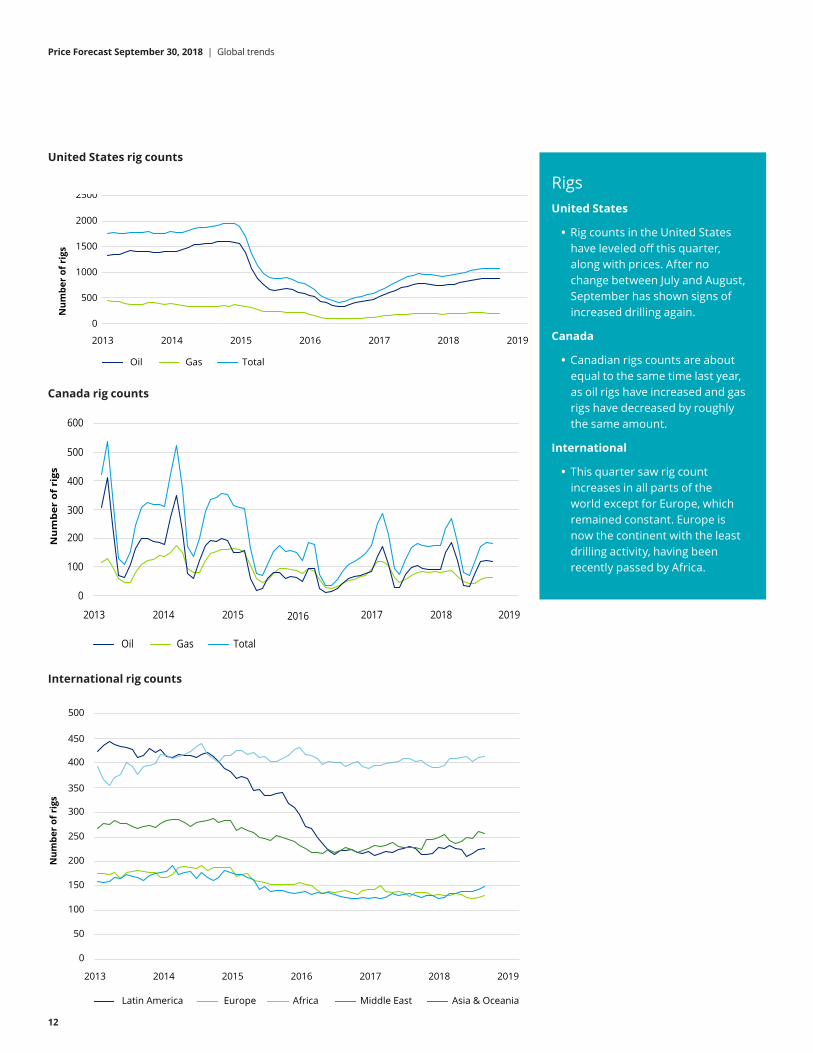
United States rig counts
Canada rig counts
International rig counts
Rigs United States
Rig counts in the United States have leveled off this quarter, along with prices. After no change between July and August, September has shown signs of increased drilling again.
Canada
Canadian rigs counts are about equal to the same time last year, as oil rigs have increased and gas rigs have decreased by roughly the same amount.
International
This quarter saw rig count increases in all parts of the world except for Europe, which remained constant. Europe is now the continent with the least drilling activity, having been recently passed by Africa.
12
•
•
•
0
500
1000
1500
2000
2500
20142013 2015 2016 2017 2018 2019
Num
ber
of r
igs
Oil Gas Total
0
100
200
300
400
500
600
2013 2014 2015 2016 2017 2018 2019
Nu
mb
er o
f ri
gs
Oil Gas Total
0
50
100
150
200
250
300
2013 2014 2015 2016 2017 2018 2019
Num
ber
of r
igs
350
400
450
500
Latin America Europe Africa Middle East Asia & Oceania
Price Forecast September 30, 2018 | Global trends
13
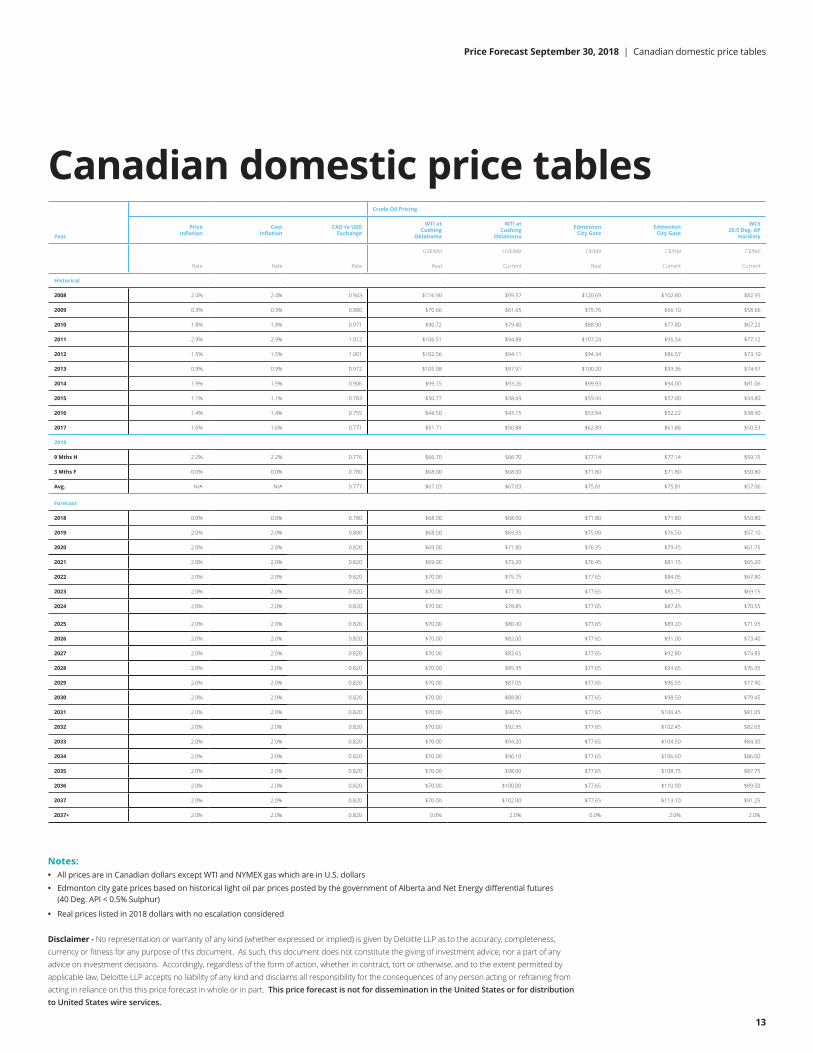
Price Forecast September 30, 2018 | Canadian domestic price tables
Canadian domestic price tables Year
Crude Oil Pricing
Price Inflation
Cost Inflation
CAD to USD Exchange
WTI at Cushing
Oklahoma
WTI at Cushing
Oklahoma
Edmonton City Gate
Edmonton City Gate
WCS 20.5 Deg. AP
Hardisty
Rate Rate Rate
US$/bbl
Real
US$/bbl
Current
C$/bbl
Real
C$/bbl
Current
C$/bbl
Current
Historical
2008 2.4% 2.4% 0.943 $116.90 $99.57 $120.69 $102.80 $82.95
2009 0.3% 0.3% 0.880 $70.66 $61.65 $75.76 $66.10 $58.66
2010 1.8% 1.8% 0.971 $90.72 $79.40 $88.90 $77.80 $67.22
2011 2.9% 2.9% 1.012 $106.51 $94.88 $107.24 $95.54 $77.12
2012 1.5% 1.5% 1.001 $102.56 $94.11 $94.34 $86.57 $73.10
2013 0.9% 0.9% 0.972 $105.08 $97.91 $100.20 $93.36 $74.97
2014 1.9% 1.9% 0.906 $99.15 $93.26 $99.93 $94.00 $81.06
2015 1.1% 1.1% 0.783 $50.77 $48.69 $59.44 $57.00 $44.80
2016 1.4% 1.4% 0.755 $44.50 $43.15 $53.84 $52.22 $38.90
2017 1.6% 1.6% 0.771 $51.71 $50.88 $62.89 $61.88 $50.53
2018
9 Mths H 2.2% 2.2% 0.776 $66.70 $66.70 $77.14 $77.14 $59.15
3 Mths F 0.0% 0.0% 0.780 $68.00 $68.00 $71.80 $71.80 $50.80
Avg. N/A N/A 0.777 $67.03 $67.03 $75.81 $75.81 $57.06
Forecast
2018 0.0% 0.0% 0.780 $68.00 $68.00 $71.80 $71.80 $50.80
2019 2.0% 2.0% 0.800 $68.00 $69.35 $75.00 $76.50 $57.10
2020 2.0% 2.0% 0.820 $69.00 $71.80 $76.35 $79.45 $61.75
2021 2.0% 2.0% 0.820 $69.00 $73.20 $76.45 $81.15 $65.20
2022 2.0% 2.0% 0.820 $70.00 $75.75 $77.65 $84.05 $67.80
2023 2.0% 2.0% 0.820 $70.00 $77.30 $77.65 $85.75 $69.15
2024 2.0% 2.0% 0.820 $70.00 $78.85 $77.65 $87.45 $70.55
2025 2.0% 2.0% 0.820 $70.00 $80.40 $77.65 $89.20 $71.95
2026 2.0% 2.0% 0.820 $70.00 $82.00 $77.65 $91.00 $73.40
2027 2.0% 2.0% 0.820 $70.00 $83.65 $77.65 $92.80 $74.85
2028 2.0% 2.0% 0.820 $70.00 $85.35 $77.65 $94.65 $76.35
2029 2.0% 2.0% 0.820 $70.00 $87.05 $77.65 $96.55 $77.90
2030 2.0% 2.0% 0.820 $70.00 $88.80 $77.65 $98.50 $79.45
2031 2.0% 2.0% 0.820 $70.00 $90.55 $77.65 $100.45 $81.05
2032 2.0% 2.0% 0.820 $70.00 $92.35 $77.65 $102.45 $82.65
2033 2.0% 2.0% 0.820 $70.00 $94.20 $77.65 $104.50 $84.30
2034 2.0% 2.0% 0.820 $70.00 $96.10 $77.65 $106.60 $86.00
2035 2.0% 2.0% 0.820 $70.00 $98.00 $77.65 $108.75 $87.75
2036 2.0% 2.0% 0.820 $70.00 $100.00 $77.65 $110.90 $89.50
2037 2.0% 2.0% 0.820 $70.00 $102.00 $77.65 $113.10 $91.25
2037+ 2.0% 2.0% 0.820 0.0% 2.0% 0.0% 2.0% 2.0%
Notes: • All prices are in Canadian dollars except WTI and NYMEX gas which are in U.S. dollars
• Edmonton city gate prices based on historical light oil par prices posted by the government of Alberta and Net Energy differential futures (40 Deg. API < 0.5% Sulphur)
• Real prices listed in 2018 dollars with no escalation considered
Disclaimer - No representation or warranty of any kind (whether expressed or implied) is given by Deloitte LLP as to the accuracy, completeness, currency or fitness for any purpose of this document. As such, this document does not constitute the giving of investment advice, nor a part of any advice on investment decisions. Accordingly, regardless of the form of action, whether in contract, tort or otherwise, and to the extent permitted by applicable law, Deloitte LLP accepts no liability of any kind and disclaims all responsibility for the consequences of any person acting or refraining from acting in reliance on this this price forecast in whole or in part. This price forecast is not for dissemination in the United States or for distribution to United States wire services.
14
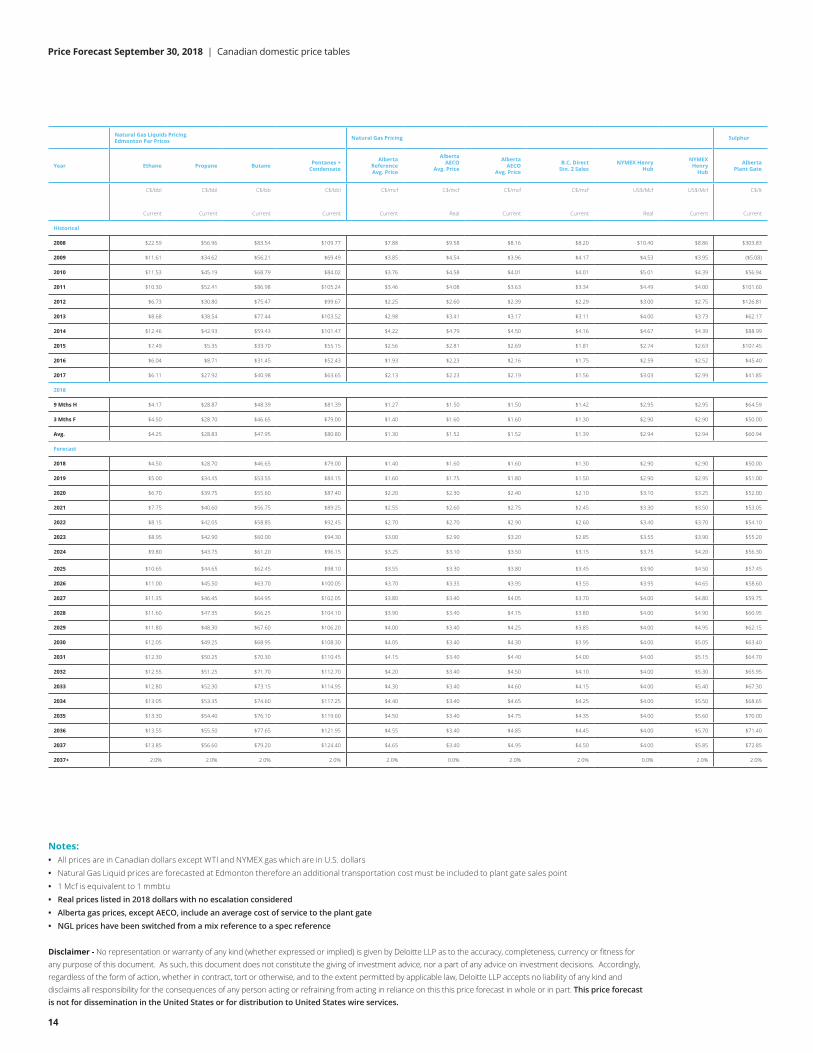
Price Forecast September 30, 2018 | Canadian domestic price tables
Year
Natural Gas Liquids Pricing Edmonton Par Prices Natural Gas Pricing Sulphur
Ethane Propane Butane Pentanes + Condensate
Alberta Reference Avg. Price
Alberta AECO
Avg. Price
Alberta AECO
Avg. Price
B.C. Direct Stn. 2 Sales
NYMEX Henry Hub
NYMEX Henry
Hub
Alberta Plant Gate
C$/bbl
Current
C$/bbl
Current
C$/bb
Current
C$/bbl
Current
C$/mcf
Current
C$/mcf
Real
C$/mcf
Current
C$/mcf
Current
US$/Mcf
Real
US$/Mcf
Current
C$/lt
Current
Historical
2008 $22.59 $56.96 $83.54 $109.77 $7.88 $9.58 $8.16 $8.20 $10.40 $8.86 $303.83
2009 $11.61 $34.62 $56.21 $69.49 $3.85 $4.54 $3.96 $4.17 $4.53 $3.95 ($5.08)
2010 $11.53 $45.19 $68.79 $84.02 $3.76 $4.58 $4.01 $4.01 $5.01 $4.39 $56.94
2011 $10.30 $52.41 $86.98 $105.24 $3.46 $4.08 $3.63 $3.34 $4.49 $4.00 $101.60
2012 $6.73 $30.80 $75.47 $99.67 $2.25 $2.60 $2.39 $2.29 $3.00 $2.75 $126.81
2013 $8.68 $38.54 $77.44 $103.52 $2.98 $3.41 $3.17 $3.11 $4.00 $3.73 $62.17
2014 $12.46 $42.93 $59.43 $101.47 $4.22 $4.79 $4.50 $4.16 $4.67 $4.39 $88.99
2015 $7.49 $5.35 $33.70 $55.15 $2.56 $2.81 $2.69 $1.81 $2.74 $2.63 $107.45
2016 $6.04 $8.71 $31.45 $52.43 $1.93 $2.23 $2.16 $1.75 $2.59 $2.52 $45.40
2017 $6.11 $27.92 $40.98 $63.65 $2.13 $2.23 $2.19 $1.56 $3.03 $2.99 $41.85
2018
9 Mths H $4.17 $28.87 $48.39 $81.39 $1.27 $1.50 $1.50 $1.42 $2.95 $2.95 $64.59
3 Mths F $4.50 $28.70 $46.65 $79.00 $1.40 $1.60 $1.60 $1.30 $2.90 $2.90 $50.00
Avg. $4.25 $28.83 $47.95 $80.80 $1.30 $1.52 $1.52 $1.39 $2.94 $2.94 $60.94
Forecast
2018 $4.50 $28.70 $46.65 $79.00 $1.40 $1.60 $1.60 $1.30 $2.90 $2.90 $50.00
2019 $5.00 $34.45 $53.55 $84.15 $1.60 $1.75 $1.80 $1.50 $2.90 $2.95 $51.00
2020 $6.70 $39.75 $55.60 $87.40 $2.20 $2.30 $2.40 $2.10 $3.10 $3.25 $52.00
2021 $7.75 $40.60 $56.75 $89.25 $2.55 $2.60 $2.75 $2.45 $3.30 $3.50 $53.05
2022 $8.15 $42.05 $58.85 $92.45 $2.70 $2.70 $2.90 $2.60 $3.40 $3.70 $54.10
2023 $8.95 $42.90 $60.00 $94.30 $3.00 $2.90 $3.20 $2.85 $3.55 $3.90 $55.20
2024 $9.80 $43.75 $61.20 $96.15 $3.25 $3.10 $3.50 $3.15 $3.75 $4.20 $56.30
2025 $10.65 $44.65 $62.45 $98.10 $3.55 $3.30 $3.80 $3.45 $3.90 $4.50 $57.45
2026 $11.00 $45.50 $63.70 $100.05 $3.70 $3.35 $3.95 $3.55 $3.95 $4.65 $58.60
2027 $11.35 $46.45 $64.95 $102.05 $3.80 $3.40 $4.05 $3.70 $4.00 $4.80 $59.75
2028 $11.60 $47.35 $66.25 $104.10 $3.90 $3.40 $4.15 $3.80 $4.00 $4.90 $60.95
2029 $11.80 $48.30 $67.60 $106.20 $4.00 $3.40 $4.25 $3.85 $4.00 $4.95 $62.15
2030 $12.05 $49.25 $68.95 $108.30 $4.05 $3.40 $4.30 $3.95 $4.00 $5.05 $63.40
2031 $12.30 $50.25 $70.30 $110.45 $4.15 $3.40 $4.40 $4.00 $4.00 $5.15 $64.70
2032 $12.55 $51.25 $71.70 $112.70 $4.20 $3.40 $4.50 $4.10 $4.00 $5.30 $65.95
2033 $12.80 $52.30 $73.15 $114.95 $4.30 $3.40 $4.60 $4.15 $4.00 $5.40 $67.30
2034 $13.05 $53.35 $74.60 $117.25 $4.40 $3.40 $4.65 $4.25 $4.00 $5.50 $68.65
2035 $13.30 $54.40 $76.10 $119.60 $4.50 $3.40 $4.75 $4.35 $4.00 $5.60 $70.00
2036 $13.55 $55.50 $77.65 $121.95 $4.55 $3.40 $4.85 $4.45 $4.00 $5.70 $71.40
2037 $13.85 $56.60 $79.20 $124.40 $4.65 $3.40 $4.95 $4.50 $4.00 $5.85 $72.85
2037+ 2.0% 2.0% 2.0% 2.0% 2.0% 0.0% 2.0% 2.0% 0.0% 2.0% 2.0%
Notes: • All prices are in Canadian dollars except WTI and NYMEX gas which are in U.S. dollars
• Natural Gas Liquid prices are forecasted at Edmonton therefore an additional transportation cost must be included to plant gate sales point
• 1 Mcf is equivalent to 1 mmbtu
• Real prices listed in 2018 dollars with no escalation considered • Alberta gas prices, except AECO, include an average cost of service to the plant gate • NGL prices have been switched from a mix reference to a spec reference
Disclaimer - No representation or warranty of any kind (whether expressed or implied) is given by Deloitte LLP as to the accuracy, completeness, currency or fitness for any purpose of this document. As such, this document does not constitute the giving of investment advice, nor a part of any advice on investment decisions. Accordingly, regardless of the form of action, whether in contract, tort or otherwise, and to the extent permitted by applicable law, Deloitte LLP accepts no liability of any kind and disclaims all responsibility for the consequences of any person acting or refraining from acting in reliance on this this price forecast in whole or in part. This price forecast is not for dissemination in the United States or for distribution to United States wire services.
Price Forecast September 30, 2018 | Canadian domestic price tables
15
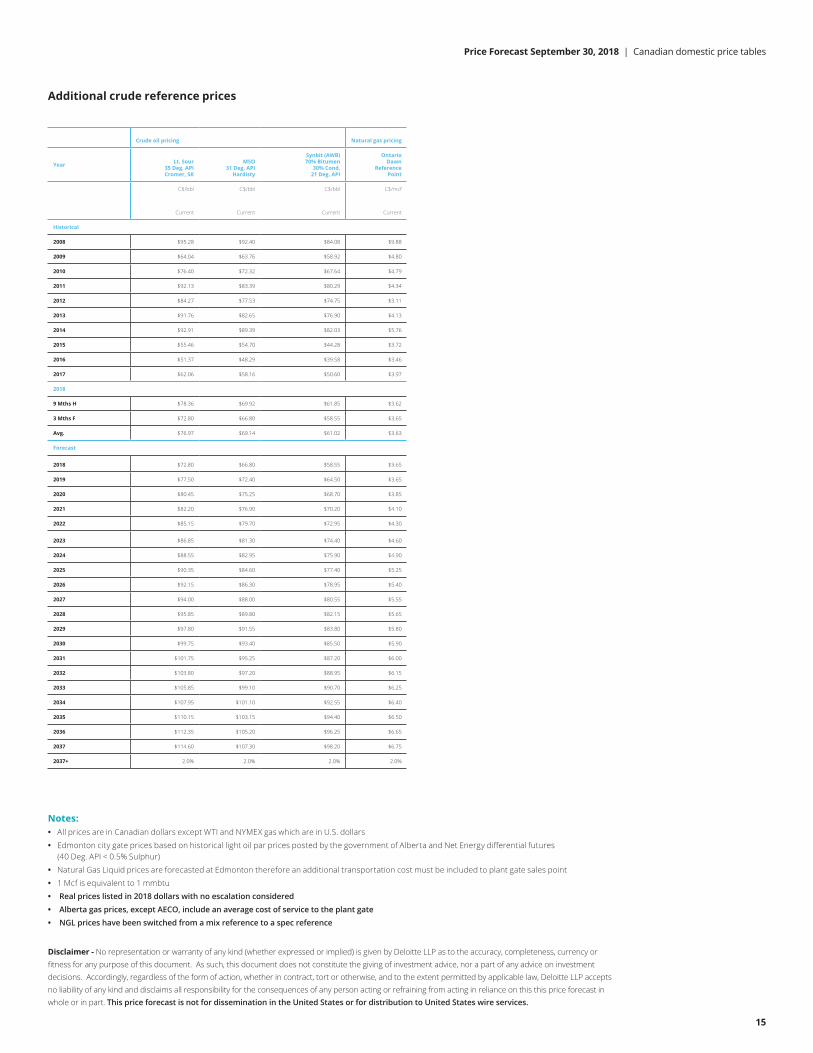
Additional crude reference prices
Year
Crude oil pricing Natural gas pricing
Lt. Sour 35 Deg. API Cromer, SK
MSO 31 Deg. API
Hardisty
Synbit (AWB) 70% Bitumen
30% Cond. 21 Deg. API
Ontario Dawn
Reference Point
C$/bbl
Current
C$/bbl
Current
C$/bbl
Current
C$/mcf
Current
Historical
2008 $95.28 $92.40 $84.08 $9.88
2009 $64.04 $63.76 $58.92 $4.80
2010 $76.40 $72.32 $67.64 $4.79
2011 $92.13 $83.39 $80.29 $4.34
2012 $84.27 $77.53 $74.75 $3.11
2013 $91.76 $82.65 $76.90 $4.13
2014 $92.91 $89.39 $82.03 $5.76
2015 $55.46 $54.70 $44.28 $3.72
2016 $51.37 $48.29 $39.58 $3.46
2017 $62.06 $58.16 $50.60 $3.97
2018
9 Mths H $78.36 $69.92 $61.85 $3.62
3 Mths F $72.80 $66.80 $58.55 $3.65
Avg. $76.97 $69.14 $61.02 $3.63
Forecast
2018 $72.80 $66.80 $58.55 $3.65
2019 $77.50 $72.40 $64.50 $3.65
2020 $80.45 $75.25 $68.70 $3.85
2021 $82.20 $76.90 $70.20 $4.10
2022 $85.15 $79.70 $72.95 $4.30
2023 $86.85 $81.30 $74.40 $4.60
2024 $88.55 $82.95 $75.90 $4.90
2025 $90.35 $84.60 $77.40 $5.25
2026 $92.15 $86.30 $78.95 $5.40
2027 $94.00 $88.00 $80.55 $5.55
2028 $95.85 $89.80 $82.15 $5.65
2029 $97.80 $91.55 $83.80 $5.80
2030 $99.75 $93.40 $85.50 $5.90
2031 $101.75 $95.25 $87.20 $6.00
2032 $103.80 $97.20 $88.95 $6.15
2033 $105.85 $99.10 $90.70 $6.25
2034 $107.95 $101.10 $92.55 $6.40
2035 $110.15 $103.15 $94.40 $6.50
2036 $112.35 $105.20 $96.25 $6.65
2037 $114.60 $107.30 $98.20 $6.75
2037+ 2.0% 2.0% 2.0% 2.0%
Notes: • All prices are in Canadian dollars except WTI and NYMEX gas which are in U.S. dollars
• Edmonton city gate prices based on historical light oil par prices posted by the government of Alberta and Net Energy differential futures (40 Deg. API < 0.5% Sulphur)
• Natural Gas Liquid prices are forecasted at Edmonton therefore an additional transportation cost must be included to plant gate sales point
• 1 Mcf is equivalent to 1 mmbtu
• Real prices listed in 2018 dollars with no escalation considered • Alberta gas prices, except AECO, include an average cost of service to the plant gate • NGL prices have been switched from a mix reference to a spec reference
Disclaimer - No representation or warranty of any kind (whether expressed or implied) is given by Deloitte LLP as to the accuracy, completeness, currency or fitness for any purpose of this document. As such, this document does not constitute the giving of investment advice, nor a part of any advice on investment decisions. Accordingly, regardless of the form of action, whether in contract, tort or otherwise, and to the extent permitted by applicable law, Deloitte LLP accepts no liability of any kind and disclaims all responsibility for the consequences of any person acting or refraining from acting in reliance on this this price forecast in whole or in part. This price forecast is not for dissemination in the United States or for distribution to United States wire services.
Price Forecast September 30, 2018 | International price tables
16
•
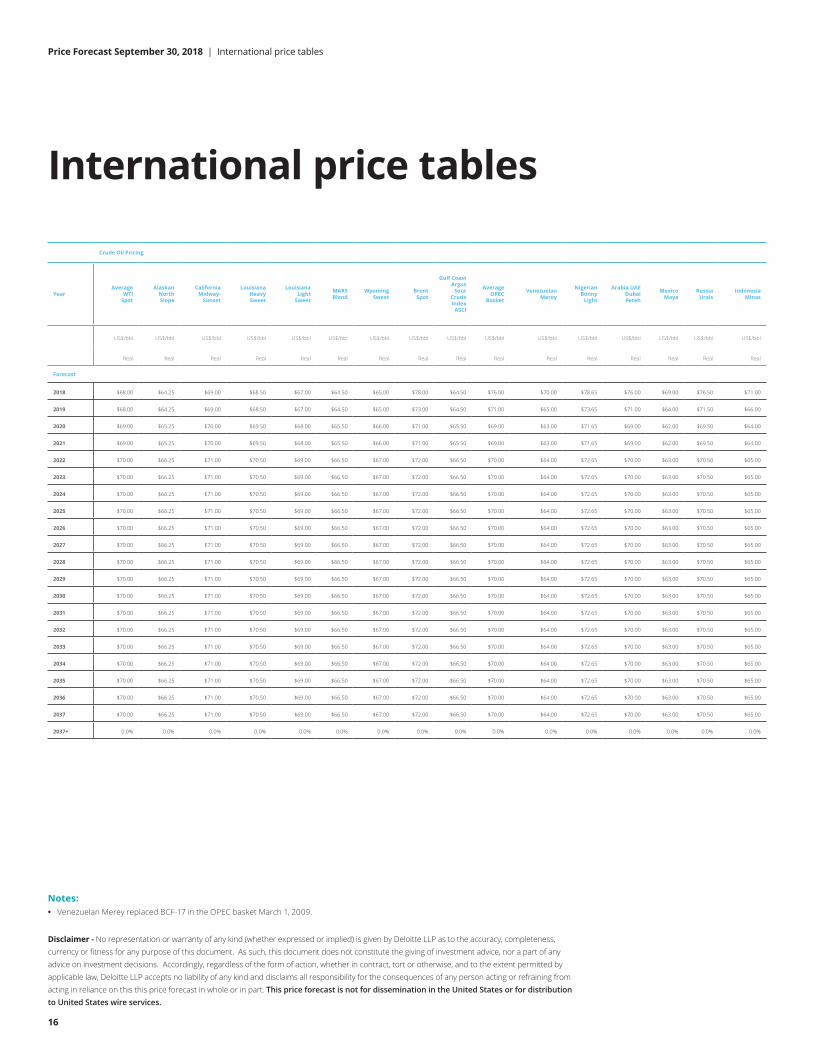
International price tables
Year
Crude Oil Pricing
Average WTI
Spot
Alaskan North Slope
California Midway-
Sunset
Louisiana Heavy Sweet
Louisiana Light
Sweet
MARS Blend
Wyoming Sweet
Brent Spot
Gulf Coast Argus
Sour Crude Index
ASCI
Average OPEC
Basket
Venezuelan Merey
Nigerian Bonny
Light
Arabia UAE Dubai Feteh
Mexico Maya
Russia Urals
Indonesia Minas
US$/bbl
Real
US$/bbl
Real
US$/bbl
Real
US$/bbl
Real
US$/bbl
Real
US$/bbl
Real
US$/bbl
Real
US$/bbl
Real
US$/bbl
Real
US$/bbl
Real
US$/bbl
Real
US$/bbl
Real
US$/bbl
Real
US$/bbl
Real
US$/bbl
Real
US$/bbl
Real
Forecast
2018 $68.00 $64.25 $69.00 $68.50 $67.00 $64.50 $65.00 $78.00 $64.50 $76.00 $70.00 $78.65 $76.00 $69.00 $76.50 $71.00
2019 $68.00 $64.25 $69.00 $68.50 $67.00 $64.50 $65.00 $73.00 $64.50 $71.00 $65.00 $73.65 $71.00 $64.00 $71.50 $66.00
2020 $69.00 $65.25 $70.00 $69.50 $68.00 $65.50 $66.00 $71.00 $65.50 $69.00 $63.00 $71.65 $69.00 $62.00 $69.50 $64.00
2021 $69.00 $65.25 $70.00 $69.50 $68.00 $65.50 $66.00 $71.00 $65.50 $69.00 $63.00 $71.65 $69.00 $62.00 $69.50 $64.00
2022 $70.00 $66.25 $71.00 $70.50 $69.00 $66.50 $67.00 $72.00 $66.50 $70.00 $64.00 $72.65 $70.00 $63.00 $70.50 $65.00
2023 $70.00 $66.25 $71.00 $70.50 $69.00 $66.50 $67.00 $72.00 $66.50 $70.00 $64.00 $72.65 $70.00 $63.00 $70.50 $65.00
2024 $70.00 $66.25 $71.00 $70.50 $69.00 $66.50 $67.00 $72.00 $66.50 $70.00 $64.00 $72.65 $70.00 $63.00 $70.50 $65.00
2025 $70.00 $66.25 $71.00 $70.50 $69.00 $66.50 $67.00 $72.00 $66.50 $70.00 $64.00 $72.65 $70.00 $63.00 $70.50 $65.00
2026 $70.00 $66.25 $71.00 $70.50 $69.00 $66.50 $67.00 $72.00 $66.50 $70.00 $64.00 $72.65 $70.00 $63.00 $70.50 $65.00
2027 $70.00 $66.25 $71.00 $70.50 $69.00 $66.50 $67.00 $72.00 $66.50 $70.00 $64.00 $72.65 $70.00 $63.00 $70.50 $65.00
2028 $70.00 $66.25 $71.00 $70.50 $69.00 $66.50 $67.00 $72.00 $66.50 $70.00 $64.00 $72.65 $70.00 $63.00 $70.50 $65.00
2029 $70.00 $66.25 $71.00 $70.50 $69.00 $66.50 $67.00 $72.00 $66.50 $70.00 $64.00 $72.65 $70.00 $63.00 $70.50 $65.00
2030 $70.00 $66.25 $71.00 $70.50 $69.00 $66.50 $67.00 $72.00 $66.50 $70.00 $64.00 $72.65 $70.00 $63.00 $70.50 $65.00
2031 $70.00 $66.25 $71.00 $70.50 $69.00 $66.50 $67.00 $72.00 $66.50 $70.00 $64.00 $72.65 $70.00 $63.00 $70.50 $65.00
2032 $70.00 $66.25 $71.00 $70.50 $69.00 $66.50 $67.00 $72.00 $66.50 $70.00 $64.00 $72.65 $70.00 $63.00 $70.50 $65.00
2033 $70.00 $66.25 $71.00 $70.50 $69.00 $66.50 $67.00 $72.00 $66.50 $70.00 $64.00 $72.65 $70.00 $63.00 $70.50 $65.00
2034 $70.00 $66.25 $71.00 $70.50 $69.00 $66.50 $67.00 $72.00 $66.50 $70.00 $64.00 $72.65 $70.00 $63.00 $70.50 $65.00
2035 $70.00 $66.25 $71.00 $70.50 $69.00 $66.50 $67.00 $72.00 $66.50 $70.00 $64.00 $72.65 $70.00 $63.00 $70.50 $65.00
2036 $70.00 $66.25 $71.00 $70.50 $69.00 $66.50 $67.00 $72.00 $66.50 $70.00 $64.00 $72.65 $70.00 $63.00 $70.50 $65.00
2037 $70.00 $66.25 $71.00 $70.50 $69.00 $66.50 $67.00 $72.00 $66.50 $70.00 $64.00 $72.65 $70.00 $63.00 $70.50 $65.00
2037+ 0.0% 0.0% 0.0% 0.0% 0.0% 0.0% 0.0% 0.0% 0.0% 0.0% 0.0% 0.0% 0.0% 0.0% 0.0% 0.0%
Notes: Venezuelan Merey replaced BCF-17 in the OPEC basket March 1, 2009.
Disclaimer - No representation or warranty of any kind (whether expressed or implied) is given by Deloitte LLP as to the accuracy, completeness, currency or fitness for any purpose of this document. As such, this document does not constitute the giving of investment advice, nor a part of any advice on investment decisions. Accordingly, regardless of the form of action, whether in contract, tort or otherwise, and to the extent permitted by applicable law, Deloitte LLP accepts no liability of any kind and disclaims all responsibility for the consequences of any person acting or refraining from acting in reliance on this this price forecast in whole or in part. This price forecast is not for dissemination in the United States or for distribution to United States wire services.
Price Forecast September 30, 2018 | International price tables
17
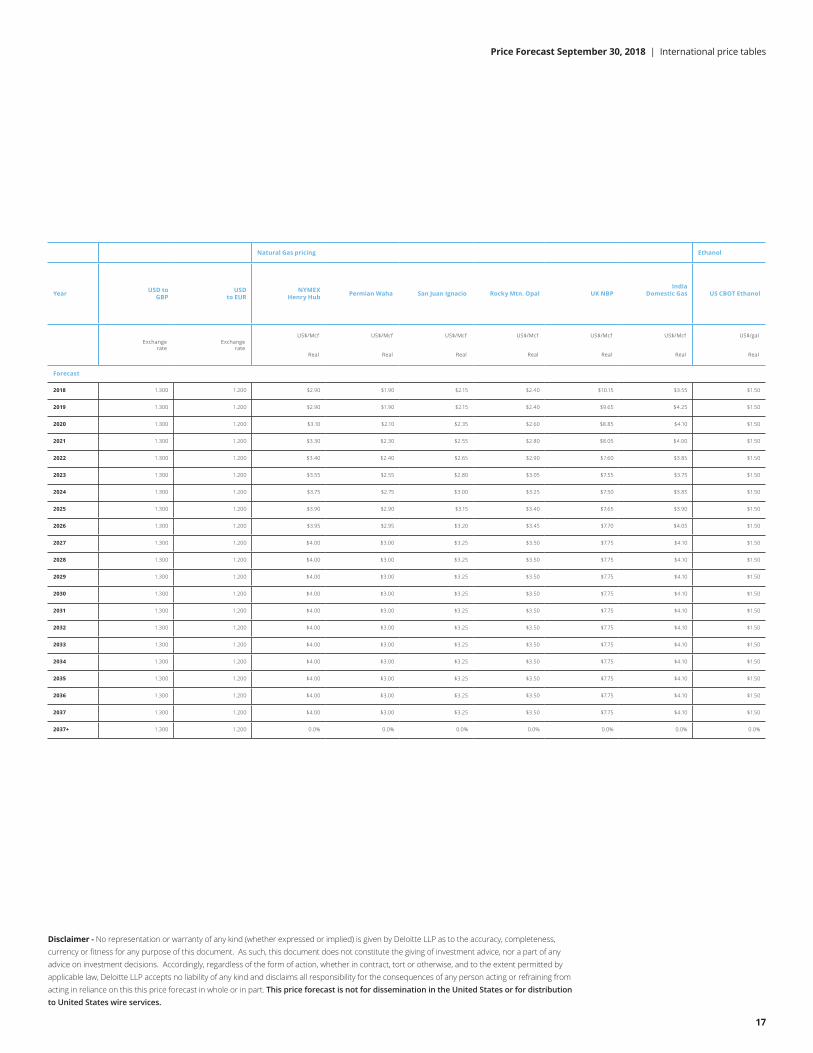
Year
Natural Gas pricing Ethanol
USD to GBP
USD to EUR
NYMEX Henry Hub Permian Waha San Juan Ignacio Rocky Mtn. Opal UK NBP
India Domestic Gas US CBOT Ethanol
Exchange rate
Exchange rate
US$/Mcf
Real
US$/Mcf
Real
US$/Mcf
Real
US$/Mcf
Real
US$/Mcf
Real
US$/Mcf
Real
US$/gal
Real
Forecast
2018 1.300 1.200 $2.90 $1.90 $2.15 $2.40 $10.15 $3.55 $1.50
2019 1.300 1.200 $2.90 $1.90 $2.15 $2.40 $9.65 $4.25 $1.50
2020 1.300 1.200 $3.10 $2.10 $2.35 $2.60 $8.85 $4.10 $1.50
2021 1.300 1.200 $3.30 $2.30 $2.55 $2.80 $8.05 $4.00 $1.50
2022 1.300 1.200 $3.40 $2.40 $2.65 $2.90 $7.60 $3.85 $1.50
2023 1.300 1.200 $3.55 $2.55 $2.80 $3.05 $7.55 $3.75 $1.50
2024 1.300 1.200 $3.75 $2.75 $3.00 $3.25 $7.50 $3.85 $1.50
2025 1.300 1.200 $3.90 $2.90 $3.15 $3.40 $7.65 $3.90 $1.50
2026 1.300 1.200 $3.95 $2.95 $3.20 $3.45 $7.70 $4.05 $1.50
2027 1.300 1.200 $4.00 $3.00 $3.25 $3.50 $7.75 $4.10 $1.50
2028 1.300 1.200 $4.00 $3.00 $3.25 $3.50 $7.75 $4.10 $1.50
2029 1.300 1.200 $4.00 $3.00 $3.25 $3.50 $7.75 $4.10 $1.50
2030 1.300 1.200 $4.00 $3.00 $3.25 $3.50 $7.75 $4.10 $1.50
2031 1.300 1.200 $4.00 $3.00 $3.25 $3.50 $7.75 $4.10 $1.50
2032 1.300 1.200 $4.00 $3.00 $3.25 $3.50 $7.75 $4.10 $1.50
2033 1.300 1.200 $4.00 $3.00 $3.25 $3.50 $7.75 $4.10 $1.50
2034 1.300 1.200 $4.00 $3.00 $3.25 $3.50 $7.75 $4.10 $1.50
2035 1.300 1.200 $4.00 $3.00 $3.25 $3.50 $7.75 $4.10 $1.50
2036 1.300 1.200 $4.00 $3.00 $3.25 $3.50 $7.75 $4.10 $1.50
2037 1.300 1.200 $4.00 $3.00 $3.25 $3.50 $7.75 $4.10 $1.50
2037+ 1.300 1.200 0.0% 0.0% 0.0% 0.0% 0.0% 0.0% 0.0%
Disclaimer - No representation or warranty of any kind (whether expressed or implied) is given by Deloitte LLP as to the accuracy, completeness, currency or fitness for any purpose of this document. As such, this document does not constitute the giving of investment advice, nor a part of any advice on investment decisions. Accordingly, regardless of the form of action, whether in contract, tort or otherwise, and to the extent permitted by applicable law, Deloitte LLP accepts no liability of any kind and disclaims all responsibility for the consequences of any person acting or refraining from acting in reliance on this this price forecast in whole or in part. This price forecast is not for dissemination in the United States or for distribution to United States wire services.

18
Price Forecast September 30, 2018 | Pricing philosophy
Pricing philosophy
Price forecasting takes into account many variables that can influence future prices. Our experience tells us that we must continually review the forecasting tools we use to predict where oil and gas prices are heading. However, one constant influence on oil and gas pricing is the geo-political landscape. This impact is most accurately reflected in the financial industry’s futures market for commodities, a main influence when Deloitte creates its price forecast. In other words, Deloitte looks to both the futures and the past when we create our forecasts.
This pricing philosophy challenges conventional thinking. The traditional view is based on the m ean-reversion view of commodities presented by economists. Following this model, industry forecasts from 2000 to 2006 reflected a drop in prices over the long term from the current prices of the day – even though the futures market indicated otherwise. While the mean-reversion approach definitely has some merit, history has tended to reflect that the futures market is a more accurate barometer.
Client focus
At Deloitte, we believe it is part of our role to help our clients in both the oil and gas sector and the investment community make better long-term business decisions by providing them with the most accurate and realistic information. We understand that sound analysis of changing trends can influence decisions on mergers, acquisitions, divestitures and investments. One way we ensure our price forecasts are as accurate as possible, given the continuing impact of near-term volatility, is to review our pricing assumptions on a quarterly basis.
Our process
In preparing the price forecast, Deloitte considers the current monthly trends, the actual price and trends for the year-to-date and the prior year actual prices. The base forecast for both oil and gas is based on New York Mercantile Exchange (NYMEX) futures in U.S. dollars.
Crude oil and natural gas forecasts are based on yearly variable factors, weighted to a higher percent for the current data and then reflect a higher percent to prior year historical data for the later years. Gas prices have been determined independently from oil prices, but still reflect the current competitive nature of the two fuels and historical oil-to-gas ratios for the latter years of the gas forecast.
Deloitte prepares our price and market forecasts based on information we collect from numerous government agencies, industry publications, oil refineries, natural gas marketers and industry trends. Inflation forecasts and exchange rates are also an integral part of the forecast.
These forecasts are Deloitte’s best estimate of how the future will look, and while they are considered reasonable, changing market conditions or additional information may require alteration from the indicated effective date.
19
Price Forecast September 30, 2018 | Glossary
Glossary
Some of the words, phrases and acronyms we use frequently when talking about pricing are listed below:
AECO Alberta Energy Company - historical name of a virtual trading hub on the NGX system
ANS Alaska North Slope
ASCI Argus Sour Crude Oil
AWB Access Western Blend - Canadian condensate/bitumen mix
BR Bow River Crude Oil
CAPP Canadian Association of Petroleum Producers
CBOT Chicago Board Of Trade
CGA Canadian Gas Association
CME Chicago Mercantile Exchange
DCQ Daily Contract Quantity
DOB Daily Oil Bulletin
EIA Energy Information Administration
FERC US Federal Energy Regulatory Commission
FOB Free on Board (shipper term)
IEA International Energy Administration
LLB Lloydminster Blend Crude Oil
LNG Liquefied Natural Gas
MESC Middle East Sour Crude
MSO Mixed Sour Crude Oil
MSW Canadian Light Sweet
NEB Canadian National Energy Board
NGX Natural Gas Exchange
NIT Nova Inventory Transfer
NRC Natural Resources Canada
NYMEX New York Mercantile Exchange
OECD Organization of Economic Cooperation and Development
OPEC Organization of Petroleum Exporting Countries
PADD Petroleum Administration Defense District
USGC US Gulf Coast
USWC US West Coast
WCS Western Canada Select Crude Oil
WTI West Texas Intermediate
WTS West Texas Sour

Andrew Botterill 403-648-3239 [email protected]
Lesley Mitchell 403-648-3215 [email protected]
Jonathan Listoe 403-648-3254 [email protected]
Sarah Clowes 587-293-3201 [email protected]
Deloitte Bankers Court 700, 850 - 2 Street SW Calgary AB T2P 0R8 Canada
Tel: 403-267-1700 Fax: 587-774-5398
www.deloitte.ca/priceforecast
No representation or warranty of any kind (whether expressed or implied) is given by Deloitte LLP as to the accuracy, completeness, currency or fitness for any purpose of this document. As such, this document does not constitute the giving of investment advice, nor a part of any advice on investment decisions. Accordingly, regardless of the form of action, whether in contract, tort or otherwise, and to the extent permitted by applicable law, Deloitte LLP accepts no liability of any kind and disclaims all responsibility for the consequences of any person acting or refraining from acting in reliance on this price forecast in whole or in part.
This price forecast is not for dissemination in the United States or for distribution to United States wire services.
Deloitte, one of Canada’s leading professional services firms, provides audit, tax, consulting, and financial advisory services. Deloitte LLP, an Ontario limited liability partnership, is the Canadian member firm of Deloitte Touche Tohmatsu Limited. Deloitte operates in Quebec as Deloitte s.e.n.c.r.l., a Quebec limited liability partnership.
Deloitte refers to one or more of Deloitte Touche Tohmatsu Limited, a UK private company limited by guarantee, and its network of member firms, each of which is a legally separate and independent entity. Please see www.deloitte.com/about for a detailed description of the legal structure of Deloitte Touche Tohmatsu Limited and its member firms.
© Deloitte LLP and affiliated entities. 18-5996H