Embed Size (px)
Citation preview
May 2011
May 2011
MARKETING COSTS AND MARGINS
PRICE AND MARKET-STRUCTURE ANALYSIS FOR SOME SELECTED AGRICULTURAL COMMODITIES IN SUDAN:
This study is one of the papers selected for funding by SIFSIA for the support of food
security research and capacity building initiatives identified at the local/state level.
The main purpose of the research is to improve understanding of food security issues
in Sudan and inform decision makers about the evolving food security situation in
the selected States. The main expected outcome of the selected papers should be an
enhanced decentralized capacity in food security analysis and in food security policy
and planning.
FOOD SECURITY TECHNICAL SECRETARIAT / MINISTRY OF AGRICULTURE (FSTS)
FAO- SUDAN INTEGRATED FOOD SECURITY INFORMATION FOR ACTION (SIFSIA)
SIFSIA project: is funded by European Union Stabex Funds
and jointly implemented by the Government of Sudan and the Food and Agriculture Organization of the UN(FAO). The project aims at strengthening the government capacity in collecting, analyzing, disseminating, and utilizing food security information.
May 2011
Price and Market-Structure Analysis for Some Selected Agricultural Commodities: Marketing
Costs and Margins
1
Preface
The Sudan Integrated Food Security Information for Action (SIFSIA) is a GoNU/GoSS programme
funded by EU STABEX funds and implemented by the Food and Agriculture Organisation of the
UN (FAO). This study is selected for funding by SIFSIA for the support of food security research
and capacity building initiatives identified at the local/state level. Its main purpose of the research is
to improve understanding of food security issues in Sudan and inform decision makers about the
evolving food security situation in the selected States. The main expected outcome of the study
should be an enhanced decentralized capacity in food security analysis and in food security policy
and planning.
This paper builds on the original work by the Agricultural Economics directorate of the Ministry of
Agriculture. Dr. El Fadil Ahmed Ismail, Agricultural Marketing Expert, Department of Food
Economics and Marketing Food Research Centre (FRC), Agricultural Research & Technology
Corporation (ARTC) a review of previous research works in domain of market performance in
changing the original drafted document.
Despite the overwhelming coverage of the concept of Structure, Conduct and Performance, these
sets of analyses have limited use in analysis of agricultural markets in Sudan and limited researches
conducted along the costs, margins involved, and the participants‘ behaviour therein. To fill in
these gaps, this study made special focus on marketing costs and margins and how they influence
the value chain for selected crops/commodities rather than examining how marketing actions
influence consumer prices at specific point of time. Nonetheless, the final aim of the study is not to
obtain precise costs and margins estimates for the conventional marketing functions of selected
agricultural crops/commodities, but rather to make this information usable to devise a policy
framework for an effective marketing strategy and improve the efficiency of agricultural markets in
Sudan.
SIFSIA N and the Ministry of Agriculture have jointly endeavoured to bring out a number of
research documents as it relates to food security. The target of these series of studies is to provide
information on food security to help decision makers make informed decisions and build the
capacity of Government counterparts in the area of research. It is also believed that agricultural
entrepreneurs will benefit from this study for their agribusiness decisions, including the various
transfers, transactions and other marketing services.
As a continuation to SIFSIA‘s regular market related supports, this study attempts to outline some
of the key features and challenges that have emerged by the previous study on costs and margins
made in 2009 and broadened its scope to cover other aspects of market performance. The purpose
of this study is to develop an overall framework for improving market performance and describes
how the marketing costs and margins influence the value chains for selected agricultural
commodities with particular focus on crop markets.
Price and Market-Structure Analysis for Some Selected Agricultural Commodities: Marketing
Costs and Margins
2
Acknowledgements
SIFSIA-N acknowledges the efforts of all those who contributed to this research work. Special
thanks go to Dr. Abdelatief Ijaimi, Under Secretary of the Ministry of Agriculture, who tirelessly
supported the research activity and have done an excellent job of editing the document. Dr.
Elfadil has committed his invaluable time in giving the paper the current shape. This paper
utilized the original draft document prepared by Department of Agricultural Economics (DAE).
Thanks to Bakhita Mahgoub El Shafei, Hassab Elrasoul Hag ElSaeed, Dr. Salah Sharf Eldein
Sumeya, and Dr.Ali Abdelaziz (Consultant) who gave special dedication to the research. The
Food Security Technical Secretariat (FSTS) members have also meticulously edited the original
document – thanks to Ali Khalil, Rihab Nimir and Sara Elsafi. Particular acknowledgements go
for the SIFSIA-N Program Support Unit (PSU), whose input was most invaluable. Yahia, Sara
and Sadig merits special words of thanks for their keen follow up until the draft showed light.
The DAE staff whose basic material was shared for revised readings have special place for this
study. The document has also greatly benefited from comments received from experts of the Food
Research Centre. We would like to thank those who shared their opinion or comments, which have,
no doubt enriched the document.
Price and Market-Structure Analysis for Some Selected Agricultural Commodities: Marketing
Costs and Margins
3
Contents
Preface................................................................................................................................................ 0 Acknowledgements ............................................................................................................................ 2 Contents ............................................................................................................................................. 3 List of Tables ..................................................................................................................................... 4
List of Figures .................................................................................................................................... 5 List of Acronyms, and Conversion Factors ....................................................................................... 6 List of Annexes .................................................................................................................................. 8
Executive Summary ........................................................................................................................... 9 1. INTRODUCTION AND BACKGROUND TO THE STUDY ................................................... 11
1.1 Agriculture and Agricultural Markets .................................................................................... 11 1.1.1 Agriculture and its Relation to Markets .......................................................................... 11
1.1.2 Agricultural Markets Structure ....................................................................................... 11 1.2 Rationale of the Study ............................................................................................................ 12 1.3 Objectives .............................................................................................................................. 13 1.4 Scope, Plan and methodology of the Study ........................................................................... 14
1.5 Organization of the Study ...................................................................................................... 15 2. CONCEPTUAL FRAMEWORK AND METHODOLOGICAL APPROACHES ..................... 17
2.1Definitions and Concepts ........................................................................................................ 17 2.2On the Concept of Marketing Costs and Margins .................................................................. 18
3. MARKETING CHAINS, COSTS, PRICE STRUCTURE & RETURNS .................................. 19 3.1 Marketing Magnitude and Production Quantity .................................................................... 19 3.2 Transport and Storage Capacities .......................................................................................... 21
3.3 The Marketing Chains, Margins and Mark-Ups .................................................................... 22 3.3.1 An Overview of Marketing Chains and Related Policy for Selected Commodities ....... 23
3.3.2 Systems Cost Structures along the Supply Chain of Selected Commodities ................. 33 3.3.3 The Major Costs Components Affecting the Supply Chain ........................................... 41 3.3.3.1 Transport, Handling, Storage and Other Costs ........................................................... 42 3.3.3.2 The Summary of Marketing Costs: Implications ......................................................... 45
3.3.4 Margins and Returns Analysis ........................................................................................ 46 3.3.4.1 Margins & Returns to Farmers/Producers .................................................................. 46
3.3.4.2 Margins & Returns to Traders and Intermediaries ..................................................... 47 3.4 Impact of Productivity on Costs and Returns ........................................................................ 51 3.5 Market Integrations ................................................................................................................ 51
4. CONCLUSIONS AND RECOMMENDATIONS ..................................................................... 53 4.1 General Conclusions and Recommendations......................................................................... 53
4.1.1 General Recommendations and Policy Implications ...................................................... 54 4.1.2 Crop-Specific Recommendations and Policy Implications ............................................ 56
4.2 Limitations of the Study and Further Research ..................................................................... 56 REFERENCES AND RECOMMENDED READINGS ................................................................. 58 References ........................................................................................................................................ 58
Recommended Readings .................................................................................................................. 61 ANNEXES ....................................................................................................................................... 62
Price and Market-Structure Analysis for Some Selected Agricultural Commodities: Marketing
Costs and Margins
4
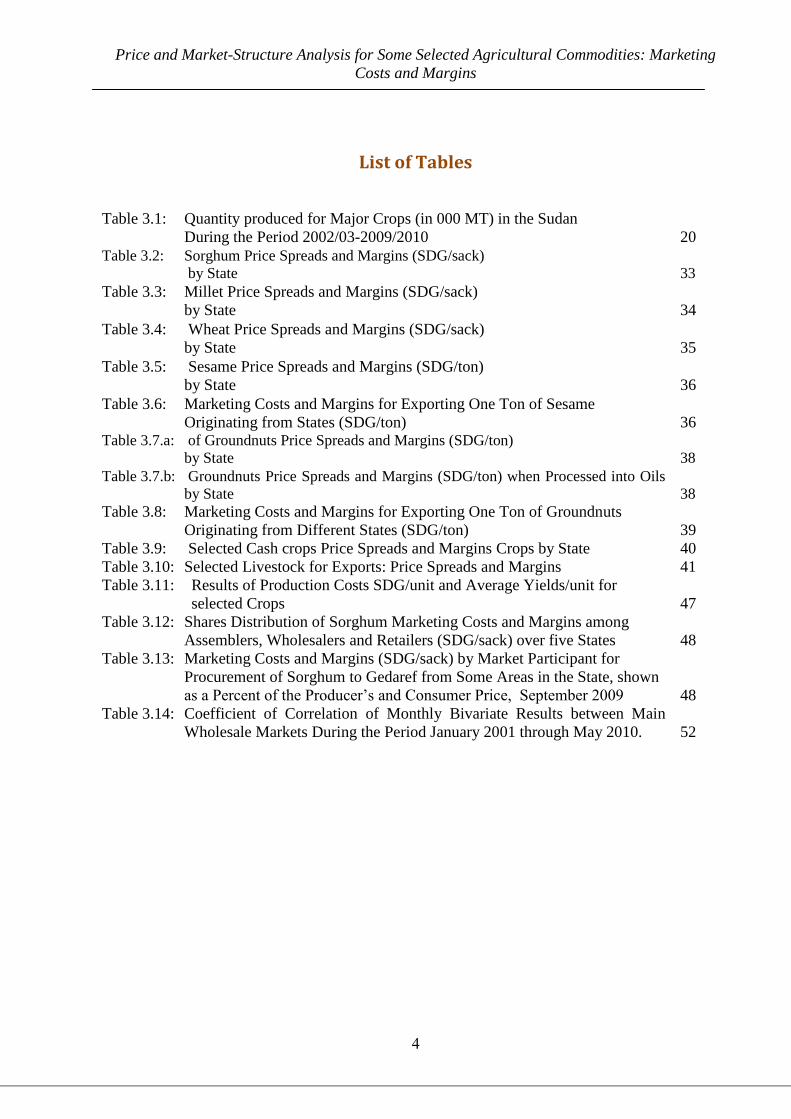
List of Tables
Table 3.1: Quantity produced for Major Crops (in 000 MT) in the Sudan
During the Period 2002/03-2009/2010
20
Table 3.2: Sorghum Price Spreads and Margins (SDG/sack)
by State
33
Table 3.3: Millet Price Spreads and Margins (SDG/sack)
by State
34
Table 3.4: Wheat Price Spreads and Margins (SDG/sack)
by State
35
Table 3.5: Sesame Price Spreads and Margins (SDG/ton)
by State
36
Table 3.6: Marketing Costs and Margins for Exporting One Ton of Sesame
Originating from States (SDG/ton)
36 Table 3.7.a: of Groundnuts Price Spreads and Margins (SDG/ton)
by State
38
Table 3.7.b: Groundnuts Price Spreads and Margins (SDG/ton) when Processed into Oils
by State
38
Table 3.8: Marketing Costs and Margins for Exporting One Ton of Groundnuts
Originating from Different States (SDG/ton)
39
Table 3.9: Selected Cash crops Price Spreads and Margins Crops by State 40
Table 3.10: Selected Livestock for Exports: Price Spreads and Margins 41
Table 3.11: Results of Production Costs SDG/unit and Average Yields/unit for
selected Crops
47
Table 3.12: Shares Distribution of Sorghum Marketing Costs and Margins among
Assemblers, Wholesalers and Retailers (SDG/sack) over five States
48
Table 3.13: Marketing Costs and Margins (SDG/sack) by Market Participant for
Procurement of Sorghum to Gedaref from Some Areas in the State, shown
as a Percent of the Producer‘s and Consumer Price, September 2009
48
Table 3.14: Coefficient of Correlation of Monthly Bivariate Results between Main
Wholesale Markets During the Period January 2001 through May 2010.
52
Price and Market-Structure Analysis for Some Selected Agricultural Commodities: Marketing
Costs and Margins
5
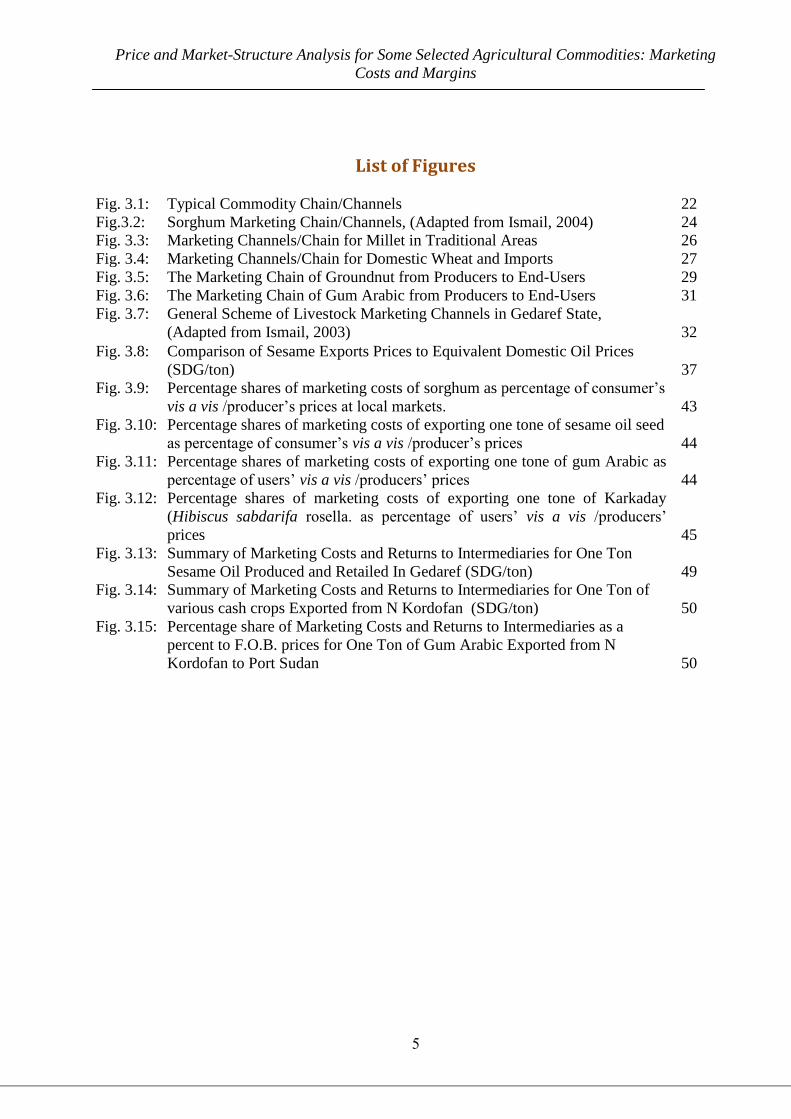
List of Figures
Fig. 3.1: Typical Commodity Chain/Channels 22
Fig.3.2: Sorghum Marketing Chain/Channels, (Adapted from Ismail, 2004) 24
Fig. 3.3: Marketing Channels/Chain for Millet in Traditional Areas 26
Fig. 3.4: Marketing Channels/Chain for Domestic Wheat and Imports 27
Fig. 3.5: The Marketing Chain of Groundnut from Producers to End-Users 29
Fig. 3.6: The Marketing Chain of Gum Arabic from Producers to End-Users 31
Fig. 3.7: General Scheme of Livestock Marketing Channels in Gedaref State,
(Adapted from Ismail, 2003)
32
Fig. 3.8: Comparison of Sesame Exports Prices to Equivalent Domestic Oil Prices
(SDG/ton)
37
Fig. 3.9: Percentage shares of marketing costs of sorghum as percentage of consumer‘s
vis a vis /producer‘s prices at local markets.
43
Fig. 3.10: Percentage shares of marketing costs of exporting one tone of sesame oil seed
as percentage of consumer‘s vis a vis /producer‘s prices
44
Fig. 3.11: Percentage shares of marketing costs of exporting one tone of gum Arabic as
percentage of users‘ vis a vis /producers‘ prices
44
Fig. 3.12: Percentage shares of marketing costs of exporting one tone of Karkaday
(Hibiscus sabdarifa rosella. as percentage of users‘ vis a vis /producers‘
prices
45
Fig. 3.13: Summary of Marketing Costs and Returns to Intermediaries for One Ton
Sesame Oil Produced and Retailed In Gedaref (SDG/ton)
49
Fig. 3.14: Summary of Marketing Costs and Returns to Intermediaries for One Ton of
various cash crops Exported from N Kordofan (SDG/ton)
50
Fig. 3.15: Percentage share of Marketing Costs and Returns to Intermediaries as a
percent to F.O.B. prices for One Ton of Gum Arabic Exported from N
Kordofan to Port Sudan
50
Price and Market-Structure Analysis for Some Selected Agricultural Commodities: Marketing
Costs and Margins
6
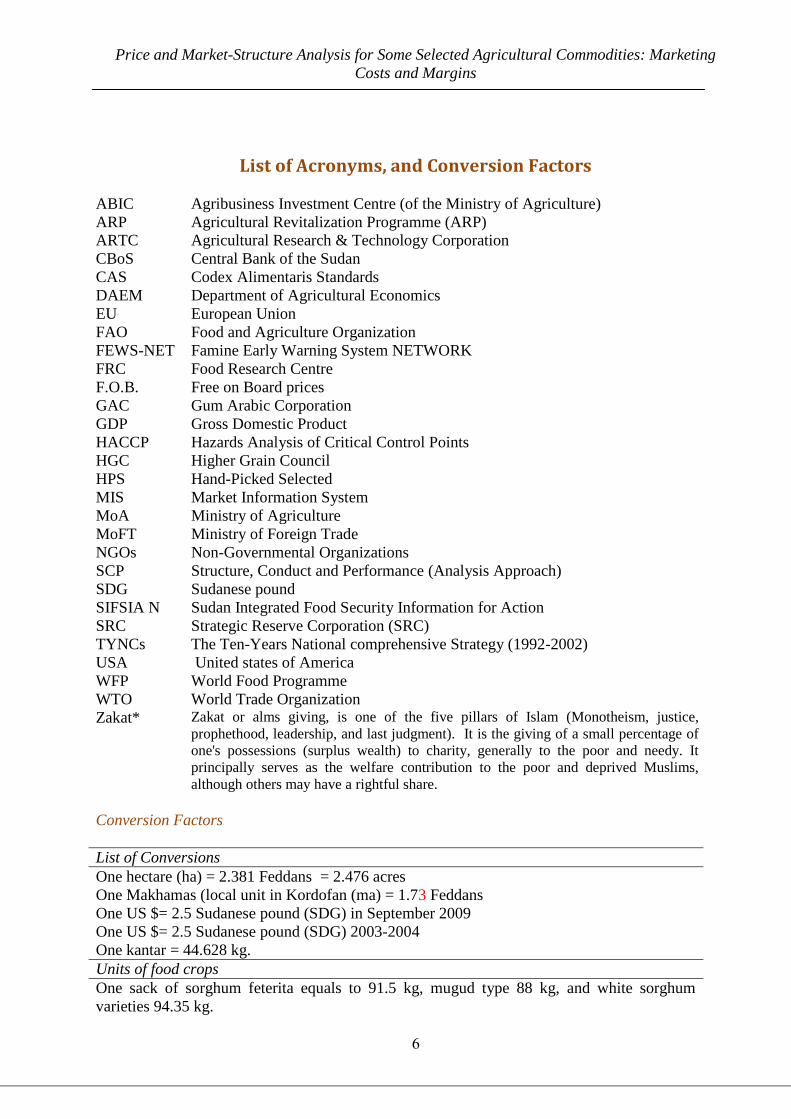
List of Acronyms, and Conversion Factors
ABIC Agribusiness Investment Centre (of the Ministry of Agriculture)
ARP Agricultural Revitalization Programme (ARP)
ARTC Agricultural Research & Technology Corporation
CBoS Central Bank of the Sudan
CAS Codex Alimentaris Standards
DAEM Department of Agricultural Economics
EU European Union
FAO Food and Agriculture Organization
FEWS-NET Famine Early Warning System NETWORK
FRC Food Research Centre
F.O.B. Free on Board prices
GAC Gum Arabic Corporation
GDP Gross Domestic Product
HACCP Hazards Analysis of Critical Control Points
HGC Higher Grain Council
HPS Hand-Picked Selected
MIS Market Information System
MoA Ministry of Agriculture
MoFT Ministry of Foreign Trade
NGOs Non-Governmental Organizations
SCP Structure, Conduct and Performance (Analysis Approach)
SDG Sudanese pound
SIFSIA N Sudan Integrated Food Security Information for Action
SRC Strategic Reserve Corporation (SRC)
TYNCs The Ten-Years National comprehensive Strategy (1992-2002)
USA United states of America
WFP World Food Programme
WTO World Trade Organization
Zakat* Zakat or alms giving, is one of the five pillars of Islam (Monotheism, justice,
prophethood, leadership, and last judgment). It is the giving of a small percentage of
one's possessions (surplus wealth) to charity, generally to the poor and needy. It
principally serves as the welfare contribution to the poor and deprived Muslims,
although others may have a rightful share.
Conversion Factors
List of Conversions
One hectare (ha) = 2.381 Feddans = 2.476 acres
One Makhamas (local unit in Kordofan (ma) = 1.73 Feddans
One US $= 2.5 Sudanese pound (SDG) in September 2009
One US $= 2.5 Sudanese pound (SDG) 2003-2004
One kantar = 44.628 kg.
Units of food crops
One sack of sorghum feterita equals to 91.5 kg, mugud type 88 kg, and white sorghum
varieties 94.35 kg.
Price and Market-Structure Analysis for Some Selected Agricultural Commodities: Marketing
Costs and Margins
7
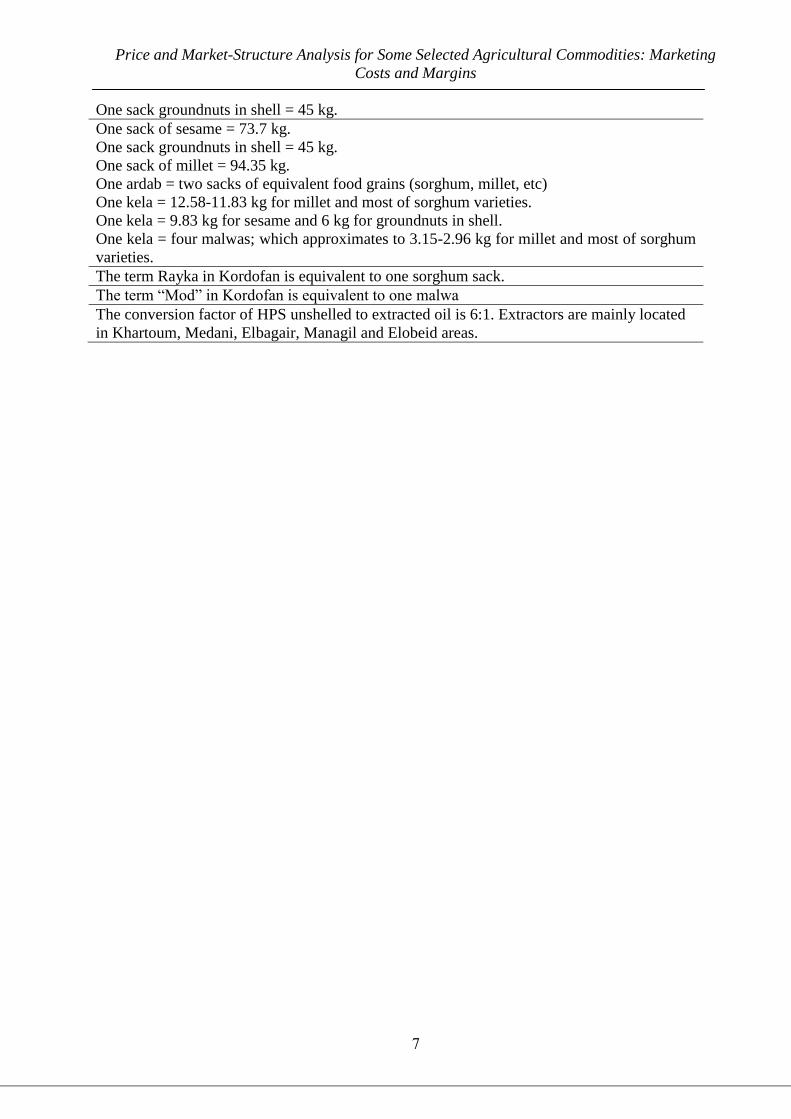
One sack groundnuts in shell = 45 kg.
One sack of sesame = 73.7 kg.
One sack groundnuts in shell = 45 kg.
One sack of millet = 94.35 kg.
One ardab = two sacks of equivalent food grains (sorghum, millet, etc)
One kela = 12.58-11.83 kg for millet and most of sorghum varieties.
One kela = 9.83 kg for sesame and 6 kg for groundnuts in shell.
One kela = four malwas; which approximates to 3.15-2.96 kg for millet and most of sorghum
varieties.
The term Rayka in Kordofan is equivalent to one sorghum sack.
The term ―Mod‖ in Kordofan is equivalent to one malwa
The conversion factor of HPS unshelled to extracted oil is 6:1. Extractors are mainly located
in Khartoum, Medani, Elbagair, Managil and Elobeid areas.
Price and Market-Structure Analysis for Some Selected Agricultural Commodities: Marketing
Costs and Margins
8
List of Annexes
Annex 1.1: Determining elements of market performance that affect food security and early
warning Performance indicators/ attributes
62
Annex 2.1: The Description and Application of Basic Approaches in Studying Marketing 63
Annex 2.2: Various Price Analysis Techniques Used in Market Assessment 63
Annex 3.1: Sorghum Producer price, Retail, and Price Spreads (SDG) by Different States 64
Annex 3.2: Millet Producers Price, Retail, and Price Spreads (SDG) by Different States 64
Annex 3.3: Development of average wholesale prices of main cereals in Sudan 2000-2008* 66
Price and Market-Structure Analysis for Some Selected Agricultural Commodities: Marketing
Costs and Margins
9
Executive Summary
The analysis on this study was based on the data and reports made by the Department of
Agricultural Economics of the Ministry of Agriculture in 2009 - using multi-stage random sampling
techniques for traders and other market participants. The sample of the study covered 1,310
respondents along the market value chain covering 5 - 6 crops, including livestock in five states.
The data was analyzed using descriptive statistics, and simple margin analysis supplemented by bi-
variate analysis. The study focuses on Gedaref, Khartoum, Kordofan, and Sinnar markets. The
retail, wholesale and exporters‘ marketing margins, and pricing efficiency of selected agricultural
crops/commodities were assessed.
According to the study, marketing costs vary considerably among crops and across states, but
remain moderately acceptable within the given market conditions, except for few cases. However,
there are no significant differences between marketing costs of various marketing functions
(storage, transport, and handling) among the different states/regions.
The relatively higher marketing costs of cash crops (gum Arabic, sunflowers and Hibiscus
karkaday) is attributed to the various fees and levies at Port Sudan and across the way to the
destination. Therefore, there is a need for improvement via adoption of a set of policies that can
lead to an improvement in yield and productivity and reduce production costs.
Some of the crops that tend to have higher marketing costs and fewer returns will obviously have
less comparative advantage in domestic as well as the international markets and hence would need
to improve before they enter into trade cycle as this affects farmers negatively. However, some
agronomic and institutional constraints need to be resolved to make commodities competitive in the
world market. To increase farmer‘s share in the retail market value of oil seeds (sesame and
groundnuts), cooperative rings seems to be appropriate to help sesame producers to bridge the
period of critical harvest needs to develop strong bargaining power at the later stages. This would
make revenue shares more equitable with potential wholesalers and big traders.
A comparison between farm gate and retail prices reveals that sorghum price spreads in Blue Nile
state was the widest and this reduced the producer share to 47% of consumer‘s price as compared to
other states in which the producer‘s share was in the range of 77% and 91% of the retail prices.
Hence, any abnormal increase in price spreads can inflate retail prices and consequently deflate
farm gate prices. On the other hand, the relatively low price spreads in White Nile, Sinnar, and
Gedaref suggests less transport and storage differentials in addition to low margins for
intermediaries.
According to the analysis done on selected cash crops, the producer‘s share to total earning varies
significantly among states. Gedaref and Sinnar are comparable in the farmers share in consumer‘s
price, marketing costs, and hence have equal farm-to-retail price spreads. However, the most
affected by these price differentials are farmers in North Kordofan who get only 48% of consumer‘s
price compared to farmers in the Blue Nile who reached a level of 93% of export prices (F.O.B.). In
another note, except for Gedaref, the sesame exports prices (SDG/ton) are almost equal to prices of
domestically traded oil at specific conversion rates. This discourages the tendency to export sesame
as long as domestic market can give same price or even higher.
Price and Market-Structure Analysis for Some Selected Agricultural Commodities: Marketing
Costs and Margins
11
Gedaref state has the biggest share in sorghum production in the country; therefore, assessment of
marketing shares of various intermediaries in the State is of particular importance. Like the country
aggregates, Gedaref showed the same pattern of margins distribution. Assemblers have the biggest
share in net margins accounting to almost 4.3% of the producer‘s prices and 3.6% of consumers‘
price. Although wholesalers share the highest marketing costs among the three partners, yet they
receive less net margins compared to assemblers and retailers. Differences in net margins shares
between assemblers and wholesalers were within the limit of (2% of both sorghum producer‘s and
consumer price). Worth to note is that, most of the traders assume no opportunity costs for their tied
up capital, family labour or own employment.
The analysis of marketing costs and margins of survey data shows returns (in SDG/ton) to
assemblers, processors, wholesalers and retailers for trading one-ton of sesame oils produced and
retailed in Gedaref in September 2009. According to the survey results, producing oil out of sesame
seed is not profitable for processors. However, retailers enjoy the biggest share in net margins as
compared to wholesalers. Despite their high marketing costs, assemblers might have same returns
obtained by wholesalers.
The role of Strategic Reserve Corporation in making successful interventions to stabilize prices was
not observed in all the markets studied. Thus, and in the absence of reliable stock reserves policy
and lack of its implementation, producers will incur serious losses at the beginning of every supply
season, and good profit margins go for traders, particularly to sesame and groundnut traders,
especially at the peak of the lean season.
The study suggests, establishing a marketing agency to help exporters in international marketing
and export trade, which requires special type of skills, incentives, incubation and support. In
conclusion, improving market communication and market information systems as well as reduction
in transport costs, increase storage capacity, and improvement in handling means will improve the
marketing margins, reduce transaction costs and hence leads to improved market efficiency.
Price and Market-Structure Analysis for Some Selected Agricultural Commodities: Marketing
Costs and Margins
11
1. INTRODUCTION AND BACKGROUND TO THE STUDY
1.1 Agriculture and Agricultural Markets
1.1.1 Agriculture and its Relation to Markets
Despite the general decline in its contribution to the total GDP (from 49.8% in the year 1999 to
38.7%, 35.3% and 31.1% in 2003, 2007 and 2009, respectively) (CBoS, 2009), it is still the
mainstay in the economic growth, maintains livelihood to about 70% of the population and
provides about 50% of the non-oil export earnings.
Agriculture‘s declining contribution to the country's GDP is ascribed to the focus provided to the
oil sector, which had masked off the overwhelming contribution of the agricultural sector1 to the
national economy. The oil sector, which contributes about 23.8% to the country GDP, take more
than 90% of total export earnings and leaving the remaining 10% for other exports including
agricultural exports (Ibid, 2009).
The overall performance2 of agriculture depends, not only on efficiency of production or supply,
but also on marketing efficiency, particularly the agricultural markets that play an important role in
this regard. It is believed that, if marketing infrastructure, which is essential to agricultural markets,
is adequate, the performance of the entire agricultural sector planning can eventually improve.
1.1.2 Agricultural Markets Structure
Agriculture markets in the Sudan could be categorized according to the structure, periodicity,
location and types of crops sold. For most crops, the present marketing arrangements for
agricultural commodities consist of tertiary markets (at the village level), wholesale assembling
markets, and primary or terminal markets usually located in cities and urban centres. Regarding
periodicity, most markets at the village level are held on weekly basis whereas some of them are
held on daily basis. In areas with easy access to transport, markets held twice a week where
difficulty in access to markets can extend its periodicity to even every fortnight.
Generally, marketing systems have three main broad functions: a logistical function, an
informational function and a distributional function. The logistical function includes not only
transformation of goods over time (storage), but also embraces place (transportation), and form
(processing) activities. Therefore, marketing can eventually generate ownership, form, time, and
1 The total arable land is estimated to be 84 million hectares, 20% of it is under rain fed cultivation (15 million
hectares) and the rest is under irrigation (1.7 million hectares). Forest resources cover about 63 million hectares and the
pastoral land covers almost same area (63 million ha).
2 Marketing productivity, efficiency and effectiveness are synonymous terms that show various aspects of the
performance of the marketing system (Wind, 1968).
Price and Market-Structure Analysis for Some Selected Agricultural Commodities: Marketing
Costs and Margins
12
place utilities that can meet the ever-increasing consumers‘ demand, particularly for food
commodities.
In this context, understanding the structures and types of the agricultural markets, the conduct of
market participants, and the physical performance -including the delineation of their relationships
to ideal market economies- is a prerequisite and a requirement for any market development and
growth in Sudan. This argument seems obvious for some markets still might behave differently
compared to other markets under same conditions. For this reason, the importance of studying the
market structure, conduct and performance becomes of value as it gives an indication of how the
situation on which markets stand is, and gives further knowledge on their operational mechanisms
in order to provide recommendation for improvement.
Market information usually provides hints to policy makers on the overall performance of
agriculture- the driving momentum - through price signals and thus subsequently links food deficit
areas to surplus areas, domestic markets to international markets and vice versa. Moreover, the
study of marketing costs and margins serves in the evaluation of the marketing performance for
both input and output markets and across the entire market or value chain. Yet, in the environment
of Sudan, it has been extremely difficult to answer questions as whether farmers, agribusiness
suppliers, traders and other middle-men receive fair share of prices paid by the consumers. In
addition, it could be even more difficult to judge whether each actor is satisfied with the type of
product services provided by other market participants, thus comes the question of the importance
of margins‘ analysis to marketers.
The importance of marketing costs and margins is quite evident in agribusiness planning and
strategy design. This study shall provide a consistent theoretical foundation on their usefulness as
evaluation techniques could help researchers in generating sensible alternative measures that
answers the most important questions in relation to performance and efficiency criteria in Sudan‘s
agricultural markets, both crop and livestock.
1.2 Rationale of the Study
Despite the many marketing studies made on dry and irrigated farming, few of them have focused
on revising agricultural markets‘ efficiency, performance, and market development. Consequently,
there is limited information on marketing costs and margins, and price spreads of agricultural
commodities in Sudan. Therefore, the study comes to fill in these information gaps and form basis
on agricultural markets and links further between knowledge on marketing margins, pricing
efficiency and market development to other spheres that contribute, at large, to agricultural
development and economic growth.
This study shall add to the growing literature on marketing efficiency analysis and addresses
specific issues in relation to the agricultural markets in Sudan. In this regard, the study shall verify
the reasons mentioned by Richards et al (1998) that usually make retail-farm margins of interest to
agribusiness entrepreneurs and policy makers. In this direction, their observations, which need to be
verified, tend to include the following arguments:
a) Wider margins mean that growers obtain a smaller share of the retail price, and hence mean
lower farmers revenue.
Price and Market-Structure Analysis for Some Selected Agricultural Commodities: Marketing
Costs and Margins
13
b) The extent to which margins‘ growth is not due to higher marketing costs can suggest
inefficiencies somewhere in the marketing chain/channel as due to market powers3, on
either the buying or the selling side, downstream from the farm.
c) The degree of uncertainty in returns to a crop is of vital importance in farmers‘ decisions—
particularly to growers who may not have access to future markets or crop insurance.
Considering the aforementioned reasons/arguments for margins‘ analysis, the rationale to this
study would be to seek new options to promote alternative strategies for those disadvantaged
farmers, which face high costs because of tangible physical obstacles and or other reasons. Along
this line of argument, the government interventions in production and marketing of many crops
had been reduced, notably with respect to the abolition or curtailing of public marketing boards as
the case of oilseeds and gum Arabic corporations. Other examples include the wheat import policy
and the recent deregulation of the Gum Arabic Company monopoly, and a shift away from pan-
territorial and pan-seasonal crop pricing strategies and pre-announced prices (Project document,
2009).
The challenge ahead for this study -next steps- is how to make use of available data to better
explore price formation of the commodities sold in these markets and eventually evaluate the
technical and policy options for improving their marketing efficiency.
1.3 Objectives
The major goal of this study is to analyse the operational efficiency and effectiveness of the
marketing chain of the main agricultural commodities in Sudan to arrive at some remedial policy
options.
Specific objectives of this study:
a) Apply an agreed upon methodology in computing price spreads viz. marketing costs and
margins for selected agricultural commodities in order to understand why and when prices
rise or fall and the potential factors influencing that phenomena,
b) Determine the market share –costs and margins– for market participants (wholesalers,
traders, traders and middlemen),
c) Determine the marketing channels and analyze the value chains for selected crop/
commodities in order to reveal constraints and suggest remedial actions,
d) Draw conclusions on marketing efficiency of selected crop commodities, recommend
actions for improvement and indicate areas for further analysis and research.
e) Assess the various policies that influence exports and the domestic market performance
(viz. taxes, levies, etc.).
3 Market powers and informational asymmetries are often cited as reasons for slow margin adjustment in response to
change in underlying supply and demand conditions. Whereas retail prices respond quickly to price increases, farm
prices often take time to adjust (Richard et al 1998).
Price and Market-Structure Analysis for Some Selected Agricultural Commodities: Marketing
Costs and Margins
14
1.4 Scope, Plan and methodology of the Study
Building on previous experiences, the study will provide generic information on costs and margins
in agricultural markets. The required information covers various market levels, typically local,
national, regional, and international markets. The analysis relies on information from a survey
carried out by DAEM in 2009 in both the semi-mechanized and traditional rain-fed areas including
assemblers, wholesalers, exporters, processors and retailers in Gedaref, Blue Nile, White Nile,
North Kordofan, Sinnar and Khartoum states in addition to Port Sudan Harbour for exports.
Additional information from various secondary sources is also used.
This study should be viewed as an integral part of the former report made by DEAM in 2009
(Marketing cost margin, February 2010), which finally supports the comprehensive food security
programme initiated by SIFSIA North.
The study raises many questions in market area and gives specific answers to some policy issues,
which relate to costs and margins for selected agricultural crops/commodities. Using the functional
and system approach in market analysis, the scope of the study permits both vertical analysis within
each crop/commodity sector and horizontal analysis between the similar agricultural commodities
of same transaction patterns. The scope of the study goes to a wide variety and multifaceted
perspectives in marketing functions (transportation, storage, and processing, institutional and
regulatory issues) that help decision-makers, traders, and intermediaries in their decisions.
In general, the study attempts to provide generic overview of agricultural markets‘ structures,
channels, commodity flows, along the market value chain of selected crops and markets. Focus is
made on information and analysis on marketing costs and margins, factors influencing the price
structure, and state of market competitions for these selected crops and markets.
Where data availability on price permits, time series analysis and qualitative analysis will be used
to strengthen and support the findings of the cross-sectional data.
The analysis goes beyond domestic markets illustrating further the relative price relationships using
terms of trade for selected agricultural commodities for international price comparisons (F.O.B.
prices). Again, the available information can be used within the framework of study ToRs to assess
markets integration, gross margins and cereal price spreads analysis to show how spatial price
variation could affect surplus and deficit markets4.
The survey conducted consisted of a set of questionnaire forms where each form was used at a
particular market level. The data sources include Ministry of Agriculture, Department of
Agricultural Statistics, Ministry of Animal Resources and fisheries, the Central Bank of Sudan, the
Strategic Reserves Corporation and SIFSIA Market Bulletins, and World Bank reports. Most of the
data and analysis made for costs and margins in this study relied heavily on this survey and whose
results were shown by a study made by the Department of Agricultural Economics – Marketing
Section DAEM– (2009).
Price and Market-Structure Analysis for Some Selected Agricultural Commodities: Marketing
Costs and Margins
15
Three rural markets feeding their respective state-central- markets were selected in the survey of
2009. About 50 questionnaires per rural market, totalling 150 questionnaires for the Gedaref rural
markets were chosen assuming 10 questionnaires per each commodity. These covered sorghum,
millet, sesame, sunflower, and gum Arabic in Gedaref state. For the wholesale market of Gedaref,
there were 15 questionnaires per each commodity, totalling to 75 questionnaires (five commodities
*15 questionnaire respondents) for the Gedaref wholesale market only. Similarly, there were
options for sesame, sunflower, and gum Arabic for retail market in Gedaref since they were
exported abroad or sold to the manufacturing industry domestically. Twenty respondents (two
commodities*10 questionnaires) were chosen for the remaining commodities (sorghum and millet).
This was repeated for the rest of the markets and the commodities. In addition, questionnaires were
designed for export and manufacturing factories and were filled duly. The sample size will be 1510
(see Annex).
A conceptual framework for data needed in costs, margins and returns for selected
crop/commodities were derived followed by a comprehensive desk review of the existing literature
in relation to marketing costs and margins. Data5 collected from previous survey reports were
revisited, revised, and validated to accomplish the mission of the study as prescribed by the terms
of reference (Annex 1.1).
Various approaches and techniques were used in the analysis of marketing costs and margins. In
particular, the positive analysis approach was used for this purpose, and a range of standardized
procedures and simple statistical tools were used. In this regard, the measures of central tendency
(as the means and averages) and measures of dispersion (standard deviations and the range were
used). For efficiency and behavioural analysis, the markets Structure, Conduct, and Performance
approach (SCP) is found more appropriate in understanding how costs and margins interact as
related to market behaviour6 (Annex 2.2). To achieve the study objectives, focus was made on
information from selected traditional surplus and deficit region(s)/ state(s).
1.5 Organization of the Study
The study is divided into four main chapters. The first Chapter starts by an introduction and
background to agriculture and agricultural markets in Sudan with particular focus on market
structures, costs, margins and returns. It describes the importance of costs and margins analysis to
agribusiness planning and strategy design and goes further to justify and provide the rationale for
making the study in addition to the delineation of the scope and plan of working out this paper.
Chapter II describes the conceptual framework and methodological approaches, definitions, and
concepts in relation to marketing costs and margins. The chapter highlights the conceptual
problems of computing the marketing costs and margins and comments on spatial pricing efficiency
of selected crop and agricultural commodities.
5 Data consistency, reliability, timeliness, was assumed for data obtained by the DEAM survey (2009). Historical data
was used to complement the overall picture of price analysis. Additional information of price and market databases was
taken from SIFSIA N, FAO.
6 Structure Conduct Performance (SCP) is an analytical approach or framework used to study how the structure of the
market and the behaviour of sellers of different commodities and services affect the performance of markets, and
consequently the welfare of the country as a whole (FEWS-NET, 2008)
Price and Market-Structure Analysis for Some Selected Agricultural Commodities: Marketing
Costs and Margins
16
Details on marketing channels, price structures and returns (to market participants) and the various
components that affect the supply chain are discussed in chapter III. These elements are analyzed in
various sections to include transport costs, handling costs, storage costs, and other marketing costs
and services. The chapter devotes entire sections to analyze returns and margins to farmers, traders,
and intermediaries by state. The distribution of gross margins per commodity and the impact of
productivity on costs and returns are also highlighted in chapter III. Conclusions, recommendations,
policy implications, and the way forward for the marketing cost margins‘ analysis is given in
chapter IV. References and annexes are cited where appropriate together with recommended
readings and further research.
Price and Market-Structure Analysis for Some Selected Agricultural Commodities: Marketing
Costs and Margins
17
2. CONCEPTUAL FRAMEWORK AND METHODOLOGICAL APPROACHES
2.1 Definitions and Concepts
Margins represent the price charged for one or a collection of marketing services. For example, the
difference between producer and consumer prices is the amount charged for all the marketing
services rendered between production and consumption, including buying, bulking, transports,
storage, processing, etc. In this circumstance, the market margins are the difference between prices
at two market levels. Marketing margin is defined as the difference between the price paid by
consumers and that obtained by producers. It is also called the ‘Farm‐Retail Price Spread‟. Margins
can be calculated all along the market chain and each margin reflects the value added at that level
of the market chain (FEWS NET 2009-b).
The aim of the marketing margin analysis is to show the relative importance of the marketing costs
in order to reveal real differences between and among markets (inter-market variations) to allow
further market integration. The target remains the producer‟s share that revolves and gears up the
production and marketing mechanisms for the achievement of food security and social welfare
objectives.
For the purpose of this study, a distinction is made between Gross Market Margins and Price
Spread. Funke (2006) cited a difference between spreads and margins. Price Spread is the
difference between the retail price and the farm value of a product. Thus, the spread represents the
payment of all costs involved after the product has left the farm plus the profit margins. Marketing
margins on the other hand, represent the difference between the sales of a given product and the
costs of the product sold. In this case the margin is typically the profit made under a given market
condition.
a) Concepts
Agricultural marketing costs can be differentiated into three distinct types of costs a) direct costs
that involve direct marketing functions and services viz. transportation and assembly costs,
handling costs (loading, unloading, repackaging, etc.), processing and storage costs as well as other
costs as taxes, levies, customs and duties. b) The operating costs, which include the opportunity
cost of the tied-up capital (usually taken as percent of annual profits as determined by the Central
Bank and c) physical losses arising from transportation, storage loss or processing (in value terms)
as a percentage of the initial market crop value.
The concept of margins analysis offers, in principle, the chance for better understanding of
Sudanese market conditions such as different priority setting among decision makers and concerned
shareholders, administrative and bureaucratic hurdles, capacity constraints and the uncompromising
delays in the transfer of resources to conduct costs and margins surveys by concerned bodies. These
problems have significantly reduced the efficiency and the effectiveness of results obtained from
research work on marketing performance.
Price and Market-Structure Analysis for Some Selected Agricultural Commodities: Marketing
Costs and Margins
18
2.2 On the Concept of Marketing Costs and Margins
Theoretically, the analysis of marketing costs and margins would reveal how efficient pricing in
domestic markets is, and gives an indication of the importance of transaction costs facing traders,
farmers and intermediaries (middlemen) and help in identifying and solving bottleneck thus assist
in reducing marketing costs. Understanding the concept of market costs and margins requires a
priori understanding of the marketing chains or channels under question and a prescription of how
long is it. Details on this issue are given in a separate section in chapter III.
In practice, the flow of agricultural commodities usually starts at the farm, (sometimes passed
through a storage phase) and/or goes directly to rural (tertiary) markets where stored or passed to
secondary markets where intermediaries (middlemen) and wholesalers start purchase sizable stocks
and convey it to primary or main markets and/or to storage. From this final marketplaces the goods
usually sold for retailers/wholesalers and big companies for export. Smith (1992) has made an
elaboration on the concept of costs, margins and mark-ups. Following his elaborations, the farmer‘s
share of retail price can be shown as a percentage of the retail price as:
Price Retail
100 X Price gate Farm(%) share Famers'
As we are interested in the total costs of marketing, the percentage total gross margins can be
obtained by the formula
Price Retail
100 X Price gate Farm - price Retail(%)Margin Gross Total
Alternatively, the difference between the retail price and the farm gate price can be computed as a
percentage of the farm gate price to give the percentage total mark-up7:
Price gate Fram
100 X Price gate Farm - Price Retail(%) up-Mark Total
A complete analysis of price spread or marketing margin is only possible through an analysis of the
complete set of market-behaviour equations (Carambas, 2005). However, and based on data
constraints, the study made focus on the above reduced form of equations to estimate and draw
implications on price spreads, producers‘ share from available data.
Theoretically, the level of mark-up is related to the market structure of a particular industry i.e. it is
particularly higher in concentrated industries than in least concentrated ones. The Mark-up ratios
can be used as indicators of competitive pressure as well as an indication of innovation rents
(Riadh, 2001). In general, variations in percentage of any of the three formulae do not necessarily
mean efficiency as there is some technical information that should be taken into consideration.
Worth to take into account both spatial and temporal differences when computing costs and
margins.
7 From above relationships, one should be keen to know whether the gross margins or mark-ups are used in
computations in any negotiation report. This is because a percentage of mark-up will always be greater than a
percentage gross margin if they refer to the same situation. Policy makers must be aware, that trade unions usually
sensationalize the cost of marketing by using the mark up calculations rather than the gross margins in their allegations.
Price and Market-Structure Analysis for Some Selected Agricultural Commodities: Marketing
Costs and Margins
19
3. MARKETING CHAINS, COSTS, PRICE STRUCTURE & RETURNS
3.1 Marketing Magnitude and Production Quantity
The patterns of production, stocks, imports, exports and food aid; including also surplus/ deficit
production areas both at national and state levels are key indicators to availability of food (WFP,
2008). However, there is no reliable data at the national level for the marketed surpluses; since
home consumption, storage and trade information (border illegal smuggling, waste) are mostly
subjective estimates. Even though, an attempt is made to quantify the magnitude and volumes of
trade flows of sorghum, millet, wheat, groundnuts, sesame, sunflowers, watermelon seeds and
Roselle (Hibiscus sabdarifa ‗Karkaday‘). However, available statistics on quantity of marketed
volumes of these crops focus on quantity and ignored most of the quality aspects8 due to technical
difficulties in assessing these parameters.
By tracing the marketing channels for each crop, an estimate of the magnitude and quantity traded
can be arrived at from the official records though by themselves are production estimates and not
actual market data records (Table 3.1). Likewise, it is found difficult to decompose the main cereal
commodity crops (as sorghum) by variety since data on this aspect is not widely available across
the country except in Gedaref and ElObeid markets. Therefore, adjustment for this problem is only
possible by taking sorghum cultivars as one sellable commodity irrespective of its variety origin.
The study tried to trace the changes in the direction and volume of commodity flows between
states/regions, but information is meager and sometime unavailable. However, comparing the
present data with previous years; together with the potential and/or actual movement of food from
surplus to deficit areas; including the quantity of stocks held by parastatal organizations,
wholesalers and producers; is important in market analysis (WFP, 2007). Worth to note is that,
most of factors determining the magnitude of trade flows across states– in this vastly expanding
country - are also prominent determinants of the export decision of both food (sorghum ) and cash
crops (gum Arabic, oil seeds and watermelons) and also the informal flows -as smuggling trade-
explains their market structure. However, and due to lack of data, it is occasionally feasible to
estimate the direction, and not the magnitude of trade flows across states for most of the
aforementioned crops.
Lack of information on marketed surpluses leaves a room for estimation with regard to seeds and
wastes. The usual assumption of taking 10% of the produce as seeds and wastes is ignored herein;
as there is evidence -from previous studies- that even losses and seeds will not affect the quantity
traded, as there are other informal channels including the smuggling trade, which support this
evidence. Overall, and despite the criticism made to official records and/or estimates, yet are
considered useful in filling the data gaps, as they remain the mere information source available
(Table 3.1).
8 Quality characteristics of agricultural commodities (appearance, taste, grading and standardization cleanliness etc),
safety measures (pesticides and artificial hormones, microbial contents) and authenticity that guarantee the use of
traditional process and geographical origin, which are important for agriculture and agribusiness in Sudan remain only
hypothetical (Giovannucci, 2001).
Price and Market-Structure Analysis for Some Selected Agricultural Commodities: Marketing
Costs and Margins
21
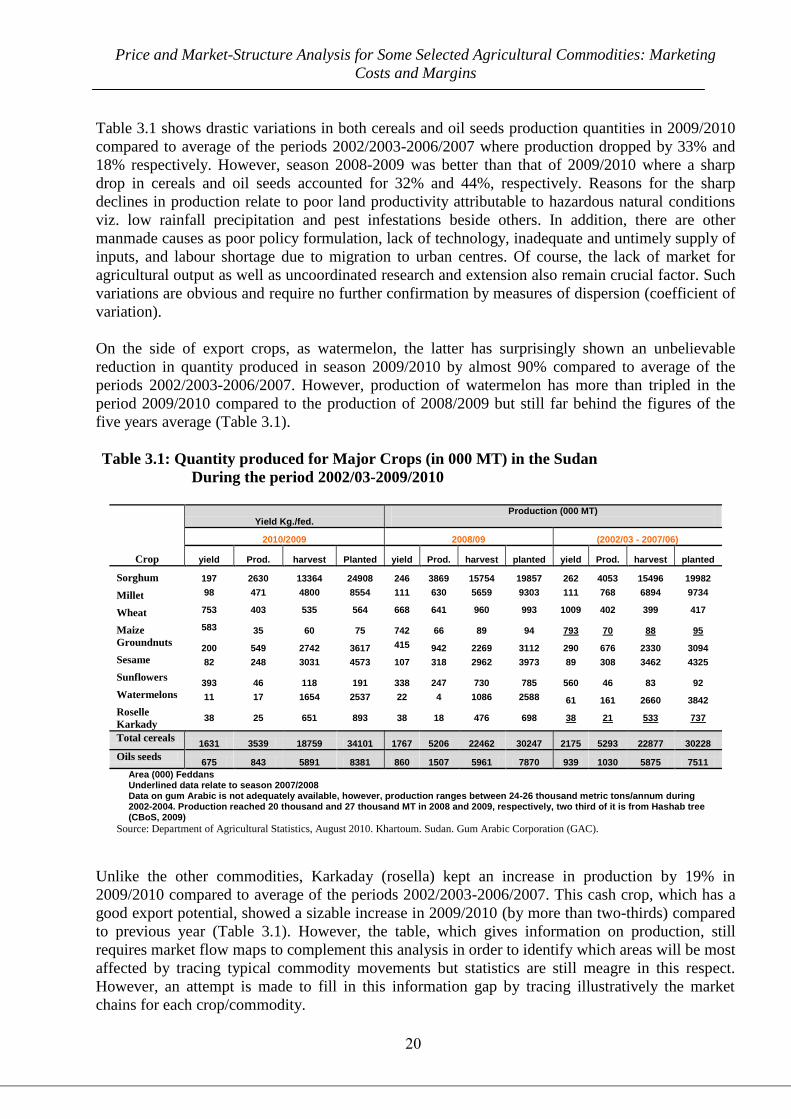
Table 3.1 shows drastic variations in both cereals and oil seeds production quantities in 2009/2010
compared to average of the periods 2002/2003-2006/2007 where production dropped by 33% and
18% respectively. However, season 2008-2009 was better than that of 2009/2010 where a sharp
drop in cereals and oil seeds accounted for 32% and 44%, respectively. Reasons for the sharp
declines in production relate to poor land productivity attributable to hazardous natural conditions
viz. low rainfall precipitation and pest infestations beside others. In addition, there are other
manmade causes as poor policy formulation, lack of technology, inadequate and untimely supply of
inputs, and labour shortage due to migration to urban centres. Of course, the lack of market for
agricultural output as well as uncoordinated research and extension also remain crucial factor. Such
variations are obvious and require no further confirmation by measures of dispersion (coefficient of
variation).
On the side of export crops, as watermelon, the latter has surprisingly shown an unbelievable
reduction in quantity produced in season 2009/2010 by almost 90% compared to average of the
periods 2002/2003-2006/2007. However, production of watermelon has more than tripled in the
period 2009/2010 compared to the production of 2008/2009 but still far behind the figures of the
five years average (Table 3.1).
Table 3.1: Quantity produced for Major Crops (in 000 MT) in the Sudan
During the period 2002/03-2009/2010
Production (000 MT)
Yield Kg./fed.
(2002/03 - 2007/06) 2008/09 2010/2009
Crop planted harvest Prod. yield planted harvest Prod. yield Planted harvest Prod. yield
19982 15496 4053 262 19857 15754 3869 246 24908 13364 2630 197 Sorghum
9734 6894 768 111 9303 5659 630 111 8554 4800 471 98 Millet
417 399 402 1009 993 960 641 668 564 535 403 753 Wheat
95 88 70 793 94 89 66 742 75 60 35 583 Maize
3094 2330 676 290 3112 2269 942 415 3617 2742 549 200 Groundnuts
4325 3462 308 89 3973 2962 318 107 4573 3031 248 82 Sesame
92 83 46 560 785 730 247 338 191 118 46 393 Sunflowers
3842 2660 161 61 2588 1086 4 22 2537 1654 17 11 Watermelons
737 533 21 38 698 476 18 38 893 651 25 38 Roselle
Karkady
30228 22877 5293 2175 30247 22462 5206 1767 34101 18759 3539 1631 Total cereals
7511 5875 1030 939 7870 5961 1507 860 8381 5891 843 675 Oils seeds
Area (000) Feddans Underlined data relate to season 2007/2008 Data on gum Arabic is not adequately available, however, production ranges between 24-26 thousand metric tons/annum during 2002-2004. Production reached 20 thousand and 27 thousand MT in 2008 and 2009, respectively, two third of it is from Hashab tree (CBoS, 2009)
Source: Department of Agricultural Statistics, August 2010. Khartoum. Sudan. Gum Arabic Corporation (GAC).
Unlike the other commodities, Karkaday (rosella) kept an increase in production by 19% in
2009/2010 compared to average of the periods 2002/2003-2006/2007. This cash crop, which has a
good export potential, showed a sizable increase in 2009/2010 (by more than two-thirds) compared
to previous year (Table 3.1). However, the table, which gives information on production, still
requires market flow maps to complement this analysis in order to identify which areas will be most
affected by tracing typical commodity movements but statistics are still meagre in this respect.
However, an attempt is made to fill in this information gap by tracing illustratively the market
chains for each crop/commodity.
Price and Market-Structure Analysis for Some Selected Agricultural Commodities: Marketing
Costs and Margins
21
3.2 Transport and Storage Capacities
Basic transport, storage, processing, markets, information and communication infrastructures are
necessary for agricultural marketing. However, available information on transport sector and
storage was long time ago and needs updating by concerned authorities.
Of the 18,000-km transport network, 3,500 km is paved, 4000 km gravelled and the remainder is
sand or earth tracks. Reports show that, the 4800-km railway lines are obsolete except in few major
lines (Ismail, 2004). River transport is almost very minor, while airfreight of goods is limited for
light and essential goods for the substantially higher costs. Road quality (km of tarred roads per
resident) is by far very low compared to figures in developing counties and road restrictions arise
only during the rainy season in some parts of the country (seasonal restrictions). Most of the
transport means are largely owned by private sector.
Under variable seasonal conditions, supply and demand forces determine the value of transport
costs. The government permits exemptions from tariffs and taxes for newly competing companies
to develop the transport sector and this have contributed largely to the relatively reasonable
transport freight costs prevailing. Transport capacity number, type, and modes are not adequate.
The estimated intake of storage was found to be 6 million tons including various commodity items
at that time (1988); with varied regional availability and distribution, sizes, and numbers and since
has not been updated. The temporal dimension of available storage capacity cannot be guarantied
for few months. Due to the current poor storage conditions and handling procedures (mostly in bags
and not in bulk), availability and accessibility to proper storage must be revised. Of the different
storage modes9 and capacities available, the public sector contributes by almost 65% in contrast to
35% to the private sector. Most of the traditional and conventional facilities are inadequately
ventilated, often overfilled with improper storage and handling systems. No concrete data is
available with regard to an on farm storage. The available statistics estimated the on-farm storage to
be in the range of 1.3 to 1.7 million metric tons. Storage cost and fees for agricultural products
constitute rational figures as compared to commodities price values.
The sizable storage facilities are located, historically, in places following the strategy ―Think Big‖
irrespective of minimizing the combined assembly and distribution costs (Gedaref, Rabak & Port
Sudan silos are examples of 100 and 50 thousand tons respectively). Thus, storage density does not
reflect even distribution of facilities nor optimality in cost minimization. On another hand, the
storage qualities are still under question as storage losses fall in the range between 5-15%.
There is no reliable data about the capacity of processing industry related to the processing of
agricultural products, but most of these facilities are concentrated in state capitals, particularly
Great Khartoum Area.
9
Silos, modern warehouses, conventional warehouses, traditional warehouses, open air plat-forms (shunnas), granary,
and underground pits. Cold stores for fruits and vegetables are generally estimations
Price and Market-Structure Analysis for Some Selected Agricultural Commodities: Marketing
Costs and Margins
22
3.3 The Marketing Chains, Margins and Mark-Ups
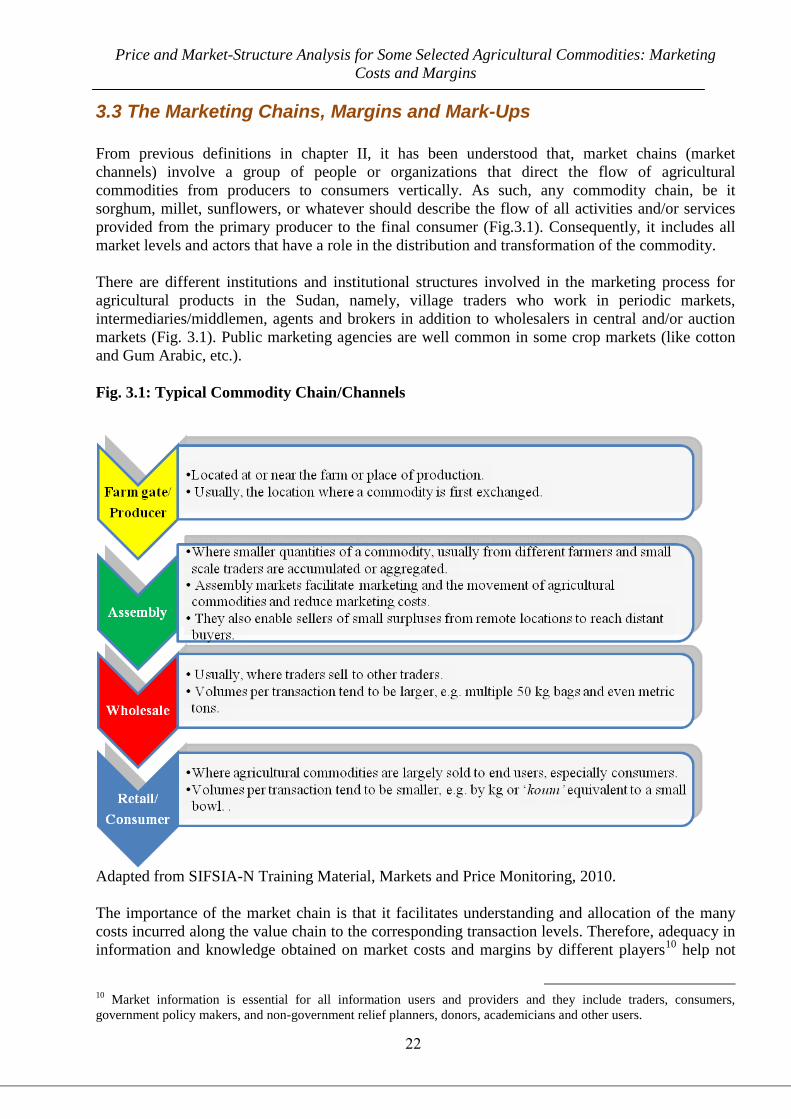
From previous definitions in chapter II, it has been understood that, market chains (market
channels) involve a group of people or organizations that direct the flow of agricultural
commodities from producers to consumers vertically. As such, any commodity chain, be it
sorghum, millet, sunflowers, or whatever should describe the flow of all activities and/or services
provided from the primary producer to the final consumer (Fig.3.1). Consequently, it includes all
market levels and actors that have a role in the distribution and transformation of the commodity.
There are different institutions and institutional structures involved in the marketing process for
agricultural products in the Sudan, namely, village traders who work in periodic markets,
intermediaries/middlemen, agents and brokers in addition to wholesalers in central and/or auction
markets (Fig. 3.1). Public marketing agencies are well common in some crop markets (like cotton
and Gum Arabic, etc.).
Fig. 3.1: Typical Commodity Chain/Channels
Adapted from SIFSIA-N Training Material, Markets and Price Monitoring, 2010.
The importance of the market chain is that it facilitates understanding and allocation of the many
costs incurred along the value chain to the corresponding transaction levels. Therefore, adequacy in
information and knowledge obtained on market costs and margins by different players10
help not
10
Market information is essential for all information users and providers and they include traders, consumers,
government policy makers, and non-government relief planners, donors, academicians and other users.
Price and Market-Structure Analysis for Some Selected Agricultural Commodities: Marketing
Costs and Margins
23
only in understanding market situations but also in enhancing competition along the food chain and
reducing price volatility and costs (Fig.3.1).
As costs and margins analysis shall be the focus, an understanding of chain functionality is
desirable, particularly, how the flow of these agricultural commodities is performed. Fig.3.1
portrays an overall picture (or framework) for the marketing chain, which describes the links
between different transaction levels that are virtually inseparable though are completely separated
and located in different places (e.g. farm-gate level, wholesale level, retail level (standard and non-
standard units), and the international level. Efficiency is an important element in chain flows.
Whilst referring to efficiency criteria we usually mean availability of transportation and storage
facilities; efficient communications; common grades and standards that facilitate trading at
distance; legal codes to enforce contracts; and credit availability to finance short-run inventories
and processing operations. These requirements, when adequately provided, can lead eventually to a
smoothly functioning marketing system. In contrast, market inefficiency or market failure is,
certainly, associated with lack, poor or non-availability of some of the aforementioned services and
activities.
Throughout this section, emphasis on market chains/channels shall be made to facilitate
understanding of the nature, direction and volumes of trading of any of these marketing systems.
Details on marketing costs and margins for cereals (sorghum, millet, and wheat), oil seeds (sesame,
groundnuts, and sunflowers) and cash crops as watermelons and Roselle (Karkaday) shall follow in
a separate section including information on livestock. Of course, the analysis of the production
costs11
and margins of these agricultural commodities would complement the marketing costs and
margins analysis and would pick up collectively more insights into the economic situation of the
agribusiness cycle regarding these aforementioned agricultural commodities/crops.
3.3.1 An Overview of Marketing Chains and Related Policy for Selected Commodities
This section helps to identify the constraints and bottlenecks facing markets, and eventually
propose solutions and remedial actions to improve their marketing efficiency. However, a major
determinant of the channel structure for any agricultural commodity is whether the crop is produced
for direct consumption or to be marketed for further agro-industrial processing. This is because the
produce intended for agro-industrial processing is usually sold directly to the manufacturer whereas
by most food commodities, the consumers make their own purchases from retail or wholesale
markets spread at different municipality levels. However, the geographic location and shifts in
consumer buying patterns will also influence the channel decision.
Another important element in commodity chains is the perishability of products like fruits and
vegetables. The characteristics of the product with short life cycle usually moves via a short
11
The study proposes an extra exercise in complement of marketing costs and margins, to include production costs in a
cost allocation model. The model, which we propose to be made in a future study, should include besides these
commodity groups, other vegetables and fruits, livestock. Among these concerns, the farm size, the farming systems,
and income indicators are important for comparison with other farming sectors.
Price and Market-Structure Analysis for Some Selected Agricultural Commodities: Marketing
Costs and Margins
24
channel direct to retailers. The lower the unit value of the product is, the longer the channel or chain
will be. Similarly, the more standardized a product is, the longer the chain/channel will be.
Conversely, the nature and extent of competition is a second factor that can impose such a choice of
channel elongation. Channel conflict may arise from a number of sources, as shall be given by a
number of examples. In order to avoid such conflicts and make smooth performance of the system,
transparency and adequate management performance for agricultural commodities is required.
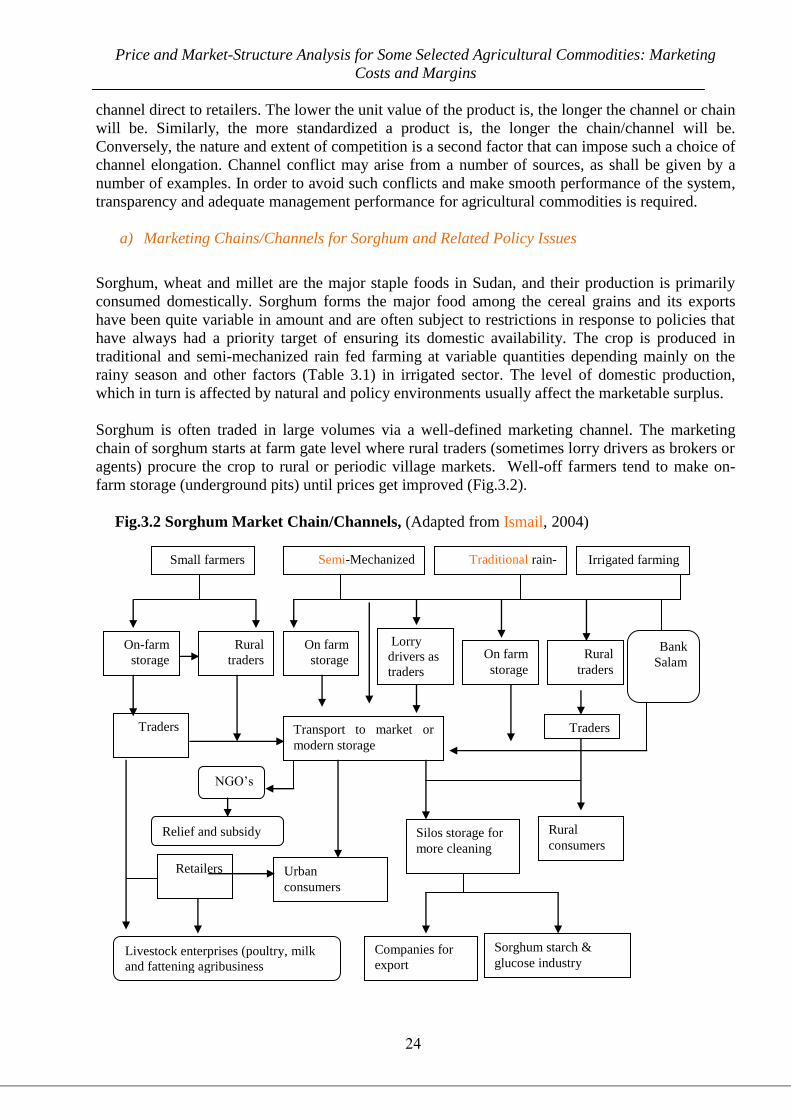
a) Marketing Chains/Channels for Sorghum and Related Policy Issues
Sorghum, wheat and millet are the major staple foods in Sudan, and their production is primarily
consumed domestically. Sorghum forms the major food among the cereal grains and its exports
have been quite variable in amount and are often subject to restrictions in response to policies that
have always had a priority target of ensuring its domestic availability. The crop is produced in
traditional and semi-mechanized rain fed farming at variable quantities depending mainly on the
rainy season and other factors (Table 3.1) in irrigated sector. The level of domestic production,
which in turn is affected by natural and policy environments usually affect the marketable surplus.
Sorghum is often traded in large volumes via a well-defined marketing channel. The marketing
chain of sorghum starts at farm gate level where rural traders (sometimes lorry drivers as brokers or
agents) procure the crop to rural or periodic village markets. Well-off farmers tend to make on-
farm storage (underground pits) until prices get improved (Fig.3.2).
Fig.3.2 Sorghum Market Chain/Channels, (Adapted from Ismail, 2004)
Small farmers
On-farm
storage
Semi-Mechanized
farming
Traditional rain-
fedfarming Irrigated farming
Rural
traders
On farm
storage
Lorry
drivers as
traders
Transport to market or
modern storage
On farm
storage
Rural
traders
Traders
Rural
consumers
Urban
consumers
Traders
Silos storage for
more cleaning
Companies for
export
NGO‘s
Relief and subsidy
Retailers
Sorghum starch &
glucose industry Livestock enterprises (poultry, milk
and fattening agribusiness
enterprises)
Bank
Salam
Price and Market-Structure Analysis for Some Selected Agricultural Commodities: Marketing
Costs and Margins
25
At the beginning of every harvest season, the produce either is moved to central/urban markets or
finds its way to storage when prices are below production costs. Depending on the relief situation,
some relief NGOs tend to buy significant amounts (usually late in the season rather than at the
beginning of the marketing season Fig. 3.2) and transport it to the needy areas in Southern Sudan or
other areas in the Western Sudan.
When harvest is good, some export companies usually tend to procure from primary/central
markets and pass the sorghum through a cleaning process from impurities at silos – (either Gedaref
or Port Sudan silos) to comply with international standards. However, considerable amount of
sorghum goes for starch and glucose industry in Greater Khartoum Area while unknown quantities
are smuggled through the eastern boarders. Besides the quantity allotted for seeds and the losses
(usually accounted for 10%), a significant portion is usually purchased by livestock enterpreneurs
for poultry, milk and fattening agribusiness (Fig.3.2).
Currently, the government role in grain marketing is minimal and frequent purchases were usually
performed by the Strategic Reserve Corporation (SRC) to either stabilize prices and/ or maintain a
strategic buffer stock for emergencies. Over the last years, the government purchases from sorghum
grain markets were variable but in all were not that much or can be considered even negligible.
Unlike in many countries, there is no Higher Grain Council (HGC12
) for this strategic commodity,
despite the substantial amounts produced and the relative importance of sorghum in food security
and the grain industry. Therefore, the current situation suggests a real government body to account
for the grain marketing policies, including provision of incentives to private sector investments
such as processing, storage and transportation vessels. On the ground, a buffer stock is monitored
by SRC under the Ministry of Finance & Economic Planning, but still with sub-optimal finance.
However, fragmentation in policy design and strategy implementation remains a salient feature of
planning in all agriculture related sectors and other economic sectors.
Until now, there is no obligatory rule to comply with unit measurements in grain markets, and the
sack, which varies between 89-100 Kg, is still the acceptable volume for transactions in sorghum
crop markets. All cereals are transported and/or stored in sacks, however, bulk storage is only
economic when bulk transportation is available, efficient and feasible; which is not currently the
case in Sudan. The capacity of the private‘s sector trucks and the handling procedures are not
designed for bulk transport except for few big milling companies (Wheata & Sayga, and Seen; and
even these privates‘ sector trucks are mainly for transporting imported wheat. Sudan railways bulk
capacity and efficiency is retarding remarkably and is contributing less than trucking modes in
flows of sorghum and other cereal.
The behaviour of market participants and their conduct in sorghum grain markets is governed by
competition rules among the competing export traders, export companies, authorized NGOs agents
and few local traders who form marketing rings; a kind of alliance of some farmers-traders on
family and/or tribal basis to control market prices. The latter attitude influences the marketing
mechanisms by giving false price signals to producers and/or consumers at every beginning of the
marketing season. Such a phenomenon is evidenced in Gedaref and the nearby crop markets in the
same state (Ismail, 2004).
12
As a matter of fact, HGC was established in 1986 (by MoA) with a mandate to cover designing policy on production,
marketing, pricing, storage and consumption of food grains, but has never come into effect and instead Strategic reserve
corporation was born to perform similar functions.
Price and Market-Structure Analysis for Some Selected Agricultural Commodities: Marketing
Costs and Margins
26
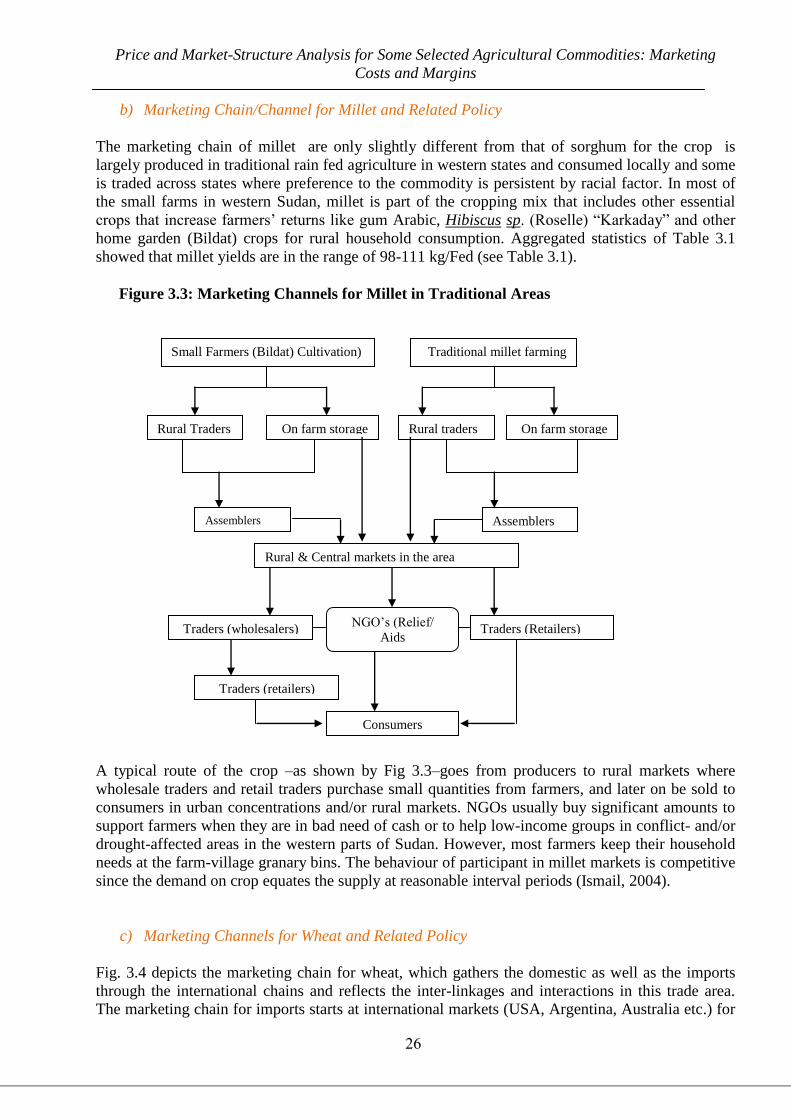
b) Marketing Chain/Channel for Millet and Related Policy
The marketing chain of millet are only slightly different from that of sorghum for the crop is
largely produced in traditional rain fed agriculture in western states and consumed locally and some
is traded across states where preference to the commodity is persistent by racial factor. In most of
the small farms in western Sudan, millet is part of the cropping mix that includes other essential
crops that increase farmers‘ returns like gum Arabic, Hibiscus sp. (Roselle) ―Karkaday‖ and other
home garden (Bildat) crops for rural household consumption. Aggregated statistics of Table 3.1
showed that millet yields are in the range of 98-111 kg/Fed (see Table 3.1).
Figure 3.3: Marketing Channels for Millet in Traditional Areas
A typical route of the crop –as shown by Fig 3.3–goes from producers to rural markets where
wholesale traders and retail traders purchase small quantities from farmers, and later on be sold to
consumers in urban concentrations and/or rural markets. NGOs usually buy significant amounts to
support farmers when they are in bad need of cash or to help low-income groups in conflict- and/or
drought-affected areas in the western parts of Sudan. However, most farmers keep their household
needs at the farm-village granary bins. The behaviour of participant in millet markets is competitive
since the demand on crop equates the supply at reasonable interval periods (Ismail, 2004).
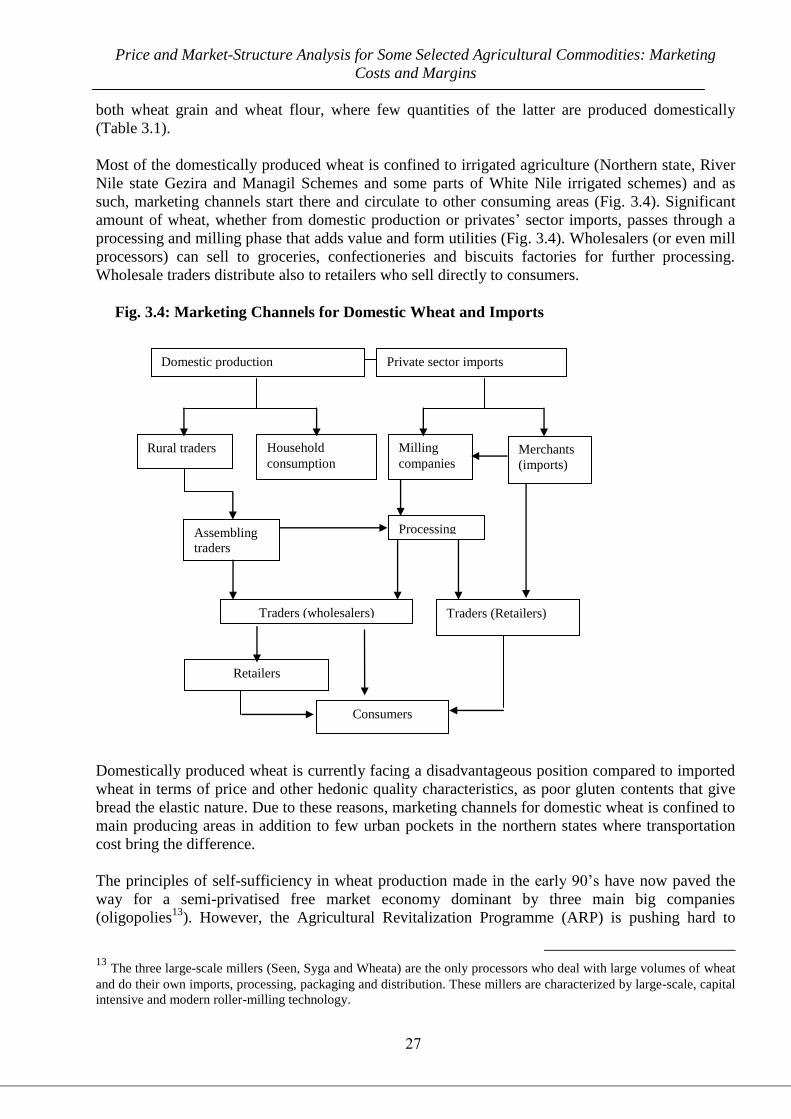
c) Marketing Channels for Wheat and Related Policy
Fig. 3.4 depicts the marketing chain for wheat, which gathers the domestic as well as the imports
through the international chains and reflects the inter-linkages and interactions in this trade area.
The marketing chain for imports starts at international markets (USA, Argentina, Australia etc.) for
Small Farmers (Bildat) Cultivation) Traditional millet farming
Rural Traders On farm storage
Traders (wholesalers) NGO‘s (Relief/
Aids
Rural traders On farm storage
Assemblers
taders Assemblers
taders
Traders (Retailers)
Consumers
Rural & Central markets in the area
Traders (retailers)
Price and Market-Structure Analysis for Some Selected Agricultural Commodities: Marketing
Costs and Margins
27
both wheat grain and wheat flour, where few quantities of the latter are produced domestically
(Table 3.1).
Most of the domestically produced wheat is confined to irrigated agriculture (Northern state, River
Nile state Gezira and Managil Schemes and some parts of White Nile irrigated schemes) and as
such, marketing channels start there and circulate to other consuming areas (Fig. 3.4). Significant
amount of wheat, whether from domestic production or privates‘ sector imports, passes through a
processing and milling phase that adds value and form utilities (Fig. 3.4). Wholesalers (or even mill
processors) can sell to groceries, confectioneries and biscuits factories for further processing.
Wholesale traders distribute also to retailers who sell directly to consumers.
Fig. 3.4: Marketing Channels for Domestic Wheat and Imports
Domestically produced wheat is currently facing a disadvantageous position compared to imported
wheat in terms of price and other hedonic quality characteristics, as poor gluten contents that give
bread the elastic nature. Due to these reasons, marketing channels for domestic wheat is confined to
main producing areas in addition to few urban pockets in the northern states where transportation
cost bring the difference.
The principles of self-sufficiency in wheat production made in the early 90‘s have now paved the
way for a semi-privatised free market economy dominant by three main big companies
(oligopolies13
). However, the Agricultural Revitalization Programme (ARP) is pushing hard to
13
The three large-scale millers (Seen, Syga and Wheata) are the only processors who deal with large volumes of wheat
and do their own imports, processing, packaging and distribution. These millers are characterized by large-scale, capital
intensive and modern roller-milling technology.
Domestic production Private sector imports
Rural traders Household
consumption
Traders (wholesalers)
Milling
companies Merchants
(imports)
Assembling
traders
Processing
Traders (Retailers)
Consumers
Retailers
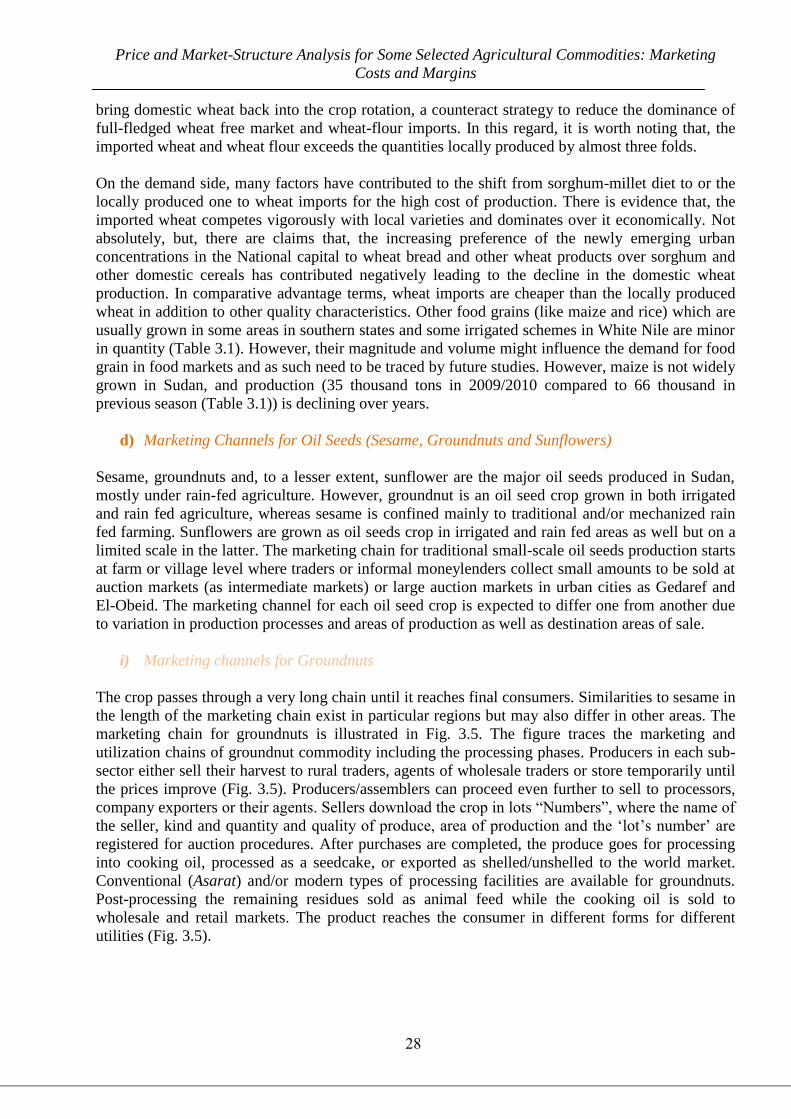
Price and Market-Structure Analysis for Some Selected Agricultural Commodities: Marketing
Costs and Margins
28
bring domestic wheat back into the crop rotation, a counteract strategy to reduce the dominance of
full-fledged wheat free market and wheat-flour imports. In this regard, it is worth noting that, the
imported wheat and wheat flour exceeds the quantities locally produced by almost three folds.
On the demand side, many factors have contributed to the shift from sorghum-millet diet to or the
locally produced one to wheat imports for the high cost of production. There is evidence that, the
imported wheat competes vigorously with local varieties and dominates over it economically. Not
absolutely, but, there are claims that, the increasing preference of the newly emerging urban
concentrations in the National capital to wheat bread and other wheat products over sorghum and
other domestic cereals has contributed negatively leading to the decline in the domestic wheat
production. In comparative advantage terms, wheat imports are cheaper than the locally produced
wheat in addition to other quality characteristics. Other food grains (like maize and rice) which are
usually grown in some areas in southern states and some irrigated schemes in White Nile are minor
in quantity (Table 3.1). However, their magnitude and volume might influence the demand for food
grain in food markets and as such need to be traced by future studies. However, maize is not widely
grown in Sudan, and production (35 thousand tons in 2009/2010 compared to 66 thousand in
previous season (Table 3.1)) is declining over years.
d) Marketing Channels for Oil Seeds (Sesame, Groundnuts and Sunflowers)
Sesame, groundnuts and, to a lesser extent, sunflower are the major oil seeds produced in Sudan,
mostly under rain-fed agriculture. However, groundnut is an oil seed crop grown in both irrigated
and rain fed agriculture, whereas sesame is confined mainly to traditional and/or mechanized rain
fed farming. Sunflowers are grown as oil seeds crop in irrigated and rain fed areas as well but on a
limited scale in the latter. The marketing chain for traditional small-scale oil seeds production starts
at farm or village level where traders or informal moneylenders collect small amounts to be sold at
auction markets (as intermediate markets) or large auction markets in urban cities as Gedaref and
El-Obeid. The marketing channel for each oil seed crop is expected to differ one from another due
to variation in production processes and areas of production as well as destination areas of sale.
i) Marketing channels for Groundnuts
The crop passes through a very long chain until it reaches final consumers. Similarities to sesame in
the length of the marketing chain exist in particular regions but may also differ in other areas. The
marketing chain for groundnuts is illustrated in Fig. 3.5. The figure traces the marketing and
utilization chains of groundnut commodity including the processing phases. Producers in each sub-
sector either sell their harvest to rural traders, agents of wholesale traders or store temporarily until
the prices improve (Fig. 3.5). Producers/assemblers can proceed even further to sell to processors,
company exporters or their agents. Sellers download the crop in lots ―Numbers‖, where the name of
the seller, kind and quantity and quality of produce, area of production and the ‗lot‘s number‘ are
registered for auction procedures. After purchases are completed, the produce goes for processing
into cooking oil, processed as a seedcake, or exported as shelled/unshelled to the world market.
Conventional (Asarat) and/or modern types of processing facilities are available for groundnuts.
Post-processing the remaining residues sold as animal feed while the cooking oil is sold to
wholesale and retail markets. The product reaches the consumer in different forms for different
utilities (Fig. 3.5).
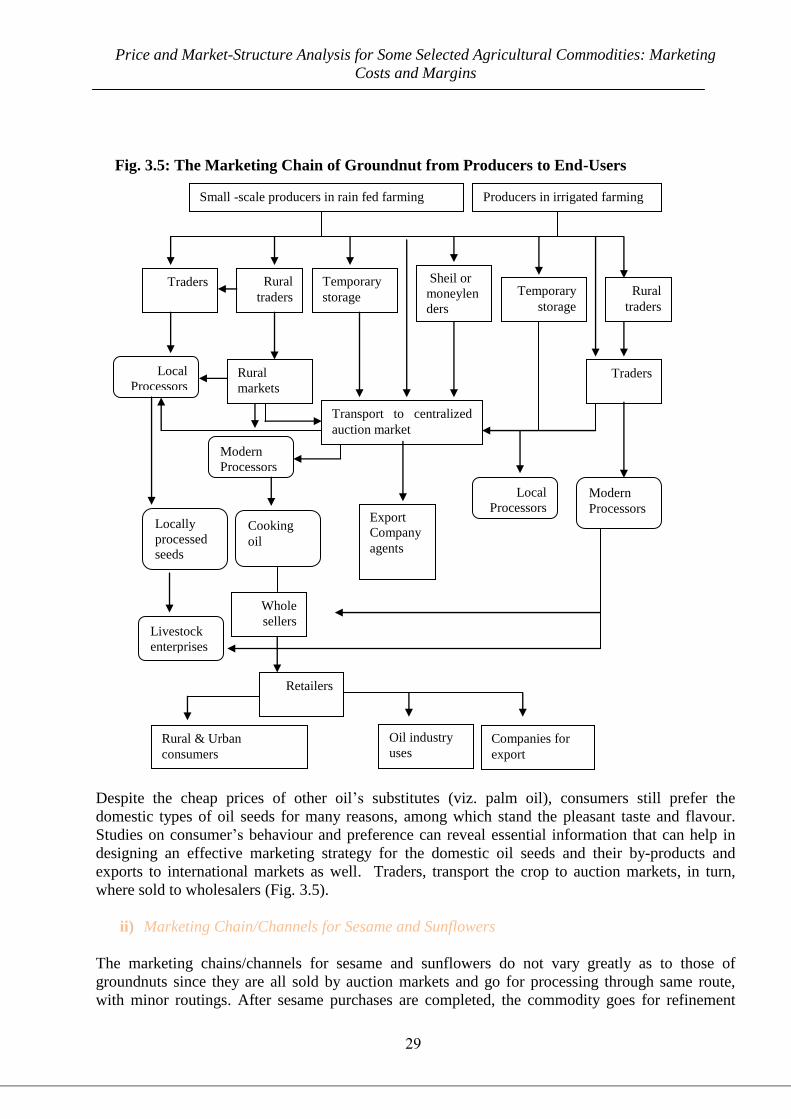
Price and Market-Structure Analysis for Some Selected Agricultural Commodities: Marketing
Costs and Margins
29
Fig. 3.5: The Marketing Chain of Groundnut from Producers to End-Users
Despite the cheap prices of other oil‘s substitutes (viz. palm oil), consumers still prefer the
domestic types of oil seeds for many reasons, among which stand the pleasant taste and flavour.
Studies on consumer‘s behaviour and preference can reveal essential information that can help in
designing an effective marketing strategy for the domestic oil seeds and their by-products and
exports to international markets as well. Traders, transport the crop to auction markets, in turn,
where sold to wholesalers (Fig. 3.5).
ii) Marketing Chain/Channels for Sesame and Sunflowers
The marketing chains/channels for sesame and sunflowers do not vary greatly as to those of
groundnuts since they are all sold by auction markets and go for processing through same route,
with minor routings. After sesame purchases are completed, the commodity goes for refinement
Whole
sellers Livestock
enterprises
fattening)
Rural & Urban
consumers
Companies for
export
Retailers
Oil industry
uses
Export
Company
agents
Small -scale producers in rain fed farming Producers in irrigated farming
Rural
traders
Temporary
storage
Sheil or
moneylen
ders
Transport to centralized
auction market
Temporary
storage
Rural
traders
Traders
Traders
Rural
markets
Modern
Processors
Local
Processors
Local
Processors
Modern
Processors
Cooking
oil
Locally
processed
seeds
seeds
Price and Market-Structure Analysis for Some Selected Agricultural Commodities: Marketing
Costs and Margins
31
and purification processes in silos and modern storage facilities where the service is available (Fig.
3.5). After this phase of purification, the sesame is taken for processing as cooking oil, seedcake or
exported to the world market. Sunflowers are not an exception in these processes and usually
follow the same pattern.
Local processors (Asarat) and conventional or modern types of processors are available for sesame
in different regions/states. Post-processing, the cooking oil is then sold to either wholesalers and/or
retailers whereas the remains go for feeding animals the same way as groundnuts (Fig. 3.5). The
rural population usually prefers the local sesame processors (Asarat) for their high quality „Walad‟
oil produced which enters as a medicament for many stomach and back-ache troubles. However,
the market chain for watermelons, which is mainly for exports, is similar to that of oil seeds except
for eliminating the phases of processing into oil.
e) Marketing Chain/Channels for Gum Arabic and Related Policy
Sudan is one of the leading Gum Arabic producing countries in the world. The commodity is
mainly obtained from Acacia sp. and some trees of the family Leguminaisae. In particular, two
varieties are famous in gum Arabic markets namely Acacia senegal (Hashab or Kordofan type) and
Acacia seyal (Talih) gum Arabic. Other African countries like Nigeria, Uganda, Tanzania, Kenya,
Niger, Ethiopia and Chad produce minor amounts (20% of Africas total produce) as compared to
Sudan (80%) (Karam, 1996 and Forestry Reports 2007).
Historically, gum Arabic trade started since 1820 during the Turkish regime and is still continuing
under the Sudan‘s leadership. The Gum Arabic Corporation GAC, which used to organize gum
arabic export trade, was established in 1969. Along the market chain of gum arabic, the producers,
who are usually farmers, procure their produce (Fig. 3.6) to local traders (assemblers) at free
auction markets, and at an interim price declared by the authorities at the beginning of each harvest
season. The local traders perform different processing activities (cleaning and grading) and then sell
the commodity to the GAC (Gum Arabic Corporation).
After the liberalization of gum Arabic trade, there are still many agents for different exporting
companies, some of them go for former GAC agents (Fig. 3.6). The assemblers have no alternative
to export their gum to the world market other than selling to the GAC or any other domestic
company. The law frees internal trade and monopolizes the external trade on natural gum Arabic
only to the GAC! Recently, there are many companies engaged in Gum Arabic trade.
Gum Arabic has a multitude of uses that diversify its marketing channels after processing.
Confectioneries, soft drinks and medical drugs are few examples of these types of uses (Fig. 3.6).
Smuggling of gum Arabic to neighbouring markets affects (negative or positive) greatly the
domestic production, marketing and consumption relations. Despite this fact, still there is no
reliable source of information to confirm or even estimate the volume of such informal trade.
Various marketing avenues are now open for gum Arabic exports as shown by Fig. 3.6. Europe is
traditionally the largest importer of gum Arabic. France, Great Britain, Italy and Germany are
dominant markets. A considerable proportion of gum Arabic imported by Europe is processed and
re-exported to the USA. Likewise, Japan imports the highest quality Hand-Picked Selected, (HPS)
hashab gum Arabic. In this regard, India, South Korea and China are important emerging markets
(Forestry Department, 2007).
Price and Market-Structure Analysis for Some Selected Agricultural Commodities: Marketing
Costs and Margins
31
Fig. 3.6: The Marketing Chain of Gum Arabic from Producers to End-Users
The processes of production, tapping, picking, drying, cleaning, grading and marketing tend to
enlarge the gum Arabic marketing chain but each one adds value to the produce and brings high
quality product that satisfies the international standards required by the food industry, both
nationally and internationally. Pre-harvest storage technology (storage on trees) must be followed
to minimize the hazardous fluctuations in production output in order to maintain a stable and
continuous supply of gum Arabic.
f) Marketing Chain for Livestock and Related Policy
In recent years, livestock shares almost 50% of agricultural exports where crops take the remainder
share (CBoS, 2009). Despite the significant importance of livestock to Sudanese economy, still its
markets are not well developed, the same as crop markets. No auction markets are available and sell
is not on weight basis but depends on bargaining on ‗no rule‘ basis. In addition, both formal and
informal markets exist in the livestock trade. Informal markets exist in remote and rural areas where
exchange process is done only arbitrarily and statistics concerning this type of trade and marketing
Producers Producers Producers
Assemblers
Gum Arabic
Company
(GAC)
(GAPC) Gum Arabic
Processing Company
(Processing phase)
Assemblers Assemblers
Producers
Smuggling
trade
Companies
Clients for Private
Gum Arabic
Companies in
Neighbourhood
countries Chad &
Niger
E.g. AIPG group & other
companies
Processors in EU, USA & Japan
Domestic industry & world industry and processing
Soft drinks industry
Pharmaceuticals Confectionery
industries
Milk industry
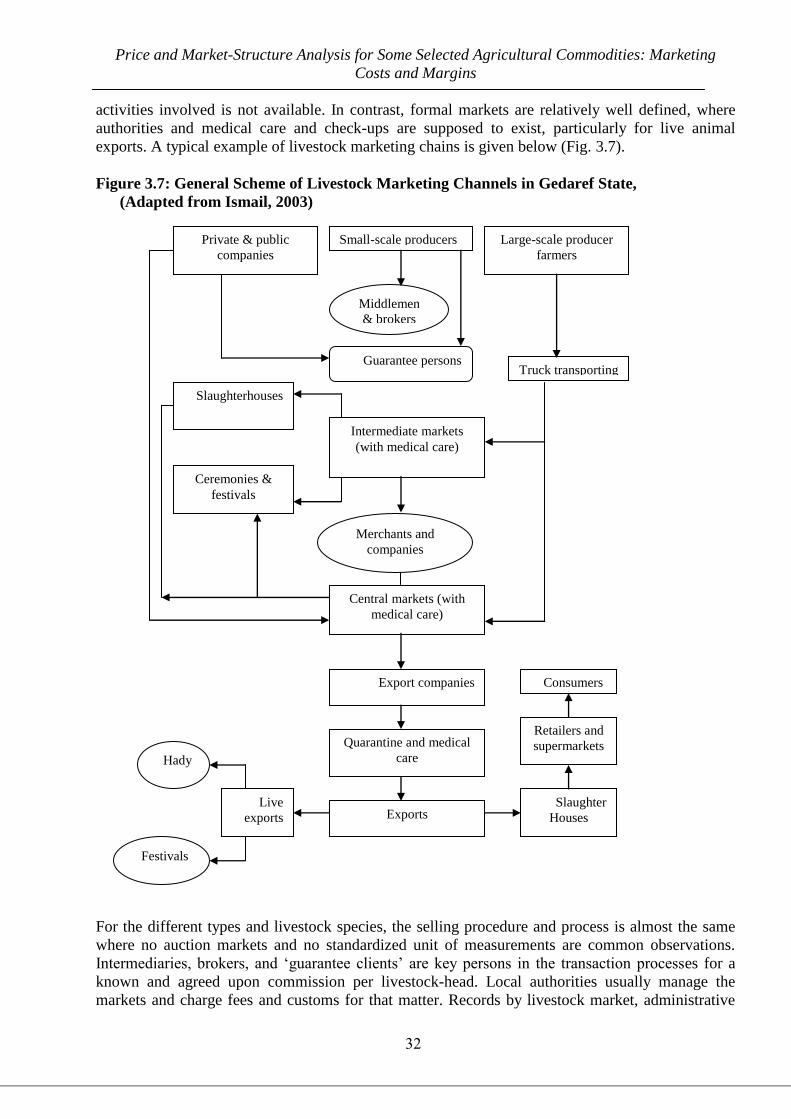
Price and Market-Structure Analysis for Some Selected Agricultural Commodities: Marketing
Costs and Margins
32
activities involved is not available. In contrast, formal markets are relatively well defined, where
authorities and medical care and check-ups are supposed to exist, particularly for live animal
exports. A typical example of livestock marketing chains is given below (Fig. 3.7).
Figure 3.7: General Scheme of Livestock Marketing Channels in Gedaref State,
(Adapted from Ismail, 2003)
For the different types and livestock species, the selling procedure and process is almost the same
where no auction markets and no standardized unit of measurements are common observations.
Intermediaries, brokers, and ‗guarantee clients‘ are key persons in the transaction processes for a
known and agreed upon commission per livestock-head. Local authorities usually manage the
markets and charge fees and customs for that matter. Records by livestock market, administrative
Private & public
companies
Slaughterhouses
Middlemen
& brokers
Guarantee persons
Intermediate markets
(with medical care)
Truck transporting
Ceremonies &
festivals
Small-scale producers
Central markets (with
medical care)
Merchants and
companies
Large-scale producer
farmers
Export companies
Quarantine and medical
care
Exports Slaughter
Houses
Live
exports
Hady
Festivals
Retailers and
supermarkets
Consumers
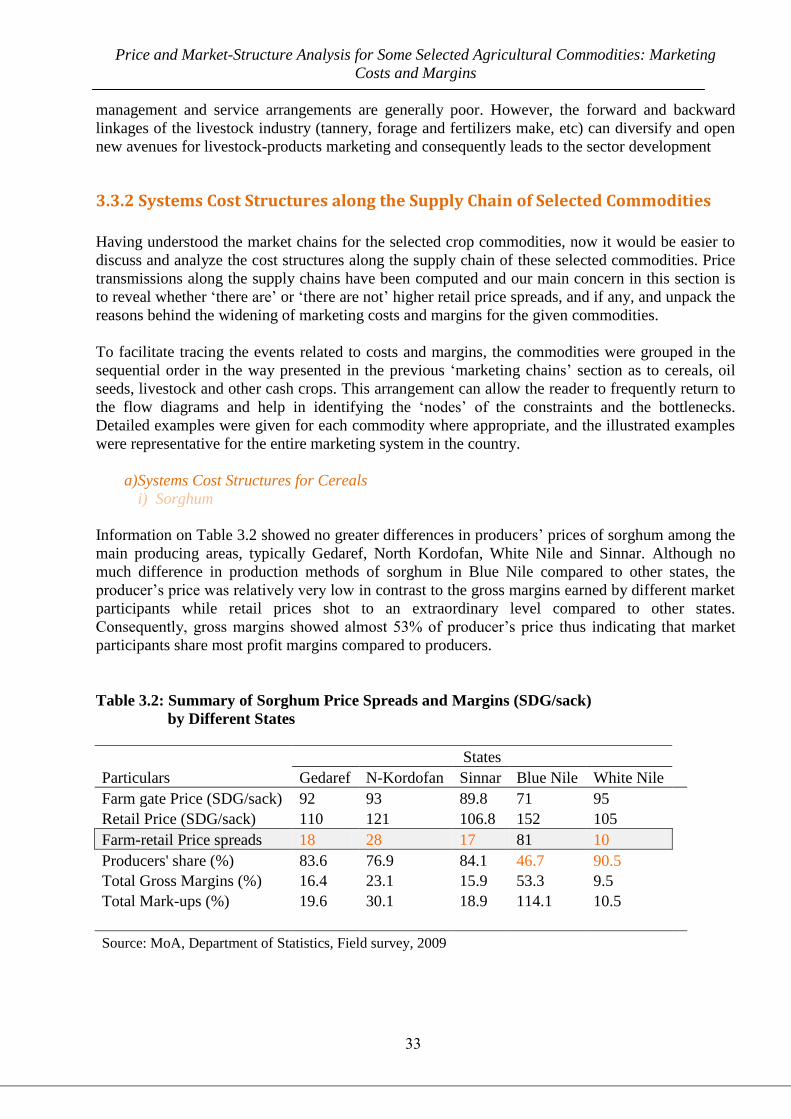
Price and Market-Structure Analysis for Some Selected Agricultural Commodities: Marketing
Costs and Margins
33
management and service arrangements are generally poor. However, the forward and backward
linkages of the livestock industry (tannery, forage and fertilizers make, etc) can diversify and open
new avenues for livestock-products marketing and consequently leads to the sector development
3.3.2 Systems Cost Structures along the Supply Chain of Selected Commodities
Having understood the market chains for the selected crop commodities, now it would be easier to
discuss and analyze the cost structures along the supply chain of these selected commodities. Price
transmissions along the supply chains have been computed and our main concern in this section is
to reveal whether ‗there are‘ or ‗there are not‘ higher retail price spreads, and if any, and unpack the
reasons behind the widening of marketing costs and margins for the given commodities.
To facilitate tracing the events related to costs and margins, the commodities were grouped in the
sequential order in the way presented in the previous ‗marketing chains‘ section as to cereals, oil
seeds, livestock and other cash crops. This arrangement can allow the reader to frequently return to
the flow diagrams and help in identifying the ‗nodes‘ of the constraints and the bottlenecks.
Detailed examples were given for each commodity where appropriate, and the illustrated examples
were representative for the entire marketing system in the country.
a) Systems Cost Structures for Cereals
i) Sorghum
Information on Table 3.2 showed no greater differences in producers‘ prices of sorghum among the
main producing areas, typically Gedaref, North Kordofan, White Nile and Sinnar. Although no
much difference in production methods of sorghum in Blue Nile compared to other states, the
producer‘s price was relatively very low in contrast to the gross margins earned by different market
participants while retail prices shot to an extraordinary level compared to other states.
Consequently, gross margins showed almost 53% of producer‘s price thus indicating that market
participants share most profit margins compared to producers.
Table 3.2: Summary of Sorghum Price Spreads and Margins (SDG/sack)
by Different States
States
Particulars Gedaref N-Kordofan Sinnar Blue Nile White Nile
Farm gate Price (SDG/sack) 92 93 89.8 71 95
Retail Price (SDG/sack) 110 121 106.8 152 105
Farm-retail Price spreads 18 28 17 81 10
Producers' share (%) 83.6 76.9 84.1 46.7 90.5
Total Gross Margins (%) 16.4 23.1 15.9 53.3 9.5
Total Mark-ups (%) 19.6 30.1 18.9 114.1 10.5
Source: MoA, Department of Statistics, Field survey, 2009
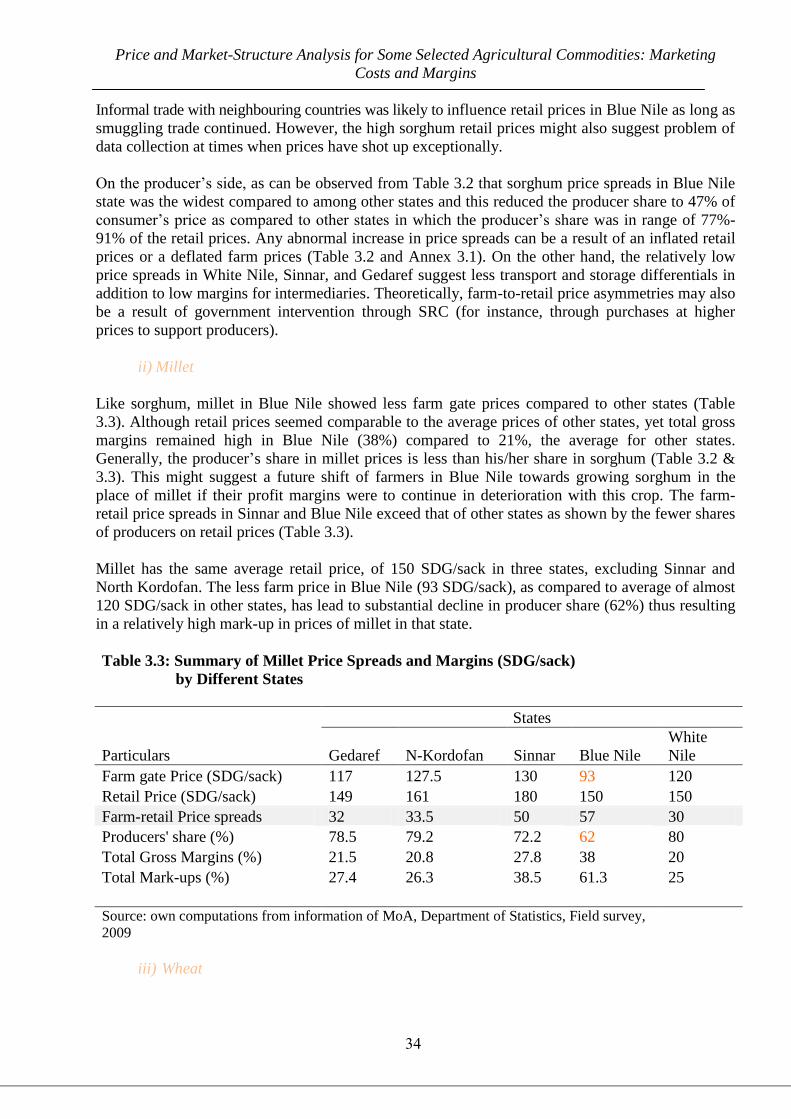
Price and Market-Structure Analysis for Some Selected Agricultural Commodities: Marketing
Costs and Margins
34
Informal trade with neighbouring countries was likely to influence retail prices in Blue Nile as long as
smuggling trade continued. However, the high sorghum retail prices might also suggest problem of
data collection at times when prices have shot up exceptionally.
On the producer‘s side, as can be observed from Table 3.2 that sorghum price spreads in Blue Nile
state was the widest compared to among other states and this reduced the producer share to 47% of
consumer‘s price as compared to other states in which the producer‘s share was in range of 77%-
91% of the retail prices. Any abnormal increase in price spreads can be a result of an inflated retail
prices or a deflated farm prices (Table 3.2 and Annex 3.1). On the other hand, the relatively low
price spreads in White Nile, Sinnar, and Gedaref suggest less transport and storage differentials in
addition to low margins for intermediaries. Theoretically, farm-to-retail price asymmetries may also
be a result of government intervention through SRC (for instance, through purchases at higher
prices to support producers).
ii) Millet
Like sorghum, millet in Blue Nile showed less farm gate prices compared to other states (Table
3.3). Although retail prices seemed comparable to the average prices of other states, yet total gross
margins remained high in Blue Nile (38%) compared to 21%, the average for other states.
Generally, the producer‘s share in millet prices is less than his/her share in sorghum (Table 3.2 &
3.3). This might suggest a future shift of farmers in Blue Nile towards growing sorghum in the
place of millet if their profit margins were to continue in deterioration with this crop. The farm-
retail price spreads in Sinnar and Blue Nile exceed that of other states as shown by the fewer shares
of producers on retail prices (Table 3.3).
Millet has the same average retail price, of 150 SDG/sack in three states, excluding Sinnar and
North Kordofan. The less farm price in Blue Nile (93 SDG/sack), as compared to average of almost
120 SDG/sack in other states, has lead to substantial decline in producer share (62%) thus resulting
in a relatively high mark-up in prices of millet in that state.
Table 3.3: Summary of Millet Price Spreads and Margins (SDG/sack)
by Different States
States
Particulars Gedaref N-Kordofan Sinnar Blue Nile
White
Nile
Farm gate Price (SDG/sack) 117 127.5 130 93 120
Retail Price (SDG/sack) 149 161 180 150 150
Farm-retail Price spreads 32 33.5 50 57 30
Producers' share (%) 78.5 79.2 72.2 62 80
Total Gross Margins (%) 21.5 20.8 27.8 38 20
Total Mark-ups (%) 27.4 26.3 38.5 61.3 25
Source: own computations from information of MoA, Department of Statistics, Field survey,
2009
iii) Wheat
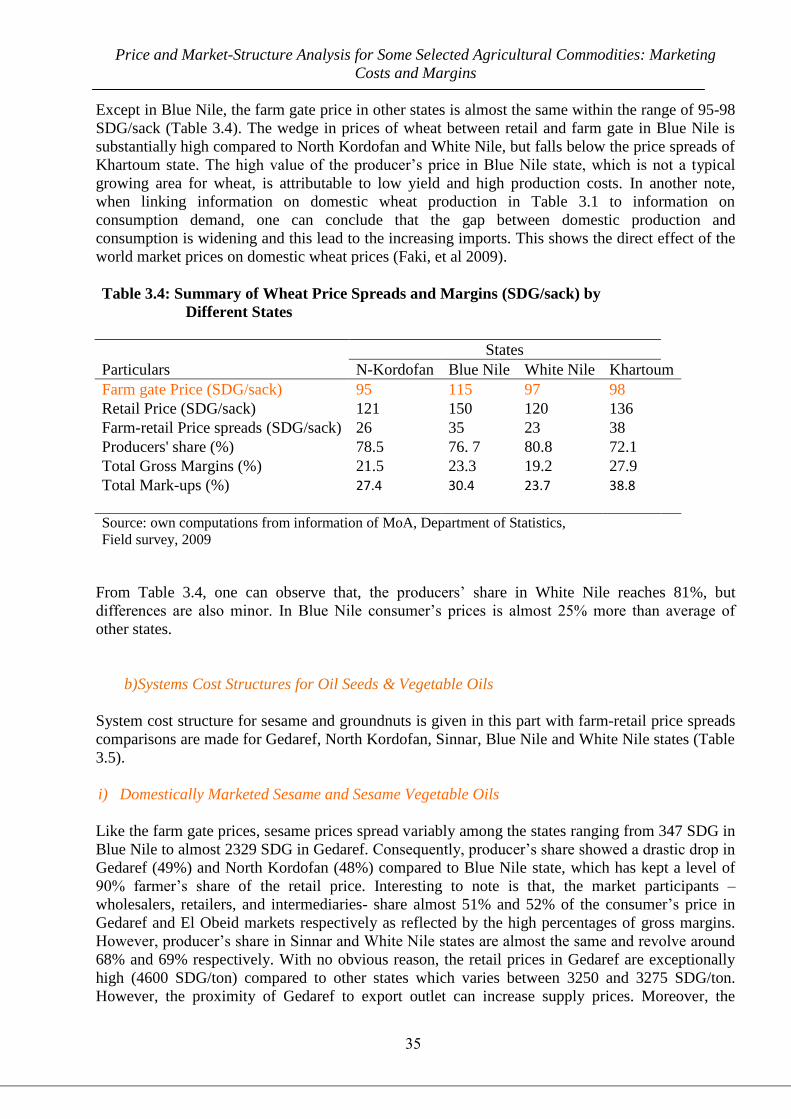
Price and Market-Structure Analysis for Some Selected Agricultural Commodities: Marketing
Costs and Margins
35
Except in Blue Nile, the farm gate price in other states is almost the same within the range of 95-98
SDG/sack (Table 3.4). The wedge in prices of wheat between retail and farm gate in Blue Nile is
substantially high compared to North Kordofan and White Nile, but falls below the price spreads of
Khartoum state. The high value of the producer‘s price in Blue Nile state, which is not a typical
growing area for wheat, is attributable to low yield and high production costs. In another note,
when linking information on domestic wheat production in Table 3.1 to information on
consumption demand, one can conclude that the gap between domestic production and
consumption is widening and this lead to the increasing imports. This shows the direct effect of the
world market prices on domestic wheat prices (Faki, et al 2009).
Table 3.4: Summary of Wheat Price Spreads and Margins (SDG/sack) by
Different States
States
Particulars N-Kordofan Blue Nile White Nile Khartoum
Farm gate Price (SDG/sack) 95 115 97 98
Retail Price (SDG/sack) 121 150 120 136
Farm-retail Price spreads (SDG/sack) 26 35 23 38
Producers' share (%) 78.5 76. 7 80.8 72.1
Total Gross Margins (%) 21.5 23.3 19.2 27.9
Total Mark-ups (%) 27.4 30.4 23.7 38.8
Source: own computations from information of MoA, Department of Statistics,
Field survey, 2009
From Table 3.4, one can observe that, the producers‘ share in White Nile reaches 81%, but
differences are also minor. In Blue Nile consumer‘s prices is almost 25% more than average of
other states.
b) Systems Cost Structures for Oil Seeds & Vegetable Oils
System cost structure for sesame and groundnuts is given in this part with farm-retail price spreads
comparisons are made for Gedaref, North Kordofan, Sinnar, Blue Nile and White Nile states (Table
3.5).
i) Domestically Marketed Sesame and Sesame Vegetable Oils
Like the farm gate prices, sesame prices spread variably among the states ranging from 347 SDG in
Blue Nile to almost 2329 SDG in Gedaref. Consequently, producer‘s share showed a drastic drop in
Gedaref (49%) and North Kordofan (48%) compared to Blue Nile state, which has kept a level of
90% farmer‘s share of the retail price. Interesting to note is that, the market participants –
wholesalers, retailers, and intermediaries- share almost 51% and 52% of the consumer‘s price in
Gedaref and El Obeid markets respectively as reflected by the high percentages of gross margins.
However, producer‘s share in Sinnar and White Nile states are almost the same and revolve around
68% and 69% respectively. With no obvious reason, the retail prices in Gedaref are exceptionally
high (4600 SDG/ton) compared to other states which varies between 3250 and 3275 SDG/ton.
However, the proximity of Gedaref to export outlet can increase supply prices. Moreover, the
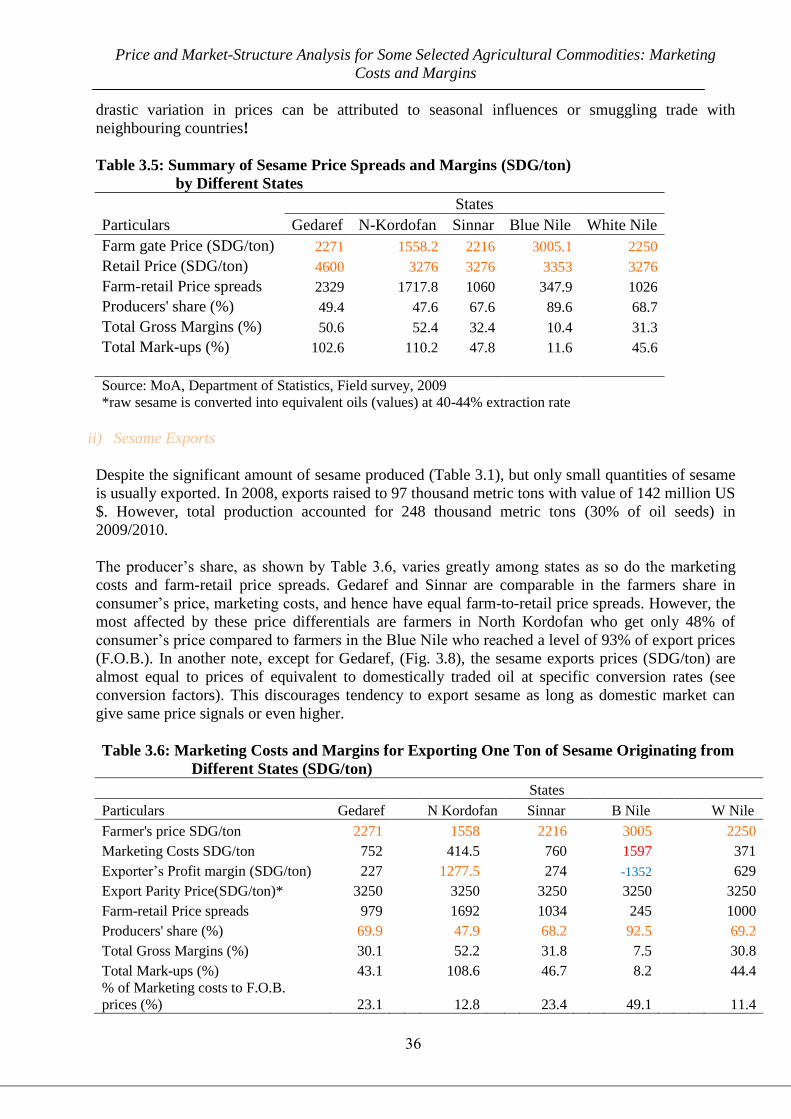
Price and Market-Structure Analysis for Some Selected Agricultural Commodities: Marketing
Costs and Margins
36
drastic variation in prices can be attributed to seasonal influences or smuggling trade with
neighbouring countries!
Table 3.5: Summary of Sesame Price Spreads and Margins (SDG/ton)
by Different States
States
Particulars Gedaref N-Kordofan Sinnar Blue Nile White Nile
Farm gate Price (SDG/ton) 2271 1558.2 2216 3005.1 2250
Retail Price (SDG/ton) 4600 3276 3276 3353 3276
Farm-retail Price spreads 2329 1717.8 1060 347.9 1026
Producers' share (%) 49.4 47.6 67.6 89.6 68.7
Total Gross Margins (%) 50.6 52.4 32.4 10.4 31.3
Total Mark-ups (%) 102.6 110.2 47.8 11.6 45.6
Source: MoA, Department of Statistics, Field survey, 2009
*raw sesame is converted into equivalent oils (values) at 40-44% extraction rate
ii) Sesame Exports
Despite the significant amount of sesame produced (Table 3.1), but only small quantities of sesame
is usually exported. In 2008, exports raised to 97 thousand metric tons with value of 142 million US
$. However, total production accounted for 248 thousand metric tons (30% of oil seeds) in
2009/2010.
The producer‘s share, as shown by Table 3.6, varies greatly among states as so do the marketing
costs and farm-retail price spreads. Gedaref and Sinnar are comparable in the farmers share in
consumer‘s price, marketing costs, and hence have equal farm-to-retail price spreads. However, the
most affected by these price differentials are farmers in North Kordofan who get only 48% of
consumer‘s price compared to farmers in the Blue Nile who reached a level of 93% of export prices
(F.O.B.). In another note, except for Gedaref, (Fig. 3.8), the sesame exports prices (SDG/ton) are
almost equal to prices of equivalent to domestically traded oil at specific conversion rates (see
conversion factors). This discourages tendency to export sesame as long as domestic market can
give same price signals or even higher.
Table 3.6: Marketing Costs and Margins for Exporting One Ton of Sesame Originating from
Different States (SDG/ton)
States
Particulars Gedaref N Kordofan Sinnar B Nile W Nile
Farmer's price SDG/ton 2271 1558 2216 3005 2250
Marketing Costs SDG/ton 752 414.5 760 1597 371
Exporter‘s Profit margin (SDG/ton) 227 1277.5 274 -1352 629
Export Parity Price(SDG/ton)* 3250 3250 3250 3250 3250
Farm-retail Price spreads 979 1692 1034 245 1000
Producers' share (%) 69.9 47.9 68.2 92.5 69.2
Total Gross Margins (%) 30.1 52.2 31.8 7.5 30.8
Total Mark-ups (%) 43.1 108.6 46.7 8.2 44.4
% of Marketing costs to F.O.B.
prices (%) 23.1 12.8 23.4 49.1 11.4
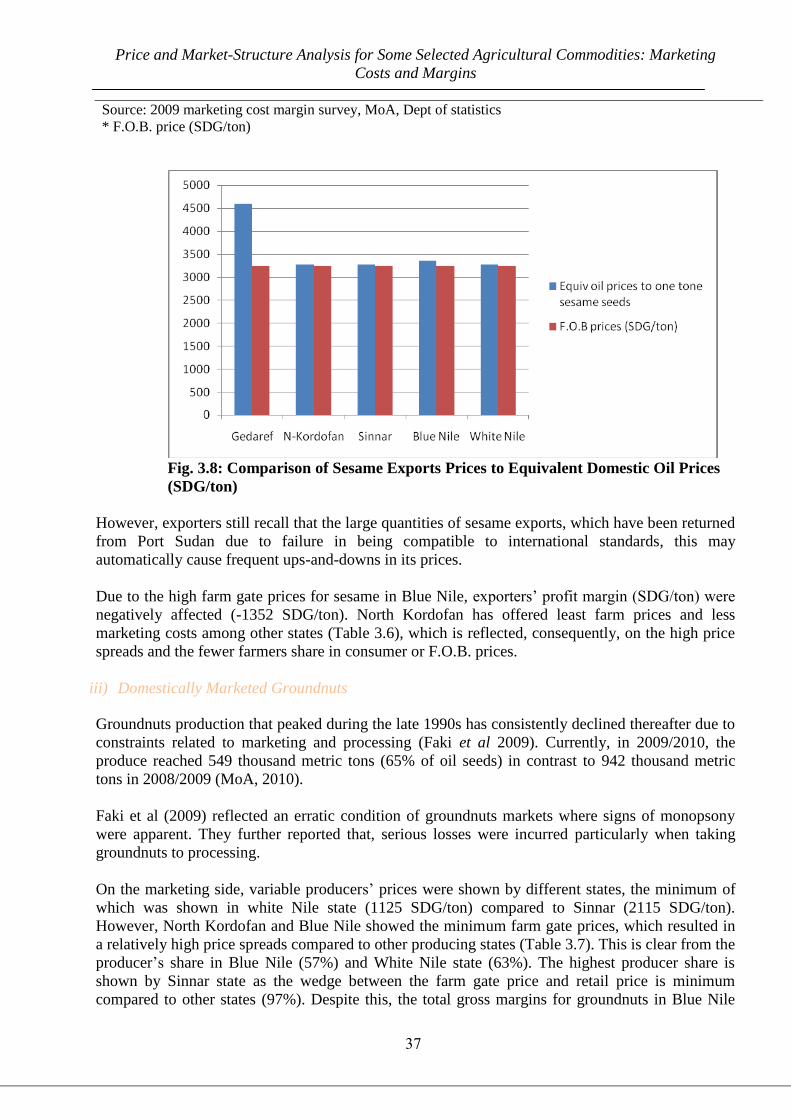
Price and Market-Structure Analysis for Some Selected Agricultural Commodities: Marketing
Costs and Margins
37
Source: 2009 marketing cost margin survey, MoA, Dept of statistics
* F.O.B. price (SDG/ton)
Fig. 3.8: Comparison of Sesame Exports Prices to Equivalent Domestic Oil Prices
(SDG/ton)
However, exporters still recall that the large quantities of sesame exports, which have been returned
from Port Sudan due to failure in being compatible to international standards, this may
automatically cause frequent ups-and-downs in its prices.
Due to the high farm gate prices for sesame in Blue Nile, exporters‘ profit margin (SDG/ton) were
negatively affected (-1352 SDG/ton). North Kordofan has offered least farm prices and less
marketing costs among other states (Table 3.6), which is reflected, consequently, on the high price
spreads and the fewer farmers share in consumer or F.O.B. prices.
iii) Domestically Marketed Groundnuts
Groundnuts production that peaked during the late 1990s has consistently declined thereafter due to
constraints related to marketing and processing (Faki et al 2009). Currently, in 2009/2010, the
produce reached 549 thousand metric tons (65% of oil seeds) in contrast to 942 thousand metric
tons in 2008/2009 (MoA, 2010).
Faki et al (2009) reflected an erratic condition of groundnuts markets where signs of monopsony
were apparent. They further reported that, serious losses were incurred particularly when taking
groundnuts to processing.
On the marketing side, variable producers‘ prices were shown by different states, the minimum of
which was shown in white Nile state (1125 SDG/ton) compared to Sinnar (2115 SDG/ton).
However, North Kordofan and Blue Nile showed the minimum farm gate prices, which resulted in
a relatively high price spreads compared to other producing states (Table 3.7). This is clear from the
producer‘s share in Blue Nile (57%) and White Nile state (63%). The highest producer share is
shown by Sinnar state as the wedge between the farm gate price and retail price is minimum
compared to other states (97%). Despite this, the total gross margins for groundnuts in Blue Nile
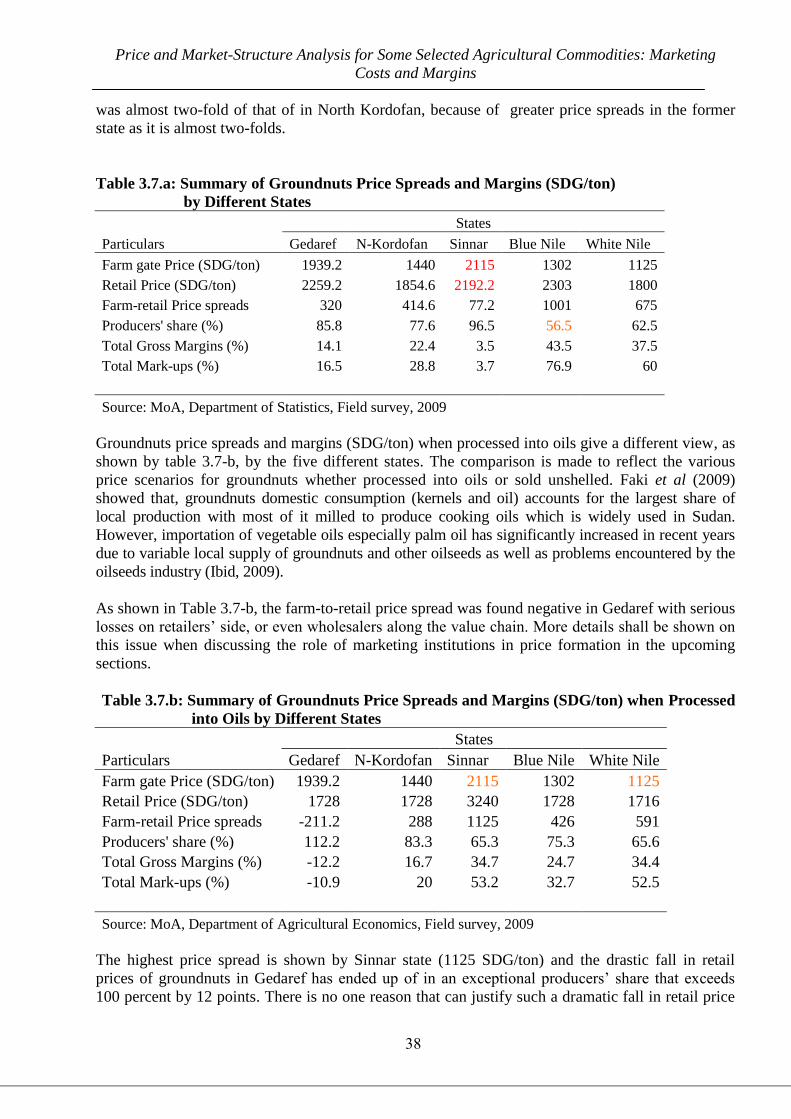
Price and Market-Structure Analysis for Some Selected Agricultural Commodities: Marketing
Costs and Margins
38
was almost two-fold of that of in North Kordofan, because of greater price spreads in the former
state as it is almost two-folds.
Table 3.7.a: Summary of Groundnuts Price Spreads and Margins (SDG/ton)
by Different States
States
Particulars Gedaref N-Kordofan Sinnar Blue Nile White Nile
Farm gate Price (SDG/ton) 1939.2 1440 2115 1302 1125
Retail Price (SDG/ton) 2259.2 1854.6 2192.2 2303 1800
Farm-retail Price spreads 320 414.6 77.2 1001 675
Producers' share (%) 85.8 77.6 96.5 56.5 62.5
Total Gross Margins (%) 14.1 22.4 3.5 43.5 37.5
Total Mark-ups (%) 16.5 28.8 3.7 76.9 60
Source: MoA, Department of Statistics, Field survey, 2009
Groundnuts price spreads and margins (SDG/ton) when processed into oils give a different view, as
shown by table 3.7-b, by the five different states. The comparison is made to reflect the various
price scenarios for groundnuts whether processed into oils or sold unshelled. Faki et al (2009)
showed that, groundnuts domestic consumption (kernels and oil) accounts for the largest share of
local production with most of it milled to produce cooking oils which is widely used in Sudan.
However, importation of vegetable oils especially palm oil has significantly increased in recent years
due to variable local supply of groundnuts and other oilseeds as well as problems encountered by the
oilseeds industry (Ibid, 2009).
As shown in Table 3.7-b, the farm-to-retail price spread was found negative in Gedaref with serious
losses on retailers‘ side, or even wholesalers along the value chain. More details shall be shown on
this issue when discussing the role of marketing institutions in price formation in the upcoming
sections.
Table 3.7.b: Summary of Groundnuts Price Spreads and Margins (SDG/ton) when Processed
into Oils by Different States
States
Particulars Gedaref N-Kordofan Sinnar Blue Nile White Nile
Farm gate Price (SDG/ton) 1939.2 1440 2115 1302 1125
Retail Price (SDG/ton) 1728 1728 3240 1728 1716
Farm-retail Price spreads -211.2 288 1125 426 591
Producers' share (%) 112.2 83.3 65.3 75.3 65.6
Total Gross Margins (%) -12.2 16.7 34.7 24.7 34.4
Total Mark-ups (%) -10.9 20 53.2 32.7 52.5
Source: MoA, Department of Agricultural Economics, Field survey, 2009
The highest price spread is shown by Sinnar state (1125 SDG/ton) and the drastic fall in retail
prices of groundnuts in Gedaref has ended up of in an exceptional producers‘ share that exceeds
100 percent by 12 points. There is no one reason that can justify such a dramatic fall in retail price
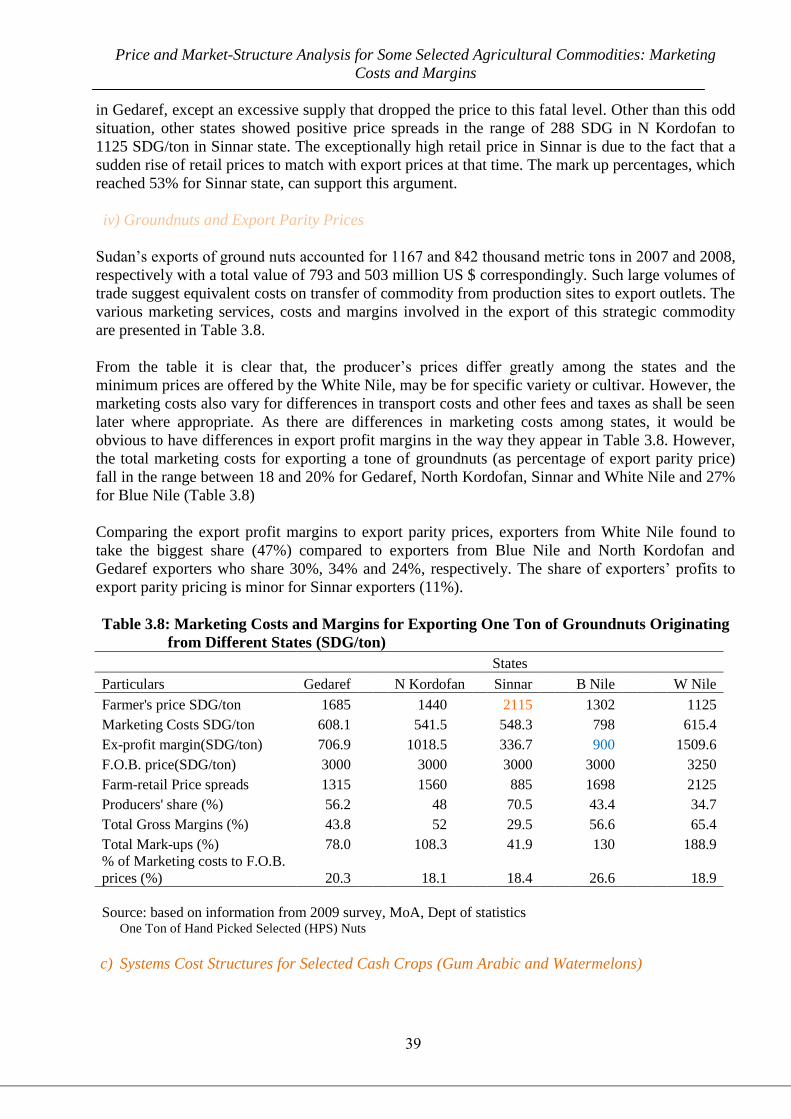
Price and Market-Structure Analysis for Some Selected Agricultural Commodities: Marketing
Costs and Margins
39
in Gedaref, except an excessive supply that dropped the price to this fatal level. Other than this odd
situation, other states showed positive price spreads in the range of 288 SDG in N Kordofan to
1125 SDG/ton in Sinnar state. The exceptionally high retail price in Sinnar is due to the fact that a
sudden rise of retail prices to match with export prices at that time. The mark up percentages, which
reached 53% for Sinnar state, can support this argument.
iv) Groundnuts and Export Parity Prices
Sudan‘s exports of ground nuts accounted for 1167 and 842 thousand metric tons in 2007 and 2008,
respectively with a total value of 793 and 503 million US $ correspondingly. Such large volumes of
trade suggest equivalent costs on transfer of commodity from production sites to export outlets. The
various marketing services, costs and margins involved in the export of this strategic commodity
are presented in Table 3.8.
From the table it is clear that, the producer‘s prices differ greatly among the states and the
minimum prices are offered by the White Nile, may be for specific variety or cultivar. However, the
marketing costs also vary for differences in transport costs and other fees and taxes as shall be seen
later where appropriate. As there are differences in marketing costs among states, it would be
obvious to have differences in export profit margins in the way they appear in Table 3.8. However,
the total marketing costs for exporting a tone of groundnuts (as percentage of export parity price)
fall in the range between 18 and 20% for Gedaref, North Kordofan, Sinnar and White Nile and 27%
for Blue Nile (Table 3.8)
Comparing the export profit margins to export parity prices, exporters from White Nile found to
take the biggest share (47%) compared to exporters from Blue Nile and North Kordofan and
Gedaref exporters who share 30%, 34% and 24%, respectively. The share of exporters‘ profits to
export parity pricing is minor for Sinnar exporters (11%).
Table 3.8: Marketing Costs and Margins for Exporting One Ton of Groundnuts Originating
from Different States (SDG/ton)
States
Particulars Gedaref N Kordofan Sinnar B Nile W Nile
Farmer's price SDG/ton 1685 1440 2115 1302 1125
Marketing Costs SDG/ton 608.1 541.5 548.3 798 615.4
Ex-profit margin(SDG/ton) 706.9 1018.5 336.7 900 1509.6
F.O.B. price(SDG/ton) 3000 3000 3000 3000 3250
Farm-retail Price spreads 1315 1560 885 1698 2125
Producers' share (%) 56.2 48 70.5 43.4 34.7
Total Gross Margins (%) 43.8 52 29.5 56.6 65.4
Total Mark-ups (%) 78.0 108.3 41.9 130 188.9
% of Marketing costs to F.O.B.
prices (%) 20.3 18.1 18.4 26.6 18.9
Source: based on information from 2009 survey, MoA, Dept of statistics One Ton of Hand Picked Selected (HPS) Nuts
c) Systems Cost Structures for Selected Cash Crops (Gum Arabic and Watermelons)
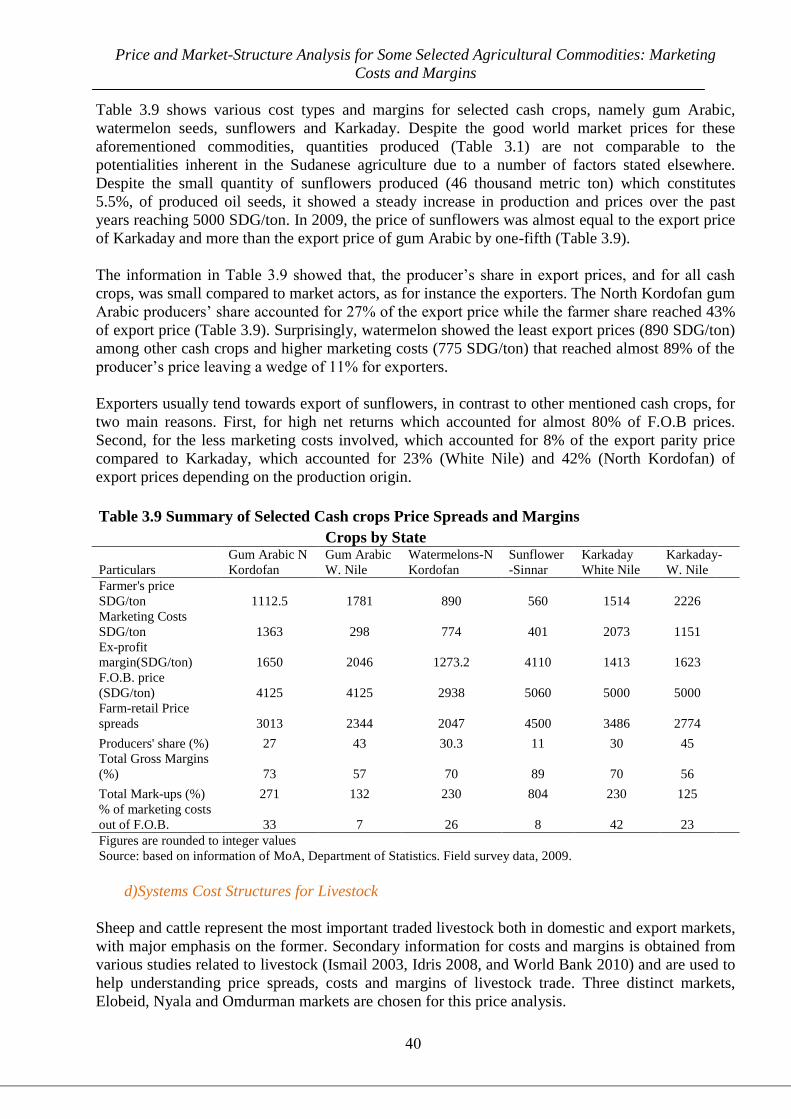
Price and Market-Structure Analysis for Some Selected Agricultural Commodities: Marketing
Costs and Margins
41
Table 3.9 shows various cost types and margins for selected cash crops, namely gum Arabic,
watermelon seeds, sunflowers and Karkaday. Despite the good world market prices for these
aforementioned commodities, quantities produced (Table 3.1) are not comparable to the
potentialities inherent in the Sudanese agriculture due to a number of factors stated elsewhere.
Despite the small quantity of sunflowers produced (46 thousand metric ton) which constitutes
5.5%, of produced oil seeds, it showed a steady increase in production and prices over the past
years reaching 5000 SDG/ton. In 2009, the price of sunflowers was almost equal to the export price
of Karkaday and more than the export price of gum Arabic by one-fifth (Table 3.9).
The information in Table 3.9 showed that, the producer‘s share in export prices, and for all cash
crops, was small compared to market actors, as for instance the exporters. The North Kordofan gum
Arabic producers‘ share accounted for 27% of the export price while the farmer share reached 43%
of export price (Table 3.9). Surprisingly, watermelon showed the least export prices (890 SDG/ton)
among other cash crops and higher marketing costs (775 SDG/ton) that reached almost 89% of the
producer‘s price leaving a wedge of 11% for exporters.
Exporters usually tend towards export of sunflowers, in contrast to other mentioned cash crops, for
two main reasons. First, for high net returns which accounted for almost 80% of F.O.B prices.
Second, for the less marketing costs involved, which accounted for 8% of the export parity price
compared to Karkaday, which accounted for 23% (White Nile) and 42% (North Kordofan) of
export prices depending on the production origin.
Table 3.9 Summary of Selected Cash crops Price Spreads and Margins
Crops by State
Particulars
Gum Arabic N
Kordofan
Gum Arabic
W. Nile
Watermelons-N
Kordofan
Sunflower
-Sinnar
Karkaday
White Nile
Karkaday-
W. Nile
Farmer's price
SDG/ton 1112.5 1781 890 560 1514 2226
Marketing Costs
SDG/ton 1363 298 774 401 2073 1151
Ex-profit
margin(SDG/ton) 1650 2046 1273.2 4110 1413 1623
F.O.B. price
(SDG/ton) 4125 4125 2938 5060 5000 5000
Farm-retail Price
spreads 3013 2344 2047 4500 3486 2774
Producers' share (%) 27 43 30.3 11 30 45
Total Gross Margins
(%) 73 57 70 89 70 56
Total Mark-ups (%) 271 132 230 804 230 125
% of marketing costs
out of F.O.B. 33 7 26 8 42 23
Figures are rounded to integer values
Source: based on information of MoA, Department of Statistics. Field survey data, 2009.
d) Systems Cost Structures for Livestock
Sheep and cattle represent the most important traded livestock both in domestic and export markets,
with major emphasis on the former. Secondary information for costs and margins is obtained from
various studies related to livestock (Ismail 2003, Idris 2008, and World Bank 2010) and are used to
help understanding price spreads, costs and margins of livestock trade. Three distinct markets,
Elobeid, Nyala and Omdurman markets are chosen for this price analysis.
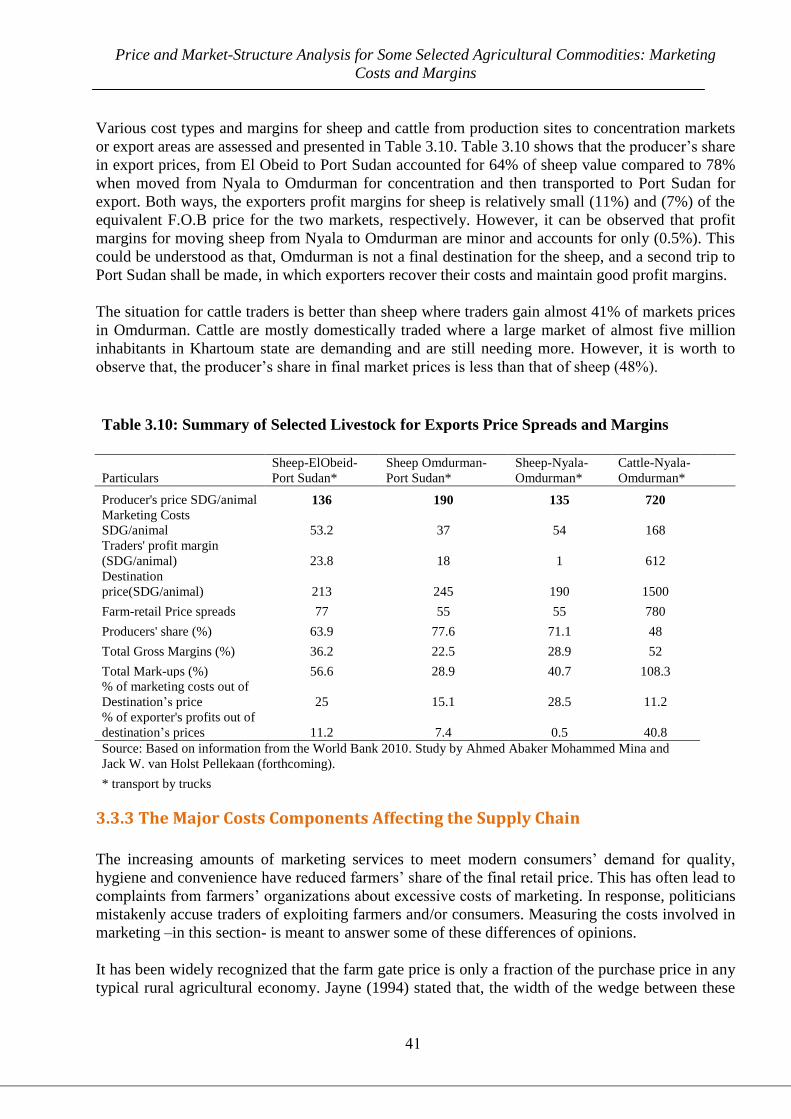
Price and Market-Structure Analysis for Some Selected Agricultural Commodities: Marketing
Costs and Margins
41
Various cost types and margins for sheep and cattle from production sites to concentration markets
or export areas are assessed and presented in Table 3.10. Table 3.10 shows that the producer‘s share
in export prices, from El Obeid to Port Sudan accounted for 64% of sheep value compared to 78%
when moved from Nyala to Omdurman for concentration and then transported to Port Sudan for
export. Both ways, the exporters profit margins for sheep is relatively small (11%) and (7%) of the
equivalent F.O.B price for the two markets, respectively. However, it can be observed that profit
margins for moving sheep from Nyala to Omdurman are minor and accounts for only (0.5%). This
could be understood as that, Omdurman is not a final destination for the sheep, and a second trip to
Port Sudan shall be made, in which exporters recover their costs and maintain good profit margins.
The situation for cattle traders is better than sheep where traders gain almost 41% of markets prices
in Omdurman. Cattle are mostly domestically traded where a large market of almost five million
inhabitants in Khartoum state are demanding and are still needing more. However, it is worth to
observe that, the producer‘s share in final market prices is less than that of sheep (48%).
Table 3.10: Summary of Selected Livestock for Exports Price Spreads and Margins
Particulars
Sheep-ElObeid-
Port Sudan*
Sheep Omdurman-
Port Sudan*
Sheep-Nyala-
Omdurman*
Cattle-Nyala-
Omdurman*
Producer's price SDG/animal 136 190 135 720
Marketing Costs
SDG/animal 53.2 37 54 168
Traders' profit margin
(SDG/animal) 23.8 18 1 612
Destination
price(SDG/animal) 213 245 190 1500
Farm-retail Price spreads 77 55 55 780
Producers' share (%) 63.9 77.6 71.1 48
Total Gross Margins (%) 36.2 22.5 28.9 52
Total Mark-ups (%) 56.6 28.9 40.7 108.3
% of marketing costs out of
Destination‘s price 25 15.1 28.5 11.2
% of exporter's profits out of
destination‘s prices 11.2 7.4 0.5 40.8
Source: Based on information from the World Bank 2010. Study by Ahmed Abaker Mohammed Mina and
Jack W. van Holst Pellekaan (forthcoming).
* transport by trucks
3.3.3 The Major Costs Components Affecting the Supply Chain
The increasing amounts of marketing services to meet modern consumers‘ demand for quality,
hygiene and convenience have reduced farmers‘ share of the final retail price. This has often lead to
complaints from farmers‘ organizations about excessive costs of marketing. In response, politicians
mistakenly accuse traders of exploiting farmers and/or consumers. Measuring the costs involved in
marketing –in this section- is meant to answer some of these differences of opinions.
It has been widely recognized that the farm gate price is only a fraction of the purchase price in any
typical rural agricultural economy. Jayne (1994) stated that, the width of the wedge between these
Price and Market-Structure Analysis for Some Selected Agricultural Commodities: Marketing
Costs and Margins
42
prices is a function of transportation, storage and processing technology, infrastructure, policy-
related factors, and institutions that coordinate exchange across space, time, and form.
The objective in measuring marketing margins and costs, by function, is to describe the structure of
marketing chain (value chain), starting at the farm gate tracing the commodity through the various
intermediaries until it reaches the final consumer or user. For this purpose, much focus is made to
test contentious issue of ‗exploitation‘ and ‗inefficiency‘ on side of middle-men, intermediaries,
wholesalers and retailers based on hard evidence.
The margins and the costs structure analysis is expected to help both entrepreneurs and policy
makers14
and help exporters to foresee their margins in the context of a changing economic
environment under volatile price conditions. The components of marketing costs and margin we deal with are simply all handling costs, transport costs, storage cost, taxes and marketing fees, physical losses equivalent in value terms, cleaning and the profit margins for the intermediaries involved in the marketing process.
3.3.3.1 Transport, Handling, Storage and Other Costs
Various transport modes and storage facilities, and consequently costs, are accessible for
agricultural commodities. Two important things are to be considered for road transport trucking.
First, the costs per tonne-kilometre is usually higher for shorter distances, where time spent, loading
and unloading and waiting time is likely to be a high percentage of total hire time, and also for
small loads where the vehicle are not being loaded to the capacity or taking consideration of the
back hauling trip. The cost of handling involves labour to load and unload sacks to and from trucks
and/or warehouses. Various types of storage facilities' for agricultural commodities are identified
and use of each depend on commodity itself, but focus in this study is given to conventional and
modern storage facilities.
Sorghum as an Example of Cereals An illustrative example is taken for the majorly traded and consumed cereal, sorghum, to represent various marketing costs components (Fig. 3.9). The figure gives average values as percentage of overall marketing costs (by function or service) for Gedaref, Sinnar, North Kordofan, Blue Nile, Khartoum, and White Nile states. In addition, the share of marketing costs in relation to producer and consumer‘s prices are shown in percentage terms to allow comparability and tractability. Generally, the total marketing costs involved in sorghum distribution in the country accounts for
10% and 14% of the consumer and producer‘s prices, respectively (Fig. 3.9). Surprisingly, sorghum
loading and unloading costs exceed the costs of transportation15
and constitute 2.4% and 3.5% of
14
Smeets et al (2010) cover the concept of country specific export decisions (the so-called extensive margin) and the
country-specific export volume decision (intensive margin). They claim first, policy makers should recognize that
―promoting exports‖ is as such an ambivalent policy goal. Differences between export decisions and export volume
decisions require different strategies: is the goal of export promotion to stimulate firms to engage in exports or to
stimulate current exporters to increase their export volumes? If the latter is the aim, should already existing trade
relationships be intensified, or should new ones be established? (Ibid, 2010)
15
Worth to note is that, when sorghum supplies were below average, private traders were required to acquire movement
permit for varying quantities of the commodity to be transported
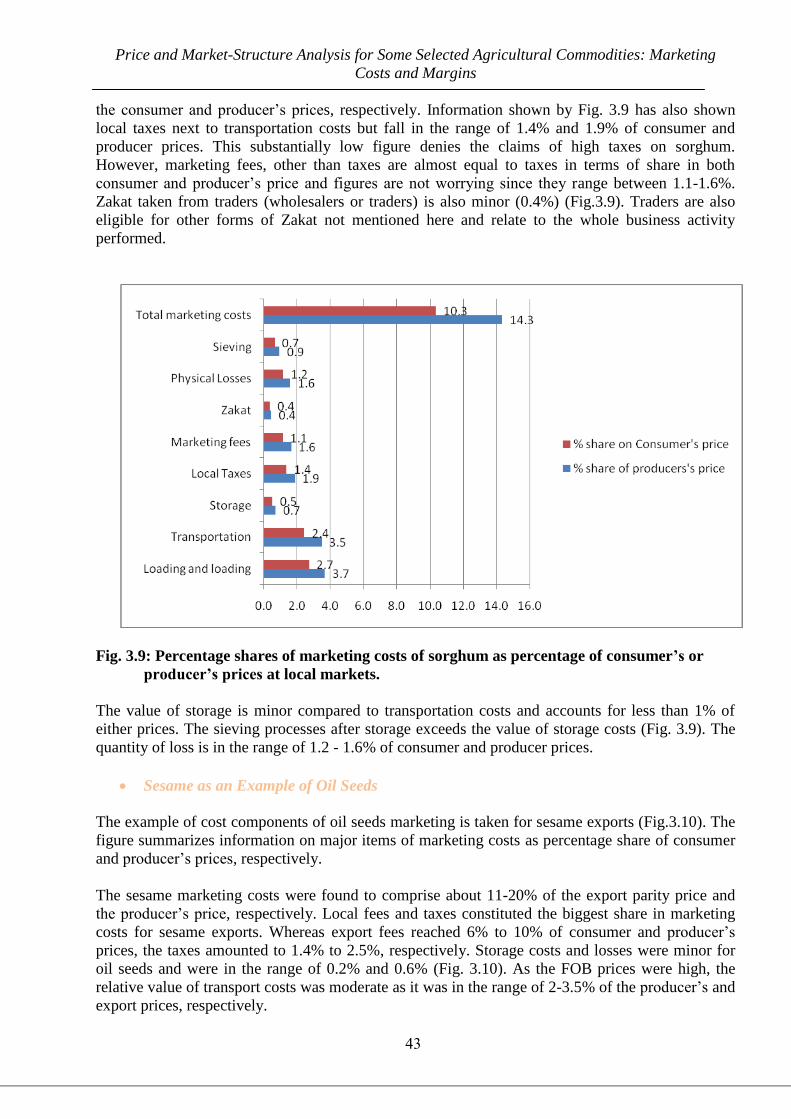
Price and Market-Structure Analysis for Some Selected Agricultural Commodities: Marketing
Costs and Margins
43
the consumer and producer‘s prices, respectively. Information shown by Fig. 3.9 has also shown
local taxes next to transportation costs but fall in the range of 1.4% and 1.9% of consumer and
producer prices. This substantially low figure denies the claims of high taxes on sorghum.
However, marketing fees, other than taxes are almost equal to taxes in terms of share in both
consumer and producer‘s price and figures are not worrying since they range between 1.1-1.6%.
Zakat taken from traders (wholesalers or traders) is also minor (0.4%) (Fig.3.9). Traders are also
eligible for other forms of Zakat not mentioned here and relate to the whole business activity
performed.
Fig. 3.9: Percentage shares of marketing costs of sorghum as percentage of consumer’s or
producer’s prices at local markets.
The value of storage is minor compared to transportation costs and accounts for less than 1% of
either prices. The sieving processes after storage exceeds the value of storage costs (Fig. 3.9). The
quantity of loss is in the range of 1.2 - 1.6% of consumer and producer prices.
Sesame as an Example of Oil Seeds
The example of cost components of oil seeds marketing is taken for sesame exports (Fig.3.10). The
figure summarizes information on major items of marketing costs as percentage share of consumer
and producer‘s prices, respectively.
The sesame marketing costs were found to comprise about 11-20% of the export parity price and
the producer‘s price, respectively. Local fees and taxes constituted the biggest share in marketing
costs for sesame exports. Whereas export fees reached 6% to 10% of consumer and producer‘s
prices, the taxes amounted to 1.4% to 2.5%, respectively. Storage costs and losses were minor for
oil seeds and were in the range of 0.2% and 0.6% (Fig. 3.10). As the FOB prices were high, the
relative value of transport costs was moderate as it was in the range of 2-3.5% of the producer‘s and
export prices, respectively.
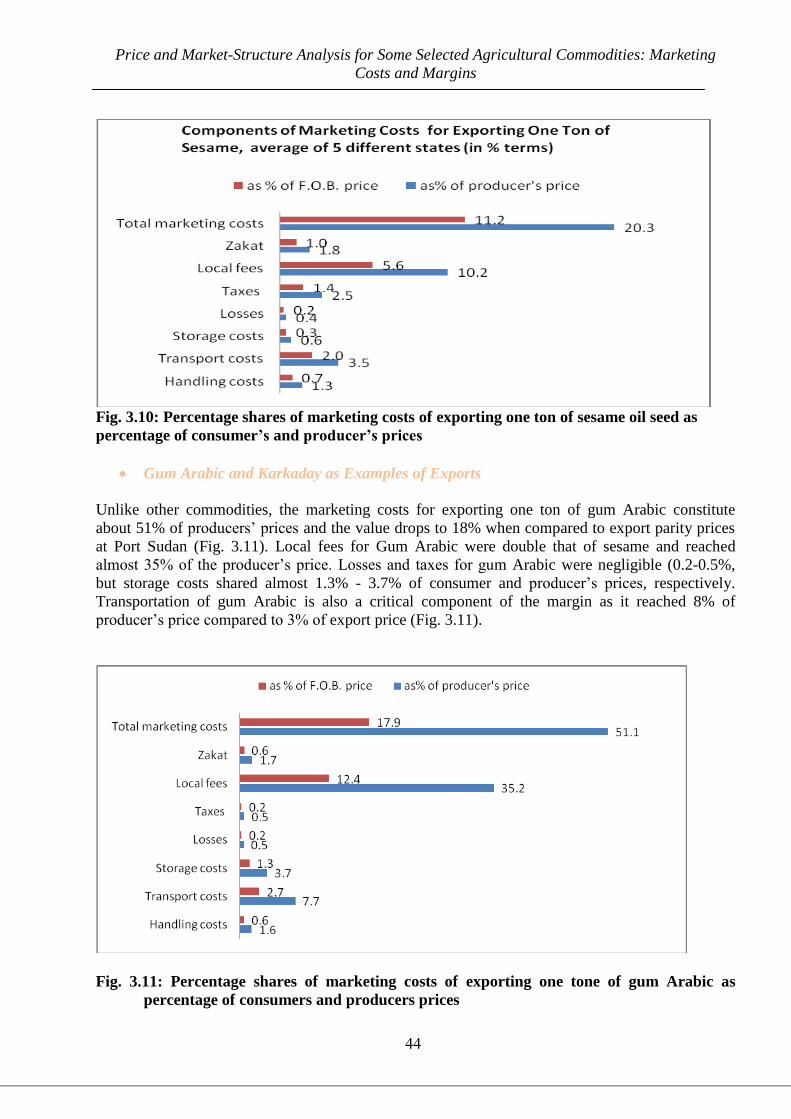
Price and Market-Structure Analysis for Some Selected Agricultural Commodities: Marketing
Costs and Margins
44
Fig. 3.10: Percentage shares of marketing costs of exporting one ton of sesame oil seed as
percentage of consumer’s and producer’s prices
Gum Arabic and Karkaday as Examples of Exports
Unlike other commodities, the marketing costs for exporting one ton of gum Arabic constitute
about 51% of producers‘ prices and the value drops to 18% when compared to export parity prices
at Port Sudan (Fig. 3.11). Local fees for Gum Arabic were double that of sesame and reached
almost 35% of the producer‘s price. Losses and taxes for gum Arabic were negligible (0.2-0.5%,
but storage costs shared almost 1.3% - 3.7% of consumer and producer‘s prices, respectively.
Transportation of gum Arabic is also a critical component of the margin as it reached 8% of
producer‘s price compared to 3% of export price (Fig. 3.11).
Fig. 3.11: Percentage shares of marketing costs of exporting one tone of gum Arabic as
percentage of consumers and producers prices
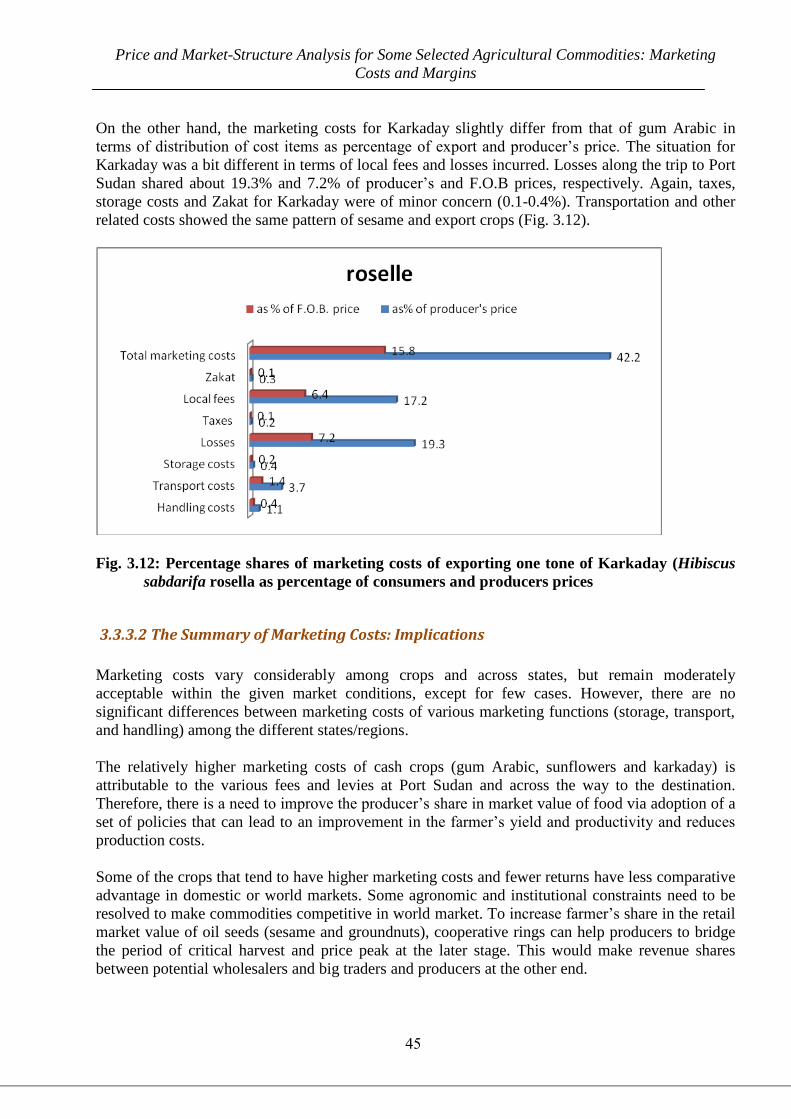
Price and Market-Structure Analysis for Some Selected Agricultural Commodities: Marketing
Costs and Margins
45
On the other hand, the marketing costs for Karkaday slightly differ from that of gum Arabic in
terms of distribution of cost items as percentage of export and producer‘s price. The situation for
Karkaday was a bit different in terms of local fees and losses incurred. Losses along the trip to Port
Sudan shared about 19.3% and 7.2% of producer‘s and F.O.B prices, respectively. Again, taxes,
storage costs and Zakat for Karkaday were of minor concern (0.1-0.4%). Transportation and other
related costs showed the same pattern of sesame and export crops (Fig. 3.12).
Fig. 3.12: Percentage shares of marketing costs of exporting one tone of Karkaday (Hibiscus
sabdarifa rosella as percentage of consumers and producers prices
3.3.3.2 The Summary of Marketing Costs: Implications
Marketing costs vary considerably among crops and across states, but remain moderately
acceptable within the given market conditions, except for few cases. However, there are no
significant differences between marketing costs of various marketing functions (storage, transport,
and handling) among the different states/regions.
The relatively higher marketing costs of cash crops (gum Arabic, sunflowers and karkaday) is
attributable to the various fees and levies at Port Sudan and across the way to the destination.
Therefore, there is a need to improve the producer‘s share in market value of food via adoption of a
set of policies that can lead to an improvement in the farmer‘s yield and productivity and reduces
production costs.
Some of the crops that tend to have higher marketing costs and fewer returns have less comparative
advantage in domestic or world markets. Some agronomic and institutional constraints need to be
resolved to make commodities competitive in world market. To increase farmer‘s share in the retail
market value of oil seeds (sesame and groundnuts), cooperative rings can help producers to bridge
the period of critical harvest and price peak at the later stage. This would make revenue shares
between potential wholesalers and big traders and producers at the other end.
Price and Market-Structure Analysis for Some Selected Agricultural Commodities: Marketing
Costs and Margins
46
Government tax on agricultural produce, which has never been entirely abolished (rather comes
under various names other than taxes), should be institutionalized and directed only for breeding,
research16
and extension.
There is a great need in application of unified methodologies in assessment and computation of
costs and returns. The way prices and costs are now computed requires a consensus on the technical
methods as whether to use the usual arithmetic average or weighted average that involves quantities
as well as prices. No meaningful conclusions can be drawn from current data if the quantity
delivered at each purchase price is not known.
To reduce market costs and increase profit margins for farmers, an efficient market information
system that provides information on world prices, and opportunities need to be accelerated.
Although SIFSIA main task is on this front, dissemination of market information to a wider use has
yet to materialize. Collaboration with ABIC (Agribusiness Investment Centre of MoA) needs to be
initiated. Both institutions can conduct joint studies using comparative advantage analysis to build
on decisions for competitiveness of these crops in international markets.
Additional means to improve market efficiency can be induced via bulk transport and bulk storage
facilities. Most crop markets are not well equipped for marketing and trading activities such as
weighing scales to large sorting and grading equipment, communication facilities, banking services
as well as access to internet information within the market territory or market borders. Improvement
of data quality, simple access to all market information to participants and at a reasonable cost is
payable and affordable by market participants. In general, a strategic marketing policy that
combines all partners and interest groups must be maintained.
3.3.4 Margins and Returns Analysis
In this section, marketing margins are presented per trade participant (wholesaler, retailer and
intermediaries). Averages of the main states have been considered to give insights to the magnitude
and direction of changes in profits and margins. The difference between the price per unit of the
commodity at the farm gate and the price per unit when sold to the final consumer (the retail price)
is termed as the total gross margin or alternatively, the total price spread (Smith 1992). Only few
examples are shown in this section.
3.3.4.1 Margins & Returns to Farmers/Producers
Although the data17
was deficient in terms of verifying the reasons for variations in producer‘s
prices, yet remain indicative as to the direction and magnitude of change in producers‘ prices.
Knowledge about production costs can tell about the margins producers can get with regard to
sales. To know costs and returns incurred by farmers, a summary of results that relate to 2004 is the
―green tax for research‖
16. The full framework can be developed when policy makers and trade unions primarily accept
the idea. 17
As was mentioned earlier, the study based its analysis of producers or farmers‘ prices on information collected by the
DAEM survey in late 2009.
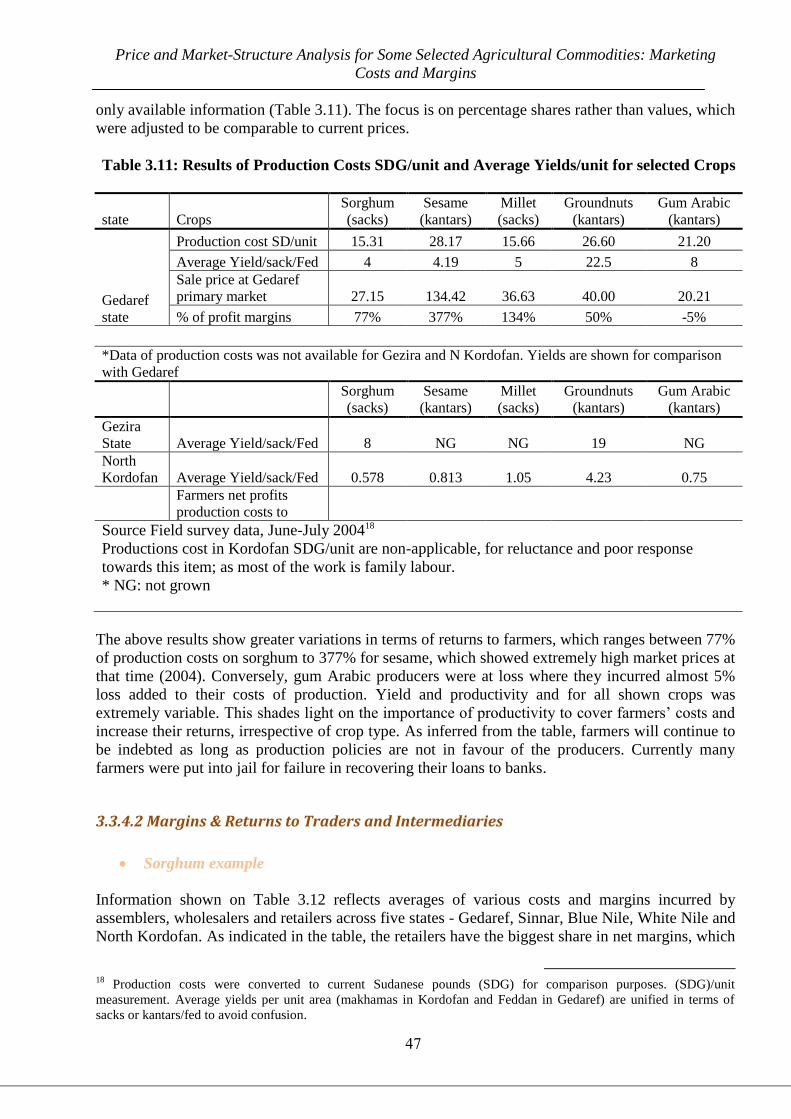
Price and Market-Structure Analysis for Some Selected Agricultural Commodities: Marketing
Costs and Margins
47
only available information (Table 3.11). The focus is on percentage shares rather than values, which
were adjusted to be comparable to current prices.
Table 3.11: Results of Production Costs SDG/unit and Average Yields/unit for selected Crops
state Crops
Sorghum
(sacks)
Sesame
(kantars)
Millet
(sacks)
Groundnuts
(kantars)
Gum Arabic
(kantars)
Gedaref
state
Production cost SD/unit 15.31 28.17 15.66 26.60 21.20
Average Yield/sack/Fed 4 4.19 5 22.5 8
Sale price at Gedaref
primary market 27.15 134.42 36.63 40.00 20.21
% of profit margins 77% 377% 134% 50% -5%
*Data of production costs was not available for Gezira and N Kordofan. Yields are shown for comparison
with Gedaref
Sorghum
(sacks)
Sesame
(kantars)
Millet
(sacks)
Groundnuts
(kantars)
Gum Arabic
(kantars)
Gezira
State Average Yield/sack/Fed 8 NG NG 19 NG
North
Kordofan Average Yield/sack/Fed 0.578 0.813 1.05 4.23 0.75
Farmers net profits
production costs to
Source Field survey data, June-July 200418
Productions cost in Kordofan SDG/unit are non-applicable, for reluctance and poor response
towards this item; as most of the work is family labour.
* NG: not grown
The above results show greater variations in terms of returns to farmers, which ranges between 77%
of production costs on sorghum to 377% for sesame, which showed extremely high market prices at
that time (2004). Conversely, gum Arabic producers were at loss where they incurred almost 5%
loss added to their costs of production. Yield and productivity and for all shown crops was
extremely variable. This shades light on the importance of productivity to cover farmers‘ costs and
increase their returns, irrespective of crop type. As inferred from the table, farmers will continue to
be indebted as long as production policies are not in favour of the producers. Currently many
farmers were put into jail for failure in recovering their loans to banks.
3.3.4.2 Margins & Returns to Traders and Intermediaries
Sorghum example
Information shown on Table 3.12 reflects averages of various costs and margins incurred by
assemblers, wholesalers and retailers across five states - Gedaref, Sinnar, Blue Nile, White Nile and
North Kordofan. As indicated in the table, the retailers have the biggest share in net margins, which
18
Production costs were converted to current Sudanese pounds (SDG) for comparison purposes. (SDG)/unit
measurement. Average yields per unit area (makhamas in Kordofan and Feddan in Gedaref) are unified in terms of
sacks or kantars/fed to avoid confusion.
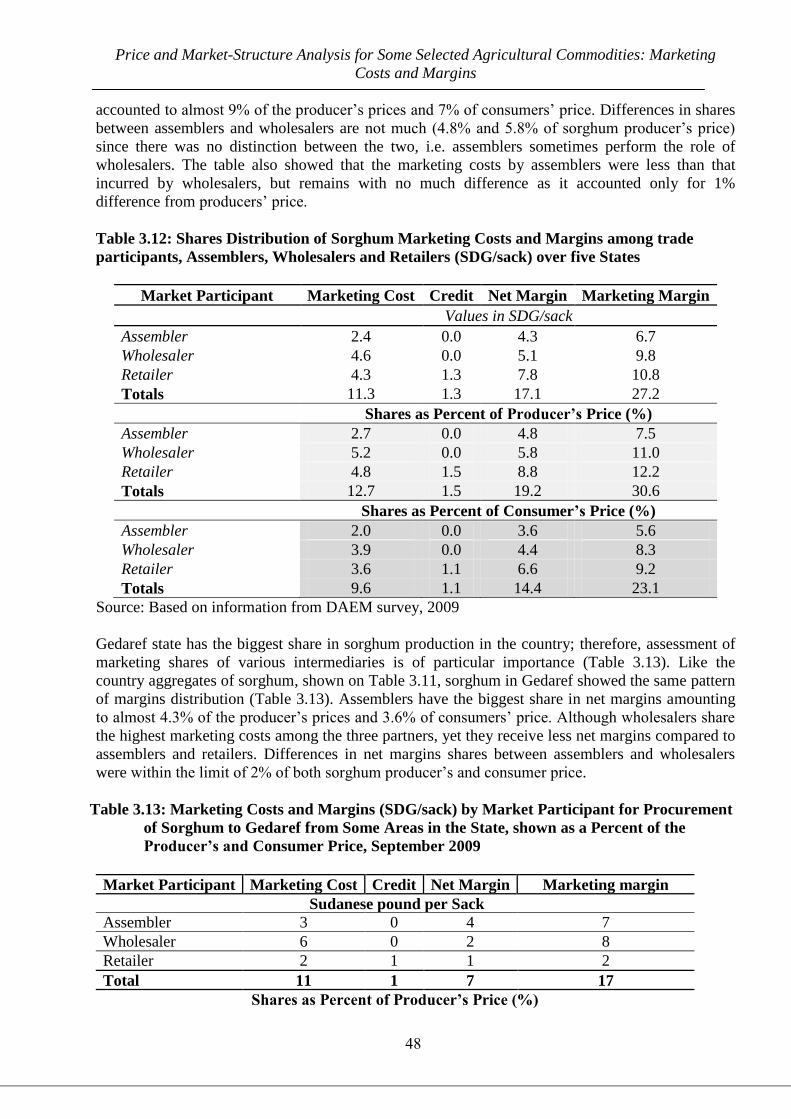
Price and Market-Structure Analysis for Some Selected Agricultural Commodities: Marketing
Costs and Margins
48
accounted to almost 9% of the producer‘s prices and 7% of consumers‘ price. Differences in shares
between assemblers and wholesalers are not much (4.8% and 5.8% of sorghum producer‘s price)
since there was no distinction between the two, i.e. assemblers sometimes perform the role of
wholesalers. The table also showed that the marketing costs by assemblers were less than that
incurred by wholesalers, but remains with no much difference as it accounted only for 1%
difference from producers‘ price.
Table 3.12: Shares Distribution of Sorghum Marketing Costs and Margins among trade
participants, Assemblers, Wholesalers and Retailers (SDG/sack) over five States
Market Participant Marketing Cost Credit Net Margin Marketing Margin
Values in SDG/sack
Assembler 2.4 0.0 4.3 6.7
Wholesaler 4.6 0.0 5.1 9.8
Retailer 4.3 1.3 7.8 10.8
Totals 11.3 1.3 17.1 27.2
Shares as Percent of Producer’s Price (%)
Assembler 2.7 0.0 4.8 7.5
Wholesaler 5.2 0.0 5.8 11.0
Retailer 4.8 1.5 8.8 12.2
Totals 12.7 1.5 19.2 30.6
Shares as Percent of Consumer’s Price (%)
Assembler 2.0 0.0 3.6 5.6
Wholesaler 3.9 0.0 4.4 8.3
Retailer 3.6 1.1 6.6 9.2
Totals 9.6 1.1 14.4 23.1
Source: Based on information from DAEM survey, 2009
Gedaref state has the biggest share in sorghum production in the country; therefore, assessment of
marketing shares of various intermediaries is of particular importance (Table 3.13). Like the
country aggregates of sorghum, shown on Table 3.11, sorghum in Gedaref showed the same pattern
of margins distribution (Table 3.13). Assemblers have the biggest share in net margins amounting
to almost 4.3% of the producer‘s prices and 3.6% of consumers‘ price. Although wholesalers share
the highest marketing costs among the three partners, yet they receive less net margins compared to
assemblers and retailers. Differences in net margins shares between assemblers and wholesalers
were within the limit of 2% of both sorghum producer‘s and consumer price.
Table 3.13: Marketing Costs and Margins (SDG/sack) by Market Participant for Procurement
of Sorghum to Gedaref from Some Areas in the State, shown as a Percent of the
Producer’s and Consumer Price, September 2009
Market Participant Marketing Cost Credit Net Margin Marketing margin
Sudanese pound per Sack
Assembler 3 0 4 7
Wholesaler 6 0 2 8
Retailer 2 1 1 2
Total 11 1 7 17
Shares as Percent of Producer’s Price (%)
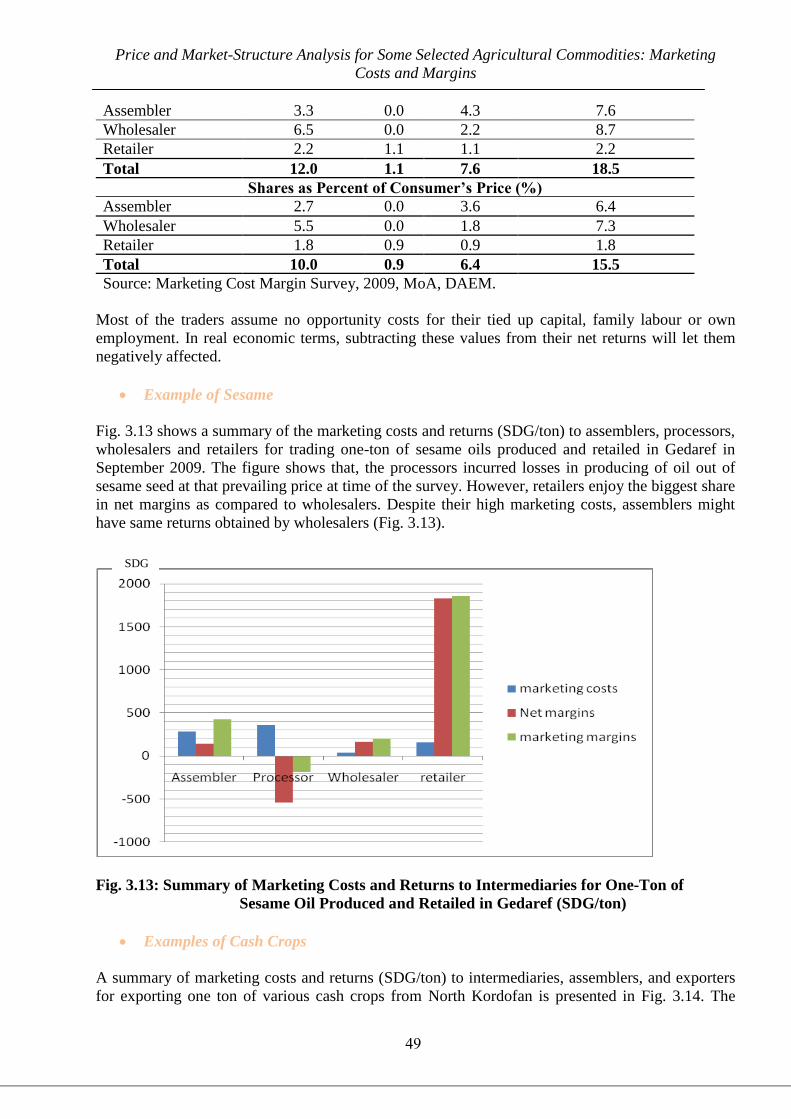
Price and Market-Structure Analysis for Some Selected Agricultural Commodities: Marketing
Costs and Margins
49
Assembler 3.3 0.0 4.3 7.6
Wholesaler 6.5 0.0 2.2 8.7
Retailer 2.2 1.1 1.1 2.2
Total 12.0 1.1 7.6 18.5
Shares as Percent of Consumer’s Price (%)
Assembler 2.7 0.0 3.6 6.4
Wholesaler 5.5 0.0 1.8 7.3
Retailer 1.8 0.9 0.9 1.8
Total 10.0 0.9 6.4 15.5
Source: Marketing Cost Margin Survey, 2009, MoA, DAEM.
Credit
Most of the traders assume no opportunity costs for their tied up capital, family labour or own
employment. In real economic terms, subtracting these values from their net returns will let them
negatively affected.
Example of Sesame
Fig. 3.13 shows a summary of the marketing costs and returns (SDG/ton) to assemblers, processors,
wholesalers and retailers for trading one-ton of sesame oils produced and retailed in Gedaref in
September 2009. The figure shows that, the processors incurred losses in producing of oil out of
sesame seed at that prevailing price at time of the survey. However, retailers enjoy the biggest share
in net margins as compared to wholesalers. Despite their high marketing costs, assemblers might
have same returns obtained by wholesalers (Fig. 3.13).
Fig. 3.13: Summary of Marketing Costs and Returns to Intermediaries for One-Ton of
Sesame Oil Produced and Retailed in Gedaref (SDG/ton)
Examples of Cash Crops
A summary of marketing costs and returns (SDG/ton) to intermediaries, assemblers, and exporters
for exporting one ton of various cash crops from North Kordofan is presented in Fig. 3.14. The
SDG
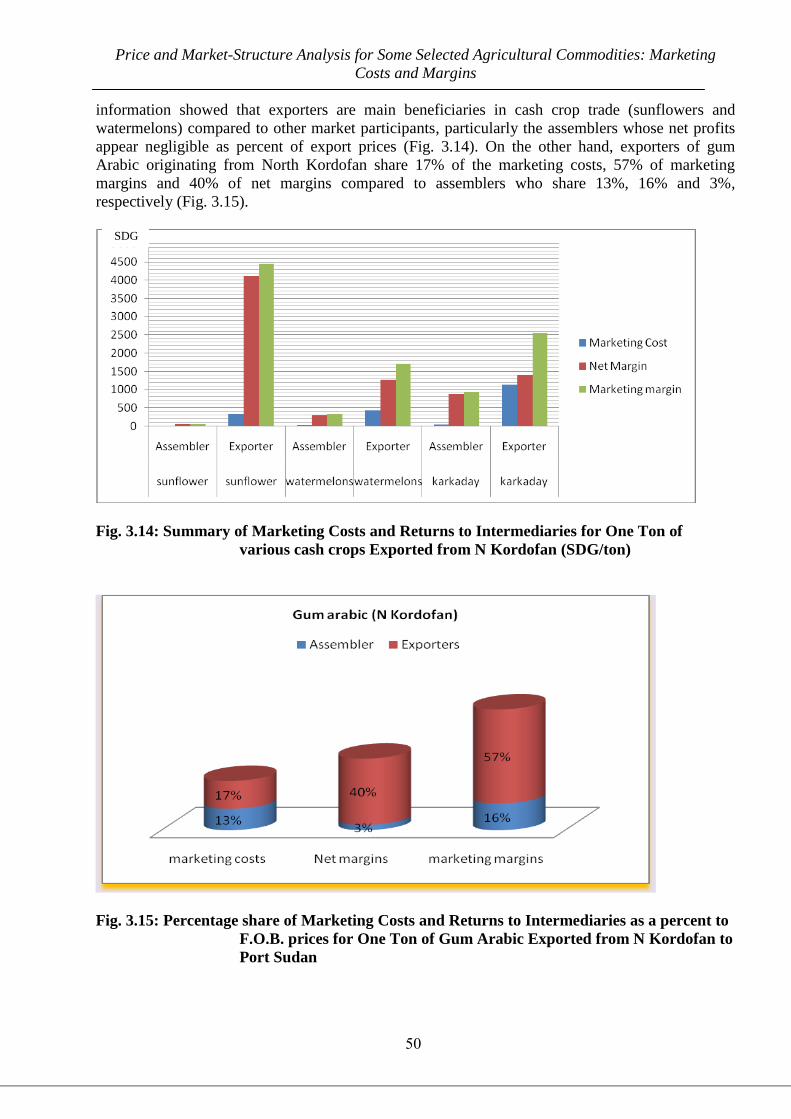
Price and Market-Structure Analysis for Some Selected Agricultural Commodities: Marketing
Costs and Margins
51
information showed that exporters are main beneficiaries in cash crop trade (sunflowers and
watermelons) compared to other market participants, particularly the assemblers whose net profits
appear negligible as percent of export prices (Fig. 3.14). On the other hand, exporters of gum
Arabic originating from North Kordofan share 17% of the marketing costs, 57% of marketing
margins and 40% of net margins compared to assemblers who share 13%, 16% and 3%,
respectively (Fig. 3.15).
Fig. 3.14: Summary of Marketing Costs and Returns to Intermediaries for One Ton of
various cash crops Exported from N Kordofan (SDG/ton)
Fig. 3.15: Percentage share of Marketing Costs and Returns to Intermediaries as a percent to
F.O.B. prices for One Ton of Gum Arabic Exported from N Kordofan to
Port Sudan
SDG
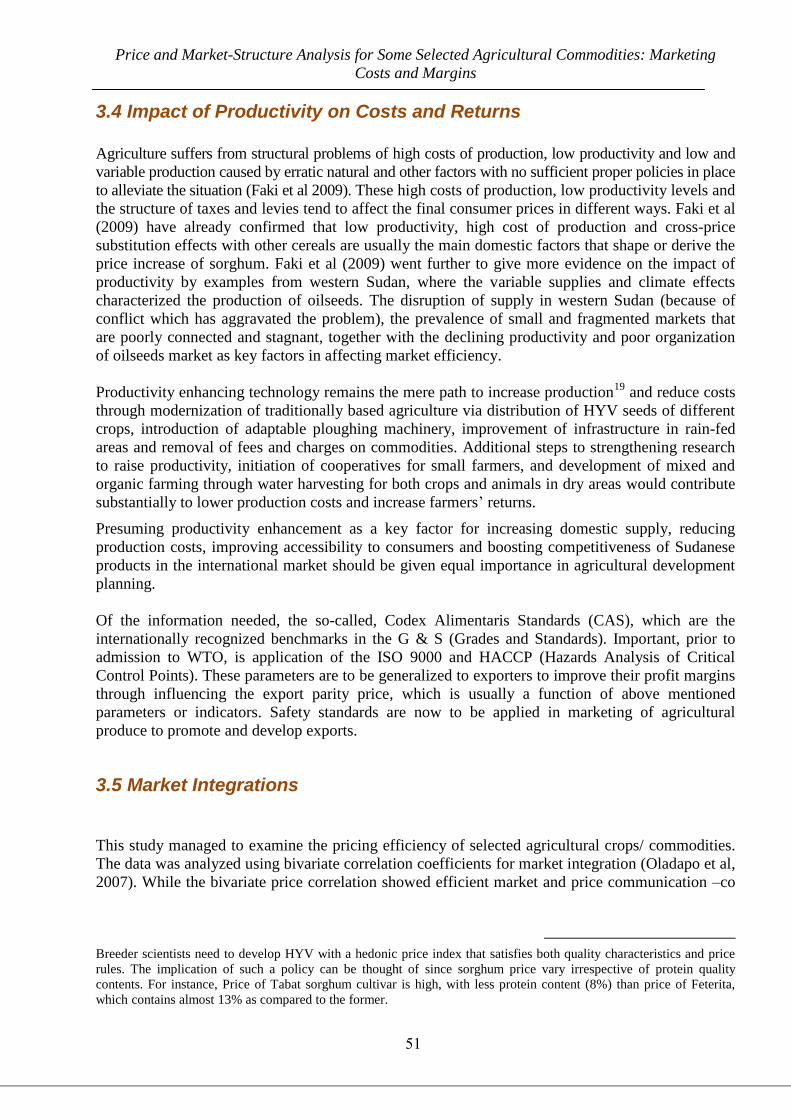
Price and Market-Structure Analysis for Some Selected Agricultural Commodities: Marketing
Costs and Margins
51
3.4 Impact of Productivity on Costs and Returns
Agriculture suffers from structural problems of high costs of production, low productivity and low and
variable production caused by erratic natural and other factors with no sufficient proper policies in place
to alleviate the situation (Faki et al 2009). These high costs of production, low productivity levels and
the structure of taxes and levies tend to affect the final consumer prices in different ways. Faki et al
(2009) have already confirmed that low productivity, high cost of production and cross-price
substitution effects with other cereals are usually the main domestic factors that shape or derive the
price increase of sorghum. Faki et al (2009) went further to give more evidence on the impact of
productivity by examples from western Sudan, where the variable supplies and climate effects
characterized the production of oilseeds. The disruption of supply in western Sudan (because of
conflict which has aggravated the problem), the prevalence of small and fragmented markets that
are poorly connected and stagnant, together with the declining productivity and poor organization
of oilseeds market as key factors in affecting market efficiency.
Productivity enhancing technology remains the mere path to increase production19
and reduce costs
through modernization of traditionally based agriculture via distribution of HYV seeds of different
crops, introduction of adaptable ploughing machinery, improvement of infrastructure in rain-fed
areas and removal of fees and charges on commodities. Additional steps to strengthening research
to raise productivity, initiation of cooperatives for small farmers, and development of mixed and
organic farming through water harvesting for both crops and animals in dry areas would contribute
substantially to lower production costs and increase farmers‘ returns.
Presuming productivity enhancement as a key factor for increasing domestic supply, reducing
production costs, improving accessibility to consumers and boosting competitiveness of Sudanese
products in the international market should be given equal importance in agricultural development
planning.
Of the information needed, the so-called, Codex Alimentaris Standards (CAS), which are the
internationally recognized benchmarks in the G & S (Grades and Standards). Important, prior to
admission to WTO, is application of the ISO 9000 and HACCP (Hazards Analysis of Critical
Control Points). These parameters are to be generalized to exporters to improve their profit margins
through influencing the export parity price, which is usually a function of above mentioned
parameters or indicators. Safety standards are now to be applied in marketing of agricultural
produce to promote and develop exports.
3.5 Market Integrations
This study managed to examine the pricing efficiency of selected agricultural crops/ commodities.
The data was analyzed using bivariate correlation coefficients for market integration (Oladapo et al,
2007). While the bivariate price correlation showed efficient market and price communication –co
Breeder scientists need to develop HYV with a hedonic price index that satisfies both quality characteristics and price
rules. The implication of such a policy can be thought of since sorghum price vary irrespective of protein quality
contents. For instance, Price of Tabat sorghum cultivar is high, with less protein content (8%) than price of Feterita,
which contains almost 13% as compared to the former.
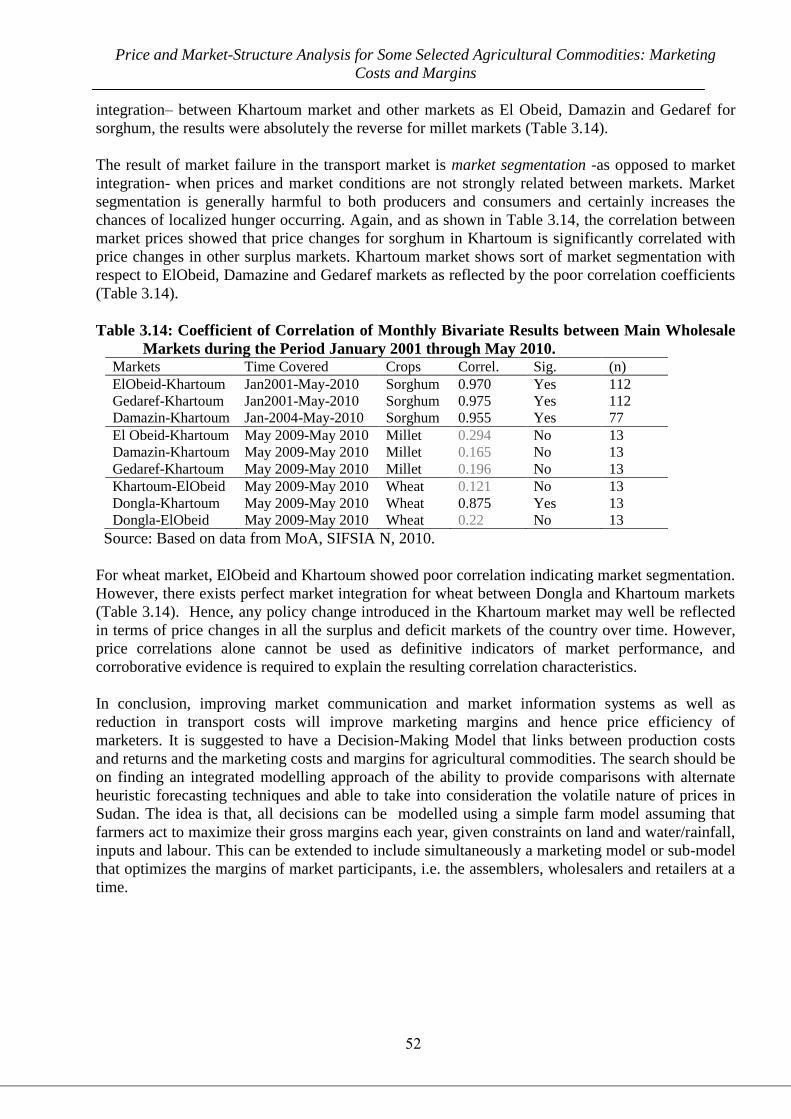
Price and Market-Structure Analysis for Some Selected Agricultural Commodities: Marketing
Costs and Margins
52
integration– between Khartoum market and other markets as El Obeid, Damazin and Gedaref for
sorghum, the results were absolutely the reverse for millet markets (Table 3.14).
The result of market failure in the transport market is market segmentation -as opposed to market
integration- when prices and market conditions are not strongly related between markets. Market
segmentation is generally harmful to both producers and consumers and certainly increases the
chances of localized hunger occurring. Again, and as shown in Table 3.14, the correlation between
market prices showed that price changes for sorghum in Khartoum is significantly correlated with
price changes in other surplus markets. Khartoum market shows sort of market segmentation with
respect to ElObeid, Damazine and Gedaref markets as reflected by the poor correlation coefficients
(Table 3.14).
Table 3.14: Coefficient of Correlation of Monthly Bivariate Results between Main Wholesale
Markets during the Period January 2001 through May 2010. Markets Time Covered Crops Correl. Sig. (n)
ElObeid-Khartoum Jan2001-May-2010 Sorghum 0.970 Yes 112
Gedaref-Khartoum Jan2001-May-2010 Sorghum 0.975 Yes 112
Damazin-Khartoum Jan-2004-May-2010 Sorghum 0.955 Yes 77
El Obeid-Khartoum May 2009-May 2010 Millet 0.294 No 13
Damazin-Khartoum May 2009-May 2010 Millet 0.165 No 13
Gedaref-Khartoum May 2009-May 2010 Millet 0.196 No 13
Khartoum-ElObeid May 2009-May 2010 Wheat 0.121 No 13
Dongla-Khartoum May 2009-May 2010 Wheat 0.875 Yes 13
Dongla-ElObeid May 2009-May 2010 Wheat 0.22 No 13
Source: Based on data from MoA, SIFSIA N, 2010.
For wheat market, ElObeid and Khartoum showed poor correlation indicating market segmentation.
However, there exists perfect market integration for wheat between Dongla and Khartoum markets
(Table 3.14). Hence, any policy change introduced in the Khartoum market may well be reflected
in terms of price changes in all the surplus and deficit markets of the country over time. However,
price correlations alone cannot be used as definitive indicators of market performance, and
corroborative evidence is required to explain the resulting correlation characteristics.
In conclusion, improving market communication and market information systems as well as
reduction in transport costs will improve marketing margins and hence price efficiency of
marketers. It is suggested to have a Decision-Making Model that links between production costs
and returns and the marketing costs and margins for agricultural commodities. The search should be
on finding an integrated modelling approach of the ability to provide comparisons with alternate
heuristic forecasting techniques and able to take into consideration the volatile nature of prices in
Sudan. The idea is that, all decisions can be modelled using a simple farm model assuming that
farmers act to maximize their gross margins each year, given constraints on land and water/rainfall,
inputs and labour. This can be extended to include simultaneously a marketing model or sub-model
that optimizes the margins of market participants, i.e. the assemblers, wholesalers and retailers at a
time.
Price and Market-Structure Analysis for Some Selected Agricultural Commodities: Marketing
Costs and Margins
53
4. CONCLUSIONS AND RECOMMENDATIONS
This paper provides an in-depth description and analysis of marketing costs and margins of the
commodities under study. It appears that a variety of factors, as shown by the price spreads in
relation to costs and margins and for the various market participants, influence markets and
marketing performance. The analysis also showed that many factors that have an influence on gross
margins and marketing costs relate to geographical locations (or spatial differences), policy
decisions, seasonality factor and the usual inter-annual variations.
The various methodological approaches followed in this study (using structure, conduct and
performance indicators) provided additional evidence of the importance of costs and margins on
trade and market development. Moreover, the analyses made on costs and margins given evidence
on the existence of gaps that need to be filled, particularly, on the various marketing services and
related investments. The study calls for continuation on this line of research on marketing costs and
margins based on an updated data. This requires improved efforts towards market data collection;
and raise awareness of all market participants about the costs and margins process and their role in
trade development.
In fact, many of the conclusions and recommendations of this study are not new as numerous
marketing studies conducted over the last few years have revolved around the same area. However,
the recent conclusions and recommendations are based on recent surveys and a thorough analysis of
markets through a market conduct performance analysis.
4.1 General Conclusions and Recommendations
The study has provided an in-depth analysis of marketing costs, gross and net margins and returns
to various market participants and for a range of food and cash crops. The findings helped in
examining the factors associated with the higher and lower end performance of market participants
and offered specific recommendations for cereals pricing and trade policy.
The farm to retail price spreads were extremely variable and for different reasons.
Recommendations provided will help decision makers to measure the equity aspects of the
marketing system as how profits and margins are shared among the different market participants.
Unlike commodity prices, which are extremely volatile, costs of marketing services- storage,
transportation, taxes, etc. - are more stable due to institutional and traditional practices.
Most traders who are confined to local trade have investments with low capital requirement and
minimal risks and as such cannot compete internationally with well-established trading companies.
Long term contracting might be an option but even this is constrained by the high and unstable
exchange rates (also Murabaha rates), high transport costs due to poor road infrastructure, lack of
market information on export markets caused by underutilization of communication systems (as
web sites) and uncertain government policy environment.
Improvements in necessary public services and market infrastructure are important for markets
development. Improvement of feeder roads can promote agricultural marketing in remote areas.
Price and Market-Structure Analysis for Some Selected Agricultural Commodities: Marketing
Costs and Margins
54
This policy can be maintained through the encouragement of private sector investment in marketing
services. As well documented, there is no accounting or bookkeeping principles across the entire
country, and for farmers and traders as well, insistence to do it should be pivotal to policy makers.
4.1.1 General Recommendations and Policy Implications
Institutional and Information Systems
There is a need to develop a system of sample surveys that will take place each year and
collect structural and accountancy data of farms with the aim of monitoring the prices
margins, income and business activities of agribusiness activities to evaluate the impact of
the yearly-enunciated agricultural policy.
For consistency with the above, a framework that ensures data representative-ness of all
types of farming, including livestock, fisheries and horticultural crops should be designed
and all marketing costs and margins along the chain should be traced and assessed.
As per a unanimous request from all trade participants, the establishment of auction markets
is certainly a step towards improvement in markets performance if implemented in all
markets in Sudan. This will facilitate the adoption of units‘ of measurements, improves the
quality of the products at inlet levels, and make the entire marketing system more smooth
and efficient.
Government institutions must work towards standardization of units of measurements,
which should then be implemented at the state and federal level.
Further improvement of the information systems in crop markets to include traders concerns
is required. For states in which the service is already there, it needs to be continued. The
information disseminated must not be confined to prices but proper assessment of users
needs is critical to tailor market information systems.
Sustaining the timely dissemination of SIFSIA N market information can also help policy
makers to monitor the evolving effects of market price changes, identify problems that
require mid-course correction and to respond to impending supply fluctuations in a more
timely fashion.
Legislative and Legal Aspects & Conduct
A well-established legal framework for agricultural markets, which is currently not the case,
is required to safeguard both farmers and traders and facilitate developing export markets.
Proper and well functioning law enforcement would reduce transaction costs of inputs,
faced by farmers and traders. Further initiation of legal and regulatory framework and
quality standards that embrace legal, consumer, industry and international standards should
be the way forward.
Strengthening efficient and strong marketing institutions, where legislative aspects should
be developed and effectively implemented, would help for efficient and safe warehouse
systems which would help to administer movement of food commodities in and outside the
country.
Price and Market-Structure Analysis for Some Selected Agricultural Commodities: Marketing
Costs and Margins
55
Strengthen the ethics and morals of marketing channels in a multi-faceted approach that
encompasses all aspects of marketing activities. In this regard, plans to combat anti-law
practices and uncover farmers‘ misconduct (viz. “Kasir”, “Rada” and “Katafali”) and
other cheating forms widely spread in crop markets need to be initiated through integrative
extension campaigns. Seminars can accelerate the emergence of new effective laws that
regulate most of the on going haphazard marketing practices in the country.
Domestic and World Trade Policies
Government should devise policies that could support the development of alternative
marketing channels such as commodity exchanges and forward contracts, which could
enhance exports.
Strengthen mechanisms of specifying and enforcing farming contracts, and simultaneously
help traders should create alliances for potential exports competitiveness with big and
established international traders. The Government should also help by establishing
proactive trading rules and procedures for developing the rules governing cash crop
marketing activity.
Prior to the admission to the WTO, both quality standards and integration of promotional
plans and strategies (advertising and public relations in our consulates) are required. This
requires also the improvement of domestic agricultural marketing information systems.
Investments and Market Infrastructure
A strategy that emphasizes and puts agricultural processing industry (agro-industry) at a
forefront is to be maintained. Agro-processing industries like sugar refining, food canning,
and sorghum flour milling; oil extraction industry are the most important areas.
Enhance investment in feeder roads network to reduce transportation costs between the
traditional surplus and deficit areas. Better and accessible roads are expected to improve,
supply of inputs thus stimulating crop productivity, commodity delivery and consequently
improve farmers bargaining power.
Farmers and Trade Unions
Traders and farmers need to be organized in a better way to serve and protect their interests,
rather than the current structures, which are mostly serving few market participants.
Safeguard farmers and traders interests by strengthening the local farmer organizations to
sell and buy commodities on behalf of their members, thus reduce traders' transaction costs.
Research, Capacity Building and Training
Price and Market-Structure Analysis for Some Selected Agricultural Commodities: Marketing
Costs and Margins
56
Government institutions must be equipped with necessary resources, well-trained personnel
to perform planning evaluation and follow up.
The primary concern of DAEM should not be limited just to identify costs and margins,
rather should go beyond to create outstanding knowledge that fills in gaps by future research
work to support policy makers in their efforts to promote the development of market
oriented food systems.
Capacity building programmes in markets and price monitoring are needed in order to make
the marketing information more useful and comparable. This is expected to improve data
quality and computation procedures covering all markets in all states.
Markets boards must be enriched with qualified members to design policies and improve
markets and marketing activities.
4.1.2 Crop-Specific Recommendations and Policy Implications
Cereals, particularly sorghum, are currently traded almost entirely in no auction market
without engagements for other institutional marketing arrangements like forward contracts
or commodity exchanges that has reasonable sustainability. Commodity exchange might
exist, but confined to few cash crops. Small farmers selling relatively small quantities to
traders/assemblers can benefit from the engagement of traders on the commodity exchanges
through forward contracting which is expensive for individual farmers. This will open up a
number of market-oriented mechanisms for reducing the risks of price and supply
instability, both for food and cash crops.
Most of the crop markets in Sudan are still deficient in necessary public services and market
infrastructure. Concrete floors, paved roads in central markets in addition to shades from
the sun, which also protect crops during rainy season, are essentials, particularly for crops
sensitive to rains as gum Arabic and Roselle ―Karkady‖.
Smuggling of gum Arabic to neighbouring markets greatly affects the domestic production
– this other than affecting income earnings of the Government discourages improvement in
the production and consumption of the product and hence should be abolished.
Formal livestock markets are to be developed via improvement of market auctioning
process and quality and measurement standards than the current per head transaction basis.
4.2 Limitations of the Study and Further Research
As the study used survey data that was collected at a fixed point of time, price spreads
which were expected to vary seasonally and greatly from one month to another, will not be
captured systematically. However, available information allowed us to able to make partial
examination of such variations, and hence identify part of the causes and not all.
Price and Market-Structure Analysis for Some Selected Agricultural Commodities: Marketing
Costs and Margins
57
Different commodities have different prices and different relative weights of importance as
far as different qualities of same type of commodity are concerned. The problem was how to
put all these together in one basket to come up with practical significance, as for instance,
sorghum has more than 13 cultivars, each has its own different price and quality
characteristics, however, we focused only on one, Feterita as indicative to other varieties.
In order to consider the marketing costs, gross and net margin returns at enterprise level
appropriately, it is instructive to examine first farm level performance with regard to costs
and margins and average them across the previous years. Unfortunately, available data was
bound to marketing aspects and ignored largely farm productions costs and returns.
Price and Market-Structure Analysis for Some Selected Agricultural Commodities: Marketing
Costs and Margins
58
REFERENCES AND RECOMMENDED READINGS
References Ali, Ibrahim Abd El Mageed (2006). Towards a conceptual framework for strategic cost management: The
concept, objectives, and instruments. Published Ph D. Faculty of economic sciences, Technical
University of Berlin. Germany.
Berger, Paul D, et al. (2002). Marketing Actions and the Value of Customer Assets: A Framework for
Customer Asset Management. Journal of Service Research, Volume 5, No. 1, August 2002 39-54. ©
2002 Sage Publications.
Boone, L. E and Kurtz, D. L. (1977). Contemporary marketing. 2nd
edition published by The Dryden Press.
Hinsdale, Illinois.
Carambas, Maria Cristina (2005). Analysis of Marketing Margins in ECO-Labelled Products. Paper prepared
for presentation at the XIth Congress of the EAAE (European Association of Agricultural
Economists), ‗The Future of Rural Europe in the Global Agri-Food System‘, Copenhagen, Denmark,
August 24-27, 2005. Center for Development Research (ZEF), University of Bonn, Germany email:
CBoS, (2009).Annual Report No. 49. Central Bank of Sudan. P.o. Box 313. Khartoum, Republic of the
Sudan.
Cloudius, Robert L. and Mueller, Willard F. (1961). Market structure Analysis as an orientation for research
in agricultural economics. In: Journal of Fram Economics, Vol 17 No. 3 p 513-553.
Dembele, N. N., Staatz, J. M., and Adjao, R. (2008). Training Module for Analyzing Agricultural Prices.
Training Workshop presented at Cotonou, 26-27 April 2008. Michigan State University, USA.
Enis, Ben M. (1980). Marketing Principles: 3rd
edition. Goodyear publishing company, Inc Santa Monica
California 90401.
El Tahir, F. R .A (1980). Marketing and price policies of oil seeds in the Sudan during the period 1960-1980.
An unpublished M. Sc. Thesis. Faculty of Agriculture. University of Khartoum.
FAO (1997).Implications of Economic policy for Food Security. A Training Manual prepared for the
agricultural policy support service policy assistant division, Food and Agriculture Organization.
Rome, and GTZ, 1997. Cited by Ismail, El Fadil. Ahmed. Agricultural Marketing in the Sudan:
Current Situation and Future Prospects. Results and Findings. A Report submitted to FAO under
TCP/SUD/2906 (A). ―Strengthening the Institutional Capacity for Planning, Economic and Policy
Analysis (PEPA) for the Agricultural Sector in the Sudan‖. Khartoum, Sudan, 2004.
FEWS NET (2008). Structure-Conduct-Performance and Food Security FEWS NET Markets Guidance, No
2 May 2008. FEWS NET Washington 1717 H St NW Washington DC 20006 [email protected]
FEWS NET (2009-a). Adjusting Prices for Inflation and Creating Price Indices. FEWS NET Markets
Guidance, No 3 May 2009. FEWS NET Washington 1717 H St NW Washington DC 20006
FEWS NET (2009-b). Commodity Market Maps and Price Bulletins: Tools for Food Security Analysis and
Reporting FEWS NET Markets Guidance, No 4. July 2009. FEWS NET Washington 1717 H St NW
Washington DC 20006 [email protected]
GAC (1996). A paper on Gum Arabic Marketing: Problems and constraints. Gum Arabic Corporation. A
conference on Gum Arabic. Friendship Hall Khartoum, October 1996.
Price and Market-Structure Analysis for Some Selected Agricultural Commodities: Marketing
Costs and Margins
59
Giovannucci, D. (2001.a). Food Quality Issues: Understanding HACCP and quality Management. The guide
to developing agricultural markets and agro-enterprises. The world Bank Group (internet source
2001).
Giovannucci , D. (2001.b). Market Information Services. A Guide to Developing Agricultural Markets
and Agro- enterprises and Senior Consultant to Markets and Agribusiness Thematic
Team (MATT), The World Bank.
Faki et al (2009). Determinants of Current Price Hikes and their Implications on the Poor and
Assessing Short Run Policy and Program Response Options in Containing, Reversing and
Mitigating their Negative Impacts In the 15 Northern States of Sudan. A comprehensive reported
submitted to SIFSIA North programme, FAO, 2009.
Funke, T. B. (2006). From Farm to Retail: Costs and Margins for Selected Food Industries in South Africa.
An M.Sc. Thesis in Agricultural Economics. Faculty of Economic and Management Studies,
University Of Pretoria. South Africa.
Idris, Babiker (2008).Livestock Marketing in Eastern and Central Sudan, Sector Policy Note, Sudan Multi
Donor Trust Fund-National, 2008.
Ismail, E.A. (1996). Spatial Organization of Food grain Storage Facilities in Sudan‖. Published Ph. D. ISBN
3-86186-135-6. Publisher: Verlag Ulrich E. Grauer Stuttgart, Germany, 1996.
Ismail, E. A. (2003).Livestock markets and marketing system in Gedaref state: An Analytical study by the
author (in Arabic). Khartoum University Press. Khartoum Sudan 2003.
Ismail, E. A. (2004). Agricultural Marketing In the Sudan: Current Situation and Future Prospects. Results
and Findings. A report submitted to FAO under TCP/SUD/2906 (A). ―Strengthening the institutional
capacity for planning, economic and policy analysis (PEPA) for the agricultural sector in the
Sudan‖. Khartoum, Sudan, (2004)
Ismail, E. A., (2008). Agricultural Finance in the Sudan: An Organizational Approach & Problem
Conceptualization. Volume 91. 2007. In series of: FARMING & RURAL SYSTEMS
ECONOMICS. ISBN 978-3-8236-1514-9 & ISSN 1616-9808 Margraf Publisher, Germany. Ismail, E. A. (2010). The Role of Agribusiness Investment centre in Improving the Performance of the
Agribusiness Sector in Sudan: Marketing Strategies, Policies, Procedures, and Action Plans for
Establishing the Agribusiness Market Information Systems. FAO, TCP/ SUD/ 3103(D). The
Ministry of Agriculture and Forestry-Directorate of International Cooperation and Investment
Promotion & The Agribusiness and Investment Promotion Centre (ABIC).
Ismail, E. A. (2010-b). Markets and Price Monitoring: A training material for government counterparts as
part of the national capacity-building programme. SIFSIA N, FAO, June 2010
Jayne, T. S. (1994). Do High Food Marketing Costs Constrain Cash Crop Production? Evidence From
Zimbabwe. Reprinted for private circulation from Economic Development and Cultural Change.
January 1994, Volume 42, Number 2.1994 by The University of Chicago.
Karam Allah, A. K (1996).Gum Arabic Characteristics. Gum Arabic Symposium in Sudan. Khartoum
October 1996. Unpublished paper.
Koutsoyiannis, A. (1977& 1972). Theory of Econometrics. 2nd
edition. Macmillan Press. London , U.K.
MoA (1988). Marketing Costs and Margins. Ministry of Agriculture and Natural Resources. Department of
Agricultural Economics. The Planning and Agricultural Economics Marketing Section. Khartoum,
October 1988.
Oladapo, M. O., S. Momoh, S. Yusuf and Awoyinka (2007). Marketing Margins and Spatial Pricing
Efficiency of Pineapple in Nigeria. In: Asian Journal of Marketing 1(1):14-22, 2007.
Riadh , Ben Jelili (2001). Markup Pricing in Tunisian Manufacturing Industries (Paper). Université de
Bretagne Sud and Legete 1 Villa Etex, 75018 Paris, France. [email protected].
Price and Market-Structure Analysis for Some Selected Agricultural Commodities: Marketing
Costs and Margins
61
Richard, Timothy J., Paul M. Patterson, and Pieter Van Ispelen (1998). Modelling Fresh Tomato Marketing
Margins: Econometrics and Neural Networks. In: Agricultural and Resource Economics Review pp.
186-199, October 1998.
Sarhan, M. E. (1988). Seasonal Movements in Sudan‘s Agricultural Commodity Prices and the Use of
Seasonal Price Indices in Forecasting and Making Sell/Hold Decisions. Technical Support by ASP
Project USAID/CHECCHI. Marketing Section. Department of Agricultural Economics and Planning
and Agricultural Economics Administration. MoAF, 1988.
Smeets, Roger, Harold Creusen, Arjan Lejour, Henk Kox (2010). Export margins and export barriers.
Uncovering market entry costs of exporters in the Netherlands. CBP Document No 208. ISBN 978-
90-5833-456-5 CPB Netherlands Bureau for Economic Policy Analysis. Van Stolkweg 14. P.O. Box
80510. 2508 GM The Hague, the Netherlands (Internet www.cpb.nl)
Smith, Lawrence D. (1992). Costs, Margins and Returns in Agricultural Marketing. Marketing and
Agricultural Development Paper No. 1. Department of Political Economy University of Glasgow. A
paper prepared for marketing and rural finance service. Food and Agriculture Organization.
September 1992.
Spiegel, R. Murray (1972). Statistics SI metric edition. Schaum‘s Outline Series. McGRAW-HILL, BOOK
COMPANY.
Timmer, C. P., Falcon, W. P. and Pearson, S. R. (1983). Food Policy Analysis. A World Bank publication.
John Hopkins University Press, 1983.
Von Oppen, M. and Gabagambi, D. M. (2003). Contribution of markets to agricultural productivity:
Evidence from developing countries. Quarterly journal of international agriculture 42(2003) No.
1:49-61
WFP (2007). Market Analysis in Emergency Food Security Assessments. Guidelines on Market Situation
Analysis & Forecast and Response Protocol. An Integral Component of Emergency Food Security
Assessment (EFSA). Prepared by: Getachew Dirba, Senior Programme Adviser & Simon Renk,
Programme Officer, ODAN Emergency Needs Assessment Service. United Nations World Food
Programme, Rome, Italy, August 2007.
WFP (2008). Comprehensive Food Security & Vulnerability Assessment (CFSVA) Guidelines Annexes.
World Food Programme. CFSVA Guidelines – Annexes April 16, 2008.
Wind, Yoram and Douglas Susan P. (1968). Marketing performance: A conceptual Framework. MSI-USDA
study Group on Marketing performance, June 1968
World Bank (2010). Value Chains for sheep, Cattle and Mutton Marketing from Western Sudan to
Omdurman and Port Sudan/Sawakin. Background paper for the Sudan: Country Economic
Memorandum. Prepared by Ahmed Abaker Mohammed Mina and Jack W. van Holst Pellekaan
(forthcoming). World Bank Khartoum and Washington, 2010.
Yalçin, Cihan (2000). Price-Cost Margins and Trade Liberalization in Turkish Manufacturing Industry: A
Panel Data Analysis, Türkiye Cumhuriyet Merkez Bankasý Araþtýrma Genel Müdürlüðü, March
2000.
Price and Market-Structure Analysis for Some Selected Agricultural Commodities: Marketing
Costs and Margins
61
Recommended Readings Faminow, M. D., and J.M. Laubscher. (1991). ‗‗Empirical Testing of Alternative Price Spread Models in the
South African Maize Market.‖ Agricultural Economics 6:49-66.
Gardner, B. (1975). ―The Farm-Retail Price Spread in a Competitive Food Industry.‖ American Journal of
Agricultural Economics 57:399-409.
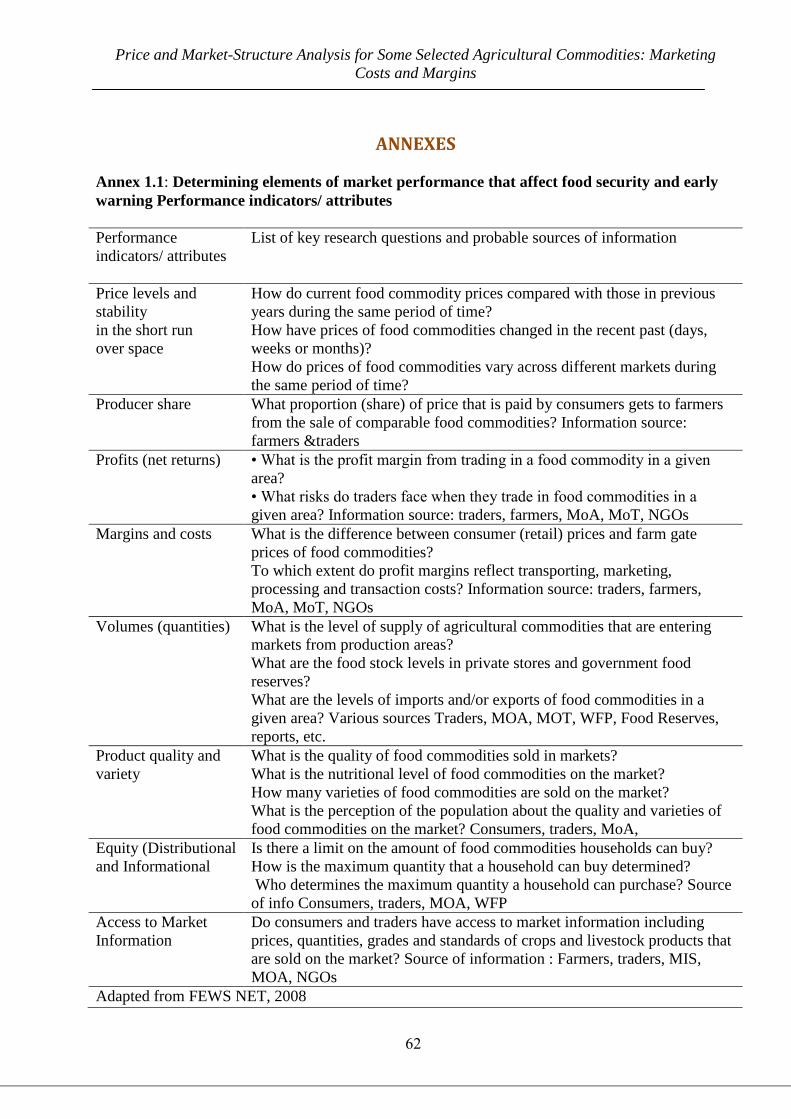
Price and Market-Structure Analysis for Some Selected Agricultural Commodities: Marketing
Costs and Margins
62
ANNEXES
Annex 1.1: Determining elements of market performance that affect food security and early
warning Performance indicators/ attributes
Performance
indicators/ attributes
List of key research questions and probable sources of information
Price levels and
stability
in the short run
over space
How do current food commodity prices compared with those in previous
years during the same period of time?
How have prices of food commodities changed in the recent past (days,
weeks or months)?
How do prices of food commodities vary across different markets during
the same period of time?
Producer share What proportion (share) of price that is paid by consumers gets to farmers
from the sale of comparable food commodities? Information source:
farmers &traders
Profits (net returns) • What is the profit margin from trading in a food commodity in a given
area?
• What risks do traders face when they trade in food commodities in a
given area? Information source: traders, farmers, MoA, MoT, NGOs
Margins and costs What is the difference between consumer (retail) prices and farm gate
prices of food commodities?
To which extent do profit margins reflect transporting, marketing,
processing and transaction costs? Information source: traders, farmers,
MoA, MoT, NGOs
Volumes (quantities) What is the level of supply of agricultural commodities that are entering
markets from production areas?
What are the food stock levels in private stores and government food
reserves?
What are the levels of imports and/or exports of food commodities in a
given area? Various sources Traders, MOA, MOT, WFP, Food Reserves,
reports, etc.
Product quality and
variety
What is the quality of food commodities sold in markets?
What is the nutritional level of food commodities on the market?
How many varieties of food commodities are sold on the market?
What is the perception of the population about the quality and varieties of
food commodities on the market? Consumers, traders, MoA,
Equity (Distributional
and Informational
Is there a limit on the amount of food commodities households can buy?
How is the maximum quantity that a household can buy determined?
Who determines the maximum quantity a household can purchase? Source
of info Consumers, traders, MOA, WFP
Access to Market
Information
Do consumers and traders have access to market information including
prices, quantities, grades and standards of crops and livestock products that
are sold on the market? Source of information : Farmers, traders, MIS,
MOA, NGOs
Adapted from FEWS NET, 2008
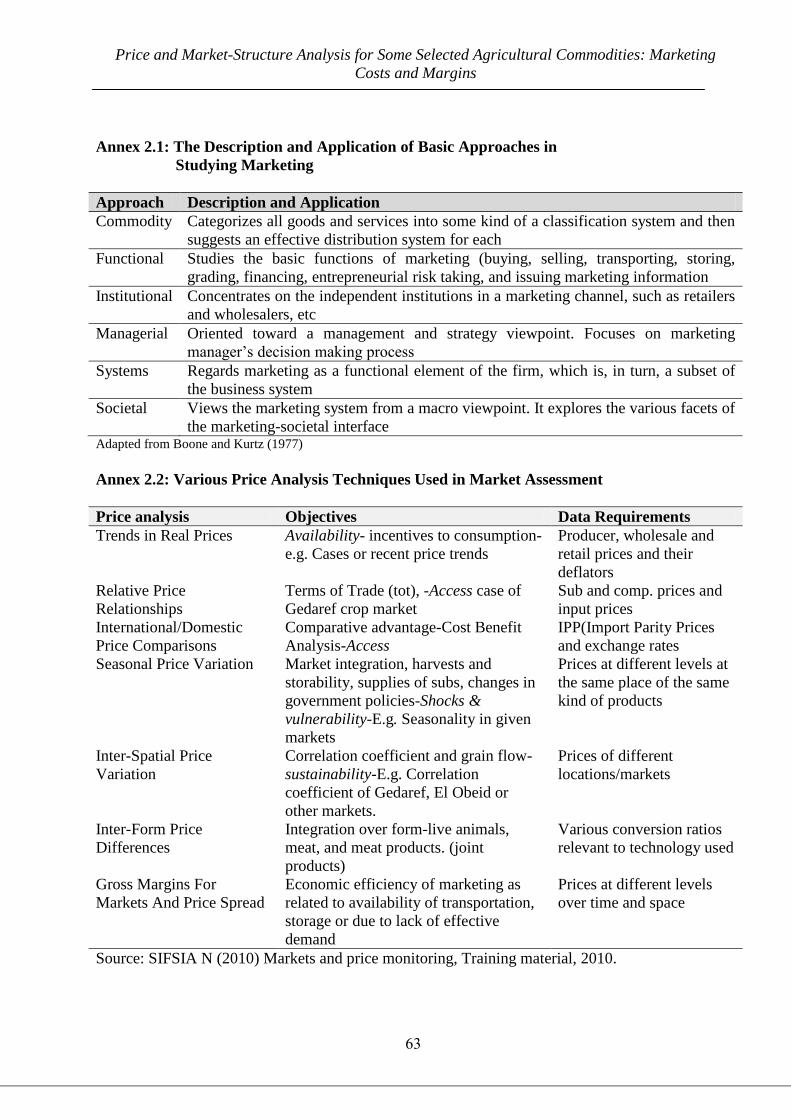
Price and Market-Structure Analysis for Some Selected Agricultural Commodities: Marketing
Costs and Margins
63
Annex 2.1: The Description and Application of Basic Approaches in
Studying Marketing
Approach Description and Application
Commodity Categorizes all goods and services into some kind of a classification system and then
suggests an effective distribution system for each
Functional Studies the basic functions of marketing (buying, selling, transporting, storing,
grading, financing, entrepreneurial risk taking, and issuing marketing information
Institutional Concentrates on the independent institutions in a marketing channel, such as retailers
and wholesalers, etc
Managerial Oriented toward a management and strategy viewpoint. Focuses on marketing
manager‘s decision making process
Systems Regards marketing as a functional element of the firm, which is, in turn, a subset of
the business system
Societal Views the marketing system from a macro viewpoint. It explores the various facets of
the marketing-societal interface Adapted from Boone and Kurtz (1977)
Annex 2.2: Various Price Analysis Techniques Used in Market Assessment
Data Requirements Objectives Price analysis
Producer, wholesale and
retail prices and their
deflators
Availability- incentives to consumption-
e.g. Cases or recent price trends
Trends in Real Prices
Sub and comp. prices and
input prices
Terms of Trade (tot), -Access case of
Gedaref crop market
Relative Price
Relationships
IPP(Import Parity Prices
and exchange rates
Comparative advantage-Cost Benefit
Analysis-Access
International/Domestic
Price Comparisons
Prices at different levels at
the same place of the same
kind of products
Market integration, harvests and
storability, supplies of subs, changes in
government policies-Shocks &
vulnerability-E.g. Seasonality in given
markets
Seasonal Price Variation
Prices of different
locations/markets
Correlation coefficient and grain flow-
sustainability-E.g. Correlation
coefficient of Gedaref, El Obeid or
other markets.
Inter-Spatial Price
Variation
Various conversion ratios
relevant to technology used
Integration over form-live animals,
meat, and meat products. (joint
products)
Inter-Form Price
Differences
Prices at different levels
over time and space
Economic efficiency of marketing as
related to availability of transportation,
storage or due to lack of effective
demand
Gross Margins For
Markets And Price Spread
Source: SIFSIA N (2010) Markets and price monitoring, Training material, 2010.
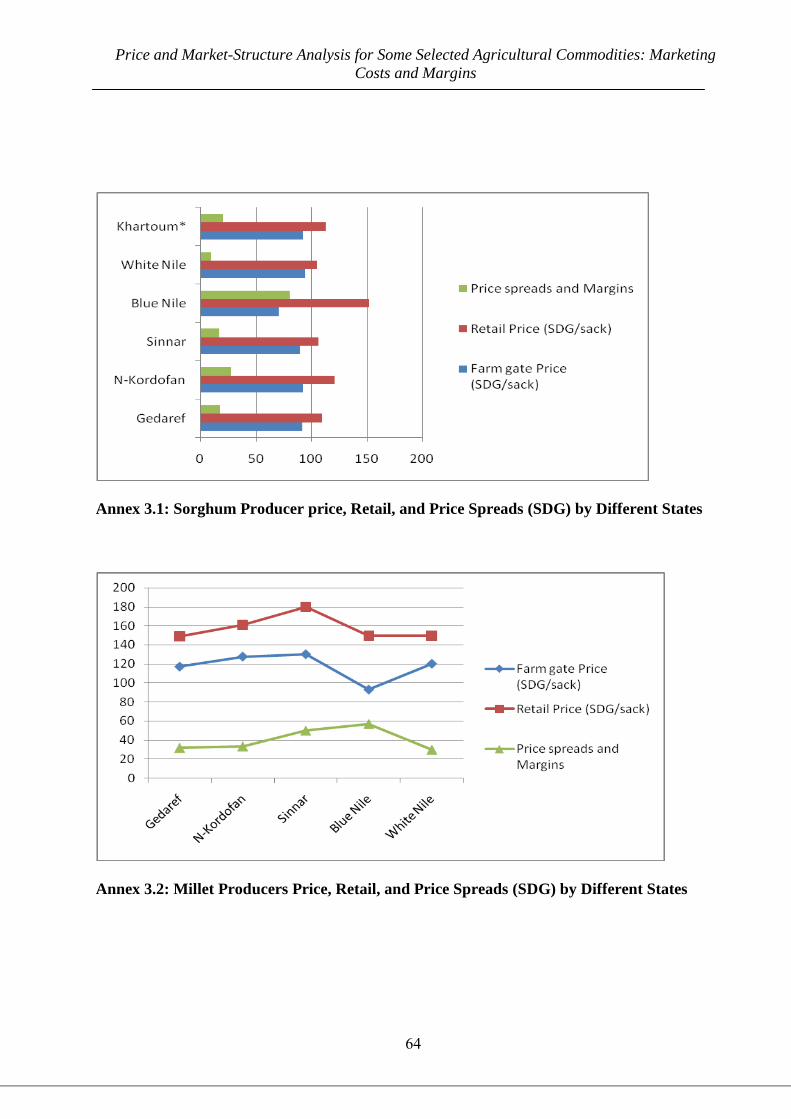
Price and Market-Structure Analysis for Some Selected Agricultural Commodities: Marketing
Costs and Margins
64
Annex 3.1: Sorghum Producer price, Retail, and Price Spreads (SDG) by Different States
Annex 3.2: Millet Producers Price, Retail, and Price Spreads (SDG) by Different States
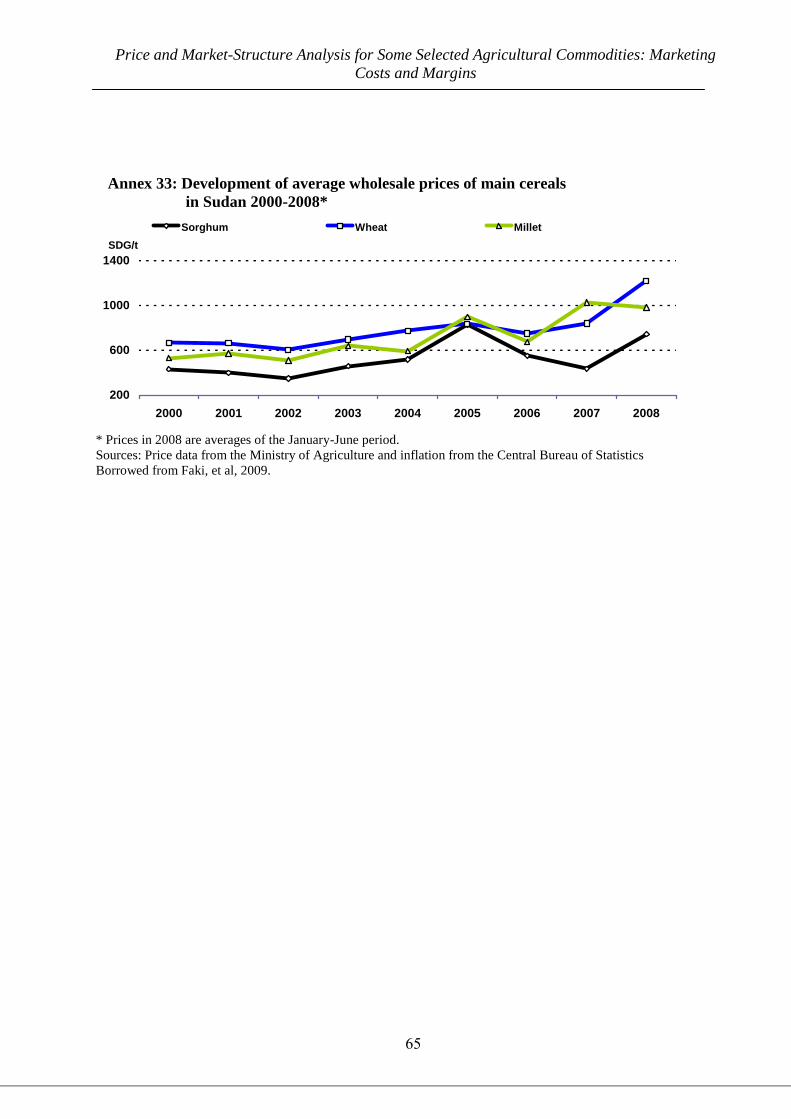
Price and Market-Structure Analysis for Some Selected Agricultural Commodities: Marketing
Costs and Margins
65
Annex 33: Development of average wholesale prices of main cereals
in Sudan 2000-2008*
200
600
1000
1400
2000 2001 2002 2003 2004 2005 2006 2007 2008
SDG/t
Sorghum Wheat Millet
* Prices in 2008 are averages of the January-June period.
Sources: Price data from the Ministry of Agriculture and inflation from the Central Bureau of Statistics
Borrowed from Faki, et al, 2009.