Embed Size (px)
Citation preview

1
Orange Polska
3Q’18 results
25 October 2018

2
This presentation contains 'forward-looking statements' including, but not limited to, statements regarding anticipated future events and financial performance with respect to our operations. Forward-looking statements can be identified by the fact that they do not relate strictly to historical or current facts. They often include words like 'believe', 'expect', 'anticipate', 'estimated', 'project', 'plan', 'pro forma', and 'intend' or future or conditional verbs such as 'will', 'would', or 'may‘. Factors that could cause actual results to differ materially from expected results include, but are not limited to, those set forth in our Registration Statement, as filed with the Polish securities and exchange commission, the competitive environment in which we operate, changes in general economic conditions and changes in the Polish, American and/or global financial and/or capital markets. Forward-looking statements represent management’s views as of the date they are made, and we assume no obligation to update any forward-looking statements for actual events occurring after that date. You are cautioned not to place undue reliance on our forward-looking statements.
Evolution of business trends is presented under the old IAS18 accounting standard. The new accounting standard, IFRS15, has been implemented by Orange Polska prospectively i.e. no comparative figures for past years restated to IFRS15 are provided. In the opinion of the Company, such approach assures continuity of performance vis-a-vis the recently announced strategy and already known business trends.
Forward looking statement

3
Adjustments to financial data Disclosures on performance measures, including adjustments, are presented in the Note 2 to Condensed IFRS Quarterly Consolidated Financial Statements of the Orange Polska Group for the 3 months ended 30 September 2018 (available at http://orange-ir.pl/results-center/results/2018)
* relates to EU subsidies for the Digital Poland Operational Programme (POPC) ** capitalised future payments for T-Mobile related to usage of the 900 MHz frequency until 2020
3Q'18 3Q’18 3Q’17 9m'18 9m’18 9m’17
in PLNm IFRS15 IAS18 IAS18 IFRS15 IAS18 IAS18
Revenue 2,755 2,800 2,814 8,171 8,332 8,471
0 0 0 0 0 0
Adjusted revenue 2,755 2,800 2,814 8,171 8,332 8,471
EBITDA 792 834 776 2,175 2,365 2,336
– Employment termination expense 0 0 0 0 0 8
Adjusted EBITDA 792 834 776 2,175 2,365 2,344
Capital expenditures 498 498 438 1,469 1,469 1,260
– Telecommunication licenses** 0 0 0 -32 -32 0
Adjusted capital expenditures 498 498 438 1,437 1,437 1,260
Organic cash flow -364 -364 290 -551 -551 254
– Investment grants received/paid to fixed assets suppliers* 1 1 -266 7 7 -266
– Payment of European Commission fine 646 646 0 646 646 0
Adjusted organic cash flow 283 283 24 102 102 -12

4
Contents
1. Highlights
2. Financial review
3. Conclusions
4. Q&A session

5
Highlights
Jean-François Fallacher Chief Executive Officer

6
9M2018 results on track with full-year expectations and Orange.one turnaround ambitions
Revenue
Adjusted EBITDA
Adjusted CAPEX
• Adjusted EBITDA stabilisation supported by growth in core future-proof revenue areas and cost savings
2018 guidance/
outlook
9M2018 (IAS18)
PLN 8.33bn -1.6% yoy
PLN 2.37bn** +0.9% yoy
stable vs 2017* (around PLN 3.0bn)
PLN 2.0-2.2bn PLN 1.44bn** +14.0% yoy
* Under IAS18 ** adjusted as presented on slide #3
decreasing
• As expected trend improved in Q3 (-0.5% yoy) vs 1H (-2.2%) • Growth in convergence (33% yoy), IT/IS (18% yoy) and mobile
wholesale (16% yoy)
• Fibre and mobile projects on track • In line with full-year outlook

7
945 1,137 1,178
3Q'17 2Q'18 3Q'18
Less churn with convergence (annualised)
Improving adjusted EBITDA trend (IAS18)
Growing B2C convergent customers
in k
Increasing pace of net savings in indirect costs (IAS18)
EBITDA trend improving mainly thanks to convergence, fibre and business transformation
yoy change
Stabilised convergence ARPO 46% 54% 55%
yoy change in PLN m
-5pts
Churn rate benefit
-4pts
convergent B2C customers vs total FBB B2C customers
convergent B2C customers vs total post-paid mobile B2C customers
-6.6%
+4.2%
-0.3%
-4.3%
+7.5%
3Q'17 4Q'17 1Q'18 2Q'18 3Q'18
+35
+141
+267
-2 12 47
9m'16* 9m'17* 9m'18
CO
MM
ER
CIA
L
TR
AN
SF
OR
MA
TIO
N Simplification and automation
drive employment evolution 15.9 14.9 13.8
end-Dec
2016
end-Dec
2017
end-Sept
2018
in kFTE end of period
* Adjusted by PLN 94m provision reversal in labour costs in 1Q'16
o/w gain on disposal of
assets
-1.3%
-2.4% -1.8%
-2.6%
-0.5%
-2.0%
-1.5% -0.2%
+0.4% +0.6%
3Q'17 4Q'17 1Q'18 2Q'18 3Q'18
Better core revenue trend (IAS18)
Core future-proof areas
reported
yoy change
Penetration in B2C FBB
-14.2% -11.5% -10.4%
-2.5%
+0.2%
3Q'17 4Q'17 1Q'18 2Q'18 3Q'18
yoy change
8
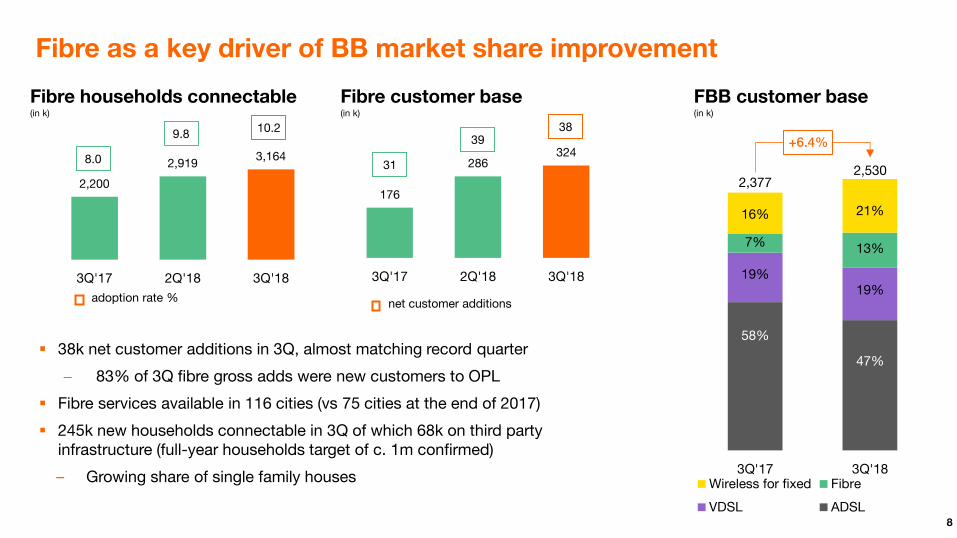
176
286 324
3Q'17 2Q'18 3Q'18
Fibre households connectable (in k)
2,200
2,919 3,164
3Q'17 2Q'18 3Q'18
Fibre as a key driver of BB market share improvement
Fibre customer base (in k)
net customer additions
31
39 38
FBB customer base (in k)
3Q'17 3Q'18Wireless for fixed Fibre
VDSL ADSL
2,530 2,377
+6.4%
47%
58%
19% 19%
16% 21%
13% 7%
38k net customer additions in 3Q, almost matching record quarter
− 83% of 3Q fibre gross adds were new customers to OPL
Fibre services available in 116 cities (vs 75 cities at the end of 2017)
245k new households connectable in 3Q of which 68k on third party infrastructure (full-year households target of c. 1m confirmed)
– Growing share of single family houses
adoption rate %
8.0
9.8 10.2

9
Financial review
Maciej Nowohoński Chief Financial Officer
10
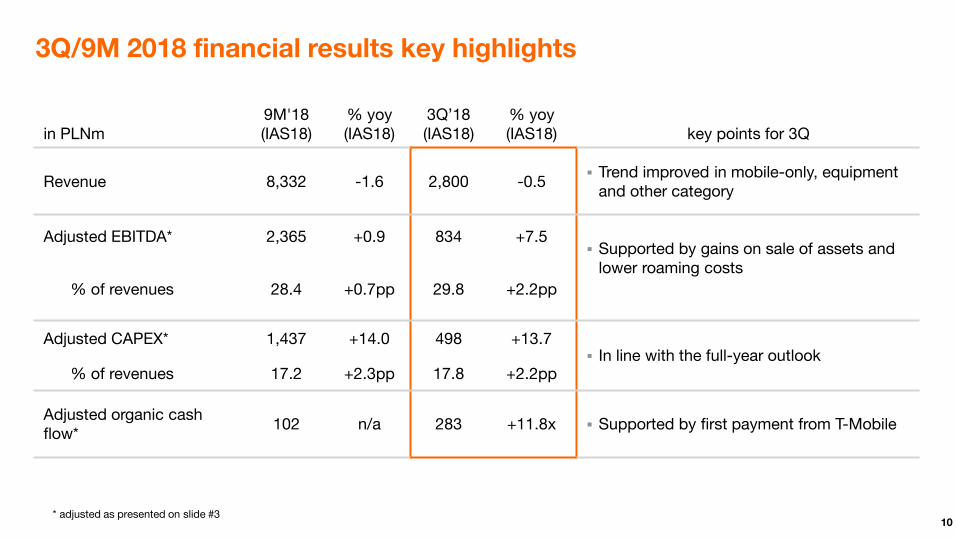
3Q/9M 2018 financial results key highlights
in PLNm 9M'18 (IAS18)
% yoy (IAS18)
3Q’18 (IAS18)
% yoy (IAS18) key points for 3Q
Revenue 8,332 -1.6 2,800 -0.5 Trend improved in mobile-only, equipment
and other category
Adjusted EBITDA* 2,365 +0.9 834 +7.5 Supported by gains on sale of assets and
lower roaming costs % of revenues 28.4 +0.7pp 29.8 +2.2pp
Adjusted CAPEX* 1,437 +14.0 498 +13.7 In line with the full-year outlook
% of revenues 17.2 +2.3pp 17.8 +2.2pp
Adjusted organic cash flow*
102 n/a 283 +11.8x Supported by first payment from T-Mobile
* adjusted as presented on slide #3

11
3Q revenues supported mainly by better trend in mobile-only and equipment Revenue evolution yoy change (IAS18)
Revenue evolution breakdown in PLNm
• Evolution on mono services improved due to roaming and better underlying trends
• Further dynamic growth of convergence revenues
• Equipment sales improved due to launch of instalment handset sales during lifetime of the contract
• Other revenues benefit from much higher energy resale
Core future-proof areas*
reported
* Areas core to future margin generation
3Q’17 (IAS18)
Convergent services
B2C
Mobile only &fixed BB
only service
Equipment sales
IT and integration
services
3Q’18 (IAS18)
3Q’18 (IFRS15)
IFRS15 impact
Other revenues
+78 -116
+4 +46 -59
+15 +18
-45 2,755
2,800 2,814
Core future-proof areas*
Legacy (narrowband only +fixed wholesale)
Wholesale ex fixed and
B2B Network Solutions
-1.3%
-2.4% -1.8%
-2.6%
-0.5%
-2.0%
-1.5% -0.2%
+0.4% +0.6%
3Q'17 4Q'17 1Q'18 2Q'18 3Q'18
+0.6%

12
Stable ARPO due to value oriented changes in Orange Love offer and successful upsell
B2C convergent ARPO (in PLN/month and yoy change in %)
945
1,137 1,178
3Q'17 2Q'18 3Q'18
B2C convergence revenues (in PLN m and yoy change in %)
B2C convergent customers (in k)
102.8 102.4 103.0
-14.2%
-2.5% +0.2%
3Q'17 2Q'18 3Q'18
279
342 357
31.0% 33.6% 28.0%
3Q'17 2Q'18 3Q'18
39%
77%
84%
4.0 4.1 4.1 RGU per customer
Share of Orange Love offer

13
(-10.7%) underlying trend
Improving trends in mono services
• Decline of mobile-only post-paid base further contained mainly due to effective retention
• Improving trends in mobile-only ARPO supported by roaming revenues, lower reprice on retention and effective recent commercial initiatives
• Stable underlying trend in broadband-only ARPO
• Continuing focus on value pricing despite market getting more competitive
30.9 28.7 28.7
-15.3%
-12.8%
-7.1%
3Q'17 2Q'18 3Q'18
Post-paid mobile-only retail ARPO (PLN/month and yoy % change)
yoy
4.7 4.7 4.8
7.9 7.6 7.6
1.8 2.2 2.3
3Q'17 2Q'18 3Q'18
B2C
convergent
postpaid
mobile only
prepaid
Mobile customer base (in millions)
14.4 14.6 14.5
share of post-paid
67% 68% 67%
total
FBB customer base (in k)
1,432 1,369 1,352
945 1,137 1,178
3Q'17 2Q'18 3Q'18
B2C
convergent
FBB only
2,377 2,530 2,506
total
FBB-only ARPO (in PLN/month and yoy % change)
58.8 56.8 56.6
-1.7% -0.9%
-3.7%
3Q'17 2Q'18 3Q'18
yoy
(-0.7%) underlying trend

14
Improved trend in direct margin due to:
Better trend in core future-proof revenues
Positive roaming impact
Continued good savings in indirect costs:
Strong positive impact from real estate disposals (PLN 90m yoy)
Last 12 months total indirect costs down 8%
3Q EBITDA supported by higher asset disposals and lower roaming costs
EBITDA evolution (yoy change in PLNm)
3Q’17 (IAS18)
3Q’18 (IAS18)
+116 indirect costs
Legacy services
direct margin
28.7% 27.6% margin
776 792
Growth services
direct margin
834
3Q’18 (IFRS15)
IFRS15 impact
-42
29.8%
-58 direct margin
15.2 13.8
3Q'17 3Q'18
employment down 8.7% yoy (in kFTE end of period)
15
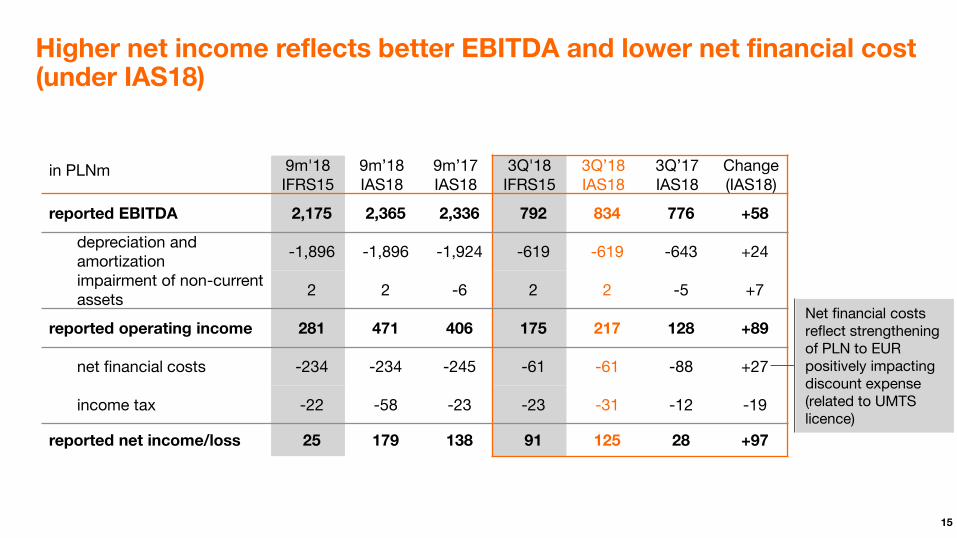
Higher net income reflects better EBITDA and lower net financial cost (under IAS18)
in PLNm 9m'18 IFRS15
9m’18 IAS18
9m’17 IAS18
3Q'18 IFRS15
3Q’18 IAS18
3Q’17 IAS18
Change (IAS18)
reported EBITDA 2,175 2,365 2,336 792 834 776 +58
depreciation and amortization
-1,896 -1,896 -1,924 -619 -619 -643 +24
impairment of non-current assets
2 2 -6 2 2 -5 +7
reported operating income 281 471 406 175 217 128 +89
net financial costs -234 -234 -245 -61 -61 -88 +27
income tax -22 -58 -23 -23 -31 -12 -19
reported net income/loss 25 179 138 91 125 28 +97
Net financial costs reflect strengthening of PLN to EUR positively impacting discount expense (related to UMTS licence)
16
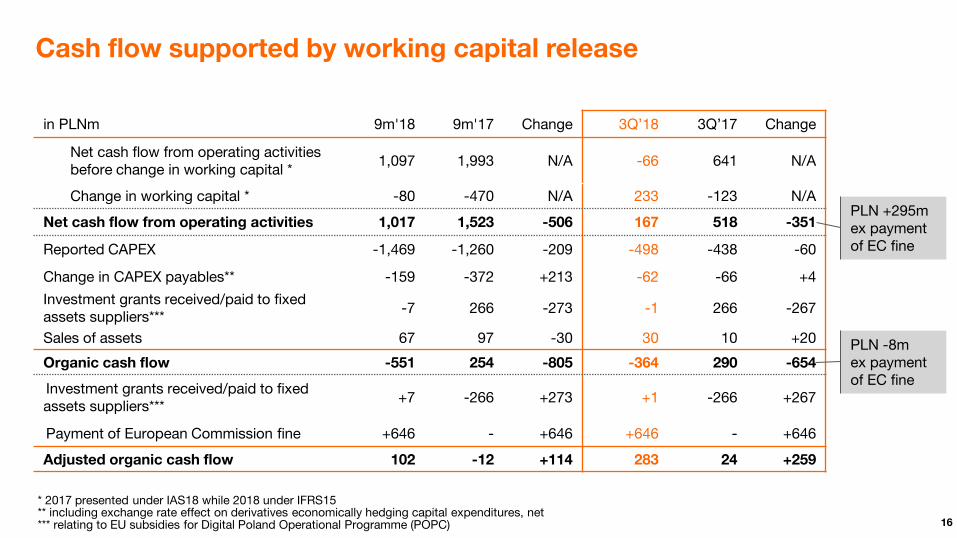
Cash flow supported by working capital release
in PLNm 9m'18 9m'17 Change 3Q’18 3Q’17 Change
Net cash flow from operating activities before change in working capital *
1,097 1,993 N/A -66 641 N/A
Change in working capital * -80 -470 N/A 233 -123 N/A
Net cash flow from operating activities 1,017 1,523 -506 167 518 -351
Reported CAPEX -1,469 -1,260 -209 -498 -438 -60
Change in CAPEX payables** -159 -372 +213 -62 -66 +4
Investment grants received/paid to fixed assets suppliers***
-7 266 -273 -1 266 -267
Sales of assets 67 97 -30 30 10 +20
Organic cash flow -551 254 -805 -364 290 -654
Investment grants received/paid to fixed assets suppliers***
+7 -266 +273 +1 -266 +267
Payment of European Commission fine +646 - +646 +646 - +646
Adjusted organic cash flow 102 -12 +114 283 24 +259
* 2017 presented under IAS18 while 2018 under IFRS15 ** including exchange rate effect on derivatives economically hedging capital expenditures, net *** relating to EU subsidies for Digital Poland Operational Programme (POPC)
PLN +295m ex payment of EC fine
PLN -8m ex payment of EC fine

17
Higher net debt to EBITDA ratio reflects payment of EC fine
end Dec 2017
end Sept 2018
Organic cash flow ex EC fine
net debt evolution change in PLNm
+71
Debt & derivatives MtM valuation change
7,119
+646
Payment of European
Commission fine
2.4 years – debt average duration
fixed vs floating interest rate currency exposure
Debt after hedging breakdown
100% PLN
91% fixed
9% floating
2.3x (IAS18)
2.2x (IAS18) net debt to adjusted EBITDA
3.4% 3.4% effective interest rate on debt
3Q’17 3Q’18
6,497 -95

18
Conclusions
Jean-François Fallacher Chief Executive Officer

19
Conclusion
In the upcoming peak commercial season focus on well managed value proposition
Continued focus on value pricing in more competitive environment
We reiterate our full-year guidance for 2018 adjusted EBITDA at around PLN 3.0 billion under IAS 18 and around PLN 2.75 billion under IFRS 15
Preparation of business transformation actions to deliver optimisations in 2019

20
Q&A

21
Glossary (1/3) 4G fourth generation of mobile technology, sometimes called LTE (Long Term Evolution)
ARPO Average Revenue per Offer
data user a customer who used mobile data transmission in a given month
Convergent services
Revenues from B2C convergent offers (excluding equipment sales). A convergent offer is defined as an offer combining at least a broadband access (xDSL, FTTx, cable or wireless for fixed) and a mobile voice contract (excluding MVNOs) with a financial benefit. Convergent services revenues do not include incoming and visitor roaming revenues
Core future-proof areas
Areas core to future margin generation consisting of: convergent services B2C, mobile only, fixed BB only, IT and integration services, B2B network solutions, wholesale revenues excluding fixed wholesale
EBITDA Operating income + depreciation and amortization + impairment of goodwill + impairment of non-current assets
FBB Fixed Broadband
Fibre fixed broadband access network based on FTTH(Fibre To The Home ) /DLA (Drop Line Agnostic) technology which provides the end user with speed of above 100Mbps
Fibre access network project
rollout of fixed broadband access network based on fibre technology which provides the end user with speed of above 100Mbps
Fixed broadband-only services
Revenues from fixed broadband offers (excluding B2C convergent offers and equipment sales) including TV and VoIP services
FTE Full time equivalent
Growth services Convergent services, mobile retail and wholesale, fixed broadband, IT and integration services, equipment and B2B network solutions and adjacent services

22
Glossary (2/3) Households (HH) connectable in fibre technology
Households where broadband access service based on fibre technology can be rendered
ICT Information and Communication Technologies
LTE Long Term Evolution, standard of data transmission on mobile networks (4G )
LTE user a customer who used LTE service at least once in a given month
M2M Machine to Machine, telemetry
MB Megabyte
Mobile-only services Revenue from mobile offers (excluding consumer market convergent offers) and Machine to Machine (M2M) connectivity. Mobile only services revenue does not include equipment sales, incoming and visitor roaming revenue
MVNO Mobile Virtual Network Operator
Organic Cash Flow Organic Cash Flow = Net cash provided by Operating Activities – (CAPEX + CAPEX payables) + proceeds from sale of assets
PB Petabyte
RGU Revenue Generating Unit
RLAH Roam Like At Home
SAC Subscriber Acquisition Costs
SIMO mobile SIM only offers without devices
SRC Subscription Retention Costs

23
Glossary (3/3)
VDSL Very-high-bit-rate Digital Subscriber Line
VHBB Very high speed broadband above 30Mbps
VoIP Voice over Internet Protocol
Wireless for fixed fixed broadband cell-locked wireless access offered by Orange Poland for home/office zone with rich data packages