Embed Size (px)
Citation preview
i
Prevalence and risk factors for CKDu in the district of Anuradhapura
Epidemiology Unit of Ministry of Health, Nutrition and Indigenous Medicine
World Health Organization
National Science Foundation of Sri Lanka
July- August 2017
Ver 1.1 (Modified version)
ii
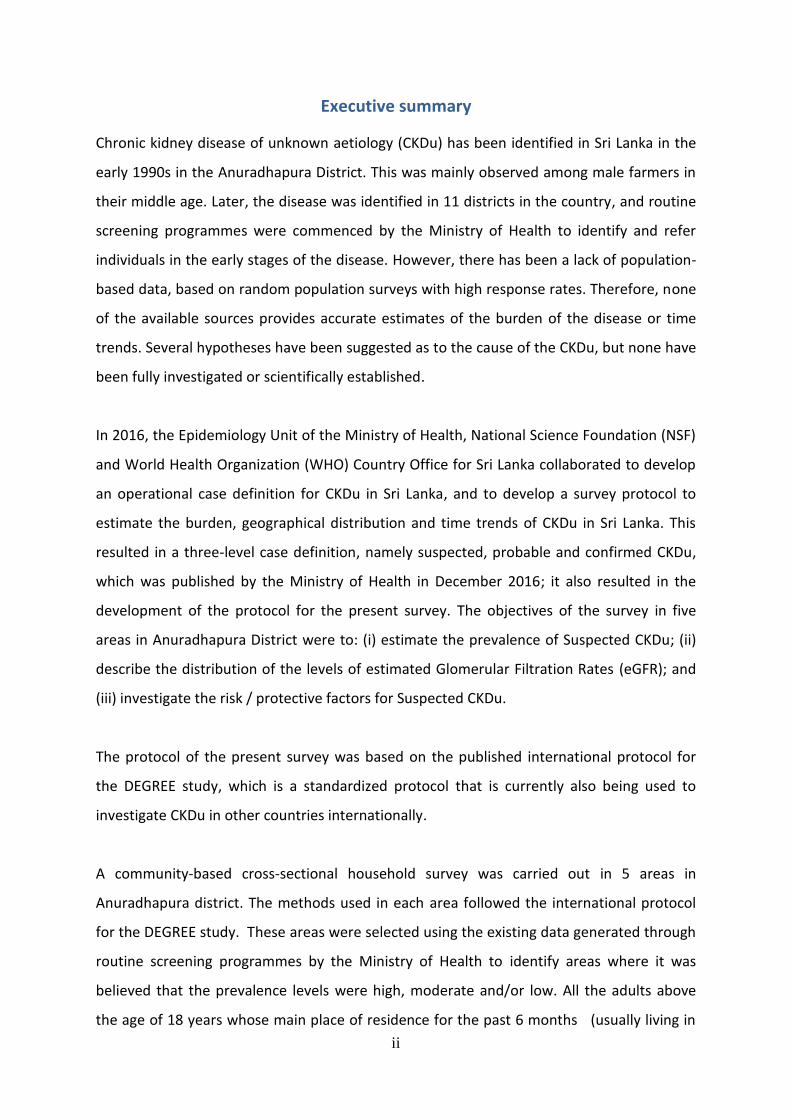
Executive summary
Chronic kidney disease of unknown aetiology (CKDu) has been identified in Sri Lanka in the
early 1990s in the Anuradhapura District. This was mainly observed among male farmers in
their middle age. Later, the disease was identified in 11 districts in the country, and routine
screening programmes were commenced by the Ministry of Health to identify and refer
individuals in the early stages of the disease. However, there has been a lack of population-
based data, based on random population surveys with high response rates. Therefore, none
of the available sources provides accurate estimates of the burden of the disease or time
trends. Several hypotheses have been suggested as to the cause of the CKDu, but none have
been fully investigated or scientifically established.
In 2016, the Epidemiology Unit of the Ministry of Health, National Science Foundation (NSF)
and World Health Organization (WHO) Country Office for Sri Lanka collaborated to develop
an operational case definition for CKDu in Sri Lanka, and to develop a survey protocol to
estimate the burden, geographical distribution and time trends of CKDu in Sri Lanka. This
resulted in a three-level case definition, namely suspected, probable and confirmed CKDu,
which was published by the Ministry of Health in December 2016; it also resulted in the
development of the protocol for the present survey. The objectives of the survey in five
areas in Anuradhapura District were to: (i) estimate the prevalence of Suspected CKDu; (ii)
describe the distribution of the levels of estimated Glomerular Filtration Rates (eGFR); and
(iii) investigate the risk / protective factors for Suspected CKDu.
The protocol of the present survey was based on the published international protocol for
the DEGREE study, which is a standardized protocol that is currently also being used to
investigate CKDu in other countries internationally.
A community-based cross-sectional household survey was carried out in 5 areas in
Anuradhapura district. The methods used in each area followed the international protocol
for the DEGREE study. These areas were selected using the existing data generated through
routine screening programmes by the Ministry of Health to identify areas where it was
believed that the prevalence levels were high, moderate and/or low. All the adults above
the age of 18 years whose main place of residence for the past 6 months (usually living in
iii
the area for at least for 5 days of the week during the past 6 months) was in the study area
were eligible to be included in the study. Exclusion criteria were pregnant women and
patients undergoing treatment for cancers. The study aimed to recruit 1000 eligible study
participants from each of the study areas, as specified in the DEGREE protocol. Recruitment
of study participants was done through a household survey. Upon recruitment, the pre-
tested questionnaire was administered by trained graduates in health promotion. The study
participants were then invited to a ‘clinic’ on the following morning with an early morning
urine sample. In the clinics, height, weight, body composition, random blood sugar and
blood pressure were measured using the specified instruments and protocols. Trained
science graduates from the Rajarata University and retired nurses conducted the clinic
procedures. All the participants were assigned a unique id number. Blood and urine samples
were transported in cool boxes, while keeping the temperature at 2-8 oC, and were analyzed
at Chemical Pathology Department at Teaching Hospital, Anuradhapura on the same night.
IDMS quality standards were adhered to in the assessment of the serum creatinine, and
aliquots were also separated for bio-banking purposes. Field and clinic data collection was
supervised by the members of the research team and all the laboratory tests were done
under the supervision of the Consultant Chemical Pathologist. Data entry was done using
the Epidata software.
The overall response rate was 88.7%; the response among females (90.4%) was higher than
in males (85.4%). The study included more females (68.2%): fewer males in the study area
were eligible to be included in the study than were females as more males were employed
in occupations which made them live outside their residences during the 6 months period
prior to the study.
The overall prevalence of Suspected CKDu was found to be 13.3%, with the male prevalence
being significantly higher than in females (Male, 19.9%; Female, 10.5%). However, these
estimates were based on excluding ‘probable hypertension cases’; if ‘possible hypertension
cases’ were also excluded, this reduced the prevalence estimate for suspected CKDu by
almost a quarter, from 13.3% to 9.5% (Male-14.2%, Female- 7.5%). The prevalence of CKD
with a known cause for CKD as identified by the present survey (i.e. excluding those
classified as ‘Suspected CKDu’ (hypertension on treatment with more than two drugs OR
iv
untreated blood pressure of more than 160/100 mmHg AND/OR diabetes mellitus -history
of diabetes OR being on treatment OR capillary random plasma glucose >200 mg/dL)) was
6.7% (Male – 8.6%, Female – 5.8%).
Out of the all five study areas, “Puhudivula” showed a statistically significant lower level of
mean eGFR. However, the mean eGFR levels of males in all five areas were similar. In three
out of five areas, males showed significantly lower mean eGFR compared to females in the
same areas.
Being in the age categories of 41 – 50years, 51 – 60 years, 61-70 years and > 70 years,
currently not married, ever smoking, history of CKD among parents or siblings and both
farming for >10 and < 10 years were significant predictors for decreasing eGFR when
adjusted for the effect of confounding was seen in both males and females.
Being a male showed a significantly higher risk for Suspected CKDu.
Being in the age categories of 41-50 years, 51-60 years, 61-70 years and > 70 years was a
significant risk factor for Suspected CKDu when adjusted for the effect of confounding in
both sexes.
Lesser number of years of education in schools and in higher education institutes, ever
smoking, ever use of smokeless tobacco, high body water %, farming for ≥ 10 years and
working outside the sun 20 hours or more per week were risk factors for Suspected CKDu
only among males when adjusted for the effect of confounding while none were found to be
the risk factors for Suspected CKDu only among females.
The environmental exposures and occupational related factors studied in the present survey
were based on self-reports and were proxy measures. Overall, farming was the main
occupational/environmental risk factor for Suspected CKDu. Particular exposures associated
with farming (e.g. pesticide exposure, heat exposure) did not appear to explain the
increased risk from farming, but the available exposure information was limited, and these
findings may change when better exposure data are obtained. It should be noted that the
present study adopted a cross-sectional design which does not allow the examination of the
v
temporal relationship between the identified significant risk/protective factors and the
Suspected CKDu status.
We recommend further surveys in other districts of the country using the same protocol to
estimate the prevalence of Suspected CKDu to better understand the burden and
distribution of the problem.
The modifiable risk factors identified in this study are recommended to be used in the
ongoing primary or secondary preventive activities.
The environmental exposures and occupational related factors studied in the present survey
were based on self-reports and were proxy measures and the cross-sectional design used
precluded assessment of the temporal relationship of the identified risk factors. Thus, it is
recommended that a prospective cohort study is conducted using quantitative
measurements of environmental exposures including agrochemical residues, weedicides
and pesticides, heat exposure, heavy metals in water, and infections.
vi
Table of Contents Executive summary .................................................................................................................... ii
1 Introduction ........................................................................................................................ 1
1.1 Background .................................................................................................................. 1
1.2 Objectives .................................................................................................................... 3
2 Methods .............................................................................................................................. 4
2.1 Study design ................................................................................................................ 4
2.2 Study settings .............................................................................................................. 4
2.3 Study population ......................................................................................................... 5
2.4 Sample size and sampling technique .......................................................................... 5
2.5 Study instruments ....................................................................................................... 6
2.6 Data collection............................................................................................................. 6
2.7 Ethical considerations ............................................................................................... 10
2.8 Data analysis .............................................................................................................. 10
3 Results ............................................................................................................................... 14
4 Conclusions ....................................................................................................................... 56
5 Recommendations ............................................................................................................ 58
6 References ........................................................................................................................ 59
7 Annexures ......................................................................................................................... 60
vii
List of Tables
Table 2.1: The study areas included in the survey .................................................................... 5
Table 3.1: Distribution of the Male, Female and Overall Response Rate of the Study
Population ................................................................................................................................ 14
Table 3.2: Distribution of the Study Population by Socio-demographic Characteristics and
Study Areas .............................................................................................................................. 15
Table 3.3: Distribution of the Study Population by Employment Status and Ever Occupation
in Farming and Study Areas ..................................................................................................... 17
Table 3.4: Distribution of the Male Study Population by the Duration of Engagement in
Different Types of Farming and Study Areas ........................................................................... 18
Table 3.5: Distribution of the Female Study Population by the Duration of Engagement in
Different Types of Farming and Study Areas ........................................................................... 19
Table 3.6: Distribution of the Study Population by the Presence of Selected Non-
Communicable Diseases reported by the Respondent as being diagnosed (with or without
confirmation through medical records) and Study Areas ....................................................... 21
Table 3.7: Distribution of the Study Population by the Current Use of Angiotensin-Converting
Enzyme Inhibitors Verified by the Medical Reports and Study Areas ..................................... 21
Table 3.8: Distribution of the Study Population by the History of CKD among Parents and
Siblings and Study Areas .......................................................................................................... 22
Table 3.9: Distribution of the Study Population by Use of Tobacco, Alcohol and Smokeless
Tobacco, Sex and Study Areas ................................................................................................. 22
Table 3.10: Distribution of the Study Population by Drinking Water Sources (within the top
three most frequently used sources for at least 10 years as reported by the respondents)
and Study Areas ...................................................................................................................... 24
Table 3.11: Distribution of the Study Population by Exposure to Chemical
Fertilizers/Weedicides/ Pesticides (self-reported ‘non-rare’ use for at least 5 years) and
Study Areas .............................................................................................................................. 25
viii
Table 3.12: Distribution of the Study Population by Amount of Drinking Water Consumed
per a usual day as Reported by the Respondents and Study Areas ........................................ 26
Table 3.13: Distribution of the Study Population by Duration of Work done Outdoors in the
Sunlight (self-reported hours of outdoor work per usual day and days per usual week in the
sunlight) and Study Areas ........................................................................................................ 26
Table 3.14: Distribution of the Study Population by History of Envenomation Following a
Snake Bite (history of being admitted to a western medical facility and kept under
observation for complications for more than 24 hours or having received anti-venom
treatment) ................................................................................................................................ 26
Table 3.15: Distribution of the Study Population by the Biological Parameters and Study
Areas ........................................................................................................................................ 27
Table 3.16: Distribution of the Study Population by the Mean eGFR and Study Areas by Sex
.................................................................................................................................................. 29
Table 3.17a: Distribution of the Study Population by the Stages of CKD Classification based
on eGFR and Study Areas ......................................................................................................... 29
Table 3.17b: Distribution of the Study Population by the Stages of CKD Classification based
on eGFR and Age Categories .................................................................................................... 30
Table 3.18: Presence of Essential Screening Criteria for CKD/CKDu by Sex and Study Areas . 30
Table 3.19a: Prevalence of Categories of Suspected CKDu by Sex and Study Areas............... 32
Table 3.19b: Prevalence of Categories of Suspected CKDu among Males by Age Categories
and Study Areas ....................................................................................................................... 33
Table 3.19c: Prevalence of Categories of Suspected CKDu among Females by Age Categories
and Study Areas ....................................................................................................................... 33
Table 3.19d: Prevalence of Presence of Essential Screening Criteria and a Known Cause for
CKD by Sex and Study Areas .................................................................................................... 34
Table 3.19h: Prevalence of Suspected CKDu by Varying the Exclusion Criteria of
Hypertension and Diabetes by Sex and Study Areas ............................................................... 35
ix
Table 3.20: Basic Characteristics of the Study Population by Mean eGFR and Suspected CKDu
.................................................................................................................................................. 37
Table 3.21: Tobacco, Alcohol and Smokeless Tobacco use Habits of the Study Population and
by Mean eGFR and Suspected CKDu........................................................................................ 39
Table 3.22: Biological Parameters of the Study Population by Mean eGFR and Suspected
CKDu ......................................................................................................................................... 40
Table 3.23: Study Population by History of CKD among Parents and Siblings and Mean eGFR
and Suspected CKDu ................................................................................................................ 41
Table 3.24: Association between Socio-Demographic Characteristics and eGFR and
Suspected CKDu ....................................................................................................................... 41
Table 3.25: Age and Sex Adjusted Association between Presence of Ischemic Heart Disease
and eGFR and Suspected CKD .................................................................................................. 42
Table 3.26: Age and Sex Adjusted Association between Tobacco, Alcohol and Smokeless
Tobacco use Habits and eGFR and Suspected CKDu ............................................................... 43
Table 3.27: Age and Sex Adjusted Association between Biological Parameters and eGFR and
Suspected CKDu ....................................................................................................................... 43
Table 3.28: Age and Sex Adjusted Association between History of CKD among Parents or
Siblings and eGFR and Suspected CKDu................................................................................... 44
Table 3.29: Age and Sex Adjusted Association between the Drinking Water Sources (within
the top three most frequently used sources for at least 10 years as reported by the
respondents) and eGFR and Suspected CKDu ......................................................................... 44
Table 3.30: Age and Sex Adjusted Association Between Ever Occupied in Any Farming as Full
Time or Part Time and its Duration and eGFR and Suspected CKDu ....................................... 45
Table 3.31: Age and Sex Adjusted Association between Use of Medication and eGFR and
Suspected CKDu ....................................................................................................................... 45
Table 3.32: Age and Sex Adjusted Association Between Consumption of Selected Food Items
(based on self- reported consumption of the specific food item 3 or more days during the
week prior to the survey) and eGFR and Suspected CKDu ...................................................... 46
x
Table 3.33: Age and Sex Adjusted Association Between the Amount of Drinking Water
Consumed per a Usual Day as Reported by the Respondents and eGFR and Suspected CKDu
.................................................................................................................................................. 47
Table 3.34: Age and Sex Adjusted Association between Exposure to Chemical
Fertilizers/Weedicides/ Pesticides (self-reported ‘non-rare’ use for at least 5 years) and
eGFR and Suspected CKDu ....................................................................................................... 47
Table 3.35: Age and Sex Adjusted Association between Duration of Work Done Outdoors in
the Sunlight (self-reported hours of outdoor work per usual day and days per usual week in
the sunlight) and eGFR and Suspected CKDu .......................................................................... 48
Table 3.36: Age and Sex Adjusted Association Between History of Envenomation Following a
Snake Bite (history of being admitted to a western medical facility and kept under
observation for complications for more than 24 hours or having received anti-venom
treatment) ................................................................................................................................ 48
Table 3.37: Predictors of eGFR using Multiple Linear Regression ........................................... 49
Table 3.38: Risk/Protective Factors for Suspected CKDu Using Multiple Logistic Regressions
.................................................................................................................................................. 52
xi
List of Annexures
Annexure i: The case definition of Chronic Kidney Disease of unknown aetiology (CKDu) .... 60
Annexure ii: The interviewer-administered questionnaire used in the household survey ..... 62
Annexure iii: Clinic Sheet- Survey to estimate the burden of CKDu in Sri Lanka .................... 67
Annexure iv: Details of the distribution of the study population by the presence of each of
the exclusion criteria to identify Suspected CKDu ................................................................... 68
Annexure v: Definition of CKDu according to DEGREE protocol ............................................. 69
Annexure vi: Prevalence of CKDu according to DEGREE protocol ........................................... 70
xii
Research Team
1. Dr Thilanga Ruwanpathirana (Principal Investigator) Consultant
Epidemiologist, Epidemiology Unit, Ministry of Health, Nutrition and
Indigenous Medicine
2. Dr Sameera Senanayake – Senior Registrar in Community Medicine,
Epidemiology Unit, Ministry of Health, Nutrition and Indigenous Medicine
3. Dr Nalika Gunawardana – National Professional Officer – Health System
Analysis and Evidence, World Health Organization, Country Office, Sri Lanka
4. Dr Asoka Munasinghe – Regional Epidemiologist, Regional Director of Health
Services, Anuradhapura
5. Dr Thurshara Hewageegana – Consultant Chemical Pathologist – Teaching
Hospital, Anuradhapura
6. Dr Pubudu Chulasiri – Consultant Community Physician, Chronic Kidney
Disease Prevention Unit, Ministry of Health, Nutrition and Indigenous
Medicine
xiii
Technical Advisory Team
1. Prof. Rajitha Wickramasinghe - Prof. of Epidemiology and Biostatistics and
Former Dean, Faculty of Medicine, University of Kelaniya, Sri Lanka
2. Dr S. Amunugama – Deputy Director General (Public Health Services)1,
Ministry of Health, Sri Lanka
3. Dr Paba Palihawadana - Chief Epidemiologist, Epidemiology Unit, Ministry of
Health, Sri Lanka
4. Dr Samitha Ginige - Consultant Epidemiologist, Epidemiology Unit, Ministry of
Health, Sri Lanka
5. Dr Hasitha Tissera - Consultant Epidemiologist, Epidemiology Unit, Ministry of
Health, Sri Lanka
6. Dr Deepa Gamage - Consultant Epidemiologist, Epidemiology Unit, Ministry
of Health, Sri Lanka
7. Dr Jagath Amarasekara - Consultant Epidemiologist, Epidemiology Unit,
Ministry of Health, Sri Lanka
8. Dr Buddi Lokuketagoda – Consultant Community Physician, Kidney Disease
Prevention Unit, Ministry of Health, Sri Lanka
9. Dr Chamley Premajayantha – Medical Officer, Epidemiology Unit, Ministry of
Health, Sri Lanka
10. Dr Eranga Wijewickrama – Consultant Nephrologist / Senior Lecturer, Faculty
of Medicine, University of Colombo, Sri Lanka
11. Dr Mathu Selwarajah - Consultant Nephrologist, Teaching Hospital, Ragama,
Sri Lanka
12. Dr Nalaka Herath - Consultant Nephrologist, Teaching Hospital, Karapitiya, Sri
Lanka
13. Dr Gaya Katulanda – Consultant Chemical Pathologist, Medical Research
Institute, Sri Lanka
14. Dr Manjula Dissanayaka - Consultant Chemical Pathologist, Teaching Hospital,
Karapitiya, Sri Lanka
15. Prof. Neil Pearce - Professor of Epidemiology and Biostatistics, Director of the
Centre for Global Non-communicable Disease, at the London School of
Hygiene and Tropical Medicine, UK
1
1 Introduction
1.1 Background
Chronic kidney disease of unknown aetiology (CKDu) is one of the diseases of public health
importance in Sri Lanka, affecting predominantly farmers. Either all or few of the Divisional
Secretariat Divisions of 11 districts (out of 25 districts) in the country (Anuradhapura,
Polonnaruwa, Kurunegala, Ampara, Trincomalee, Badulla, Mullaitivu, Vavuniya, Matale,
Monaragala, Hambanthota) have been designated as ‘at risk’ for the occurrence of CKDu.
Though perceived by many to be a disease of high prevalence and with trends of increasing
prevalence, none of the current sources of data in the country allows for accurate
estimation of the burden and trends of CKD or CKDu in the country. Routine morbidity and
mortality surveillance through hospital statistics and vital registration systems does not have
a specific category for CKD or CKDu. Community-based screening programmes in areas
designated as ‘high risk’ have had challenges of low coverage and lack of exposure-related
data. The special household survey that has been conducted in the designated ‘high risk’
areas in 2015, collected information only on the diagnosed CKD/ CKDu patients and did not
include a method to identify the early asymptomatic cases, precluding the use of the data to
estimate the prevalence of CKD/CKDu. Data of CKD patients in the Provincial Renal Disease
Prevention and Research (PRDPR) Unit was restricted to the North-Central Province of the
country. Though this database was derived from household data and included some
exposure data, the period of data collection ranged from 2003 to the current time with no
updating to exclude deaths. Furthermore, none of the sources of data is designed to
generate information to formulate hypotheses that could guide further research to identify
the causes of CKDu.
World Health Organization (WHO) Country Office for Sri Lanka and Presidential Task Force
jointly convened a three-day international expert consultation in April 2016 which
recommended a survey to understand the burden, geographical distribution and time
trends of CKDu in Sri Lanka. It was recommended that the results should provide a platform
for long-term research to understand the role of potential risk factors and document the
usefulness of ongoing interventions.
2
To take forward the recommendations, National Science Foundation (NSF) and the World
Health Organization (WHO) Country Office for Sri Lanka jointly organized a two-day
workshop on 24th and 25th October 2016. The participants comprised nephrologists,
physicians, clinical researchers, non-medical researchers, epidemiologists, program
managers at the national/province level and international experts. The workshop provided a
platform to brainstorm and develop a case definition and a survey protocol to understand
the burden, geographical distribution and time trends of CKDu in Sri Lanka. The participants
agreed upon a three-level case definition namely suspected, probable and confirmed CKDu
The Ministry of Health issued an official communication (EPID 449 (v)/2016 dated 24
December 2016) (Annexure I) requesting all health professionals to use the case definition
at different levels of health system for the purpose of screening, patient management and
in record keeping. The responsibility for designing and implementing the survey was handed
over to the Epidemiology Unit in the Ministry of Health. The funding support was provided
by the National Science Foundation (Grant Number: RPHS/2016/CKDu 07). The protocol for
the proposed survey was based on the international protocol for the DEGREE study (Caplin
et al, 2017) which is a published standardized protocol offering a scientifically rigorous
method to be followed in surveys assessing burden due to CKDu.
This survey was undertaken to fulfil the need to understand the burden, geographical
distribution and time trends of CKDu and follows the protocol agreed upon at the workshop.
The survey was conducted in five study areas in the district of Anuradhapura. It is the district
which records the highest numbers of patients with CKDu in Sri Lanka since the recognition
of the problem in the 1990s.
3
1.2 Objectives
To estimate the prevalence of Suspected CKDu1 in the study areas
To estimate the prevalence of CKD in the study areas
To describe the distribution of the levels of estimated Glomerular Filtration Rates among the
study participants in the study areas
To determine the risk / protective factors for Suspected CKDu in the study areas
1 Criteria used to classify study participants as Suspected CKDu in the Case definition in Sri Lanka.
Essential criteria: eGFR < 60 mL/min using CKD EPI equation: One time measurement using standardized methods for creatinine measurement AND/OR albuminuria > = 30 mg/g Exclusion criteria to identify suspected CKDu among those satisfying above criteria
i. Urine protein: creatinine ratio > 2 g/g creatinine OR urine albumin: creatinine ratio >0.3 g/g creatinine
ii. Hypertensive on treatment with more than two drugs OR untreated blood pressure of more than 160/100 mmHg (preferably using electronic BP apparatus, sitting position, at least two readings one minute apart)
iii. History of diabetes OR being on treatment OR capillary random plasma glucose >200 mg/dL
4
2 Methods
2.1 Study design
This was a community-based cross-sectional household survey.
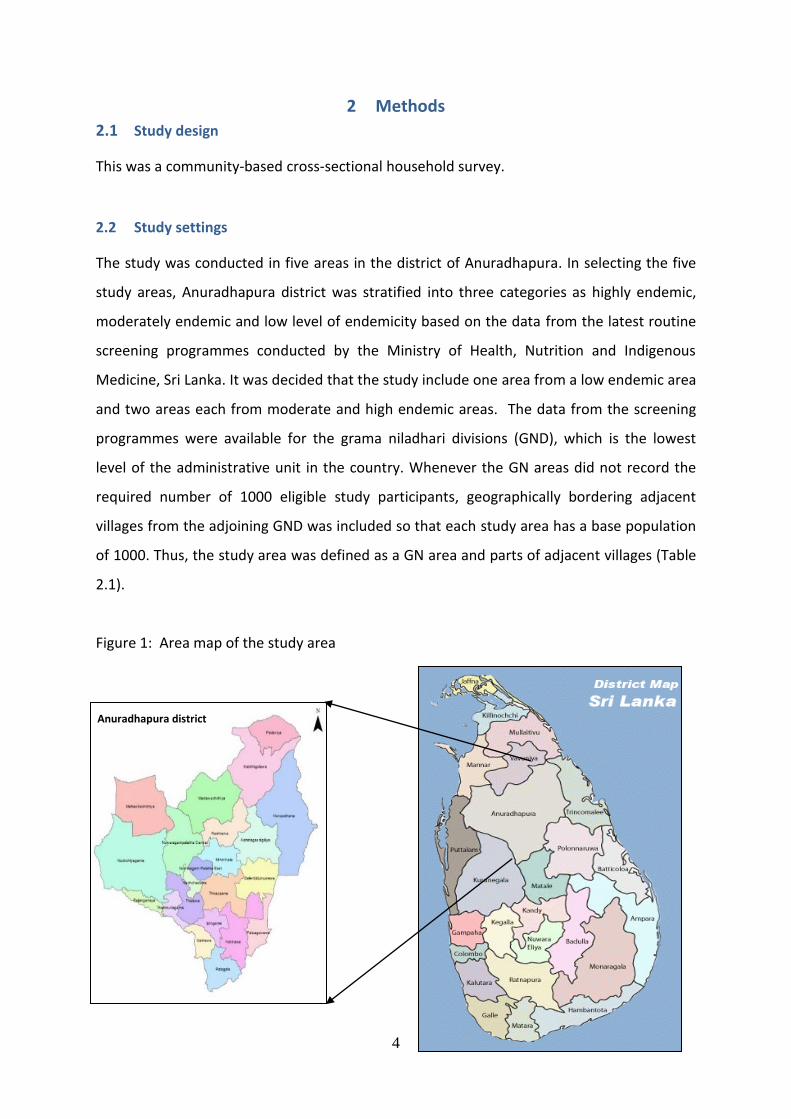
2.2 Study settings
The study was conducted in five areas in the district of Anuradhapura. In selecting the five
study areas, Anuradhapura district was stratified into three categories as highly endemic,
moderately endemic and low level of endemicity based on the data from the latest routine
screening programmes conducted by the Ministry of Health, Nutrition and Indigenous
Medicine, Sri Lanka. It was decided that the study include one area from a low endemic area
and two areas each from moderate and high endemic areas. The data from the screening
programmes were available for the grama niladhari divisions (GND), which is the lowest
level of the administrative unit in the country. Whenever the GN areas did not record the
required number of 1000 eligible study participants, geographically bordering adjacent
villages from the adjoining GND was included so that each study area has a base population
of 1000. Thus, the study area was defined as a GN area and parts of adjacent villages (Table
2.1).
Figure 1: Area map of the study area
Anuradhapura district
5
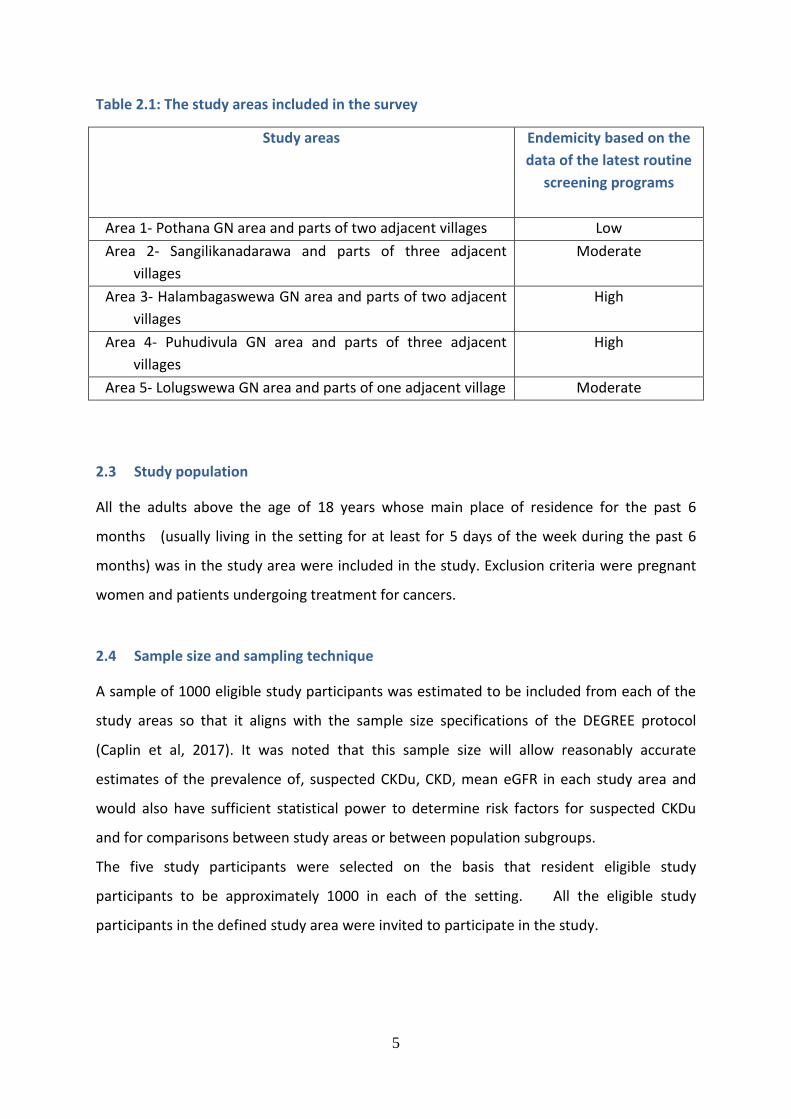
Table 2.1: The study areas included in the survey
Study areas Endemicity based on the
data of the latest routine
screening programs
Area 1- Pothana GN area and parts of two adjacent villages Low
Area 2- Sangilikanadarawa and parts of three adjacent
villages
Moderate
Area 3- Halambagaswewa GN area and parts of two adjacent
villages
High
Area 4- Puhudivula GN area and parts of three adjacent
villages
High
Area 5- Lolugswewa GN area and parts of one adjacent village Moderate
2.3 Study population
All the adults above the age of 18 years whose main place of residence for the past 6
months (usually living in the setting for at least for 5 days of the week during the past 6
months) was in the study area were included in the study. Exclusion criteria were pregnant
women and patients undergoing treatment for cancers.
2.4 Sample size and sampling technique
A sample of 1000 eligible study participants was estimated to be included from each of the
study areas so that it aligns with the sample size specifications of the DEGREE protocol
(Caplin et al, 2017). It was noted that this sample size will allow reasonably accurate
estimates of the prevalence of, suspected CKDu, CKD, mean eGFR in each study area and
would also have sufficient statistical power to determine risk factors for suspected CKDu
and for comparisons between study areas or between population subgroups.
The five study participants were selected on the basis that resident eligible study
participants to be approximately 1000 in each of the setting. All the eligible study
participants in the defined study area were invited to participate in the study.
6
2.5 Study instruments
An array of data collection tools were used to obtain data required to achieve the specific
objectives.
The status of CKD and CKDu required measurements of serum creatinine, albuminuria,
capillary glucose and blood pressure as well as inquiries into the past medical history of
diabetes mellitus, hypertension and its treatment.
Risk factors assessed were identified based on a review of studies and hypotheses that have
been proposed in Sri Lanka and other countries. Views of the residents of the study areas on
potential risk or protective factors were also obtained through qualitative inquiries and
were incorporated.
The main groups of risk factors assessed were:
i. Socio-demographic characteristics
ii. Occupational and behavioural risk factors, dietary habits, history of pre-existing
diseases, family history of diseases, exposures relevant to local context and
concerns of communities
iii. Anthropometric measurements- body mass index, percentage of body water,
percentage body fat
Laboratory testing was performed on biological samples for assessment of serum creatinine
and albuminuria while onsite measurements were performed for capillary glucose and
blood pressure and anthropometry indices. Information on socio-demographic
characteristics and other potential risk factors were collected using an interviewer-
administered questionnaire.
2.6 Data collection
Two retired Public Health Inspectors were recruited as the field coordinators. The voter’s
lists served as the frame to identify the eligible study participants. The field coordinators
liaised with the relevant Grama Niladharis to identify the numbers of eligible study
participants of the specified GN areas and the adjacent villages. They coordinated with the
village leaders and the community-based societies on measures to be adopted to promote
the participation of the eligible study participants. A team of ten graduates of health

7
promotion from the Rajarata University were trained to recruit the study participants by
visiting each of the houses in the study area and to administer the questionnaires.
All recruited study participants were issued a unique identifying number. The individual-
level data from the recruited study participants were collected using the Sinhalese version
of the interviewer-administered questionnaire (Annexure II). The medical treatment records
were also photographed so that the data collected can be verified later by a medical doctor.
Upon completion of the questionnaire, the study participants were instructed on collecting
the early morning urine sample and to visit the ‘clinic’ on the following day before work for
the anthropometry measurements and biological sample collection. Revisits to the houses
were done to recruit any eligible study participants who were not available in the house at
the time of the first visit.
8
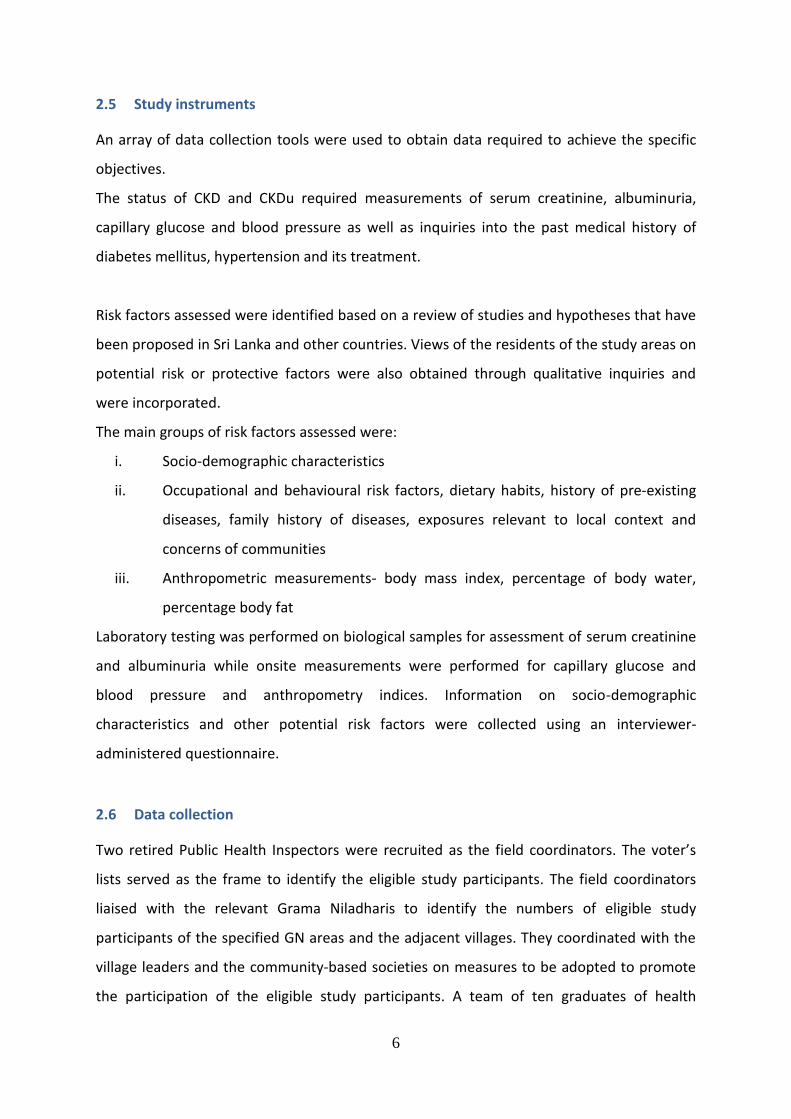
The ‘clinics’ were set up in each village in locations that were acceptable and accessible to
all the villagers. A retired Public Health Inspector was recruited to coordinate the clinic data
collection. A team of ten undergraduates of the Science stream of the Rajarata University
and three retired nurses were trained to perform the data collection in the clinic areas. In
the clinics, the urine sample collected by the study participants were taken over and a
sample of 3 ml of blood was drawn. The blood samples were centrifuged on-site using a
portable centrifuge and the centrifuged blood sample and the urine samples were stored in
an igloo which was maintained at a temperature of 2-8 oC. The trained science
undergraduates performed the measurements of blood pressure (three times five minutes
apart using electronic BP apparatus, sitting position), capillary random plasma glucose using
a glucometer, height using stadiometer, bio-impedance outputs of body fat %, BMI and total
body water % using a TANITA SC-240MA Body composition analyzer. The records of all these
measurements are recorded in a ‘clinic’ data sheet (Annexure III).
9
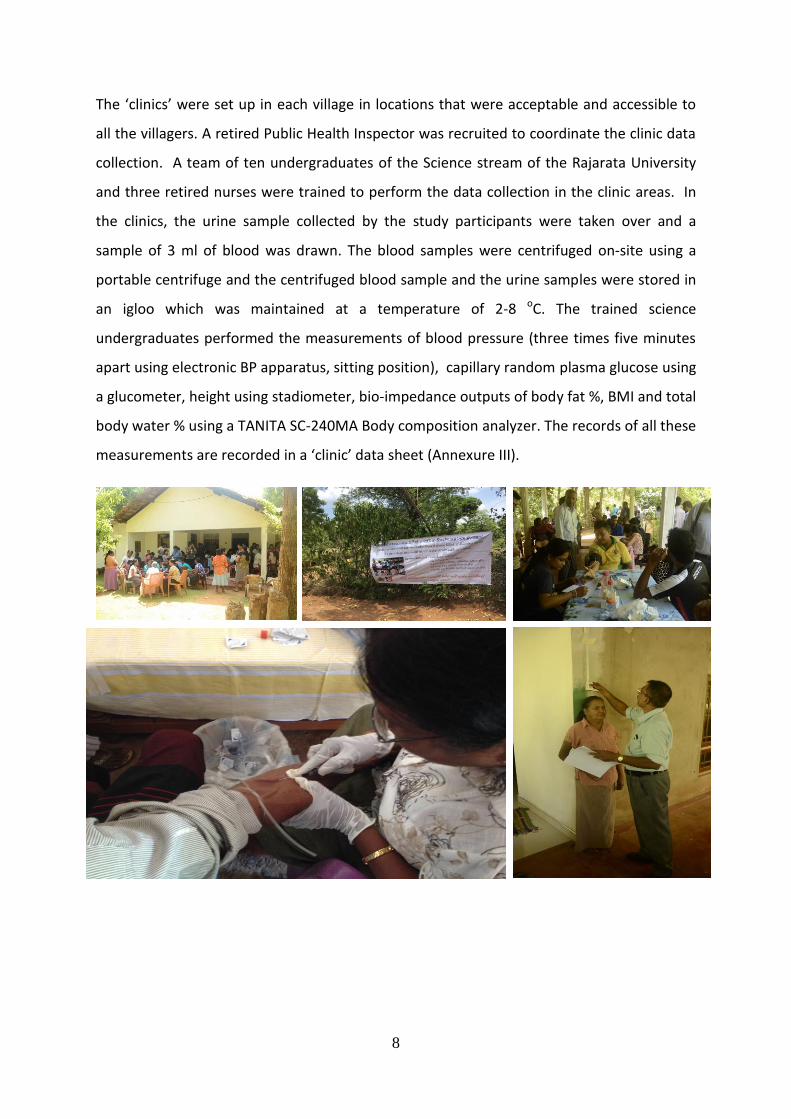
The ‘clinic’ coordinator ensured proper storage and transport of biological samples to the
chemical pathology laboratory of the Anuradhapura Teaching Hospital after each clinic
session. In the laboratory, samples of serum (total of 2 ml stored as a single aliquot) and
urine (2ml in one aliquot) were separated for bio-banking purposes and was stored in -20C
freezer.
Serum creatinine and urine protein: creatinine ratio was tested in the laboratory of the
Anuradhapura Teaching Hospital by a team of four medical laboratory technicians on the
same night. Serum creatinine was measured using assays calibrated utilizing quality controls
traceable to isotope dilution mass spectrometry (IDMS) standards. The reports were
generated by the machine and carried the unique identification number of each study unit.
The laboratory procedures were supervised by the Chemical Pathologists who is a member
of the research team.
10
A data entry form was created in Epidata package with relevant checks, and four data entry
operators were recruited to enter the data of the questionnaire, body measurements and
laboratory reports, linked to the unique identifying number. A medical doctor was trained to
interpret photographs of medical and treatment histories and enter the verified data into
the relevant data sheets. Double entry of data was performed for data on serum creatinine
and albuminuria of all study participants. The investigator performed double entry of
randomly selected clinic data and information obtained through the questionnaires to
assess and to ensure the quality of data entry.
Prior to data collection, a one-day training session was conducted for the field and ‘clinic’
coordinators, data collectors, those who performed ‘measurements, nurses and for the data
entry operators. The training included a session of mock data collection in a similar setting.
2.7 Ethical considerations
Institutional ethics committee approval was obtained from the Ethics Review Committee of
the Faculty of Medicine, University of Colombo (EC-17-031). All reports were shared by the
study participants. All those classified as Suspected CKDu, CKD, hypertension and diabetes
were referred to the nearest hospital for treatment.
2.8 Data analysis
The background characteristics of the study participants in terms of socio-demographic
characteristics, biological features, behaviour related variables (alcohol use, tobacco use,
food consumption patterns, water drinking patterns) and occupationally related variables
11
(engaging in different types of farming, exposure to chemicals) were described using
frequency distributions.
Prevalence of Suspected CKDu1 by sex and study areas, along with 95% confidence intervals
(CI) was estimated using those that fulfilled the existing case definition as the numerator
and those at risk as the denominator. Sex-adjusted Prevalence of Suspected CKDu was also
estimated for each study area.
Furthermore, the following estimate of the prevalence of Suspected CKDU was also done by
varying the exclusion criteria of hypertension and diabetes or varying the combinations of
exclusion criteria used.
Using only the exclusion criteria of hypertension as in the existing case definition
Using only the exclusion criteria of ‘Possible Hypertension’ BP more than
140/90 at the time of the survey
being on anti-hypertension drugs (any number)
Self-reported as having hypertension with evidence of medical records
Using the exclusion criteria of ‘Possible hypertension’ and diabetes
Prevalence of known cause CKD by sex and study areas, along with 95% CI were estimated
using those with essential screening criteria (eGFR < 60 mL/min using CKD EPI equation
AND/OR albuminuria >= 30 mg/g) and a known cause for CKD as identified by the present
survey (hypertension on treatment with more than two drugs OR untreated blood pressure
of more than 160/100 mmHg AND/OR diabetes mellitus -history of diabetes OR being on
treatment OR capillary random plasma glucose >200 mg/dL) as the numerator and all the
study participants as the denominator.
Furthermore, an analysis of how the two features of the essential criteria are distributed
among the study participants is also presented. The combinations used are as follows.
• eGFR <60mL/min with or without albuminuria ≥30mg/g creatinine
• albuminuria ≥30mg/g creatinine with or without eGFR <60mL/min
• eGFR <60mL/min without albuminuria ≥30mg/g creatinine
12
Mean and SD of eGFR was described by study area and sex. Based on eGFR levels, the study
participants were classified into categories that correspond to Stages of CKD and frequency
distribution is presented.
The analyses for the age and sex-adjusted associations of mean eGFR and potential risk
factors for Suspected CKDu excluded the study participants who were positive for essential
screening criteria (eGFR < 60 mL/min using CKD EPI equation: One time measurement using
standardized methods for creatinine measurement AND/OR albuminuria > = 30 mg/g) with a
known cause for CKD (n=199) as identified by the present survey.
Bivariate analyses for age and sex-adjusted associations of mean eGFR were estimated using
coefficients along with 95% CI, while the age and sex-adjusted associations with Suspected
CKDu were estimated in terms of univariate Odds Ratios (OR) and 95% CI.
In the analysis of potential risk factors, self-reported information was operationalized as
indicated below.
Farming: the variables on engagement of any farming as a full time or
part time occupation were combined with the reported duration to
classify the respondents into five groups (no farming, part-time farming
for <10 years, part-time farming for >10 years, full time farming for <10
years and full time farming for >10 years) and as three groups (no
farming, farming less than 10 years and farming 10 or more years)
Exposure to chemical fertilizers, weedicides or pesticides: Those who reported
non-rare exposure (sometimes or often) to chemical fertilizers, weedicides or
pesticides for at least five years in the past were classified as being exposed.
Exposure-specific sources of drinking water: The respondents were classified as
having been exposed to a particular drinking water source if they ranked the
source as one of the top three most frequently used for more than 10 years in
the past.
Exposure to heat: those who reported > 20 hours of outdoor work per usual day
and days per usual week in the sunlight were considered as exposed.
Amount of drinking water consumed: Those who reported consuming less than 3
l of water on a usual day were considered as exposed.
13
Exposure to specific food items: When classifying respondents as having been
exposed for the food items, those that had been consumed the specific food
item s 3 or more days during the week prior to the survey were considered as
exposed.
Multiple linear regression was used to estimate adjusted predictors of mean eGFR using
multiple linear regression, while adjusted risk/protective factors of suspected CKDu were
determined using multiple logistic regression.
14
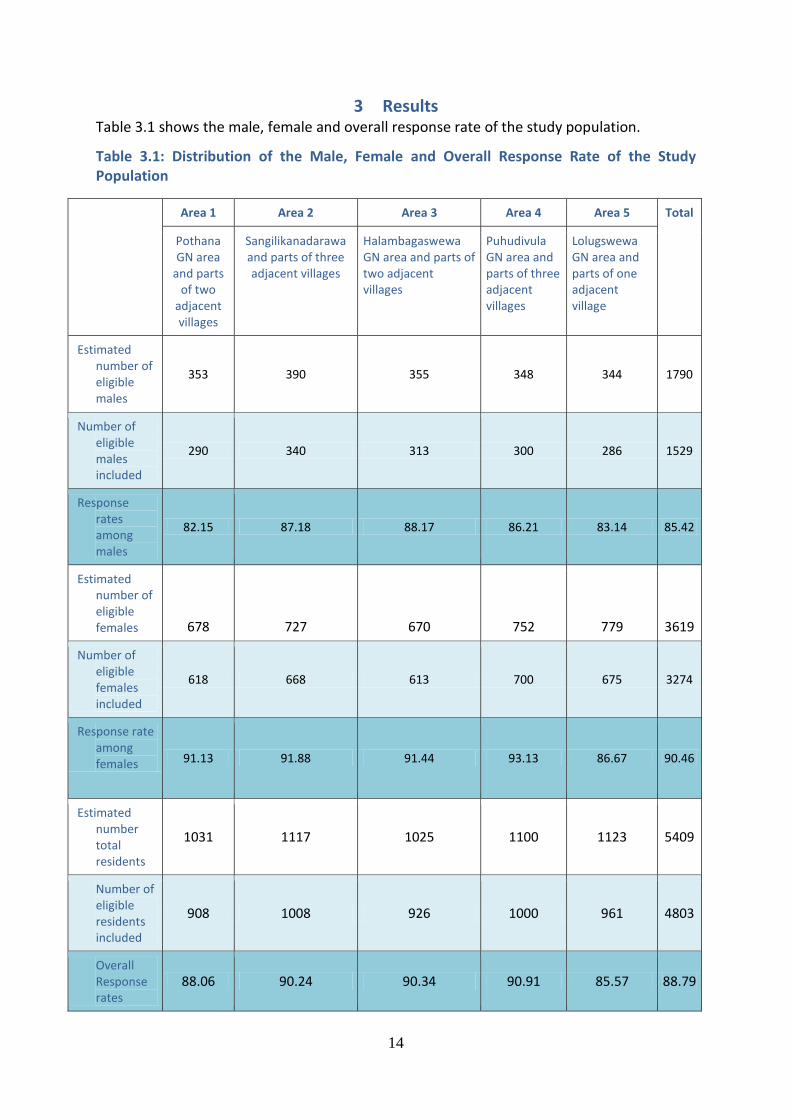
3 Results Table 3.1 shows the male, female and overall response rate of the study population.
Table 3.1: Distribution of the Male, Female and Overall Response Rate of the Study Population
Area 1 Area 2 Area 3 Area 4 Area 5 Total
Pothana GN area
and parts of two
adjacent villages
Sangilikanadarawa and parts of three adjacent villages
Halambagaswewa GN area and parts of two adjacent villages
Puhudivula GN area and parts of three adjacent villages
Lolugswewa GN area and parts of one adjacent village
Estimated number of eligible males
353 390 355 348 344 1790
Number of eligible males included
290 340 313 300 286 1529
Response rates among males
82.15 87.18 88.17 86.21 83.14 85.42
Estimated number of eligible females 678 727 670 752 779 3619
Number of eligible females included
618 668 613 700 675 3274
Response rate among females 91.13 91.88 91.44 93.13 86.67 90.46
Estimated number total residents
1031 1117 1025 1100 1123 5409
Number of eligible residents included
908 1008 926 1000 961 4803
Overall Response rates
88.06 90.24 90.34 90.91 85.57 88.79
15
The total study included 4803 participants with an overall response rate of 88.7%. The
response rate among the eligible females (90.4%) was higher than the males (85.4%). All the
areas recorded very high response rates (88%-91%).
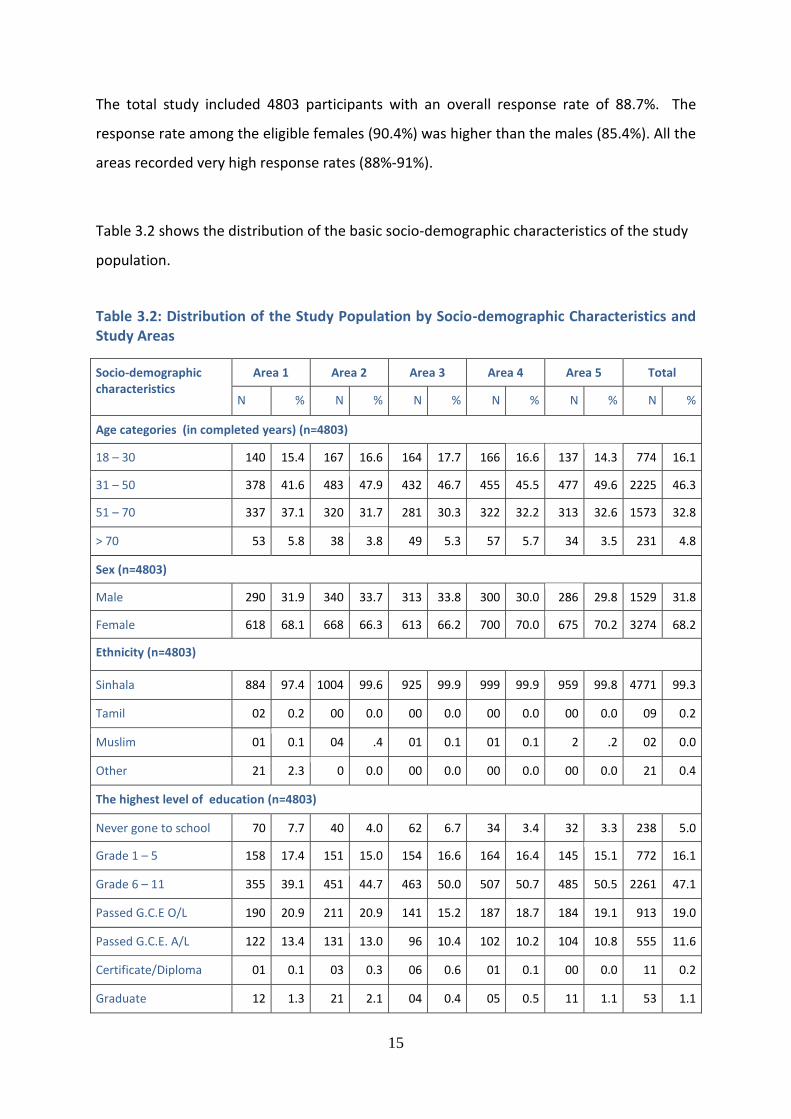
Table 3.2 shows the distribution of the basic socio-demographic characteristics of the study
population.
Table 3.2: Distribution of the Study Population by Socio-demographic Characteristics and Study Areas
Socio-demographic characteristics
Area 1 Area 2 Area 3 Area 4 Area 5 Total
N % N % N % N % N % N %
Age categories (in completed years) (n=4803)
18 – 30 140 15.4 167 16.6 164 17.7 166 16.6 137 14.3 774 16.1
31 – 50 378 41.6 483 47.9 432 46.7 455 45.5 477 49.6 2225 46.3
51 – 70 337 37.1 320 31.7 281 30.3 322 32.2 313 32.6 1573 32.8
> 70 53 5.8 38 3.8 49 5.3 57 5.7 34 3.5 231 4.8
Sex (n=4803)
Male 290 31.9 340 33.7 313 33.8 300 30.0 286 29.8 1529 31.8
Female 618 68.1 668 66.3 613 66.2 700 70.0 675 70.2 3274 68.2
Ethnicity (n=4803)
Sinhala 884 97.4 1004 99.6 925 99.9 999 99.9 959 99.8 4771 99.3
Tamil 02 0.2 00 0.0 00 0.0 00 0.0 00 0.0 09 0.2
Muslim 01 0.1 04 .4 01 0.1 01 0.1 2 .2 02 0.0
Other 21 2.3 0 0.0 00 0.0 00 0.0 00 0.0 21 0.4
The highest level of education (n=4803)
Never gone to school 70 7.7 40 4.0 62 6.7 34 3.4 32 3.3 238 5.0
Grade 1 – 5 158 17.4 151 15.0 154 16.6 164 16.4 145 15.1 772 16.1
Grade 6 – 11 355 39.1 451 44.7 463 50.0 507 50.7 485 50.5 2261 47.1
Passed G.C.E O/L 190 20.9 211 20.9 141 15.2 187 18.7 184 19.1 913 19.0
Passed G.C.E. A/L 122 13.4 131 13.0 96 10.4 102 10.2 104 10.8 555 11.6
Certificate/Diploma 01 0.1 03 0.3 06 0.6 01 0.1 00 0.0 11 0.2
Graduate 12 1.3 21 2.1 04 0.4 05 0.5 11 1.1 53 1.1
16
Number of years of education in schools and in higher education institutes (n=4803)
No schooling 70 7.7 40 4.0 62 6.7 34 3.4 32 3.3 238 5.0
< 10 302 33.3 336 33.3 310 33.5 361 36.1 341 35.5 1650 34.4
≥ 10 536 59.0 632 62.7 554 59.8 605 60.5 588 61.2 2915 60.7
Marital status (n=4779
*)
Married 760 83.7 833 82.6 774 83.6 835 83.5 792 82.4 3994 83.2
Unmarried 69 7.6 65 6.4 62 6.7 65 6.5 65 6.8 326 6.8
Divorced 9 1.0 4 0.4 6 0.6 01 0.1 07 0.7 27 0.6
Widowed 65 7.2 103 10.2 78 8.4 94 9.4 92 9.6 432 9.0
Average family monthly income (n=4803)
Less than Rs.10,000 184 20.3 178 17.7 185 20.0 233 23.3 221 23.0 1001 20.8
Rs. 10,001-20,000 240 26.4 213 21.1 168 18.1 186 18.6 148 15.4 955 19.9
Rs. 21,001-30,000 181 19.9 183 18.2 177 19.1 157 15.7 176 18.3 874 18.2
Rs. 31,001-40,000 119 13.1 207 20.5 187 20.2 250 25.0 265 27.6 1028 21.4
Rs. 41,001-50,000 74 8.1 95 9.4 94 10.2 88 8.8 78 8.1 429 8.9
Rs. 51,001-60,000 48 5.3 61 6.1 66 7.1 43 4.3 44 4.6 262 5.5
More than Rs.60,000 62 6.8 71 7.0 49 5.3 43 4.3 29 3.0 254 5.3 * Marital status missing in 24 subjects
Nearly half of the study participants were in the age category of 31-50 years. Of the study
population, a majority were females (68.2%). The study included only the adults above the
age of 18 years whose main place of residence for the past 6 months (usually living in the
setting for at least for 5 days of the week during the past 6 months) was in the study area.
The fact that the response rates among males were fairly high in spite of the lower
proportions can be explained by the fact that fewer males were eligible to be included in the
study compared to females. Anuradhapura district is a district from which many males get
enlisted in the Armed Forces, which means that their main place of residence is not in their
homes. Similarly, many adult males in the district are also known to have migrated to
urban areas for employment and were ineligible to be included in the study.
Almost all (99.3%) of the study participants were Sinhalese. The highest level of education
for nearly half of the study population was secondary schooling (47.1%) with only a minority
(5%) reported not receiving any formal school education. Comparison with the data of
17
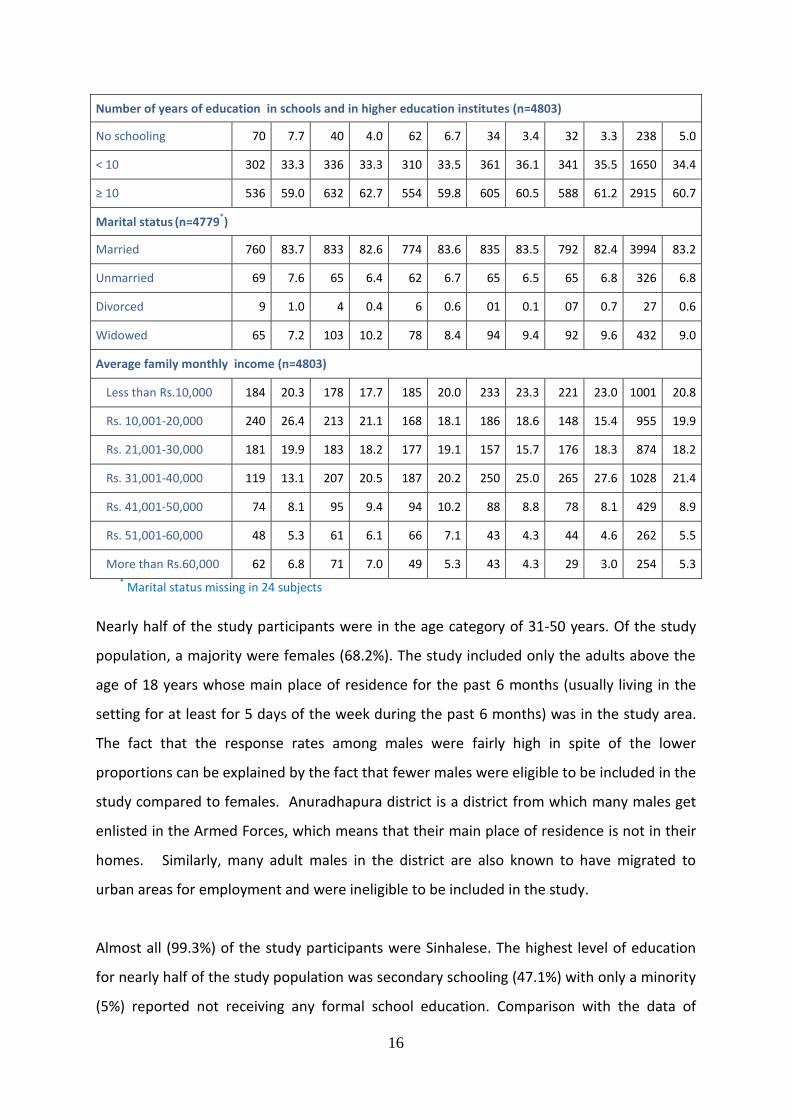
population characteristics of the country in the latest population Census of 2012, showed
that in Sri Lanka the proportions who had completed the secondary education and those
who had not received any formal education were was 58.7% and 4.7%, respectively (Depart
of Census and Statistics, 2012). Approximately one-fifth of the study population was seen to
occupy each of the four lower family monthly income categories within the ranges of
<10,000 LKR to 40,000 LKR. The household income expenditure survey 2016 indicates a
mean and median nominal household income per month of Rs. 58,326 and Rs. 41,629
respectively. The corresponding figures for the country were Rs.62,237 and Rs. 43,511.
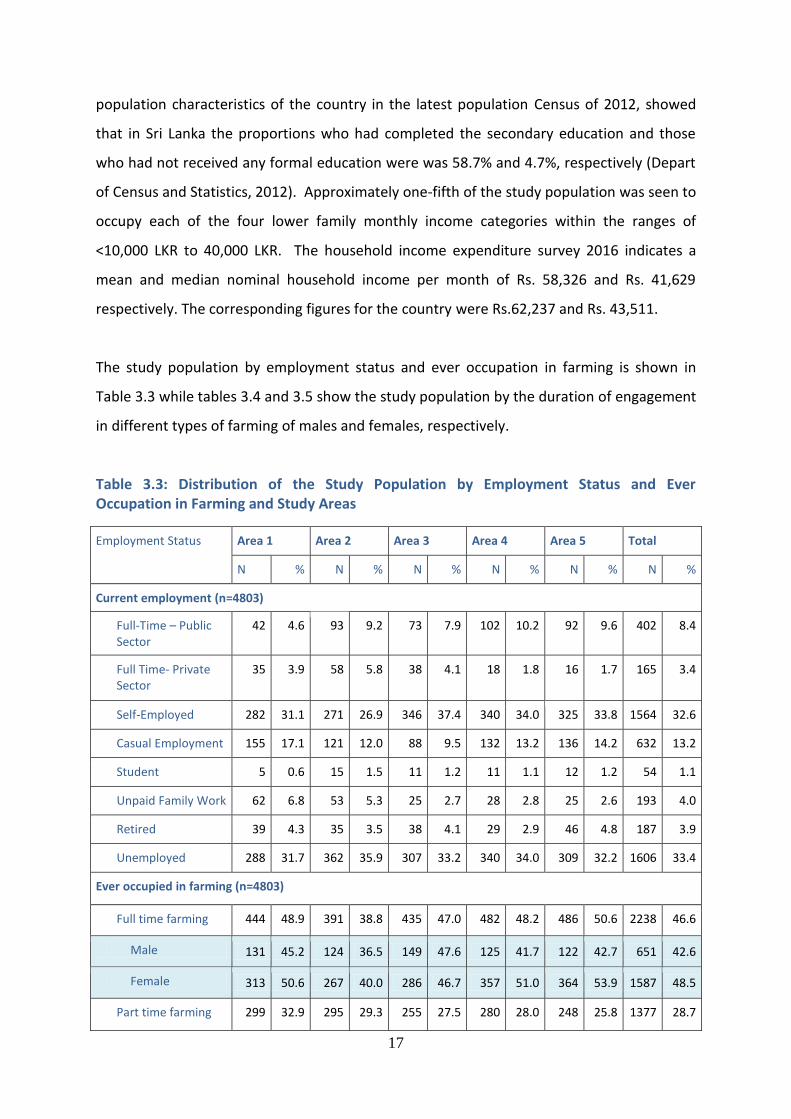
The study population by employment status and ever occupation in farming is shown in
Table 3.3 while tables 3.4 and 3.5 show the study population by the duration of engagement
in different types of farming of males and females, respectively.
Table 3.3: Distribution of the Study Population by Employment Status and Ever Occupation in Farming and Study Areas
Employment Status Area 1 Area 2 Area 3 Area 4 Area 5 Total
N % N % N % N % N % N %
Current employment (n=4803)
Full-Time – Public Sector
42 4.6 93 9.2 73 7.9 102 10.2 92 9.6 402 8.4
Full Time- Private Sector
35 3.9 58 5.8 38 4.1 18 1.8 16 1.7 165 3.4
Self-Employed 282 31.1 271 26.9 346 37.4 340 34.0 325 33.8 1564 32.6
Casual Employment 155 17.1 121 12.0 88 9.5 132 13.2 136 14.2 632 13.2
Student 5 0.6 15 1.5 11 1.2 11 1.1 12 1.2 54 1.1
Unpaid Family Work 62 6.8 53 5.3 25 2.7 28 2.8 25 2.6 193 4.0
Retired 39 4.3 35 3.5 38 4.1 29 2.9 46 4.8 187 3.9
Unemployed 288 31.7 362 35.9 307 33.2 340 34.0 309 32.2 1606 33.4
Ever occupied in farming (n=4803)
Full time farming 444 48.9 391 38.8 435 47.0 482 48.2 486 50.6 2238 46.6
Male 131 45.2 124 36.5 149 47.6 125 41.7 122 42.7 651 42.6
Female 313 50.6 267 40.0 286 46.7 357 51.0 364 53.9 1587 48.5
Part time farming 299 32.9 295 29.3 255 27.5 280 28.0 248 25.8 1377 28.7
18
Male 123 42.4 147 43.2 122 39.0 140 46.7 127 44.4 659 43.1
Female 176 28.5 148 22.2 133 21.7 140 20.0 121 17.9 718 21.9
No 165 18.2 322 31.9 236 25.5 238 23.8 227 23.6 1188 24.7
Male 36 12.4 69 20.3 42 13.4 35 11.7 37 12.9 219 14.3
Female 129 20.9 253 37.9 194 31.6 203 29.0 190 28.1 969 29.6
A great majority of males (85.7%) were ever occupied in farming with equal proportions
reporting full time (42.6%) and part-time (43.1%) engagement. Among females, those ever
occupied in full-time farming was similar to males (48.5%) while those who reported part-
time engagement was approximately half compared to males (21.9%). Nevertheless, a great
majority (69.8%) were ever occupied in farming even among females.
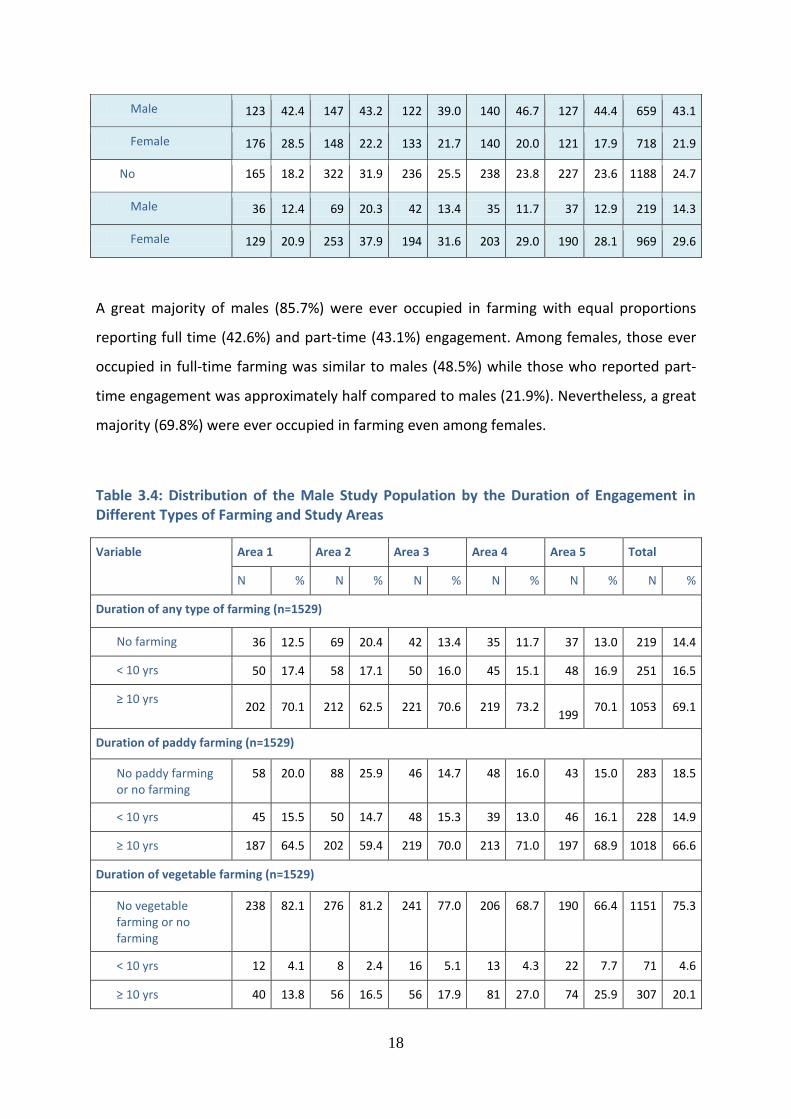
Table 3.4: Distribution of the Male Study Population by the Duration of Engagement in Different Types of Farming and Study Areas
Variable Area 1 Area 2 Area 3 Area 4 Area 5 Total
N % N % N % N % N % N %
Duration of any type of farming (n=1529)
No farming 36 12.5 69 20.4 42 13.4 35 11.7 37 13.0 219 14.4
< 10 yrs 50 17.4 58 17.1 50 16.0 45 15.1 48 16.9 251 16.5
≥ 10 yrs 202 70.1 212 62.5 221 70.6 219 73.2
199 70.1 1053 69.1
Duration of paddy farming (n=1529)
No paddy farming or no farming
58 20.0 88 25.9 46 14.7 48 16.0 43 15.0 283 18.5
< 10 yrs 45 15.5 50 14.7 48 15.3 39 13.0 46 16.1 228 14.9
≥ 10 yrs 187 64.5 202 59.4 219 70.0 213 71.0 197 68.9 1018 66.6
Duration of vegetable farming (n=1529)
No vegetable farming or no farming
238 82.1 276 81.2 241 77.0 206 68.7 190 66.4 1151 75.3
< 10 yrs 12 4.1 8 2.4 16 5.1 13 4.3 22 7.7 71 4.6
≥ 10 yrs 40 13.8 56 16.5 56 17.9 81 27.0 74 25.9 307 20.1
19
Duration of chena cultivation (n=1529)
No Chena farming no farming
62 21.4 180 52.9 105 33.5 111 37.0 85 29.7 543 35.5
< 10 yrs 43 14.8 29 8.5 25 8.0 22 7.3 33 11.5 152 9.9
≥ 10 yrs 185 63.8 131 38.5 183 58.5 167 55.7 168 58.7 834 54.5
Ever occupied in any farming and duration (n=1529)
No 36 12.4 69 20.3 42 13.4 35 11.7 38 13.3 220 14.4
Part time farming
for < 10 yrs 40 13.8 47 13.8 33 10.5 31 10.3 39 13.6 190 12.4
Part time farming for ≥ 10 yrs
87 30.0 99 29.1 89 28.4 110 36.7 89 31.1 474 31.0
Full time farming for < 10 yrs
12 4.1 12 3.5 17 5.4 15 5.0 10 3.5 66 4.3
Full time farming for ≥ 10 yrs
115 39.7 113 33.2 132 42.2 109 36.3 110 38.5 579 37.9
The majority of the males (85%) were engaged in farming (part-time or full-time) while 70%
were engaged for more than 10 years. Paddy (82%) was the main crop for farming, while
chena (64%) and vegetable (25%) farming were followed. Majority of the males were
engaged in full-time farming (38%) for more than 10 years followed by part-time farming
(31%) for more than 10 years.
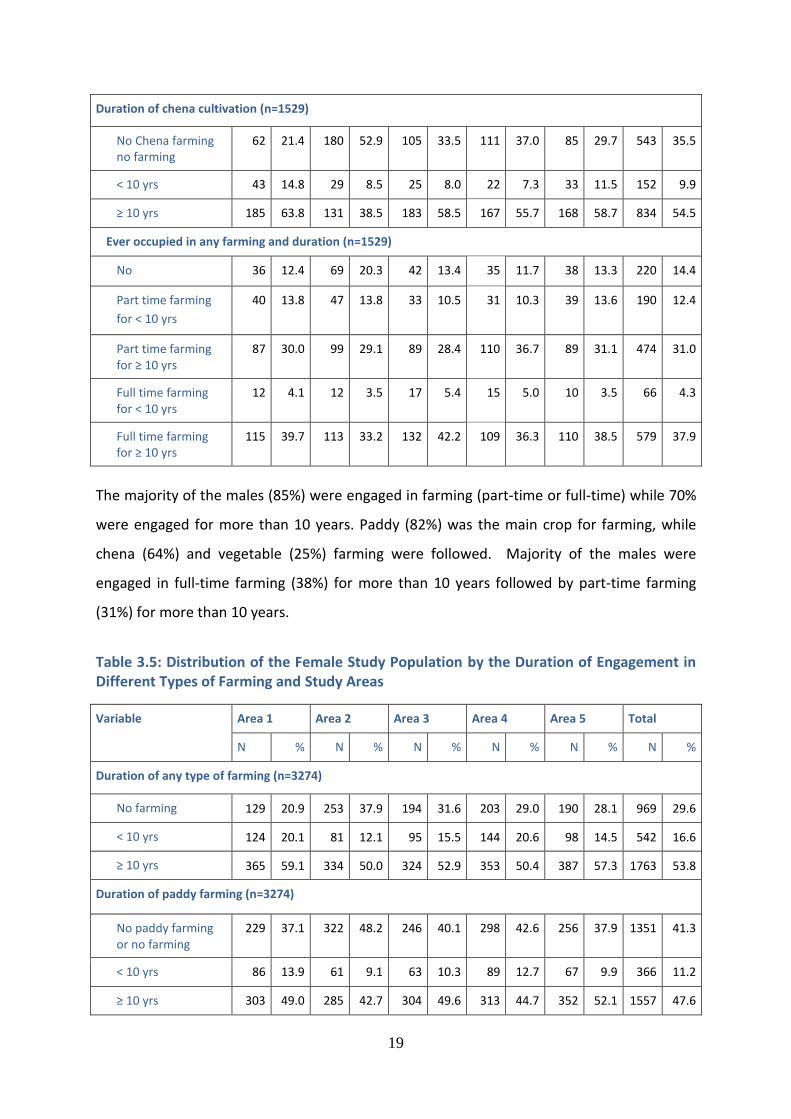
Table 3.5: Distribution of the Female Study Population by the Duration of Engagement in Different Types of Farming and Study Areas
Variable Area 1 Area 2 Area 3 Area 4 Area 5 Total
N % N % N % N % N % N %
Duration of any type of farming (n=3274)
No farming 129 20.9 253 37.9 194 31.6 203 29.0 190 28.1 969 29.6
< 10 yrs 124 20.1 81 12.1 95 15.5 144 20.6 98 14.5 542 16.6
≥ 10 yrs 365 59.1 334 50.0 324 52.9 353 50.4 387 57.3 1763 53.8
Duration of paddy farming (n=3274)
No paddy farming or no farming
229 37.1 322 48.2 246 40.1 298 42.6 256 37.9 1351 41.3
< 10 yrs 86 13.9 61 9.1 63 10.3 89 12.7 67 9.9 366 11.2
≥ 10 yrs 303 49.0 285 42.7 304 49.6 313 44.7 352 52.1 1557 47.6
20
Duration of vegetable farming (n=3274)
No vegetable farming or no farming
533 86.2 563 84.3 482 78.6 507 72.4 493 73.0 2578 78.7
< 10 yrs 26 4.2 12 1.8 33 5.4 52 7.4 42 6.2 165 5.0
≥ 10 yrs 59 9.5 93 13.9 98 16.0 141 20.1 140 20.7 531 16.2
Duration of chena cultivation (n=3274)
No Chena farming no farming
178 28.8 395 59.1 296 48.3 347 49.6 284 42.1 1500 45.8
< 10 yrs 113 18.3 43 6.4 56 9.1 72 10.3 52 7.7 336 10.3
≥ 10 yrs 327 52.9 230 34.4 261 42.6 281 40.1 339 50.2 1438 43.9
Ever occupied in any farming and duration (n=3274)
No 131 21.2 257 38.5 199 32.5 211 30.1 192 28.4 990 30.2
Part time farming
for < 10 yrs 53 8.6 42 6.3 30 4.9 33 4.7 34 5.0 192 5.9
Part time farming for ≥ 10 yrs
121 19.6 106 15.9 103 16.8 107 15.3 86 12.7 523 16.0
Full time farming for < 10 yrs
74 12.0 44 6.6 60 9.8 103 14.7 62 9.2 343 10.5
Full time farming for ≥ 10 yrs
239 38.7 219 32.8 221 36.1 246 35.1 301 44.6 1226 37.4
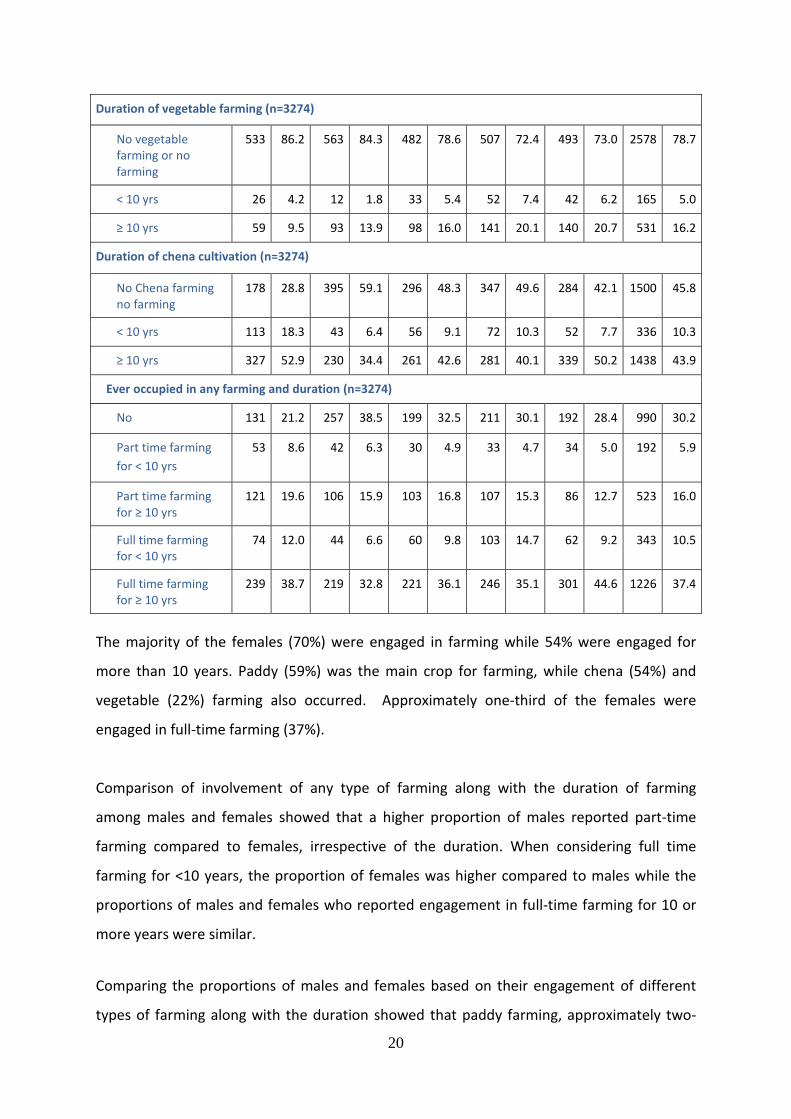
The majority of the females (70%) were engaged in farming while 54% were engaged for
more than 10 years. Paddy (59%) was the main crop for farming, while chena (54%) and
vegetable (22%) farming also occurred. Approximately one-third of the females were
engaged in full-time farming (37%).
Comparison of involvement of any type of farming along with the duration of farming
among males and females showed that a higher proportion of males reported part-time
farming compared to females, irrespective of the duration. When considering full time
farming for <10 years, the proportion of females was higher compared to males while the
proportions of males and females who reported engagement in full-time farming for 10 or
more years were similar.
Comparing the proportions of males and females based on their engagement of different
types of farming along with the duration showed that paddy farming, approximately two-
21
thirds of males (66.6%) and approximately half of females (47.6%) were engaged in farming
for 10 or more years. Approximately one-fifth of males (20.1) and females (16.1%) were
engaged in vegetable farming for 10 or more years. More than half of males (54.5%) and
nearly half of females (43.9%) were engaged in chena farming for 10 or more years
Study population by the presence of selected non-communicable diseases (NCD) is shown in
Table 3.6.
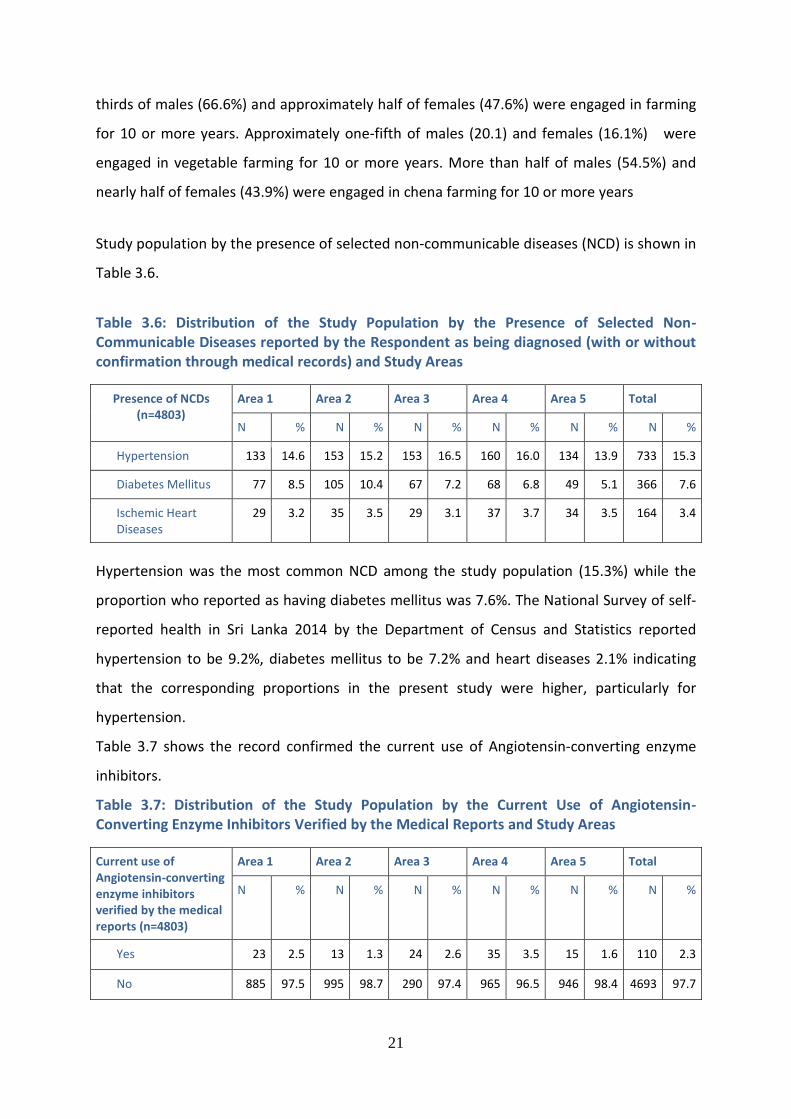
Table 3.6: Distribution of the Study Population by the Presence of Selected Non-Communicable Diseases reported by the Respondent as being diagnosed (with or without confirmation through medical records) and Study Areas
Presence of NCDs (n=4803)
Area 1 Area 2 Area 3 Area 4 Area 5 Total
N % N % N % N % N % N %
Hypertension 133 14.6 153 15.2 153 16.5 160 16.0 134 13.9 733 15.3
Diabetes Mellitus 77 8.5 105 10.4 67 7.2 68 6.8 49 5.1 366 7.6
Ischemic Heart Diseases
29 3.2 35 3.5 29 3.1 37 3.7 34 3.5 164 3.4
Hypertension was the most common NCD among the study population (15.3%) while the
proportion who reported as having diabetes mellitus was 7.6%. The National Survey of self-
reported health in Sri Lanka 2014 by the Department of Census and Statistics reported
hypertension to be 9.2%, diabetes mellitus to be 7.2% and heart diseases 2.1% indicating
that the corresponding proportions in the present study were higher, particularly for
hypertension.
Table 3.7 shows the record confirmed the current use of Angiotensin-converting enzyme
inhibitors.
Table 3.7: Distribution of the Study Population by the Current Use of Angiotensin-Converting Enzyme Inhibitors Verified by the Medical Reports and Study Areas
Current use of Angiotensin-converting enzyme inhibitors verified by the medical reports (n=4803)
Area 1 Area 2 Area 3 Area 4 Area 5 Total
N % N % N % N % N % N %
Yes 23 2.5 13 1.3 24 2.6 35 3.5 15 1.6 110 2.3
No 885 97.5 995 98.7 290 97.4 965 96.5 946 98.4 4693 97.7
22
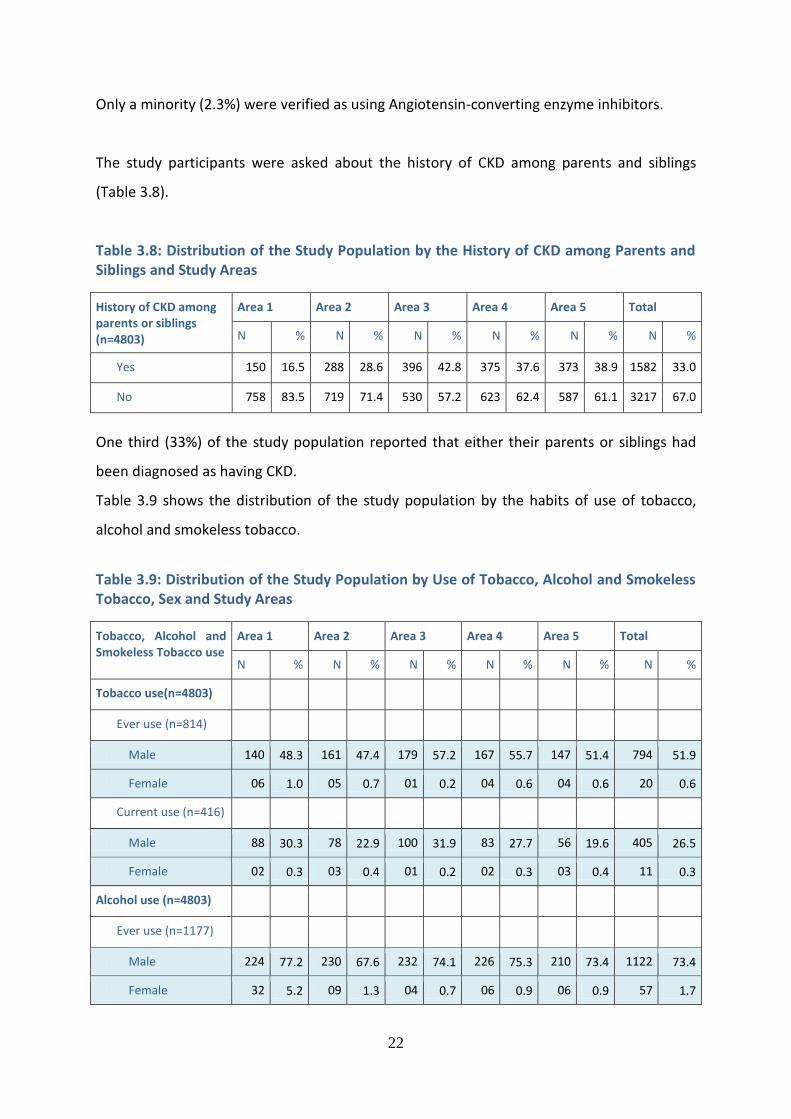
Only a minority (2.3%) were verified as using Angiotensin-converting enzyme inhibitors.
The study participants were asked about the history of CKD among parents and siblings
(Table 3.8).
Table 3.8: Distribution of the Study Population by the History of CKD among Parents and Siblings and Study Areas
History of CKD among parents or siblings (n=4803)
Area 1 Area 2 Area 3 Area 4 Area 5 Total
N % N % N % N % N % N %
Yes 150 16.5 288 28.6 396 42.8 375 37.6 373 38.9 1582 33.0
No 758 83.5 719 71.4 530 57.2 623 62.4 587 61.1 3217 67.0
One third (33%) of the study population reported that either their parents or siblings had
been diagnosed as having CKD.
Table 3.9 shows the distribution of the study population by the habits of use of tobacco,
alcohol and smokeless tobacco.
Table 3.9: Distribution of the Study Population by Use of Tobacco, Alcohol and Smokeless Tobacco, Sex and Study Areas
Tobacco, Alcohol and Smokeless Tobacco use
Area 1 Area 2 Area 3 Area 4 Area 5 Total
N % N % N % N % N % N %
Tobacco use(n=4803)
Ever use (n=814)
Male 140 48.3 161 47.4 179 57.2 167 55.7 147 51.4 794 51.9
Female 06 1.0 05 0.7 01 0.2 04 0.6 04 0.6 20 0.6
Current use (n=416)
Male 88 30.3 78 22.9 100 31.9 83 27.7 56 19.6 405 26.5
Female 02 0.3 03 0.4 01 0.2 02 0.3 03 0.4 11 0.3
Alcohol use (n=4803)
Ever use (n=1177)
Male 224 77.2 230 67.6 232 74.1 226 75.3 210 73.4 1122 73.4
Female 32 5.2 09 1.3 04 0.7 06 0.9 06 0.9 57 1.7
23
Current use (n=831)
Male 155 53.4 161 47.4 170 54.3 168 56.0 152 53.1 806 52.7
Female 12 1.9 03 0.4 03 0.5 03 0.4 04 0.6 25 0.8
Smokeless tobacco use (n=4803)
Ever use (n=957)
Male 160 55.2 153 45.0 100 31.9 117 39.0 104 36.4 634 41.5
Female 157 25.4 70 10.5 28 4.6 36 5.1 32 4.7 323 9.9
Current use (n=793)
Male 129 44.5 132 38.8 86 27.5 105 35.0 96 33.6 548 35.8
Female 97 15.7 61 9.1 26 4.2 33 4.7 28 4.1 245 7.5
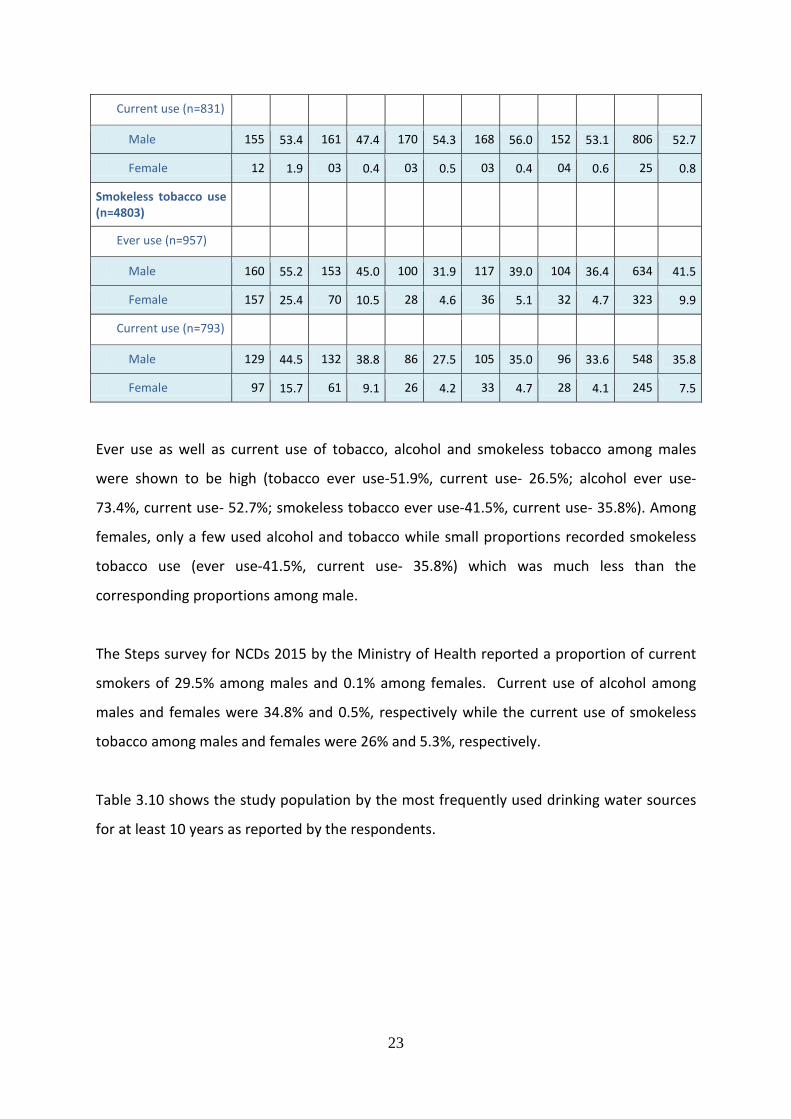
Ever use as well as current use of tobacco, alcohol and smokeless tobacco among males
were shown to be high (tobacco ever use-51.9%, current use- 26.5%; alcohol ever use-
73.4%, current use- 52.7%; smokeless tobacco ever use-41.5%, current use- 35.8%). Among
females, only a few used alcohol and tobacco while small proportions recorded smokeless
tobacco use (ever use-41.5%, current use- 35.8%) which was much less than the
corresponding proportions among male.
The Steps survey for NCDs 2015 by the Ministry of Health reported a proportion of current
smokers of 29.5% among males and 0.1% among females. Current use of alcohol among
males and females were 34.8% and 0.5%, respectively while the current use of smokeless
tobacco among males and females were 26% and 5.3%, respectively.
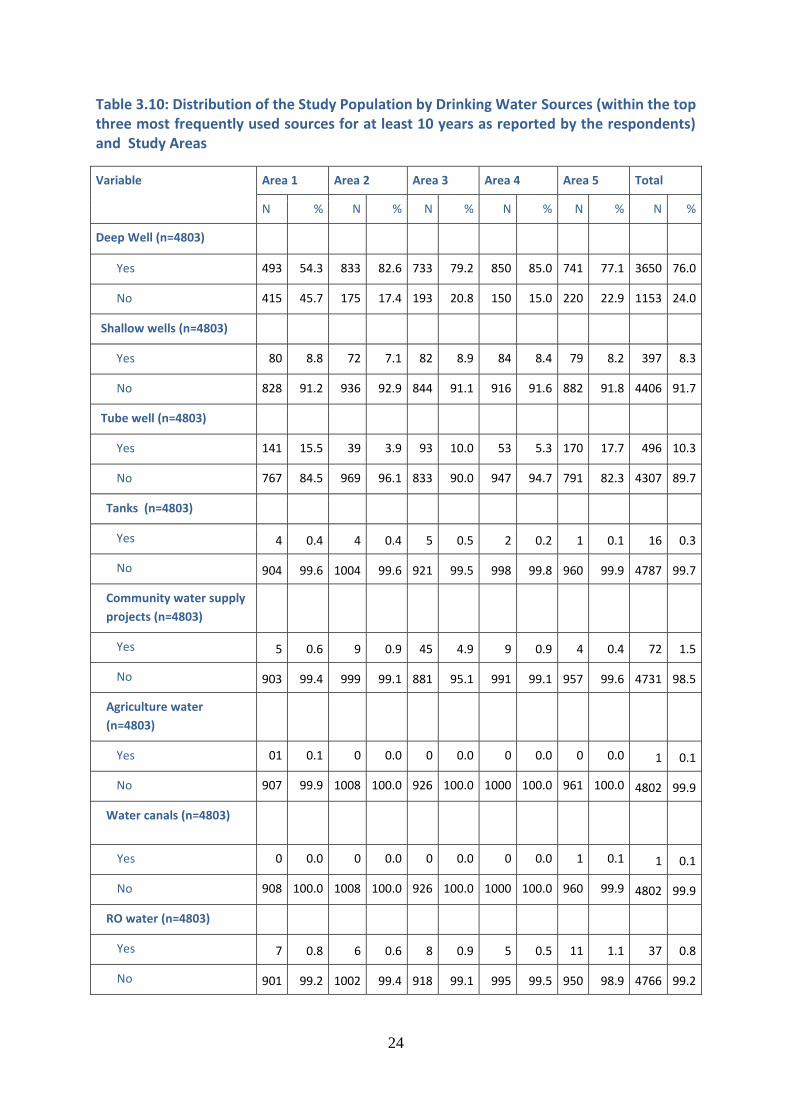
Table 3.10 shows the study population by the most frequently used drinking water sources
for at least 10 years as reported by the respondents.
24
Table 3.10: Distribution of the Study Population by Drinking Water Sources (within the top three most frequently used sources for at least 10 years as reported by the respondents) and Study Areas
Variable Area 1 Area 2 Area 3 Area 4 Area 5 Total
N % N % N % N % N % N %
Deep Well (n=4803)
Yes 493 54.3 833 82.6 733 79.2 850 85.0 741 77.1 3650 76.0
No 415 45.7 175 17.4 193 20.8 150 15.0 220 22.9 1153 24.0
Shallow wells (n=4803)
Yes 80 8.8 72 7.1 82 8.9 84 8.4 79 8.2 397 8.3
No 828 91.2 936 92.9 844 91.1 916 91.6 882 91.8 4406 91.7
Tube well (n=4803)
Yes 141 15.5 39 3.9 93 10.0 53 5.3 170 17.7 496 10.3
No 767 84.5 969 96.1 833 90.0 947 94.7 791 82.3 4307 89.7
Tanks (n=4803)
Yes 4 0.4 4 0.4 5 0.5 2 0.2 1 0.1 16 0.3
No 904 99.6 1004 99.6 921 99.5 998 99.8 960 99.9 4787 99.7
Community water supply
projects (n=4803)
Yes 5 0.6 9 0.9 45 4.9 9 0.9 4 0.4 72 1.5
No 903 99.4 999 99.1 881 95.1 991 99.1 957 99.6 4731 98.5
Agriculture water
(n=4803)
Yes 01 0.1 0 0.0 0 0.0 0 0.0 0 0.0 1 0.1
No 907 99.9 1008 100.0 926 100.0 1000 100.0 961 100.0 4802 99.9
Water canals (n=4803)
Yes 0 0.0 0 0.0 0 0.0 0 0.0 1 0.1 1 0.1
No 908 100.0 1008 100.0 926 100.0 1000 100.0 960 99.9 4802 99.9
RO water (n=4803)
Yes 7 0.8 6 0.6 8 0.9 5 0.5 11 1.1 37 0.8
No 901 99.2 1002 99.4 918 99.1 995 99.5 950 98.9 4766 99.2
25
Deep well was ranked within the top three most frequently used sources for at least 10
years by more than three fourths (76%) of the study population. The usage of RO water
remains low as 0.8% among the study participants.
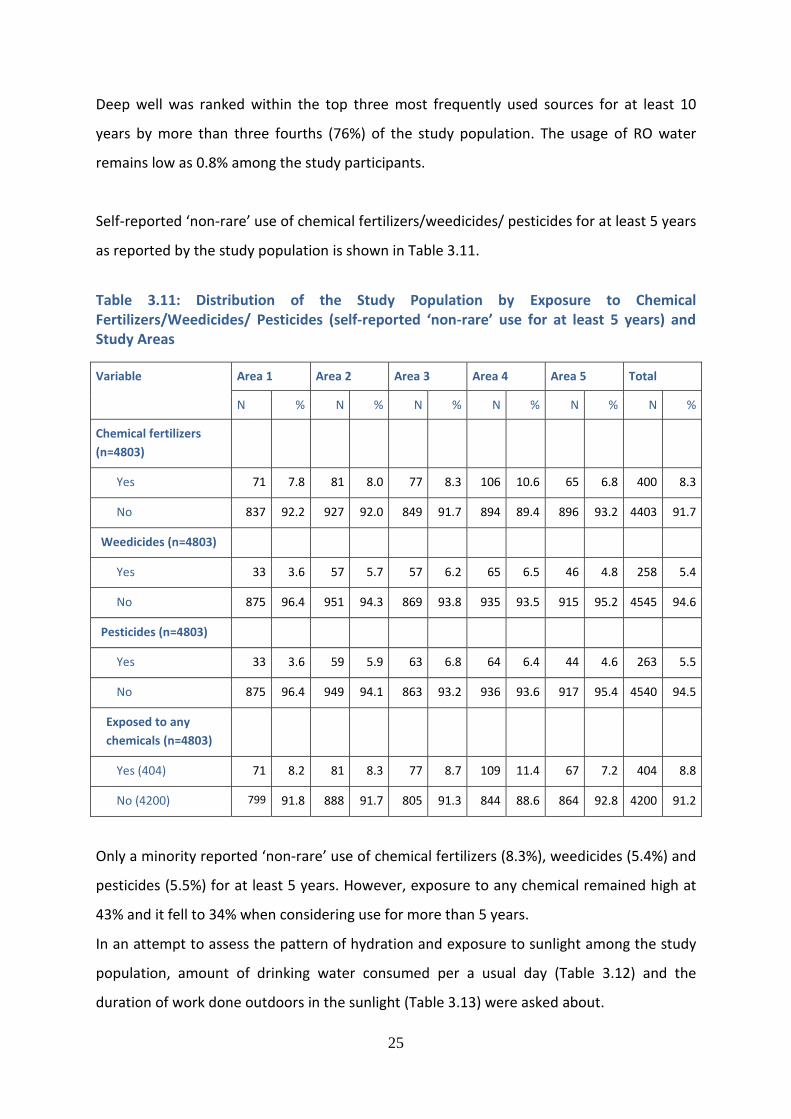
Self-reported ‘non-rare’ use of chemical fertilizers/weedicides/ pesticides for at least 5 years
as reported by the study population is shown in Table 3.11.
Table 3.11: Distribution of the Study Population by Exposure to Chemical Fertilizers/Weedicides/ Pesticides (self-reported ‘non-rare’ use for at least 5 years) and Study Areas
Variable Area 1 Area 2 Area 3 Area 4 Area 5 Total
N % N % N % N % N % N %
Chemical fertilizers
(n=4803)
Yes 71 7.8 81 8.0 77 8.3 106 10.6 65 6.8 400 8.3
No 837 92.2 927 92.0 849 91.7 894 89.4 896 93.2 4403 91.7
Weedicides (n=4803)
Yes 33 3.6 57 5.7 57 6.2 65 6.5 46 4.8 258 5.4
No 875 96.4 951 94.3 869 93.8 935 93.5 915 95.2 4545 94.6
Pesticides (n=4803)
Yes 33 3.6 59 5.9 63 6.8 64 6.4 44 4.6 263 5.5
No 875 96.4 949 94.1 863 93.2 936 93.6 917 95.4 4540 94.5
Exposed to any
chemicals (n=4803)
Yes (404) 71 8.2 81 8.3 77 8.7 109 11.4 67 7.2 404 8.8
No (4200) 799 91.8 888 91.7 805 91.3 844 88.6 864 92.8 4200 91.2
Only a minority reported ‘non-rare’ use of chemical fertilizers (8.3%), weedicides (5.4%) and
pesticides (5.5%) for at least 5 years. However, exposure to any chemical remained high at
43% and it fell to 34% when considering use for more than 5 years.
In an attempt to assess the pattern of hydration and exposure to sunlight among the study
population, amount of drinking water consumed per a usual day (Table 3.12) and the
duration of work done outdoors in the sunlight (Table 3.13) were asked about.
26
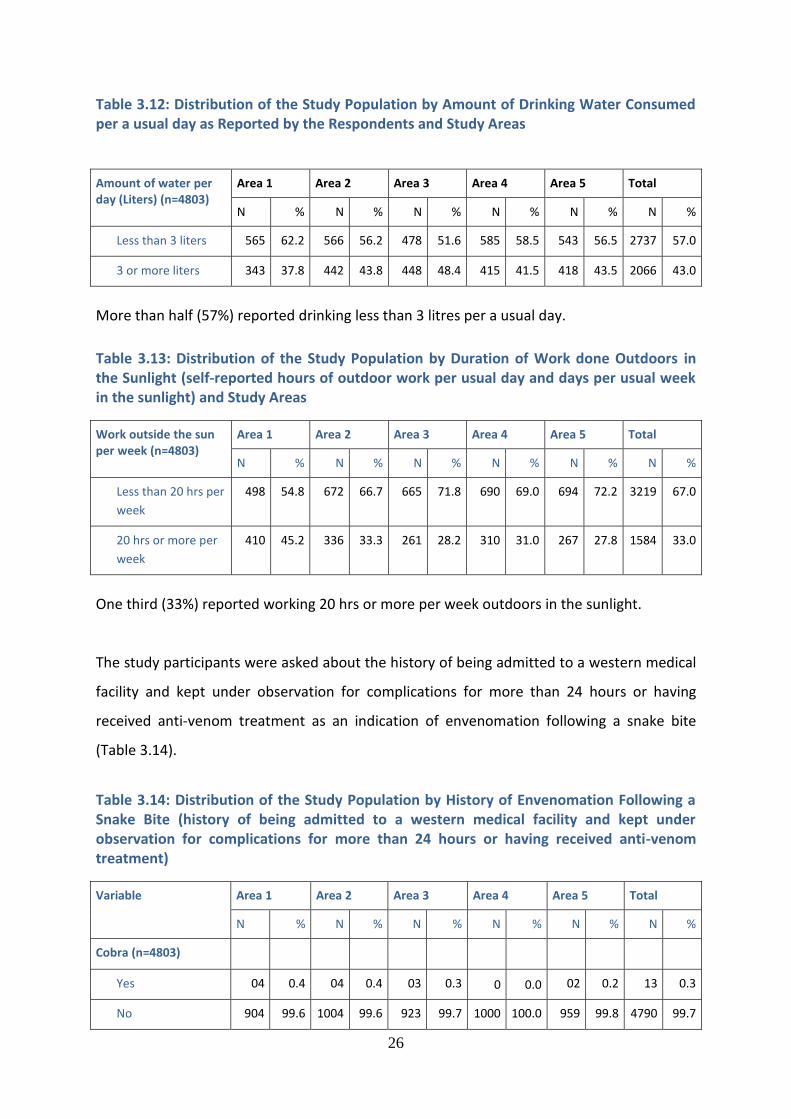
Table 3.12: Distribution of the Study Population by Amount of Drinking Water Consumed per a usual day as Reported by the Respondents and Study Areas
Amount of water per day (Liters) (n=4803)
Area 1 Area 2 Area 3 Area 4 Area 5 Total
N % N % N % N % N % N %
Less than 3 liters 565 62.2 566 56.2 478 51.6 585 58.5 543 56.5 2737 57.0
3 or more liters 343 37.8 442 43.8 448 48.4 415 41.5 418 43.5 2066 43.0
More than half (57%) reported drinking less than 3 litres per a usual day.
Table 3.13: Distribution of the Study Population by Duration of Work done Outdoors in the Sunlight (self-reported hours of outdoor work per usual day and days per usual week in the sunlight) and Study Areas
Work outside the sun per week (n=4803)
Area 1 Area 2 Area 3 Area 4 Area 5 Total
N % N % N % N % N % N %
Less than 20 hrs per
week 498 54.8 672 66.7 665 71.8 690 69.0 694 72.2 3219 67.0
20 hrs or more per
week 410 45.2 336 33.3 261 28.2 310 31.0 267 27.8 1584 33.0
One third (33%) reported working 20 hrs or more per week outdoors in the sunlight.
The study participants were asked about the history of being admitted to a western medical
facility and kept under observation for complications for more than 24 hours or having
received anti-venom treatment as an indication of envenomation following a snake bite
(Table 3.14).
Table 3.14: Distribution of the Study Population by History of Envenomation Following a Snake Bite (history of being admitted to a western medical facility and kept under observation for complications for more than 24 hours or having received anti-venom treatment)
Variable Area 1 Area 2 Area 3 Area 4 Area 5 Total
N % N % N % N % N % N %
Cobra (n=4803)
Yes 04 0.4 04 0.4 03 0.3 0 0.0 02 0.2 13 0.3
No 904 99.6 1004 99.6 923 99.7 1000 100.0 959 99.8 4790 99.7
27
Viper (n=4803)
Yes 27 3.0 18 1.8 25 2.7 22 2.2 27 2.8 119 2.5
No 881 97.0 990 98.2 901 97.3 978 97.8 934 97.2 4684 97.5
Common krait
(n=4803)
Yes 0 0.0 01 0.1 0 0.0 01 0.1 02 0.2 04 0.1
No 908 100.0 1007 99.9 926 100.0 999 99.9 959 99.8 4799 99.9
Kuna katuwa (n=4803)
Yes 29 3.2 14 1.4 22 2.4 32 3.2 27 2.8 124 2.6
No 879 96.8 994 98.6 904 97.6 968 96.8 934 97.2 4679 97.4
Scorpion (n=4803)
Yes 02 0.2 04 0.4 05 0.5 04 0.4 02 0.2 17 0.4
No 906 99.8 1004 99.6 921 99.5 996 99.6 959 99.8 4786 99.6
Any snake (n=4803)
Yes 57 6.3 37 3.7 47 5.1 53 5.3 55 5.7 249 5.2
No 851 93.7 971 96.3 879 94.9 947 94.7 906 94.3 4554 94.8
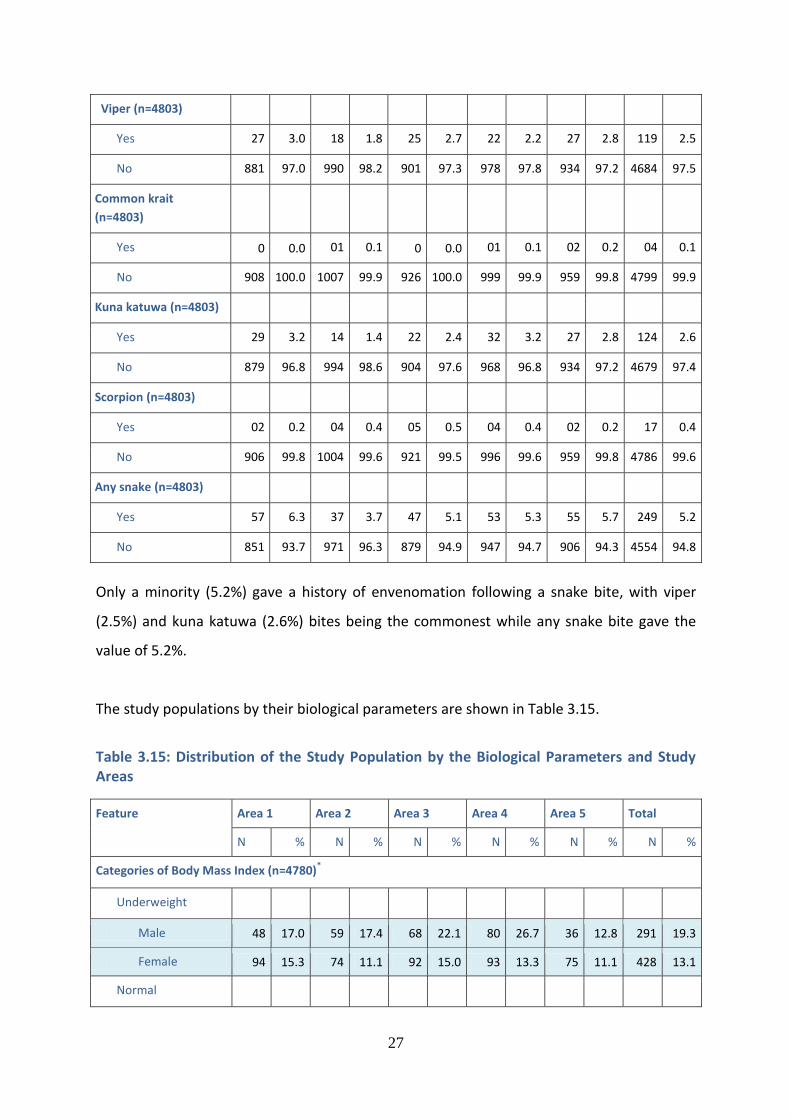
Only a minority (5.2%) gave a history of envenomation following a snake bite, with viper
(2.5%) and kuna katuwa (2.6%) bites being the commonest while any snake bite gave the
value of 5.2%.
The study populations by their biological parameters are shown in Table 3.15.
Table 3.15: Distribution of the Study Population by the Biological Parameters and Study Areas
Feature Area 1 Area 2 Area 3 Area 4 Area 5 Total
N % N % N % N % N % N %
Categories of Body Mass Index (n=4780)*
Underweight
Male 48 17.0 59 17.4 68 22.1 80 26.7 36 12.8 291 19.3
Female 94 15.3 74 11.1 92 15.0 93 13.3 75 11.1 428 13.1
Normal
28
Male 172 60.8 173 51.0 162 52.8 162 54.0 178 63.1 847 56.1
Female 290 47.1 299 44.8 291 47.5 366 52.4 353 52.3 1599 48.9
Overweight
Male 51 18.0 92 27.1 66 21.5 52 17.3 58 20.6 319 21.1
Female 184 29.9 219 32.8 181 29.6 186 26.6 184 27.3 954 29.2
Obese
Male 12 4.2 15 4.4 11 3.6 6 2.0 10 3.5 54 3.6
Female 48 7.8 75 11.2 48 7.8 54 7.7 63 9.3 288 8.8
Categories of body fat % (n=4779)#
1st tertile (< 25)
Male 206 72.8 222 65.9 224 73.0 240 80.0 212 75.2 1104 73.2
Female 77 12.5 68 10.2 93 15.2 86 12.3 73 10.8 397 12.1
2nd tertile (25-34)
Male 63 22.3 105 31.2 74 24.1 58 19.3 66 23.4 366 24.3
Female 254 41.2 244 36.6 237 38.7 311 44.5 291 43.1 1337 40.9
3rd tertile (>34)
Male 14 4.9 10 3.0 9 2.9 2 0.7 4 1.4 39 2.6
Female 286 46.4 355 53.2 282 46.1 302 43.2 311 46.1 1536 47.0
Categories of body water % (n = 4733)+
1st tertile (< 47)
Male 13 4.6 10 3.0 11 3.6 1 0.3 5 1.8 40 2.7
Female 290 47.1 342 52.0 257 42.5 279 40.5 281 42.6 1450 44.9
2nd tertile (47-52)
Male 62 21.9 108 32.1 78 25.6 59 19.7 68 24.1 375 24.9
Female 252 40.9 250 38.0 265 43.9 326 47.3 321 48.6 1414 43.8
3rd tertile (>52)
Male 208 73.5 218 64.9 216 70.8 240 80.0 209 74.1 1091 72.4
Female 74 12.0 65 9.9 82 13.6 84 12.2 58 8.8 363 11.2
* BMI values were missing in 23 Subjects # Body fat % values were missing in 24 Subjects
+ Body water % values were missing in 70 Subjects
29
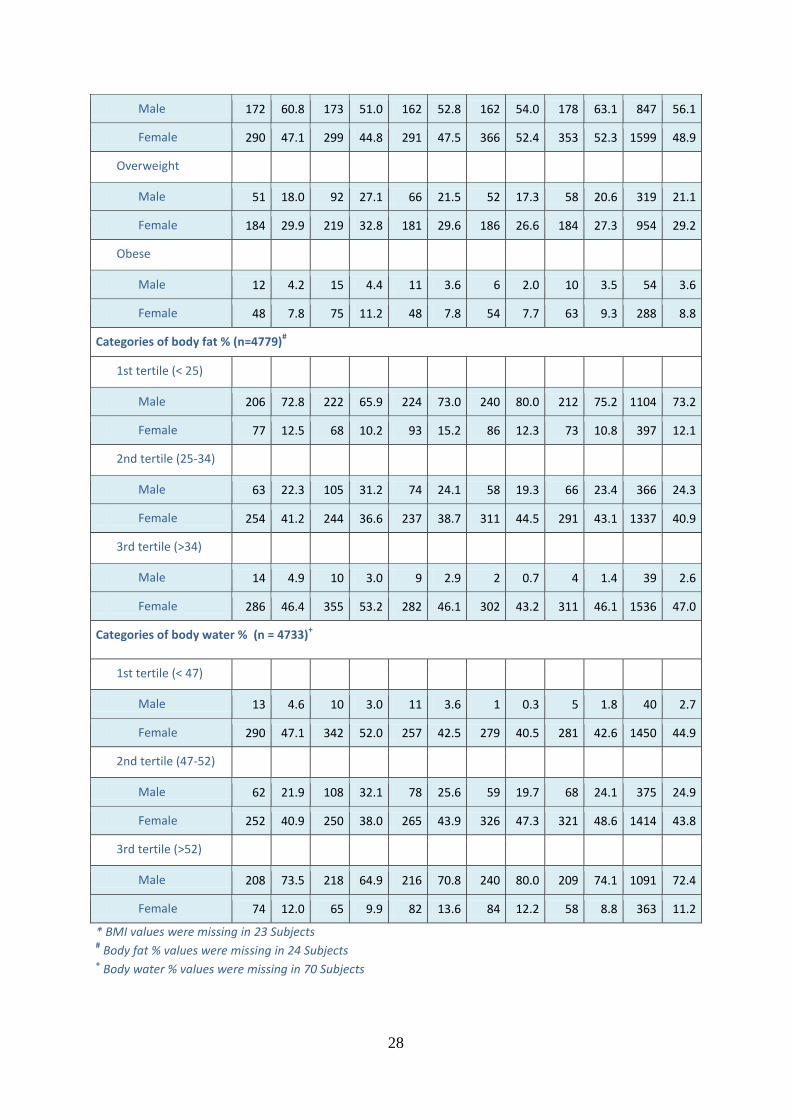
The underweight (19.3%) and normal BMI categories (56.3%) were common among males
compared to females, while the categories of overweight (29.2%) and obese (8.8%) were
common among females compared to males (overweight 21.1% and 3.5%).
Only a minority of males were in the 3rd tertile (2.6%) while approximately half of the
females were in the 3rd tertile (47%). On the other hand, only a minority of females were in
the 3rd tertile (11.2%) while approximately two-thirds of the males were in the 3rd tertile
(72.4%).
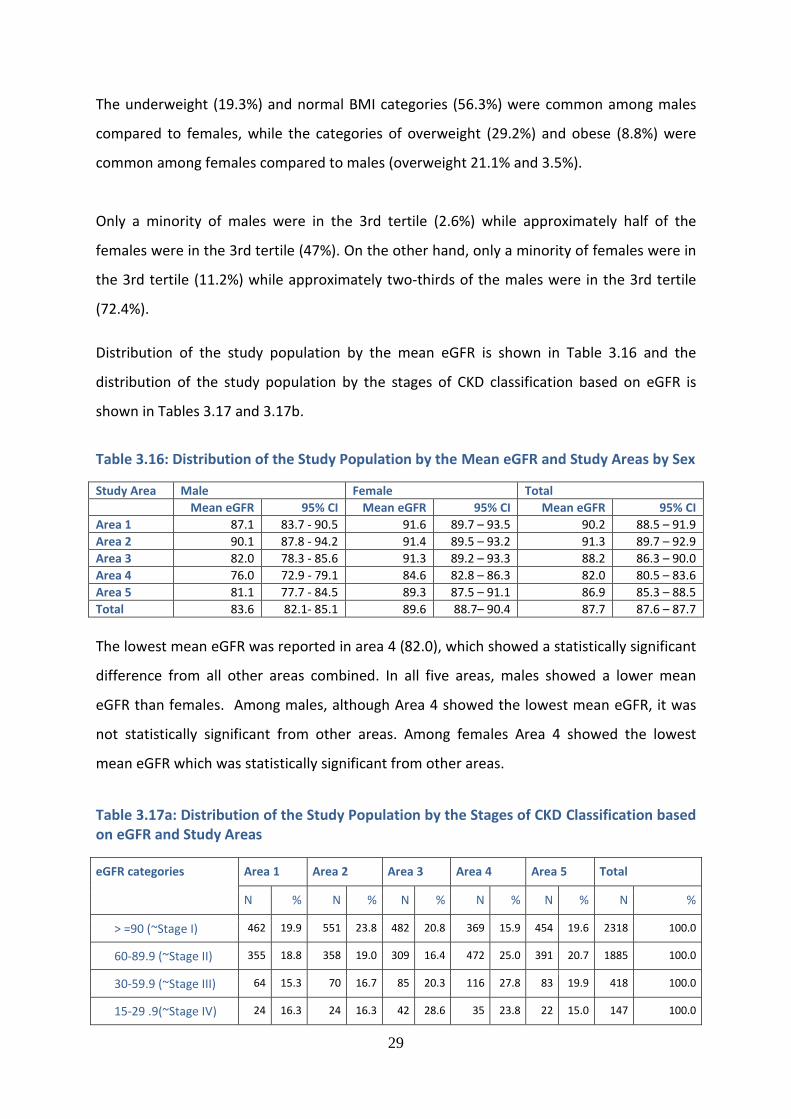
Distribution of the study population by the mean eGFR is shown in Table 3.16 and the
distribution of the study population by the stages of CKD classification based on eGFR is
shown in Tables 3.17 and 3.17b.
Table 3.16: Distribution of the Study Population by the Mean eGFR and Study Areas by Sex
Study Area Male Female Total
Mean eGFR 95% CI Mean eGFR 95% CI Mean eGFR 95% CI
Area 1 87.1 83.7 - 90.5 91.6 89.7 – 93.5 90.2 88.5 – 91.9
Area 2 90.1 87.8 - 94.2 91.4 89.5 – 93.2 91.3 89.7 – 92.9
Area 3 82.0 78.3 - 85.6 91.3 89.2 – 93.3 88.2 86.3 – 90.0
Area 4 76.0 72.9 - 79.1 84.6 82.8 – 86.3 82.0 80.5 – 83.6
Area 5 81.1 77.7 - 84.5 89.3 87.5 – 91.1 86.9 85.3 – 88.5
Total 83.6 82.1- 85.1 89.6 88.7– 90.4 87.7 87.6 – 87.7
The lowest mean eGFR was reported in area 4 (82.0), which showed a statistically significant
difference from all other areas combined. In all five areas, males showed a lower mean
eGFR than females. Among males, although Area 4 showed the lowest mean eGFR, it was
not statistically significant from other areas. Among females Area 4 showed the lowest
mean eGFR which was statistically significant from other areas.
Table 3.17a: Distribution of the Study Population by the Stages of CKD Classification based on eGFR and Study Areas
eGFR categories Area 1 Area 2 Area 3 Area 4 Area 5 Total
N % N % N % N % N % N %
> =90 (~Stage I) 462 19.9 551 23.8 482 20.8 369 15.9 454 19.6 2318 100.0
60-89.9 (~Stage II) 355 18.8 358 19.0 309 16.4 472 25.0 391 20.7 1885 100.0
30-59.9 (~Stage III) 64 15.3 70 16.7 85 20.3 116 27.8 83 19.9 418 100.0
15-29 .9(~Stage IV) 24 16.3 24 16.3 42 28.6 35 23.8 22 15.0 147 100.0

30
<15 (~Stage V) 3 8.6 51 14.3 8 22.9 8 22.9 11 31.4 35 100.0
Total 908 18.9 1008 21.0 926 19.3 1000 20.8 961 20.0 4803 100.0
Approximately half (48.4%) of the study population were classified into the Stage I of the
CKD based on eGFR.
Table 3.18b: Distribution of the Study Population by the Stages of CKD Classification based on eGFR and Age Categories
eGFR categories 18-40 41-50 51-60 61-70 >70 Total
N % N % N % N % N % N %
> 90 (~Stage I)
1482 79.04 540 48.04 209 23.46 79 11.58 8 3.46 2318 48.26
60-89 (~Stage II) 378 20.16 522 46.44 530 59.48 358 52.49 97 41.99 1885 39.25
30-59 (~Stage III) 14 0.75 50 4.45 120 13.47 155 22.73 79 34.20 418 8.70
15-29 (~Stage IV) 1 0.05 10 0.89 24 2.69 75 11.00 37 16.02 147 3.06
<15 (~Stage V)
0 0.00 2 0.18 8 0.90 15 2.20 10 4.33 35 0.73
Total 1875 100 1124 100 891 100 682 100 231 100 4803 100
While two fifth (39%) of the respondents who are below the 40 years are in stage 1, only
3.5% of respondents who are above 70 years in stage 1.
On the other hand, among the respondents who are below 40 years of age less than 1% are
in stage III while respondents who are above 70 years more than one-third (34%) are in
stage III.
Results of investigations on different combinations of eGFR < 60 mL/min using CKD EPI
equation: one-time measurement using standardized methods for creatinine measurement
AND/OR albuminuria > = 30 mg/g which are the essential screening criteria for CKD/CKDu
among the study population are shown in Table 3.18.
Table 3.19: Presence of Essential Screening Criteria for CKD/CKDu by Sex and Study Areas
Presence Area 1 Area 2 Area 3 Area 4 Area 5 Total
% Cl % Cl % Cl % Cl % Cl % Cl
Presence of essential screening criteria for CKD/CKDu (eGFR <60mL/min AND/OR albuminuria ≥30mg/g creatinine)* (n=868)
Total 17.1 14.7-19.6
17.7 15.4-20.1
18.7 16.2-21.3
18.0 15.7-20.5
18.9 16.5-21.5
18.0 17.0 – 19.1
31
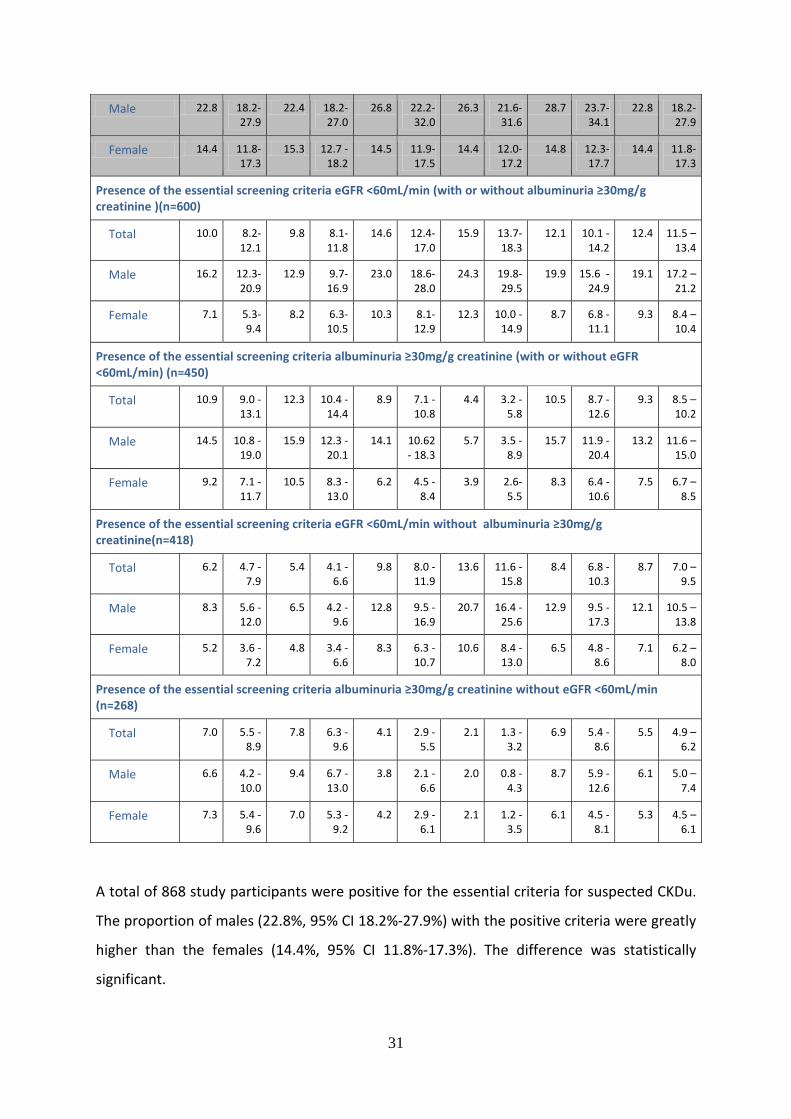
Male 22.8 18.2-27.9
22.4 18.2-27.0
26.8 22.2-32.0
26.3 21.6-31.6
28.7 23.7-34.1
22.8 18.2-27.9
Female 14.4 11.8-17.3
15.3 12.7 - 18.2
14.5 11.9-17.5
14.4 12.0-17.2
14.8 12.3-17.7
14.4 11.8-17.3
Presence of the essential screening criteria eGFR <60mL/min (with or without albuminuria ≥30mg/g creatinine )(n=600)
Total 10.0 8.2-12.1
9.8 8.1-11.8
14.6 12.4-17.0
15.9 13.7-18.3
12.1 10.1 -14.2
12.4 11.5 – 13.4
Male 16.2 12.3-20.9
12.9 9.7-16.9
23.0 18.6-28.0
24.3 19.8-29.5
19.9 15.6 -24.9
19.1 17.2 – 21.2
Female 7.1 5.3-9.4
8.2 6.3-10.5
10.3 8.1-12.9
12.3 10.0 -14.9
8.7 6.8 -11.1
9.3 8.4 – 10.4
Presence of the essential screening criteria albuminuria ≥30mg/g creatinine (with or without eGFR <60mL/min) (n=450)
Total 10.9 9.0 - 13.1
12.3 10.4 - 14.4
8.9 7.1 - 10.8
4.4 3.2 - 5.8
10.5 8.7 - 12.6
9.3 8.5 – 10.2
Male 14.5 10.8 - 19.0
15.9 12.3 - 20.1
14.1 10.62 - 18.3
5.7 3.5 - 8.9
15.7 11.9 - 20.4
13.2 11.6 – 15.0
Female 9.2 7.1 - 11.7
10.5 8.3 - 13.0
6.2 4.5 - 8.4
3.9 2.6- 5.5
8.3 6.4 - 10.6
7.5 6.7 – 8.5
Presence of the essential screening criteria eGFR <60mL/min without albuminuria ≥30mg/g creatinine(n=418)
Total 6.2 4.7 - 7.9
5.4 4.1 - 6.6
9.8 8.0 - 11.9
13.6 11.6 - 15.8
8.4 6.8 - 10.3
8.7 7.0 – 9.5
Male 8.3 5.6 - 12.0
6.5 4.2 - 9.6
12.8 9.5 - 16.9
20.7 16.4 - 25.6
12.9 9.5 - 17.3
12.1 10.5 – 13.8
Female 5.2 3.6 - 7.2
4.8 3.4 - 6.6
8.3 6.3 - 10.7
10.6 8.4 - 13.0
6.5 4.8 - 8.6
7.1 6.2 – 8.0
Presence of the essential screening criteria albuminuria ≥30mg/g creatinine without eGFR <60mL/min (n=268)
Total 7.0 5.5 - 8.9
7.8 6.3 - 9.6
4.1 2.9 - 5.5
2.1 1.3 - 3.2
6.9 5.4 - 8.6
5.5 4.9 – 6.2
Male 6.6 4.2 - 10.0
9.4 6.7 - 13.0
3.8 2.1 - 6.6
2.0 0.8 - 4.3
8.7 5.9 - 12.6
6.1 5.0 – 7.4
Female 7.3 5.4 - 9.6
7.0 5.3 - 9.2
4.2 2.9 - 6.1
2.1 1.2 - 3.5
6.1 4.5 - 8.1
5.3 4.5 – 6.1
A total of 868 study participants were positive for the essential criteria for suspected CKDu.
The proportion of males (22.8%, 95% CI 18.2%-27.9%) with the positive criteria were greatly
higher than the females (14.4%, 95% CI 11.8%-17.3%). The difference was statistically
significant.
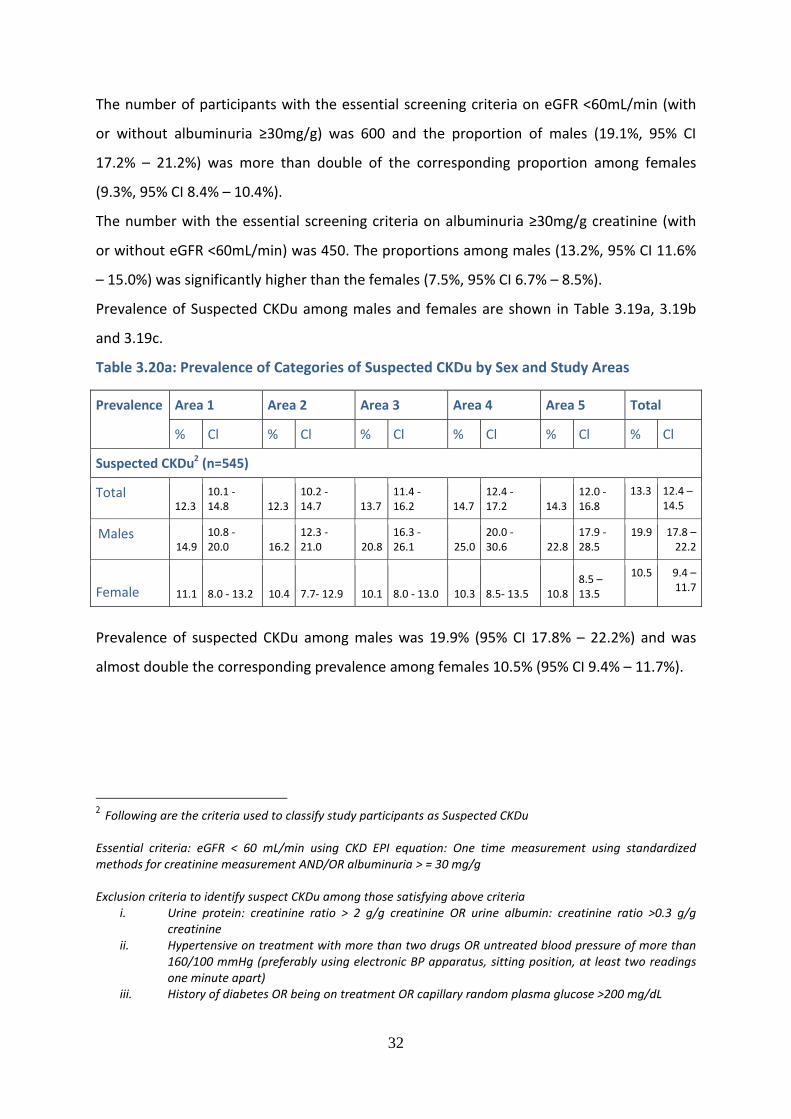
32
The number of participants with the essential screening criteria on eGFR <60mL/min (with
or without albuminuria ≥30mg/g) was 600 and the proportion of males (19.1%, 95% CI
17.2% – 21.2%) was more than double of the corresponding proportion among females
(9.3%, 95% CI 8.4% – 10.4%).
The number with the essential screening criteria on albuminuria ≥30mg/g creatinine (with
or without eGFR <60mL/min) was 450. The proportions among males (13.2%, 95% CI 11.6%
– 15.0%) was significantly higher than the females (7.5%, 95% CI 6.7% – 8.5%).
Prevalence of Suspected CKDu among males and females are shown in Table 3.19a, 3.19b
and 3.19c.
Table 3.20a: Prevalence of Categories of Suspected CKDu by Sex and Study Areas
Prevalence Area 1 Area 2 Area 3 Area 4 Area 5 Total
% Cl % Cl % Cl % Cl % Cl % Cl
Suspected CKDu2 (n=545)
Total 12.3
10.1 - 14.8 12.3
10.2 - 14.7 13.7
11.4 - 16.2 14.7
12.4 - 17.2 14.3
12.0 - 16.8
13.3 12.4 – 14.5
Males 14.9
10.8 - 20.0 16.2
12.3 - 21.0 20.8
16.3 - 26.1 25.0
20.0 - 30.6 22.8
17.9 - 28.5
19.9 17.8 – 22.2
Female 11.1 8.0 - 13.2 10.4 7.7- 12.9 10.1 8.0 - 13.0 10.3 8.5- 13.5 10.8
8.5 – 13.5
10.5 9.4 – 11.7
Prevalence of suspected CKDu among males was 19.9% (95% CI 17.8% – 22.2%) and was
almost double the corresponding prevalence among females 10.5% (95% CI 9.4% – 11.7%).
2 Following are the criteria used to classify study participants as Suspected CKDu Essential criteria: eGFR < 60 mL/min using CKD EPI equation: One time measurement using standardized methods for creatinine measurement AND/OR albuminuria > = 30 mg/g Exclusion criteria to identify suspect CKDu among those satisfying above criteria
i. Urine protein: creatinine ratio > 2 g/g creatinine OR urine albumin: creatinine ratio >0.3 g/g creatinine
ii. Hypertensive on treatment with more than two drugs OR untreated blood pressure of more than 160/100 mmHg (preferably using electronic BP apparatus, sitting position, at least two readings one minute apart)
iii. History of diabetes OR being on treatment OR capillary random plasma glucose >200 mg/dL
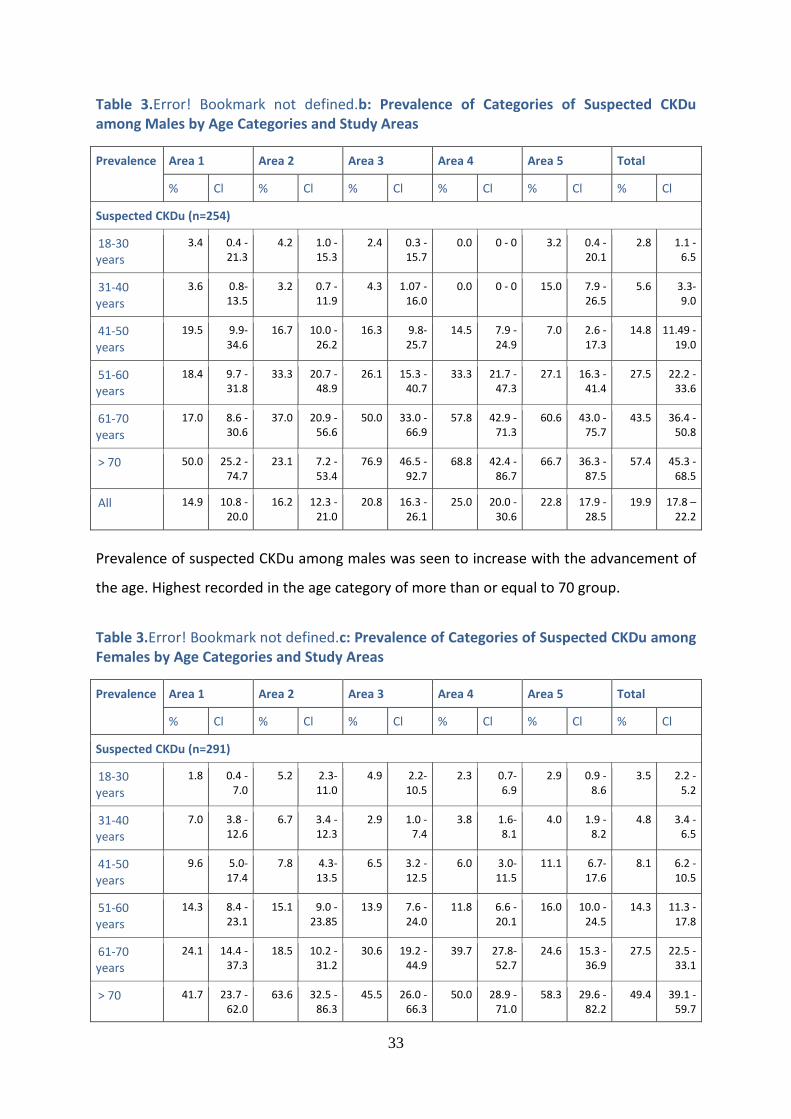
33
Table 3.Error! Bookmark not defined.b: Prevalence of Categories of Suspected CKDu among Males by Age Categories and Study Areas
Prevalence Area 1 Area 2 Area 3 Area 4 Area 5 Total
% Cl % Cl % Cl % Cl % Cl % Cl
Suspected CKDu (n=254)
18-30 years
3.4 0.4 - 21.3
4.2 1.0 - 15.3
2.4 0.3 - 15.7
0.0 0 - 0 3.2 0.4 - 20.1
2.8 1.1 - 6.5
31-40 years
3.6 0.8- 13.5
3.2 0.7 - 11.9
4.3 1.07 - 16.0
0.0 0 - 0 15.0 7.9 - 26.5
5.6 3.3- 9.0
41-50 years
19.5 9.9- 34.6
16.7 10.0 - 26.2
16.3 9.8- 25.7
14.5 7.9 - 24.9
7.0 2.6 - 17.3
14.8 11.49 - 19.0
51-60 years
18.4 9.7 - 31.8
33.3 20.7 - 48.9
26.1 15.3 - 40.7
33.3 21.7 - 47.3
27.1 16.3 - 41.4
27.5 22.2 - 33.6
61-70 years
17.0 8.6 - 30.6
37.0 20.9 - 56.6
50.0 33.0 - 66.9
57.8 42.9 - 71.3
60.6 43.0 - 75.7
43.5 36.4 - 50.8
> 70 50.0 25.2 - 74.7
23.1 7.2 - 53.4
76.9 46.5 - 92.7
68.8 42.4 - 86.7
66.7 36.3 - 87.5
57.4 45.3 - 68.5
All 14.9 10.8 - 20.0
16.2 12.3 - 21.0
20.8 16.3 - 26.1
25.0 20.0 - 30.6
22.8 17.9 - 28.5
19.9 17.8 – 22.2
Prevalence of suspected CKDu among males was seen to increase with the advancement of
the age. Highest recorded in the age category of more than or equal to 70 group.
Table 3.Error! Bookmark not defined.c: Prevalence of Categories of Suspected CKDu among Females by Age Categories and Study Areas
Prevalence Area 1 Area 2 Area 3 Area 4 Area 5 Total
% Cl % Cl % Cl % Cl % Cl % Cl
Suspected CKDu (n=291)
18-30 years
1.8 0.4 - 7.0
5.2 2.3- 11.0
4.9 2.2- 10.5
2.3 0.7- 6.9
2.9 0.9 - 8.6
3.5 2.2 - 5.2
31-40 years
7.0 3.8 - 12.6
6.7 3.4 - 12.3
2.9 1.0 - 7.4
3.8 1.6- 8.1
4.0 1.9 - 8.2
4.8 3.4 - 6.5
41-50 years
9.6 5.0- 17.4
7.8 4.3- 13.5
6.5 3.2 - 12.5
6.0 3.0- 11.5
11.1 6.7- 17.6
8.1 6.2 - 10.5
51-60 years
14.3 8.4 - 23.1
15.1 9.0 - 23.85
13.9 7.6 - 24.0
11.8 6.6 - 20.1
16.0 10.0 - 24.5
14.3 11.3 - 17.8
61-70 years
24.1 14.4 - 37.3
18.5 10.2 - 31.2
30.6 19.2 - 44.9
39.7 27.8- 52.7
24.6 15.3 - 36.9
27.5 22.5 - 33.1
> 70 41.7 23.7 - 62.0
63.6 32.5 - 86.3
45.5 26.0 - 66.3
50.0 28.9 - 71.0
58.3 29.6 - 82.2
49.4 39.1 - 59.7
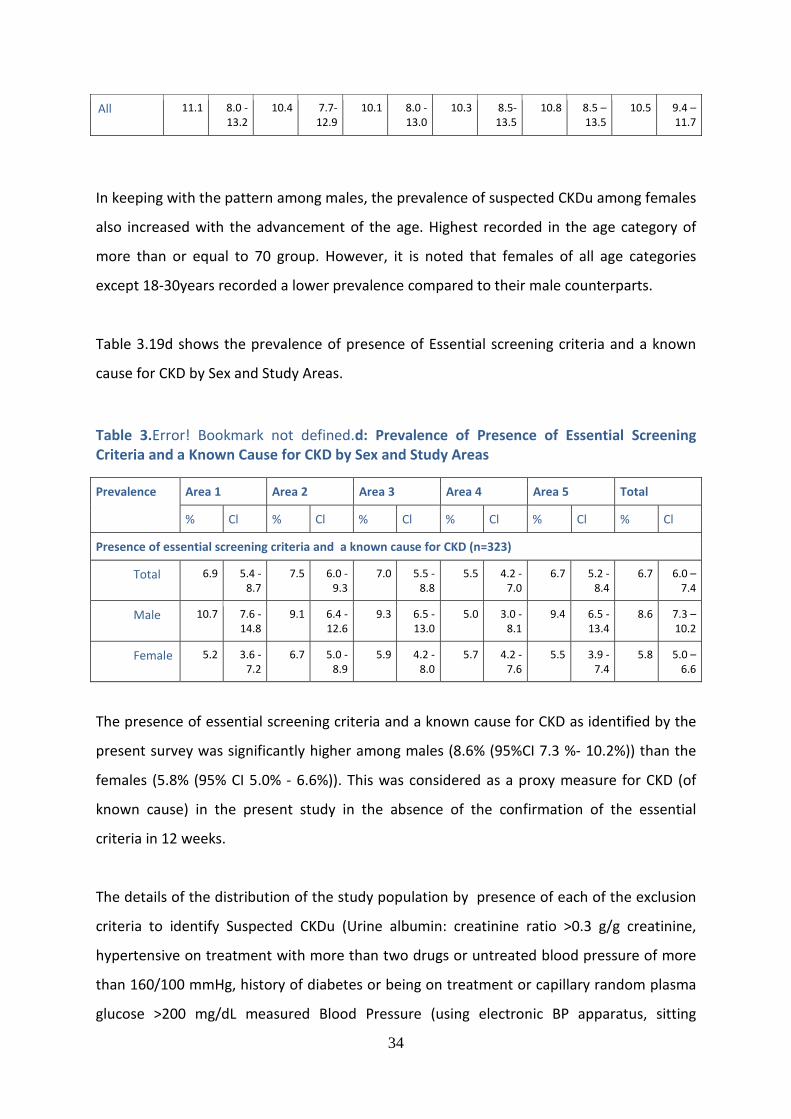
34
All 11.1 8.0 - 13.2
10.4 7.7- 12.9
10.1 8.0 - 13.0
10.3 8.5- 13.5
10.8 8.5 – 13.5
10.5 9.4 – 11.7
In keeping with the pattern among males, the prevalence of suspected CKDu among females
also increased with the advancement of the age. Highest recorded in the age category of
more than or equal to 70 group. However, it is noted that females of all age categories
except 18-30years recorded a lower prevalence compared to their male counterparts.
Table 3.19d shows the prevalence of presence of Essential screening criteria and a known
cause for CKD by Sex and Study Areas.
Table 3.Error! Bookmark not defined.d: Prevalence of Presence of Essential Screening Criteria and a Known Cause for CKD by Sex and Study Areas
Prevalence Area 1 Area 2 Area 3 Area 4 Area 5 Total
% Cl % Cl % Cl % Cl % Cl % Cl
Presence of essential screening criteria and a known cause for CKD (n=323)
Total 6.9 5.4 - 8.7
7.5 6.0 - 9.3
7.0 5.5 - 8.8
5.5 4.2 - 7.0
6.7 5.2 - 8.4
6.7 6.0 – 7.4
Male 10.7 7.6 - 14.8
9.1 6.4 - 12.6
9.3 6.5 - 13.0
5.0 3.0 - 8.1
9.4 6.5 - 13.4
8.6 7.3 – 10.2
Female 5.2 3.6 - 7.2
6.7 5.0 - 8.9
5.9 4.2 - 8.0
5.7 4.2 - 7.6
5.5 3.9 - 7.4
5.8 5.0 – 6.6
The presence of essential screening criteria and a known cause for CKD as identified by the
present survey was significantly higher among males (8.6% (95%CI 7.3 %- 10.2%)) than the
females (5.8% (95% CI 5.0% - 6.6%)). This was considered as a proxy measure for CKD (of
known cause) in the present study in the absence of the confirmation of the essential
criteria in 12 weeks.
The details of the distribution of the study population by presence of each of the exclusion
criteria to identify Suspected CKDu (Urine albumin: creatinine ratio >0.3 g/g creatinine,
hypertensive on treatment with more than two drugs or untreated blood pressure of more
than 160/100 mmHg, history of diabetes or being on treatment or capillary random plasma
glucose >200 mg/dL measured Blood Pressure (using electronic BP apparatus, sitting
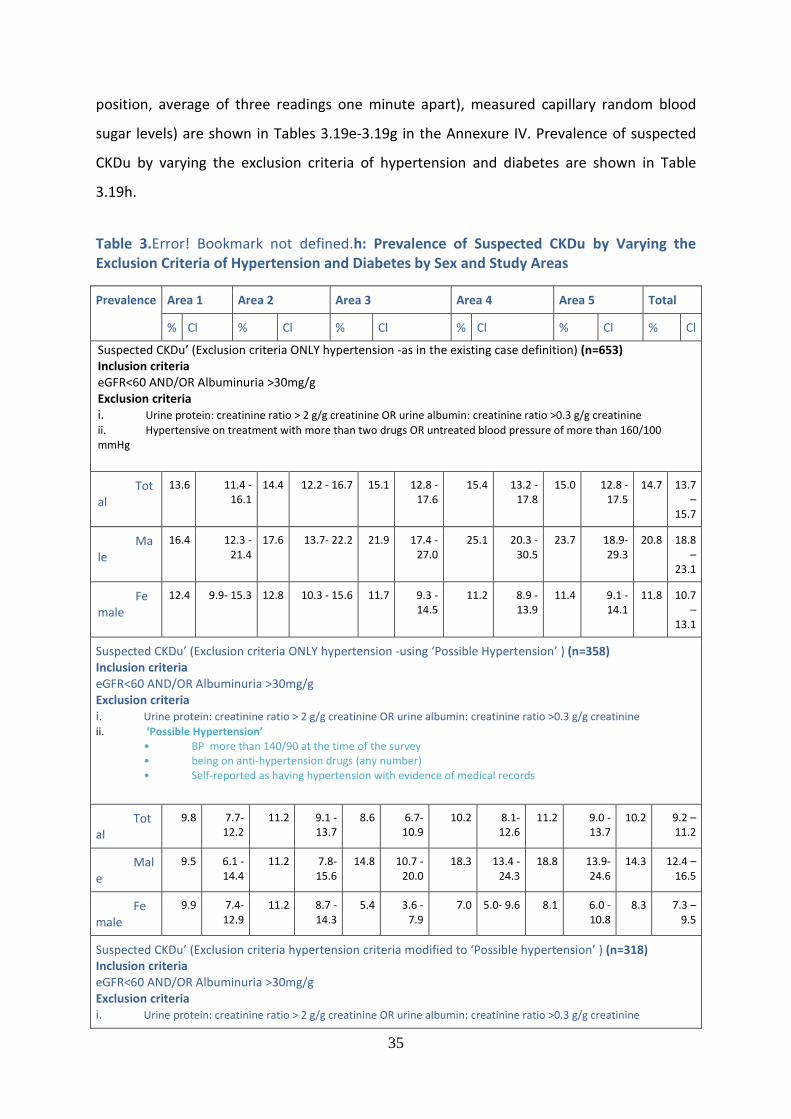
35
position, average of three readings one minute apart), measured capillary random blood
sugar levels) are shown in Tables 3.19e-3.19g in the Annexure IV. Prevalence of suspected
CKDu by varying the exclusion criteria of hypertension and diabetes are shown in Table
3.19h.
Table 3.Error! Bookmark not defined.h: Prevalence of Suspected CKDu by Varying the Exclusion Criteria of Hypertension and Diabetes by Sex and Study Areas
Prevalence Area 1 Area 2 Area 3 Area 4 Area 5 Total
% Cl % Cl % Cl % Cl % Cl % Cl
Suspected CKDu’ (Exclusion criteria ONLY hypertension -as in the existing case definition) (n=653) Inclusion criteria eGFR<60 AND/OR Albuminuria >30mg/g Exclusion criteria i. Urine protein: creatinine ratio > 2 g/g creatinine OR urine albumin: creatinine ratio >0.3 g/g creatinine
ii. Hypertensive on treatment with more than two drugs OR untreated blood pressure of more than 160/100 mmHg
Total
13.6 11.4 - 16.1
14.4 12.2 - 16.7 15.1 12.8 - 17.6
15.4 13.2 - 17.8
15.0 12.8 - 17.5
14.7 13.7 –
15.7
Male
16.4 12.3 - 21.4
17.6 13.7- 22.2 21.9 17.4 - 27.0
25.1 20.3 - 30.5
23.7 18.9- 29.3
20.8 18.8 –
23.1
Female
12.4 9.9- 15.3 12.8 10.3 - 15.6 11.7 9.3 - 14.5
11.2 8.9 - 13.9
11.4 9.1 - 14.1
11.8 10.7 –
13.1
Suspected CKDu’ (Exclusion criteria ONLY hypertension -using ‘Possible Hypertension’ ) (n=358) Inclusion criteria eGFR<60 AND/OR Albuminuria >30mg/g Exclusion criteria i. Urine protein: creatinine ratio > 2 g/g creatinine OR urine albumin: creatinine ratio >0.3 g/g creatinine
ii. ‘Possible Hypertension’ • BP more than 140/90 at the time of the survey • being on anti-hypertension drugs (any number) • Self-reported as having hypertension with evidence of medical records
Total
9.8 7.7- 12.2
11.2 9.1 - 13.7
8.6 6.7- 10.9
10.2 8.1- 12.6
11.2 9.0 - 13.7
10.2 9.2 – 11.2
Male
9.5 6.1 - 14.4
11.2 7.8- 15.6
14.8 10.7 - 20.0
18.3 13.4 - 24.3
18.8 13.9- 24.6
14.3 12.4 – 16.5
Female
9.9 7.4- 12.9
11.2 8.7 - 14.3
5.4 3.6 - 7.9
7.0 5.0- 9.6 8.1 6.0 - 10.8
8.3 7.3 – 9.5
Suspected CKDu’ (Exclusion criteria hypertension criteria modified to ‘Possible hypertension’ ) (n=318) Inclusion criteria eGFR<60 AND/OR Albuminuria >30mg/g Exclusion criteria i. Urine protein: creatinine ratio > 2 g/g creatinine OR urine albumin: creatinine ratio >0.3 g/g creatinine
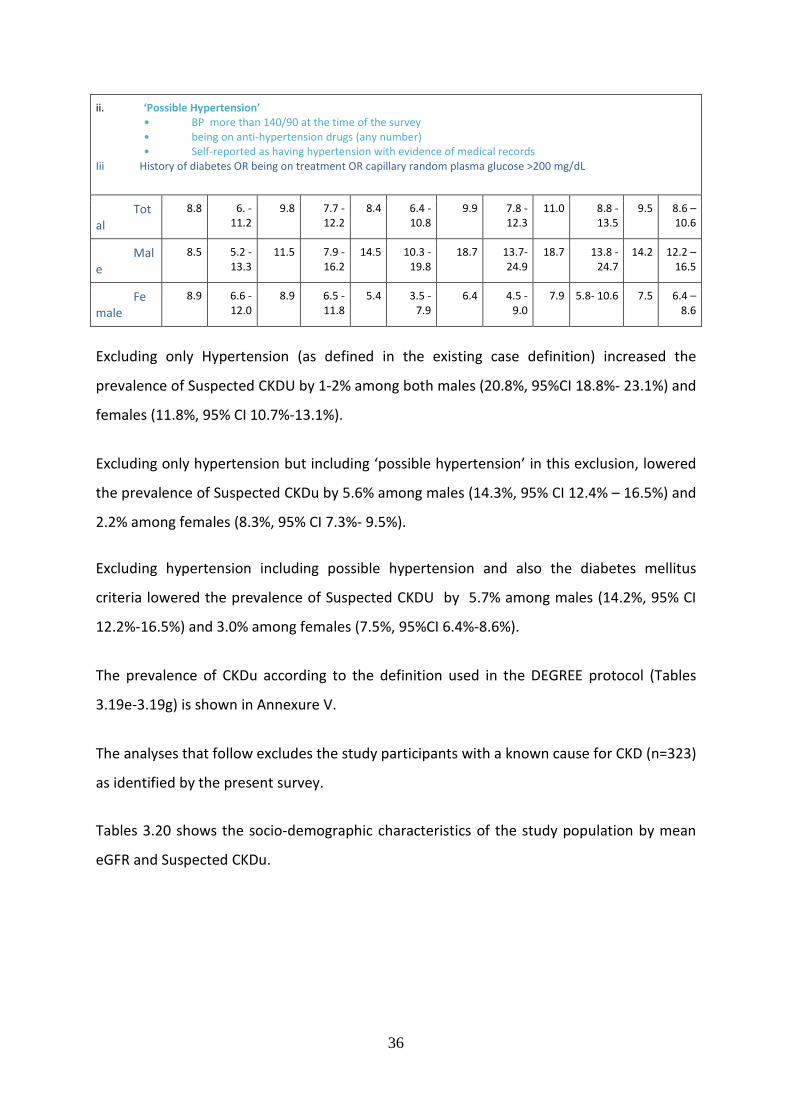
36
ii. ‘Possible Hypertension’ • BP more than 140/90 at the time of the survey • being on anti-hypertension drugs (any number) • Self-reported as having hypertension with evidence of medical records
Iii History of diabetes OR being on treatment OR capillary random plasma glucose >200 mg/dL
Total
8.8 6. - 11.2
9.8 7.7 - 12.2
8.4 6.4 - 10.8
9.9 7.8 - 12.3
11.0 8.8 - 13.5
9.5 8.6 – 10.6
Male
8.5 5.2 - 13.3
11.5 7.9 - 16.2
14.5 10.3 - 19.8
18.7 13.7- 24.9
18.7 13.8 - 24.7
14.2 12.2 – 16.5
Female
8.9 6.6 - 12.0
8.9 6.5 - 11.8
5.4 3.5 - 7.9
6.4 4.5 - 9.0
7.9 5.8- 10.6 7.5 6.4 – 8.6
Excluding only Hypertension (as defined in the existing case definition) increased the
prevalence of Suspected CKDU by 1-2% among both males (20.8%, 95%CI 18.8%- 23.1%) and
females (11.8%, 95% CI 10.7%-13.1%).
Excluding only hypertension but including ‘possible hypertension’ in this exclusion, lowered
the prevalence of Suspected CKDu by 5.6% among males (14.3%, 95% CI 12.4% – 16.5%) and
2.2% among females (8.3%, 95% CI 7.3%- 9.5%).
Excluding hypertension including possible hypertension and also the diabetes mellitus
criteria lowered the prevalence of Suspected CKDU by 5.7% among males (14.2%, 95% CI
12.2%-16.5%) and 3.0% among females (7.5%, 95%CI 6.4%-8.6%).
The prevalence of CKDu according to the definition used in the DEGREE protocol (Tables
3.19e-3.19g) is shown in Annexure V.
The analyses that follow excludes the study participants with a known cause for CKD (n=323)
as identified by the present survey.
Tables 3.20 shows the socio-demographic characteristics of the study population by mean
eGFR and Suspected CKDu.
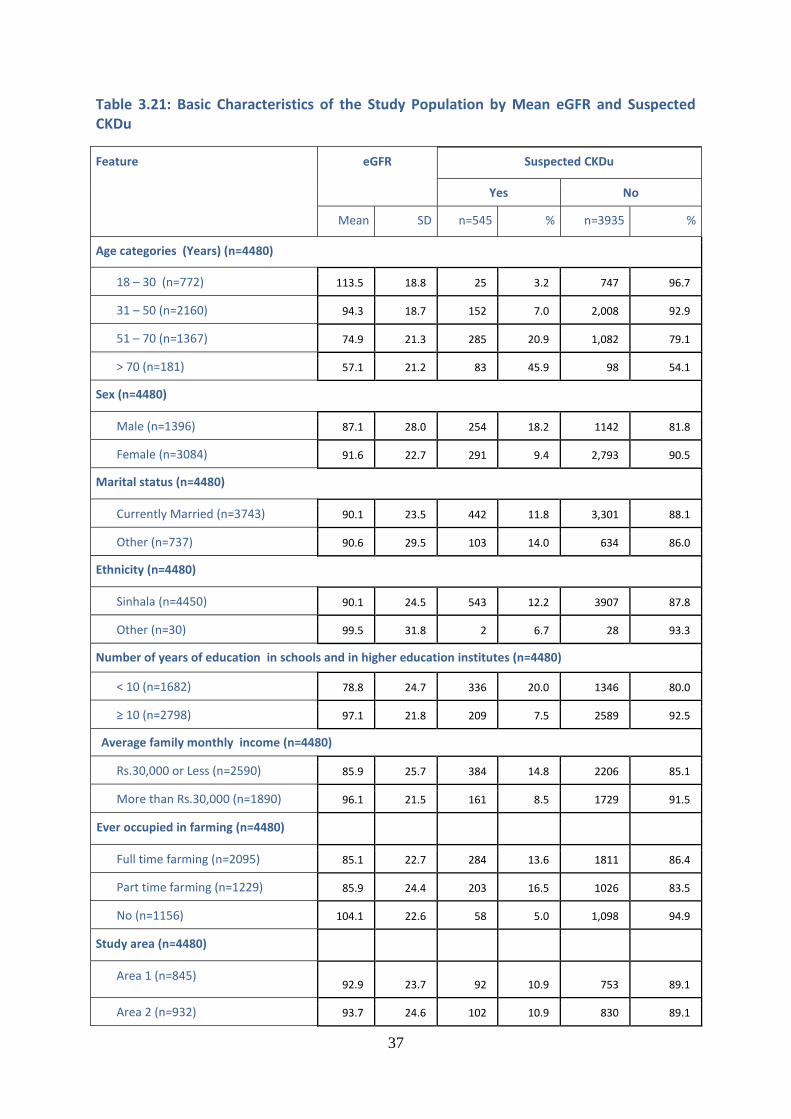
37
Table 3.21: Basic Characteristics of the Study Population by Mean eGFR and Suspected CKDu
Feature eGFR Suspected CKDu
Yes No
Mean SD n=545 % n=3935 %
Age categories (Years) (n=4480)
18 – 30 (n=772) 113.5 18.8 25 3.2 747 96.7
31 – 50 (n=2160) 94.3 18.7 152 7.0 2,008 92.9
51 – 70 (n=1367) 74.9 21.3 285 20.9 1,082 79.1
> 70 (n=181) 57.1 21.2 83 45.9 98 54.1
Sex (n=4480)
Male (n=1396) 87.1 28.0 254 18.2 1142 81.8
Female (n=3084) 91.6 22.7 291 9.4 2,793 90.5
Marital status (n=4480)
Currently Married (n=3743) 90.1 23.5 442 11.8 3,301 88.1
Other (n=737) 90.6 29.5 103 14.0 634 86.0
Ethnicity (n=4480)
Sinhala (n=4450) 90.1 24.5 543 12.2 3907 87.8
Other (n=30) 99.5 31.8 2 6.7 28 93.3
Number of years of education in schools and in higher education institutes (n=4480)
< 10 (n=1682) 78.8 24.7 336 20.0 1346 80.0
≥ 10 (n=2798) 97.1 21.8 209 7.5 2589 92.5
Average family monthly income (n=4480)
Rs.30,000 or Less (n=2590) 85.9 25.7 384 14.8 2206 85.1
More than Rs.30,000 (n=1890) 96.1 21.5 161 8.5 1729 91.5
Ever occupied in farming (n=4480)
Full time farming (n=2095) 85.1 22.7 284 13.6 1811 86.4
Part time farming (n=1229) 85.9 24.4 203 16.5 1026 83.5
No (n=1156) 104.1 22.6 58 5.0 1,098 94.9
Study area (n=4480)
Area 1 (n=845) 92.9 23.7 92 10.9 753 89.1
Area 2 (n=932) 93.7 24.6 102 10.9 830 89.1
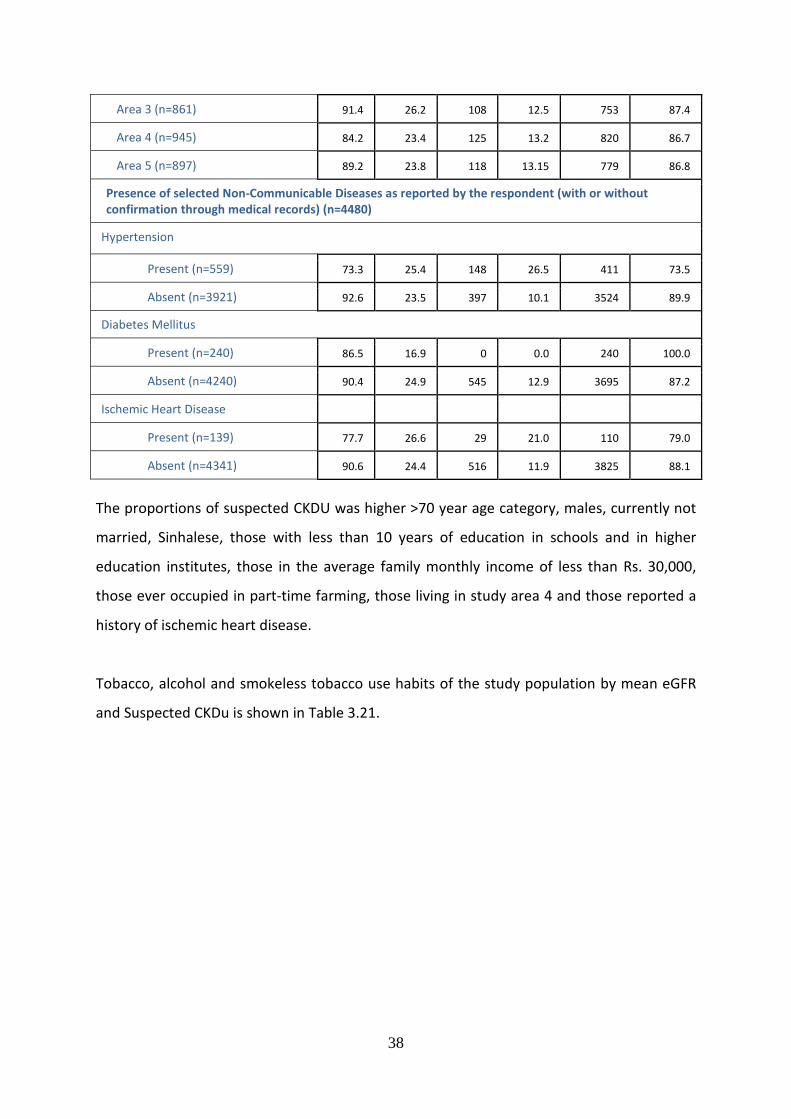
38
Area 3 (n=861) 91.4 26.2 108 12.5 753 87.4
Area 4 (n=945) 84.2 23.4 125 13.2 820 86.7
Area 5 (n=897) 89.2 23.8 118 13.15 779 86.8
Presence of selected Non-Communicable Diseases as reported by the respondent (with or without confirmation through medical records) (n=4480)
Hypertension
Present (n=559) 73.3 25.4 148 26.5 411 73.5
Absent (n=3921) 92.6 23.5 397 10.1 3524 89.9
Diabetes Mellitus
Present (n=240) 86.5 16.9 0 0.0 240 100.0
Absent (n=4240) 90.4 24.9 545 12.9 3695 87.2
Ischemic Heart Disease
Present (n=139) 77.7 26.6 29 21.0 110 79.0
Absent (n=4341) 90.6 24.4 516 11.9 3825 88.1
The proportions of suspected CKDU was higher >70 year age category, males, currently not
married, Sinhalese, those with less than 10 years of education in schools and in higher
education institutes, those in the average family monthly income of less than Rs. 30,000,
those ever occupied in part-time farming, those living in study area 4 and those reported a
history of ischemic heart disease.
Tobacco, alcohol and smokeless tobacco use habits of the study population by mean eGFR
and Suspected CKDu is shown in Table 3.21.
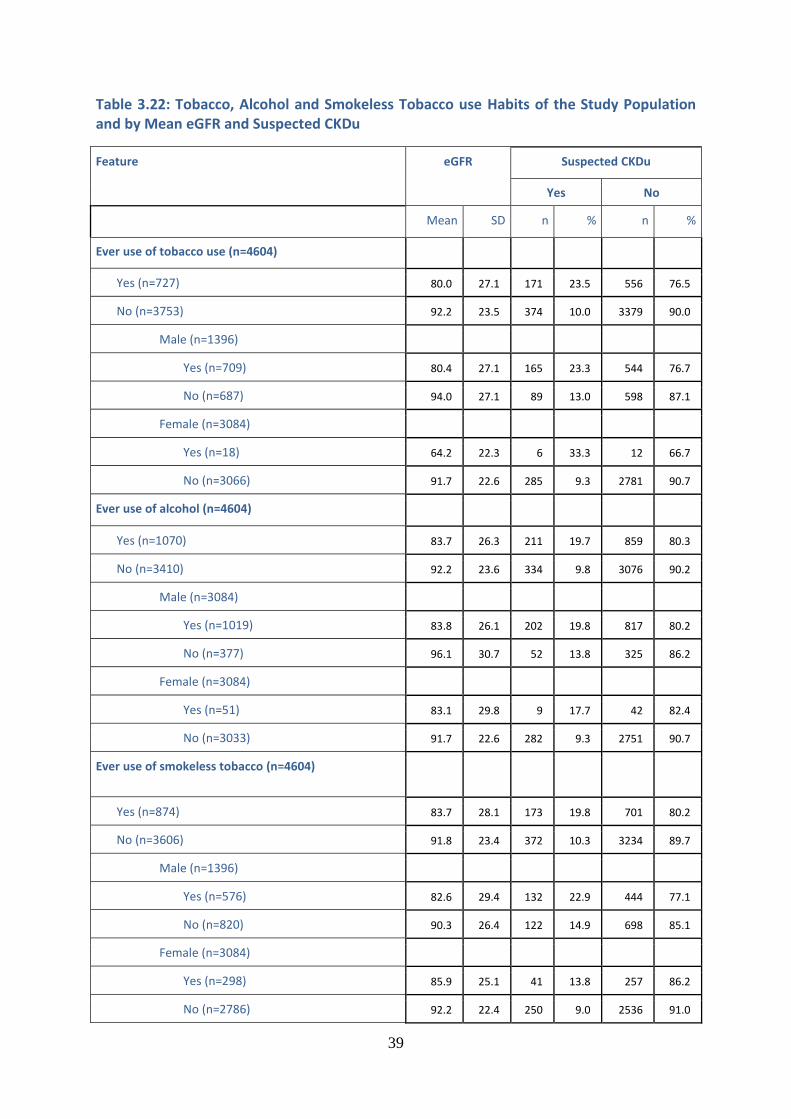
39
Table 3.22: Tobacco, Alcohol and Smokeless Tobacco use Habits of the Study Population and by Mean eGFR and Suspected CKDu
Feature eGFR Suspected CKDu
Yes No
Mean SD n % n %
Ever use of tobacco use (n=4604)
Yes (n=727) 80.0 27.1 171 23.5 556 76.5
No (n=3753) 92.2 23.5 374 10.0 3379 90.0
Male (n=1396)
Yes (n=709) 80.4 27.1 165 23.3 544 76.7
No (n=687) 94.0 27.1 89 13.0 598 87.1
Female (n=3084)
Yes (n=18) 64.2 22.3 6 33.3 12 66.7
No (n=3066) 91.7 22.6 285 9.3 2781 90.7
Ever use of alcohol (n=4604)
Yes (n=1070) 83.7 26.3 211 19.7 859 80.3
No (n=3410) 92.2 23.6 334 9.8 3076 90.2
Male (n=3084)
Yes (n=1019) 83.8 26.1 202 19.8 817 80.2
No (n=377) 96.1 30.7 52 13.8 325 86.2
Female (n=3084)
Yes (n=51) 83.1 29.8 9 17.7 42 82.4
No (n=3033) 91.7 22.6 282 9.3 2751 90.7
Ever use of smokeless tobacco (n=4604)
Yes (n=874) 83.7 28.1 173 19.8 701 80.2
No (n=3606) 91.8 23.4 372 10.3 3234 89.7
Male (n=1396)
Yes (n=576) 82.6 29.4 132 22.9 444 77.1
No (n=820) 90.3 26.4 122 14.9 698 85.1
Female (n=3084)
Yes (n=298) 85.9 25.1 41 13.8 257 86.2
No (n=2786) 92.2 22.4 250 9.0 2536 91.0
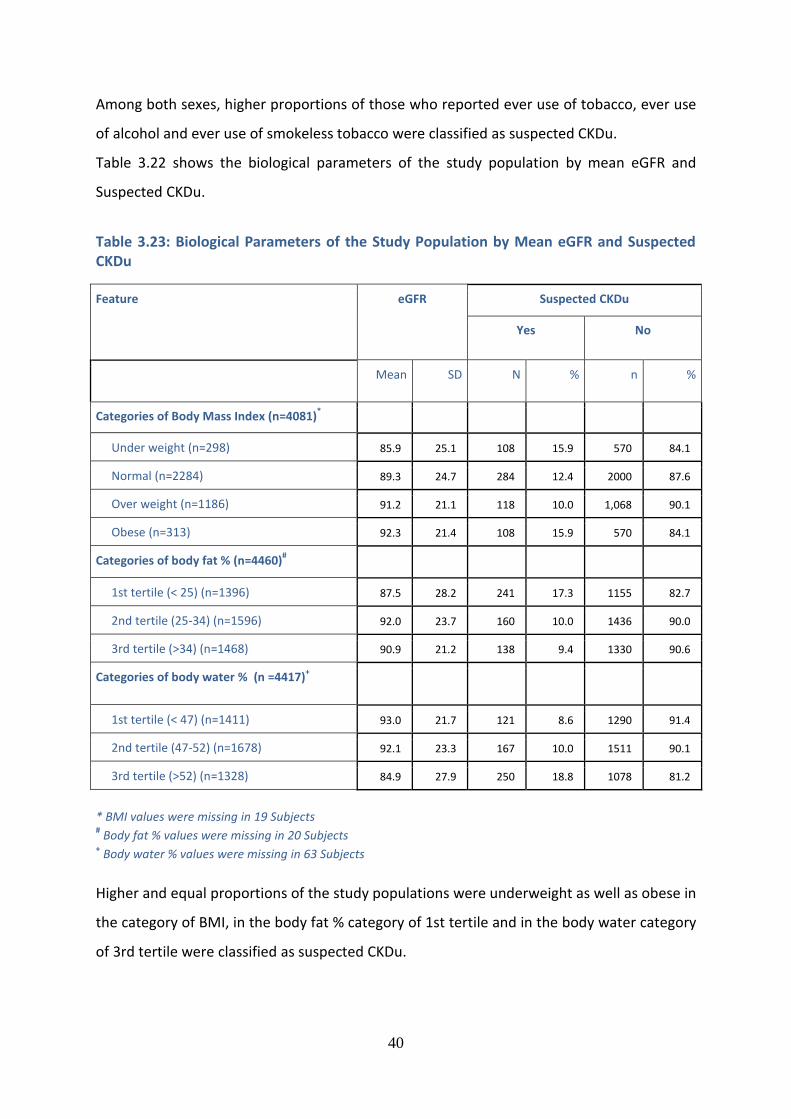
40
Among both sexes, higher proportions of those who reported ever use of tobacco, ever use
of alcohol and ever use of smokeless tobacco were classified as suspected CKDu.
Table 3.22 shows the biological parameters of the study population by mean eGFR and
Suspected CKDu.
Table 3.23: Biological Parameters of the Study Population by Mean eGFR and Suspected CKDu
Feature eGFR Suspected CKDu
Yes No
Mean SD N % n %
Categories of Body Mass Index (n=4081)*
Under weight (n=298) 85.9 25.1 108 15.9 570 84.1
Normal (n=2284) 89.3 24.7 284 12.4 2000 87.6
Over weight (n=1186) 91.2 21.1 118 10.0 1,068 90.1
Obese (n=313) 92.3 21.4 108 15.9 570 84.1
Categories of body fat % (n=4460)#
1st tertile (< 25) (n=1396) 87.5 28.2 241 17.3 1155 82.7
2nd tertile (25-34) (n=1596) 92.0 23.7 160 10.0 1436 90.0
3rd tertile (>34) (n=1468) 90.9 21.2 138 9.4 1330 90.6
Categories of body water % (n =4417)+
1st tertile (< 47) (n=1411) 93.0 21.7 121 8.6 1290 91.4
2nd tertile (47-52) (n=1678) 92.1 23.3 167 10.0 1511 90.1
3rd tertile (>52) (n=1328) 84.9 27.9 250 18.8 1078 81.2
* BMI values were missing in 19 Subjects # Body fat % values were missing in 20 Subjects
+ Body water % values were missing in 63 Subjects
Higher and equal proportions of the study populations were underweight as well as obese in
the category of BMI, in the body fat % category of 1st tertile and in the body water category
of 3rd tertile were classified as suspected CKDu.
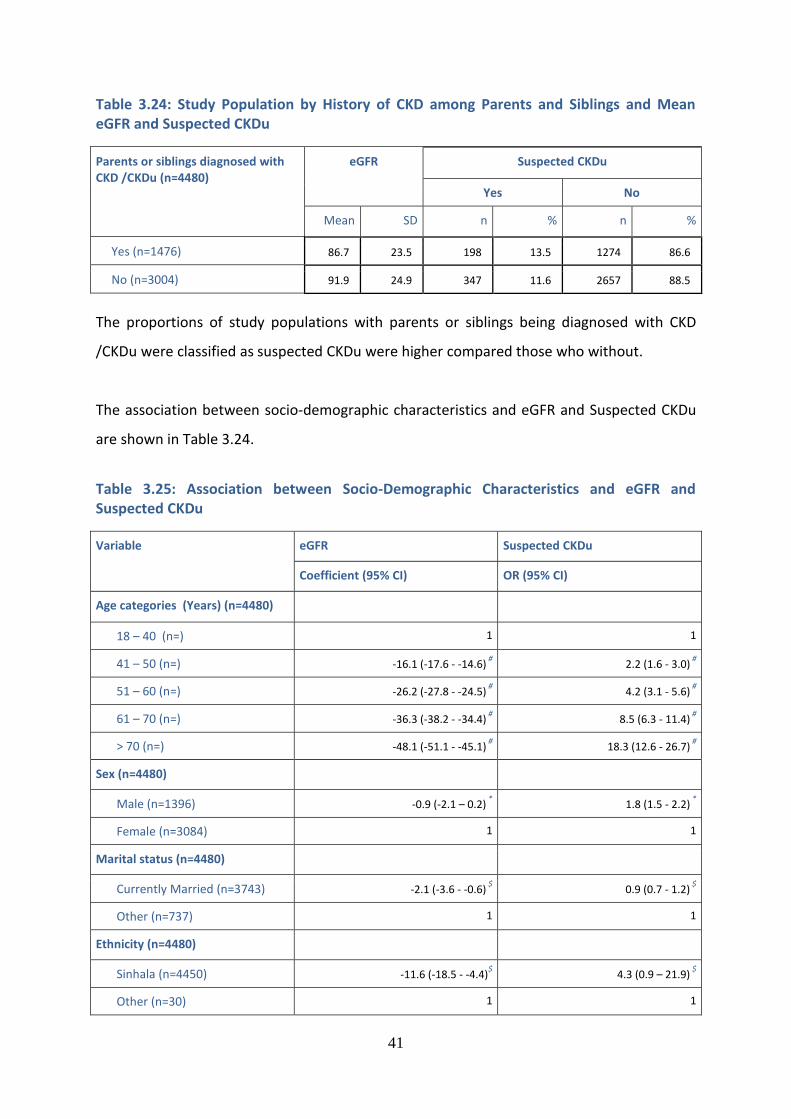
41
Table 3.24: Study Population by History of CKD among Parents and Siblings and Mean eGFR and Suspected CKDu
Parents or siblings diagnosed with CKD /CKDu (n=4480)
eGFR Suspected CKDu
Yes No
Mean SD n % n %
Yes (n=1476) 86.7 23.5 198 13.5 1274 86.6
No (n=3004) 91.9 24.9 347 11.6 2657 88.5
The proportions of study populations with parents or siblings being diagnosed with CKD
/CKDu were classified as suspected CKDu were higher compared those who without.
The association between socio-demographic characteristics and eGFR and Suspected CKDu
are shown in Table 3.24.
Table 3.25: Association between Socio-Demographic Characteristics and eGFR and Suspected CKDu
Variable eGFR Suspected CKDu
Coefficient (95% CI) OR (95% CI)
Age categories (Years) (n=4480)
18 – 40 (n=) 1 1
41 – 50 (n=) -16.1 (-17.6 - -14.6) #
2.2 (1.6 - 3.0) #
51 – 60 (n=) -26.2 (-27.8 - -24.5) #
4.2 (3.1 - 5.6) #
61 – 70 (n=) -36.3 (-38.2 - -34.4) #
8.5 (6.3 - 11.4) #
> 70 (n=) -48.1 (-51.1 - -45.1) #
18.3 (12.6 - 26.7) #
Sex (n=4480)
Male (n=1396) -0.9 (-2.1 – 0.2) *
1.8 (1.5 - 2.2) *
Female (n=3084) 1 1
Marital status (n=4480)
Currently Married (n=3743) -2.1 (-3.6 - -0.6) $
0.9 (0.7 - 1.2) $
Other (n=737) 1 1
Ethnicity (n=4480)
Sinhala (n=4450) -11.6 (-18.5 - -4.4)$ 4.3 (0.9 – 21.9)
$
Other (n=30) 1 1
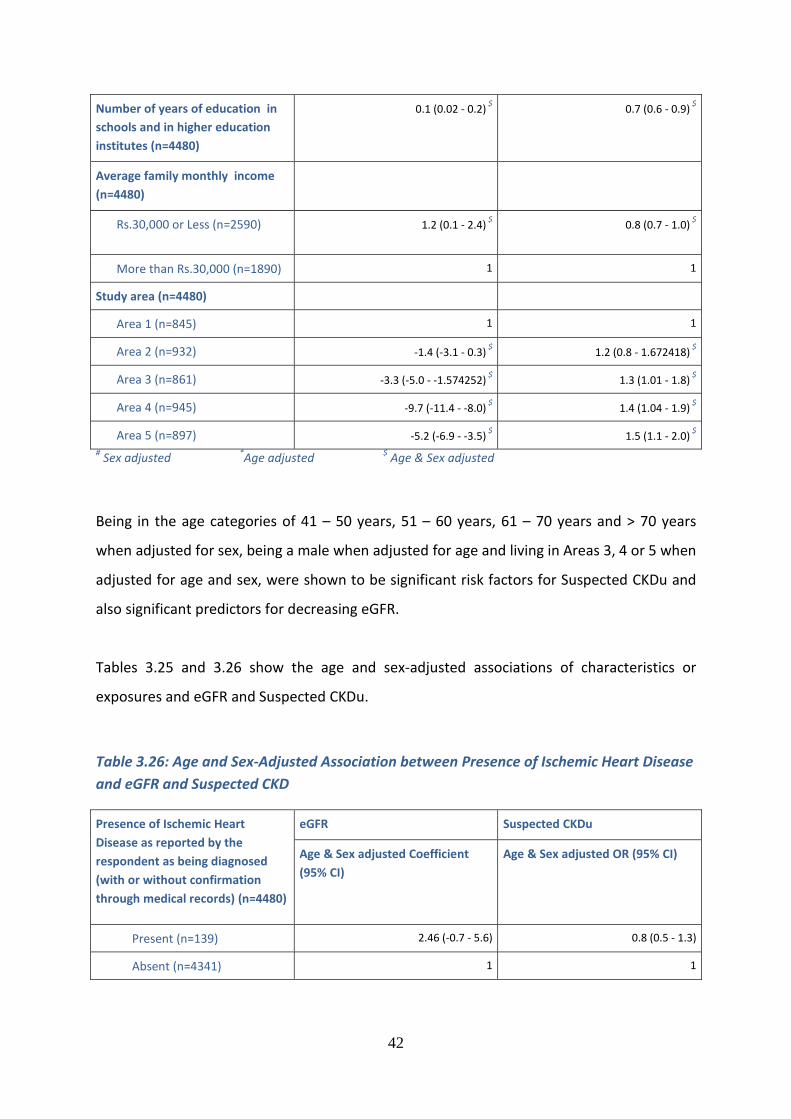
42
Number of years of education in
schools and in higher education
institutes (n=4480)
0.1 (0.02 - 0.2) $
0.7 (0.6 - 0.9) $
Average family monthly income
(n=4480)
Rs.30,000 or Less (n=2590) 1.2 (0.1 - 2.4) $
0.8 (0.7 - 1.0) $
More than Rs.30,000 (n=1890) 1 1
Study area (n=4480)
Area 1 (n=845) 1 1
Area 2 (n=932) -1.4 (-3.1 - 0.3) $
1.2 (0.8 - 1.672418) $
Area 3 (n=861) -3.3 (-5.0 - -1.574252) $
1.3 (1.01 - 1.8) $
Area 4 (n=945) -9.7 (-11.4 - -8.0) $
1.4 (1.04 - 1.9) $
Area 5 (n=897) -5.2 (-6.9 - -3.5) $
1.5 (1.1 - 2.0) $
# Sex adjusted
*Age adjusted
$ Age & Sex adjusted
Being in the age categories of 41 – 50 years, 51 – 60 years, 61 – 70 years and > 70 years
when adjusted for sex, being a male when adjusted for age and living in Areas 3, 4 or 5 when
adjusted for age and sex, were shown to be significant risk factors for Suspected CKDu and
also significant predictors for decreasing eGFR.
Tables 3.25 and 3.26 show the age and sex-adjusted associations of characteristics or
exposures and eGFR and Suspected CKDu.
Table 3.26: Age and Sex-Adjusted Association between Presence of Ischemic Heart Disease
and eGFR and Suspected CKD
Presence of Ischemic Heart
Disease as reported by the
respondent as being diagnosed
(with or without confirmation
through medical records) (n=4480)
eGFR Suspected CKDu
Age & Sex adjusted Coefficient
(95% CI) Age & Sex adjusted OR (95% CI)
Present (n=139) 2.46 (-0.7 - 5.6) 0.8 (0.5 - 1.3)
Absent (n=4341) 1 1
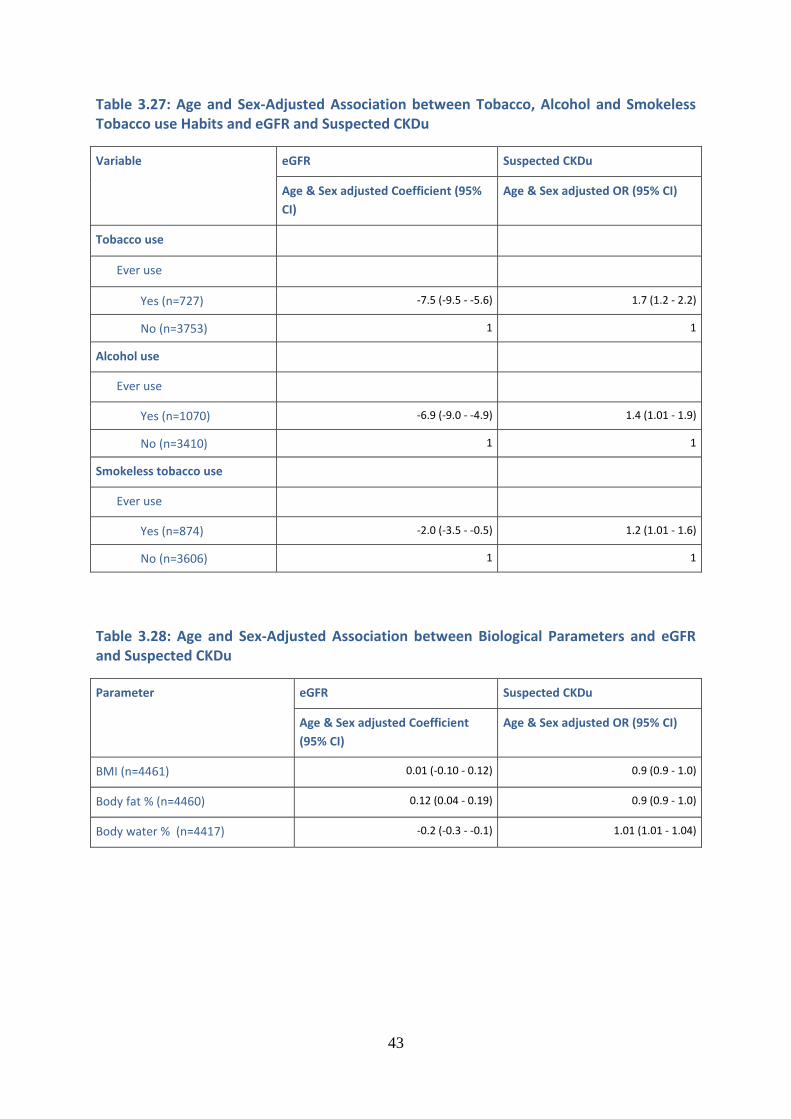
43
Table 3.27: Age and Sex-Adjusted Association between Tobacco, Alcohol and Smokeless Tobacco use Habits and eGFR and Suspected CKDu
Variable eGFR Suspected CKDu
Age & Sex adjusted Coefficient (95%
CI) Age & Sex adjusted OR (95% CI)
Tobacco use
Ever use
Yes (n=727) -7.5 (-9.5 - -5.6) 1.7 (1.2 - 2.2)
No (n=3753) 1 1
Alcohol use
Ever use
Yes (n=1070) -6.9 (-9.0 - -4.9) 1.4 (1.01 - 1.9)
No (n=3410) 1 1
Smokeless tobacco use
Ever use
Yes (n=874) -2.0 (-3.5 - -0.5) 1.2 (1.01 - 1.6)
No (n=3606) 1 1
Table 3.28: Age and Sex-Adjusted Association between Biological Parameters and eGFR and Suspected CKDu
Parameter eGFR Suspected CKDu
Age & Sex adjusted Coefficient
(95% CI) Age & Sex adjusted OR (95% CI)
BMI (n=4461) 0.01 (-0.10 - 0.12) 0.9 (0.9 - 1.0)
Body fat % (n=4460) 0.12 (0.04 - 0.19) 0.9 (0.9 - 1.0)
Body water % (n=4417) -0.2 (-0.3 - -0.1) 1.01 (1.01 - 1.04)
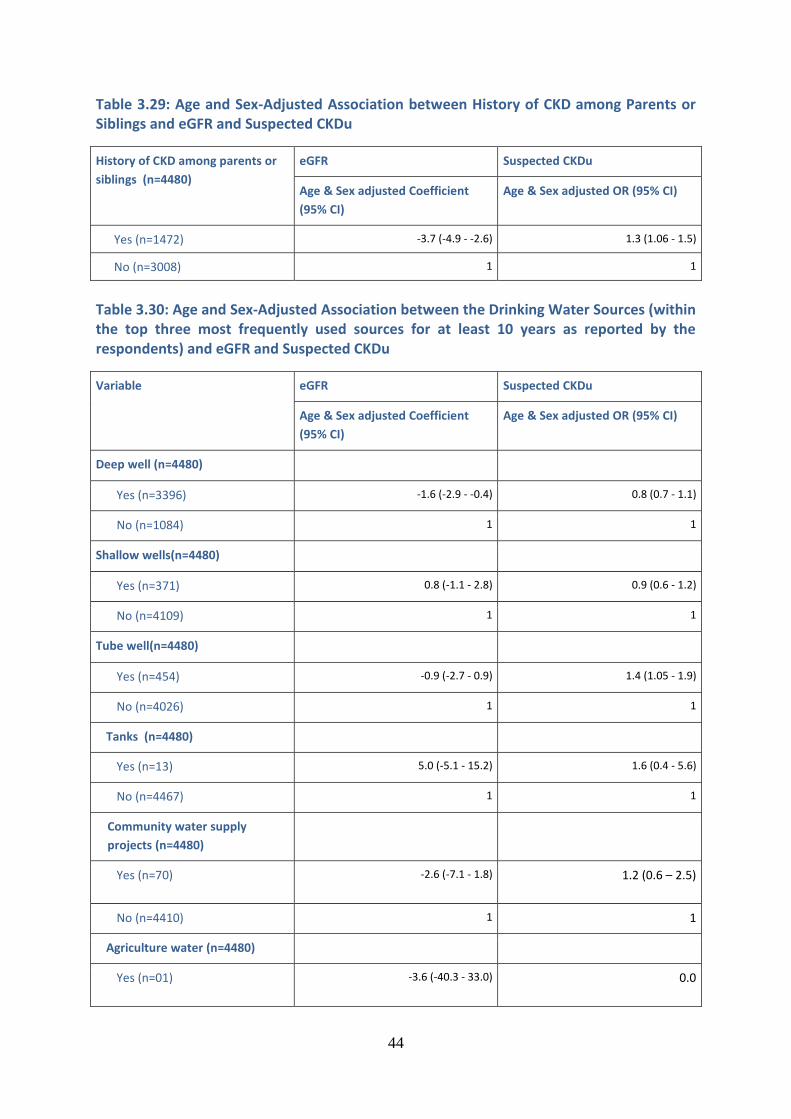
44
Table 3.29: Age and Sex-Adjusted Association between History of CKD among Parents or Siblings and eGFR and Suspected CKDu
History of CKD among parents or
siblings (n=4480) eGFR Suspected CKDu
Age & Sex adjusted Coefficient
(95% CI) Age & Sex adjusted OR (95% CI)
Yes (n=1472) -3.7 (-4.9 - -2.6) 1.3 (1.06 - 1.5)
No (n=3008) 1 1
Table 3.30: Age and Sex-Adjusted Association between the Drinking Water Sources (within the top three most frequently used sources for at least 10 years as reported by the respondents) and eGFR and Suspected CKDu
Variable eGFR Suspected CKDu
Age & Sex adjusted Coefficient
(95% CI) Age & Sex adjusted OR (95% CI)
Deep well (n=4480)
Yes (n=3396) -1.6 (-2.9 - -0.4) 0.8 (0.7 - 1.1)
No (n=1084) 1 1
Shallow wells(n=4480)
Yes (n=371) 0.8 (-1.1 - 2.8) 0.9 (0.6 - 1.2)
No (n=4109) 1 1
Tube well(n=4480)
Yes (n=454) -0.9 (-2.7 - 0.9) 1.4 (1.05 - 1.9)
No (n=4026) 1 1
Tanks (n=4480)
Yes (n=13) 5.0 (-5.1 - 15.2) 1.6 (0.4 - 5.6)
No (n=4467) 1 1
Community water supply
projects (n=4480)
Yes (n=70) -2.6 (-7.1 - 1.8)
1.2 (0.6 – 2.5)
No (n=4410) 1 1
Agriculture water (n=4480)
Yes (n=01) -3.6 (-40.3 - 33.0)
0.0
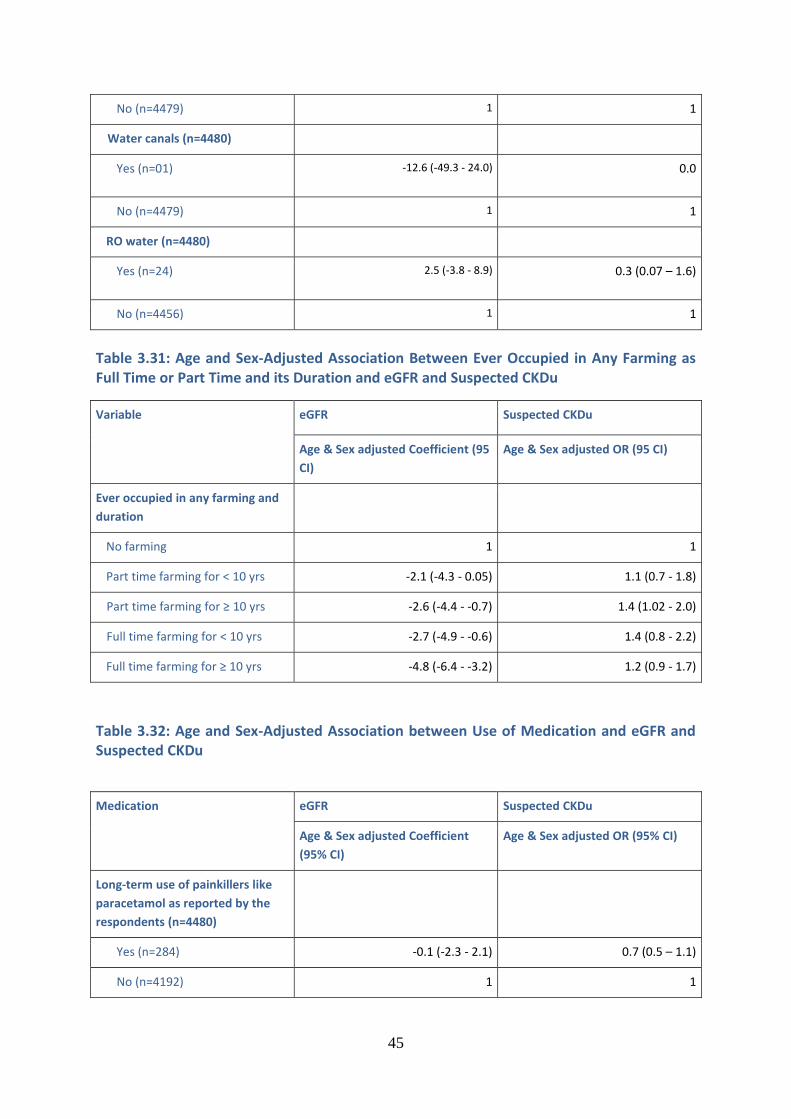
45
No (n=4479) 1 1
Water canals (n=4480)
Yes (n=01) -12.6 (-49.3 - 24.0)
0.0
No (n=4479) 1 1
RO water (n=4480)
Yes (n=24) 2.5 (-3.8 - 8.9)
0.3 (0.07 – 1.6)
No (n=4456) 1 1
Table 3.31: Age and Sex-Adjusted Association Between Ever Occupied in Any Farming as Full Time or Part Time and its Duration and eGFR and Suspected CKDu
Variable eGFR Suspected CKDu
Age & Sex adjusted Coefficient (95
CI) Age & Sex adjusted OR (95 CI)
Ever occupied in any farming and
duration
No farming 1 1
Part time farming for < 10 yrs -2.1 (-4.3 - 0.05) 1.1 (0.7 - 1.8)
Part time farming for ≥ 10 yrs -2.6 (-4.4 - -0.7) 1.4 (1.02 - 2.0)
Full time farming for < 10 yrs -2.7 (-4.9 - -0.6) 1.4 (0.8 - 2.2)
Full time farming for ≥ 10 yrs -4.8 (-6.4 - -3.2) 1.2 (0.9 - 1.7)
Table 3.32: Age and Sex-Adjusted Association between Use of Medication and eGFR and Suspected CKDu
Medication eGFR Suspected CKDu
Age & Sex adjusted Coefficient
(95% CI) Age & Sex adjusted OR (95% CI)
Long-term use of painkillers like
paracetamol as reported by the
respondents (n=4480)
Yes (n=284) -0.1 (-2.3 - 2.1) 0.7 (0.5 – 1.1)
No (n=4192) 1 1
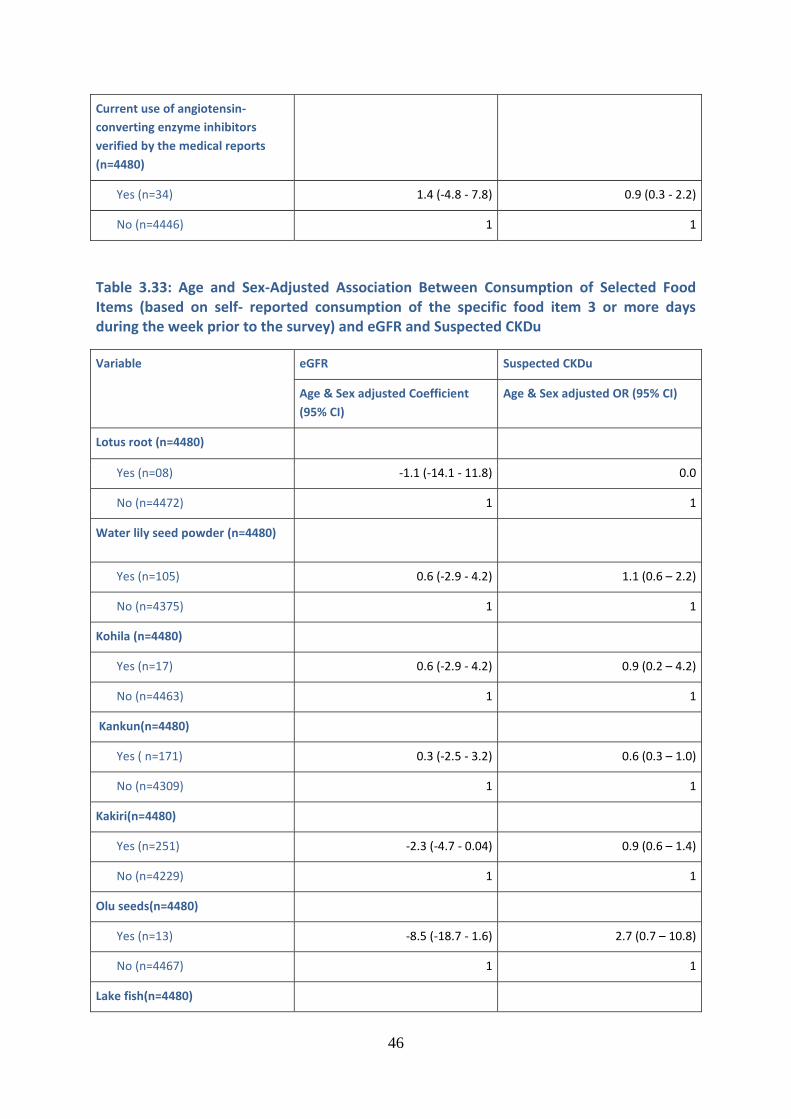
46
Current use of angiotensin-
converting enzyme inhibitors
verified by the medical reports
(n=4480)
Yes (n=34) 1.4 (-4.8 - 7.8) 0.9 (0.3 - 2.2)
No (n=4446) 1 1
Table 3.33: Age and Sex-Adjusted Association Between Consumption of Selected Food Items (based on self- reported consumption of the specific food item 3 or more days during the week prior to the survey) and eGFR and Suspected CKDu
Variable eGFR Suspected CKDu
Age & Sex adjusted Coefficient
(95% CI) Age & Sex adjusted OR (95% CI)
Lotus root (n=4480)
Yes (n=08) -1.1 (-14.1 - 11.8) 0.0
No (n=4472) 1 1
Water lily seed powder (n=4480)
Yes (n=105) 0.6 (-2.9 - 4.2) 1.1 (0.6 – 2.2)
No (n=4375) 1 1
Kohila (n=4480)
Yes (n=17) 0.6 (-2.9 - 4.2) 0.9 (0.2 – 4.2)
No (n=4463) 1 1
Kankun(n=4480)
Yes ( n=171) 0.3 (-2.5 - 3.2) 0.6 (0.3 – 1.0)
No (n=4309) 1 1
Kakiri(n=4480)
Yes (n=251) -2.3 (-4.7 - 0.04) 0.9 (0.6 – 1.4)
No (n=4229) 1 1
Olu seeds(n=4480)
Yes (n=13) -8.5 (-18.7 - 1.6) 2.7 (0.7 – 10.8)
No (n=4467) 1 1
Lake fish(n=4480)
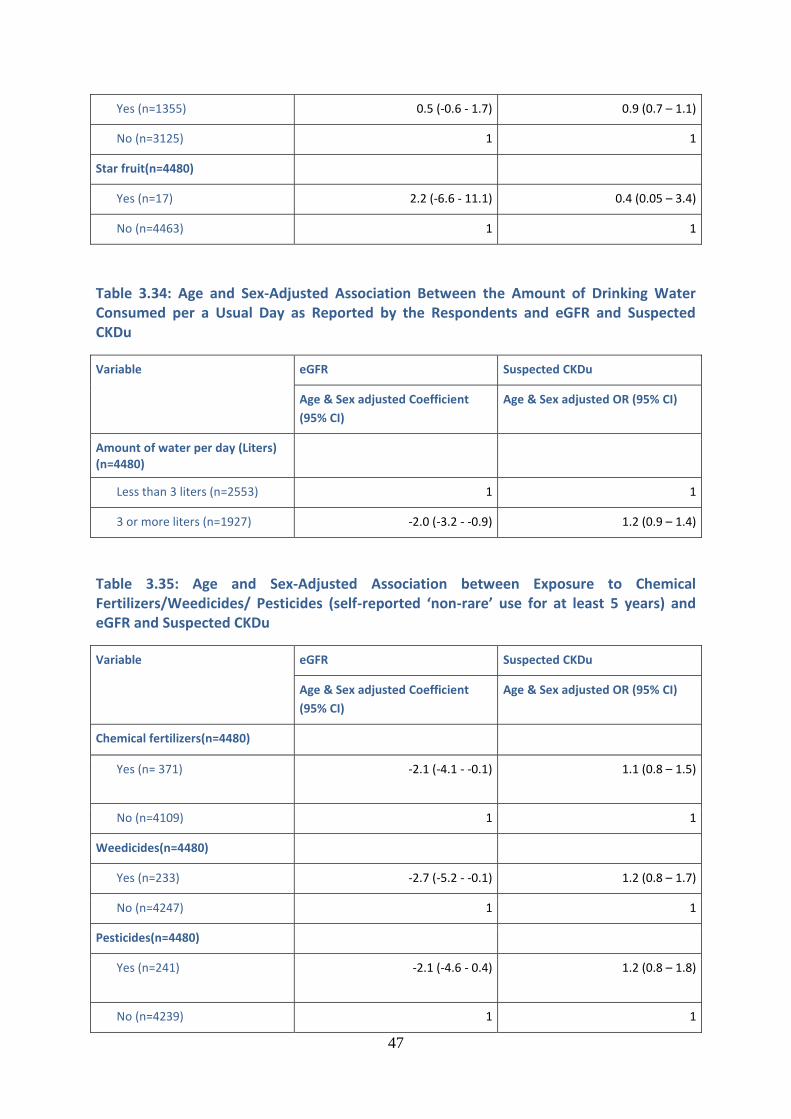
47
Yes (n=1355) 0.5 (-0.6 - 1.7) 0.9 (0.7 – 1.1)
No (n=3125) 1 1
Star fruit(n=4480)
Yes (n=17) 2.2 (-6.6 - 11.1) 0.4 (0.05 – 3.4)
No (n=4463) 1 1
Table 3.34: Age and Sex-Adjusted Association Between the Amount of Drinking Water Consumed per a Usual Day as Reported by the Respondents and eGFR and Suspected CKDu
Variable eGFR Suspected CKDu
Age & Sex adjusted Coefficient
(95% CI) Age & Sex adjusted OR (95% CI)
Amount of water per day (Liters) (n=4480)
Less than 3 liters (n=2553) 1 1
3 or more liters (n=1927) -2.0 (-3.2 - -0.9) 1.2 (0.9 – 1.4)
Table 3.35: Age and Sex-Adjusted Association between Exposure to Chemical Fertilizers/Weedicides/ Pesticides (self-reported ‘non-rare’ use for at least 5 years) and eGFR and Suspected CKDu
Variable eGFR Suspected CKDu
Age & Sex adjusted Coefficient
(95% CI) Age & Sex adjusted OR (95% CI)
Chemical fertilizers(n=4480)
Yes (n= 371) -2.1 (-4.1 - -0.1)
1.1 (0.8 – 1.5)
No (n=4109) 1 1
Weedicides(n=4480)
Yes (n=233) -2.7 (-5.2 - -0.1) 1.2 (0.8 – 1.7)
No (n=4247) 1 1
Pesticides(n=4480)
Yes (n=241) -2.1 (-4.6 - 0.4)
1.2 (0.8 – 1.8)
No (n=4239) 1 1
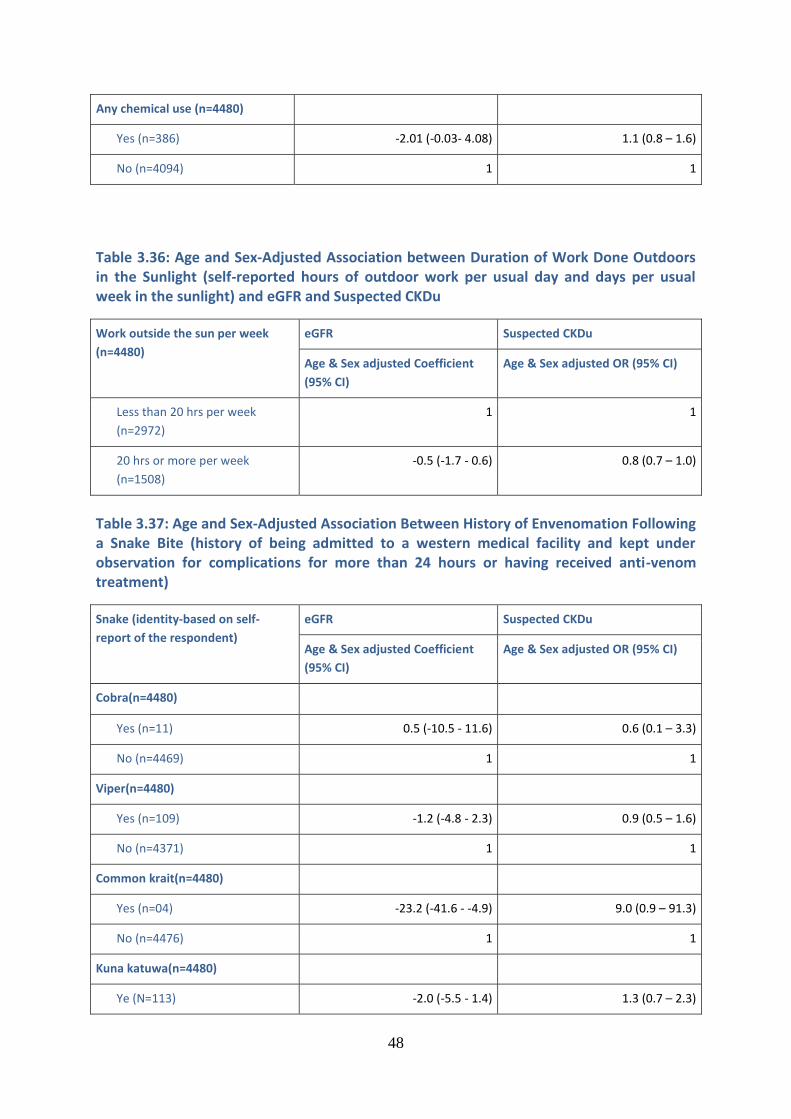
48
Any chemical use (n=4480)
Yes (n=386) -2.01 (-0.03- 4.08) 1.1 (0.8 – 1.6)
No (n=4094) 1 1
Table 3.36: Age and Sex-Adjusted Association between Duration of Work Done Outdoors in the Sunlight (self-reported hours of outdoor work per usual day and days per usual week in the sunlight) and eGFR and Suspected CKDu
Work outside the sun per week
(n=4480) eGFR Suspected CKDu
Age & Sex adjusted Coefficient
(95% CI) Age & Sex adjusted OR (95% CI)
Less than 20 hrs per week
(n=2972) 1 1
20 hrs or more per week
(n=1508) -0.5 (-1.7 - 0.6) 0.8 (0.7 – 1.0)
Table 3.37: Age and Sex-Adjusted Association Between History of Envenomation Following a Snake Bite (history of being admitted to a western medical facility and kept under observation for complications for more than 24 hours or having received anti-venom treatment)
Snake (identity-based on self-
report of the respondent) eGFR Suspected CKDu
Age & Sex adjusted Coefficient
(95% CI) Age & Sex adjusted OR (95% CI)
Cobra(n=4480)
Yes (n=11) 0.5 (-10.5 - 11.6) 0.6 (0.1 – 3.3)
No (n=4469) 1 1
Viper(n=4480)
Yes (n=109) -1.2 (-4.8 - 2.3) 0.9 (0.5 – 1.6)
No (n=4371) 1 1
Common krait(n=4480)
Yes (n=04) -23.2 (-41.6 - -4.9) 9.0 (0.9 – 91.3)
No (n=4476) 1 1
Kuna katuwa(n=4480)
Ye (N=113) -2.0 (-5.5 - 1.4) 1.3 (0.7 – 2.3)
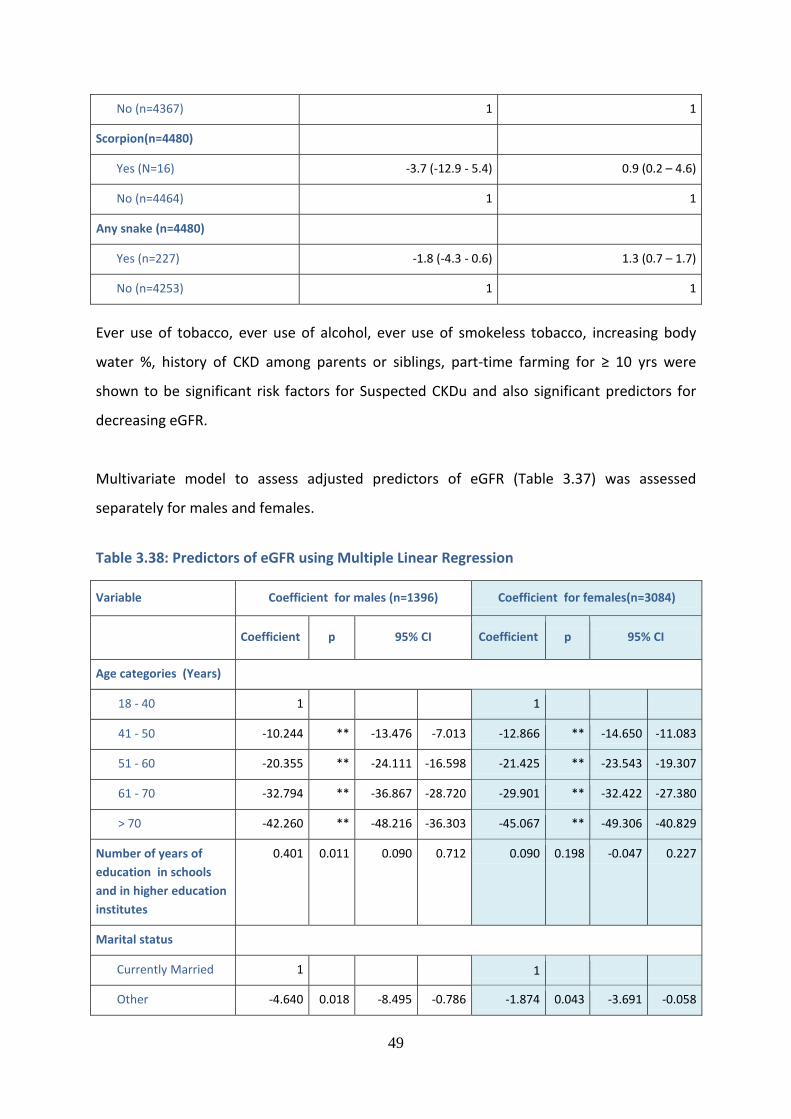
49
No (n=4367) 1 1
Scorpion(n=4480)
Yes (N=16) -3.7 (-12.9 - 5.4) 0.9 (0.2 – 4.6)
No (n=4464) 1 1
Any snake (n=4480)
Yes (n=227) -1.8 (-4.3 - 0.6) 1.3 (0.7 – 1.7)
No (n=4253) 1 1
Ever use of tobacco, ever use of alcohol, ever use of smokeless tobacco, increasing body
water %, history of CKD among parents or siblings, part-time farming for ≥ 10 yrs were
shown to be significant risk factors for Suspected CKDu and also significant predictors for
decreasing eGFR.
Multivariate model to assess adjusted predictors of eGFR (Table 3.37) was assessed
separately for males and females.
Table 3.38: Predictors of eGFR using Multiple Linear Regression
Variable Coefficient for males (n=1396) Coefficient for females(n=3084)
Coefficient p 95% CI Coefficient p 95% CI
Age categories (Years)
18 - 40 1 1
41 - 50 -10.244 ** -13.476 -7.013 -12.866 ** -14.650 -11.083
51 - 60 -20.355 ** -24.111 -16.598 -21.425 ** -23.543 -19.307
61 - 70 -32.794 ** -36.867 -28.720 -29.901 ** -32.422 -27.380
> 70 -42.260 ** -48.216 -36.303 -45.067 ** -49.306 -40.829
Number of years of
education in schools
and in higher education
institutes
0.401 0.011 0.090 0.712 0.090 0.198 -0.047 0.227
Marital status
Currently Married 1 1
Other -4.640 0.018 -8.495 -0.786 -1.874 0.043 -3.691 -0.058
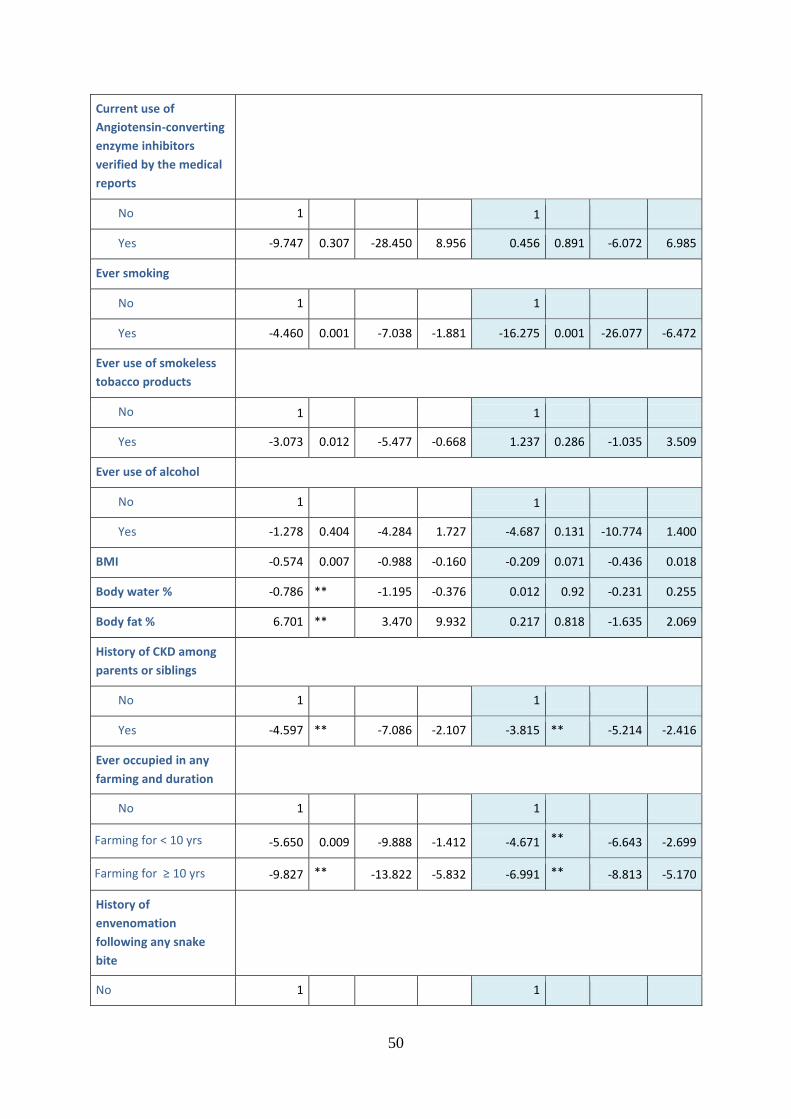
50
Current use of
Angiotensin-converting
enzyme inhibitors
verified by the medical
reports
No 1 1
Yes -9.747 0.307 -28.450 8.956 0.456 0.891 -6.072 6.985
Ever smoking
No 1 1
Yes -4.460 0.001 -7.038 -1.881 -16.275 0.001 -26.077 -6.472
Ever use of smokeless
tobacco products
No 1 1
Yes -3.073 0.012 -5.477 -0.668 1.237 0.286 -1.035 3.509
Ever use of alcohol
No 1 1
Yes -1.278 0.404 -4.284 1.727 -4.687 0.131 -10.774 1.400
BMI -0.574 0.007 -0.988 -0.160 -0.209 0.071 -0.436 0.018
Body water % -0.786 ** -1.195 -0.376 0.012 0.92 -0.231 0.255
Body fat % 6.701 ** 3.470 9.932 0.217 0.818 -1.635 2.069
History of CKD among
parents or siblings
No 1 1
Yes -4.597 ** -7.086 -2.107 -3.815 ** -5.214 -2.416
Ever occupied in any
farming and duration
**
No 1 1
Farming for < 10 yrs -5.650 0.009 -9.888 -1.412 -4.671 ** -6.643 -2.699
Farming for ≥ 10 yrs -9.827 ** -13.822 -5.832 -6.991 ** -8.813 -5.170
History of
envenomation
following any snake
bite
No 1 1
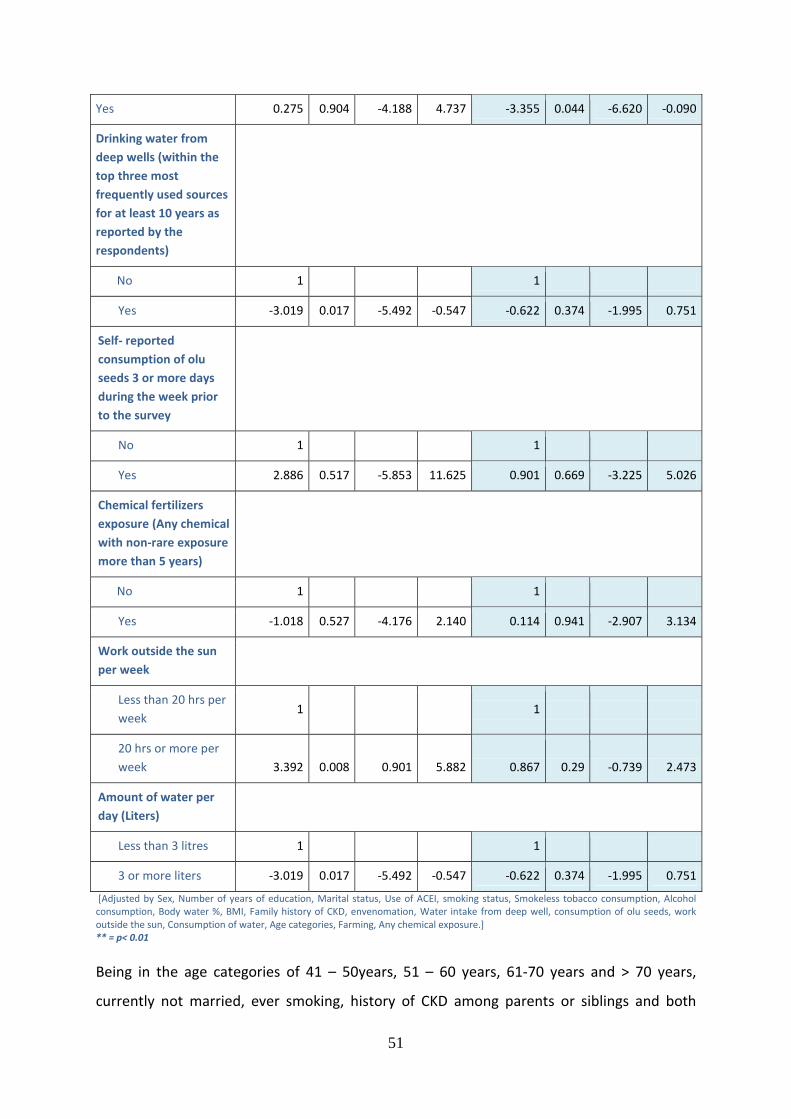
51
Yes 0.275 0.904 -4.188 4.737 -3.355 0.044 -6.620 -0.090
Drinking water from
deep wells (within the
top three most
frequently used sources
for at least 10 years as
reported by the
respondents)
No 1 1
Yes -3.019 0.017 -5.492 -0.547 -0.622 0.374 -1.995 0.751
Self- reported
consumption of olu
seeds 3 or more days
during the week prior
to the survey
No 1 1
Yes 2.886 0.517 -5.853 11.625 0.901 0.669 -3.225 5.026
Chemical fertilizers
exposure (Any chemical
with non-rare exposure
more than 5 years)
No 1 1
Yes -1.018 0.527 -4.176 2.140 0.114 0.941 -2.907 3.134
Work outside the sun
per week
Less than 20 hrs per
week 1 1
20 hrs or more per
week 3.392 0.008 0.901 5.882 0.867 0.29 -0.739 2.473
Amount of water per
day (Liters)
Less than 3 litres 1 1
3 or more liters -3.019 0.017 -5.492 -0.547 -0.622 0.374 -1.995 0.751
[Adjusted by Sex, Number of years of education, Marital status, Use of ACEI, smoking status, Smokeless tobacco consumption, Alcohol consumption, Body water %, BMI, Family history of CKD, envenomation, Water intake from deep well, consumption of olu seeds, work outside the sun, Consumption of water, Age categories, Farming, Any chemical exposure.] ** = p< 0.01
Being in the age categories of 41 – 50years, 51 – 60 years, 61-70 years and > 70 years,
currently not married, ever smoking, history of CKD among parents or siblings and both
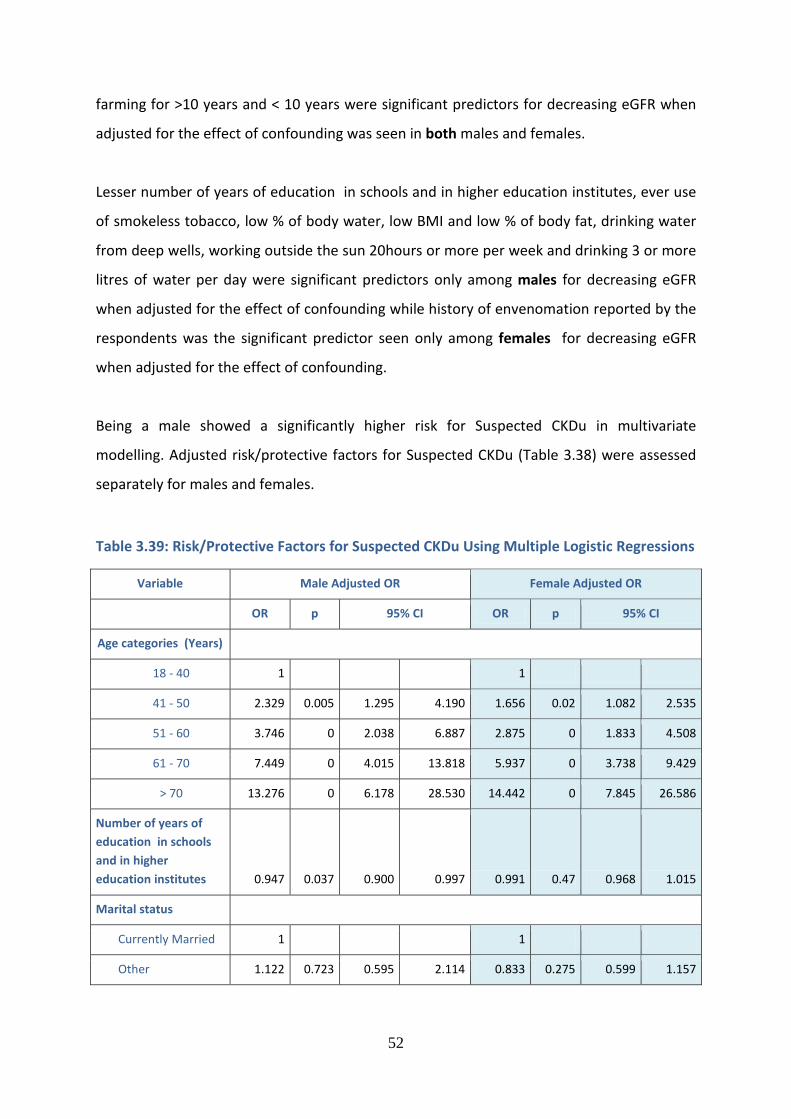
52
farming for >10 years and < 10 years were significant predictors for decreasing eGFR when
adjusted for the effect of confounding was seen in both males and females.
Lesser number of years of education in schools and in higher education institutes, ever use
of smokeless tobacco, low % of body water, low BMI and low % of body fat, drinking water
from deep wells, working outside the sun 20hours or more per week and drinking 3 or more
litres of water per day were significant predictors only among males for decreasing eGFR
when adjusted for the effect of confounding while history of envenomation reported by the
respondents was the significant predictor seen only among females for decreasing eGFR
when adjusted for the effect of confounding.
Being a male showed a significantly higher risk for Suspected CKDu in multivariate
modelling. Adjusted risk/protective factors for Suspected CKDu (Table 3.38) were assessed
separately for males and females.
Table 3.39: Risk/Protective Factors for Suspected CKDu Using Multiple Logistic Regressions
Variable Male Adjusted OR Female Adjusted OR
OR p 95% CI OR p 95% CI
Age categories (Years)
18 - 40 1 1
41 - 50 2.329 0.005 1.295 4.190 1.656 0.02 1.082 2.535
51 - 60 3.746 0 2.038 6.887 2.875 0 1.833 4.508
61 - 70 7.449 0 4.015 13.818 5.937 0 3.738 9.429
> 70 13.276 0 6.178 28.530 14.442 0 7.845 26.586
Number of years of
education in schools
and in higher
education institutes 0.947 0.037 0.900 0.997 0.991 0.47 0.968 1.015
Marital status
Currently Married 1 1
Other 1.122 0.723 0.595 2.114 0.833 0.275 0.599 1.157
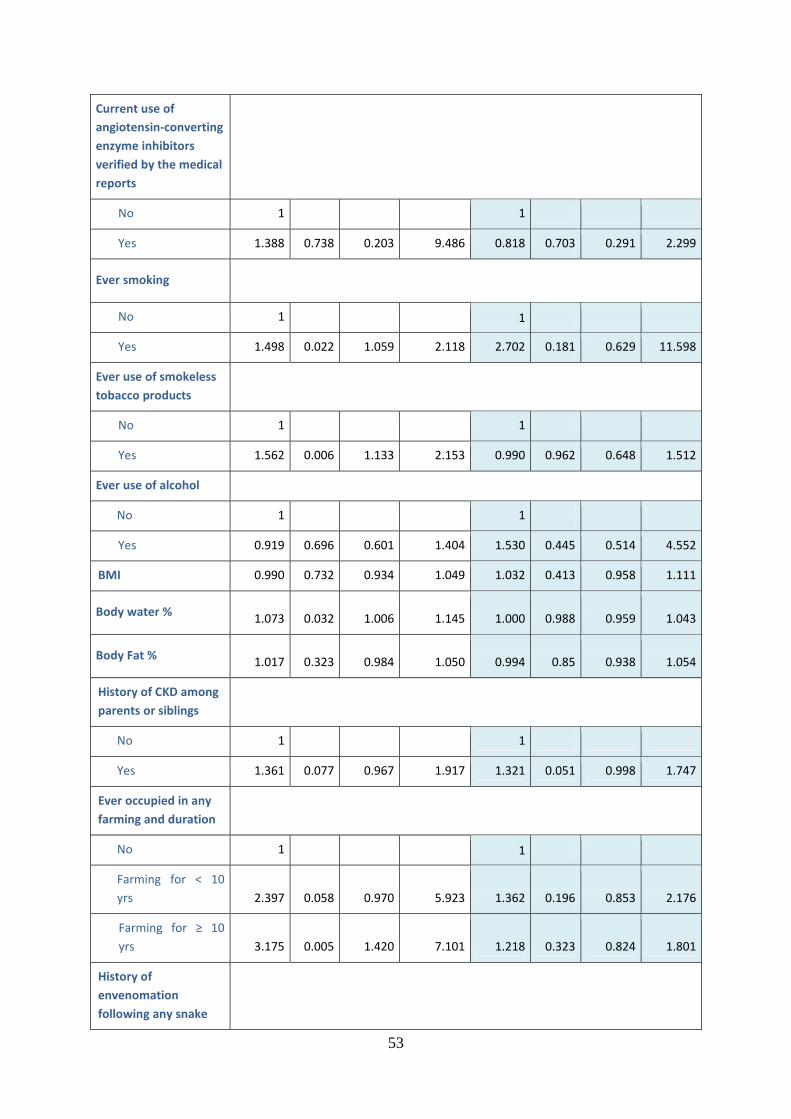
53
Current use of
angiotensin-converting
enzyme inhibitors
verified by the medical
reports
No 1 1
Yes 1.388 0.738 0.203 9.486 0.818 0.703 0.291 2.299
Ever smoking
No 1 1
Yes 1.498 0.022 1.059 2.118 2.702 0.181 0.629 11.598
Ever use of smokeless
tobacco products
No 1 1
Yes 1.562 0.006 1.133 2.153 0.990 0.962 0.648 1.512
Ever use of alcohol
No 1 1
Yes 0.919 0.696 0.601 1.404 1.530 0.445 0.514 4.552
BMI 0.990 0.732 0.934 1.049 1.032 0.413 0.958 1.111
Body water % 1.073 0.032 1.006 1.145 1.000 0.988 0.959 1.043
Body Fat % 1.017 0.323 0.984 1.050 0.994 0.85 0.938 1.054
History of CKD among
parents or siblings
No 1 1
Yes 1.361 0.077 0.967 1.917 1.321 0.051 0.998 1.747
Ever occupied in any
farming and duration
No 1 1
Farming for < 10
yrs 2.397 0.058 0.970 5.923 1.362 0.196 0.853 2.176
Farming for ≥ 10
yrs 3.175 0.005 1.420 7.101 1.218 0.323 0.824 1.801
History of
envenomation
following any snake
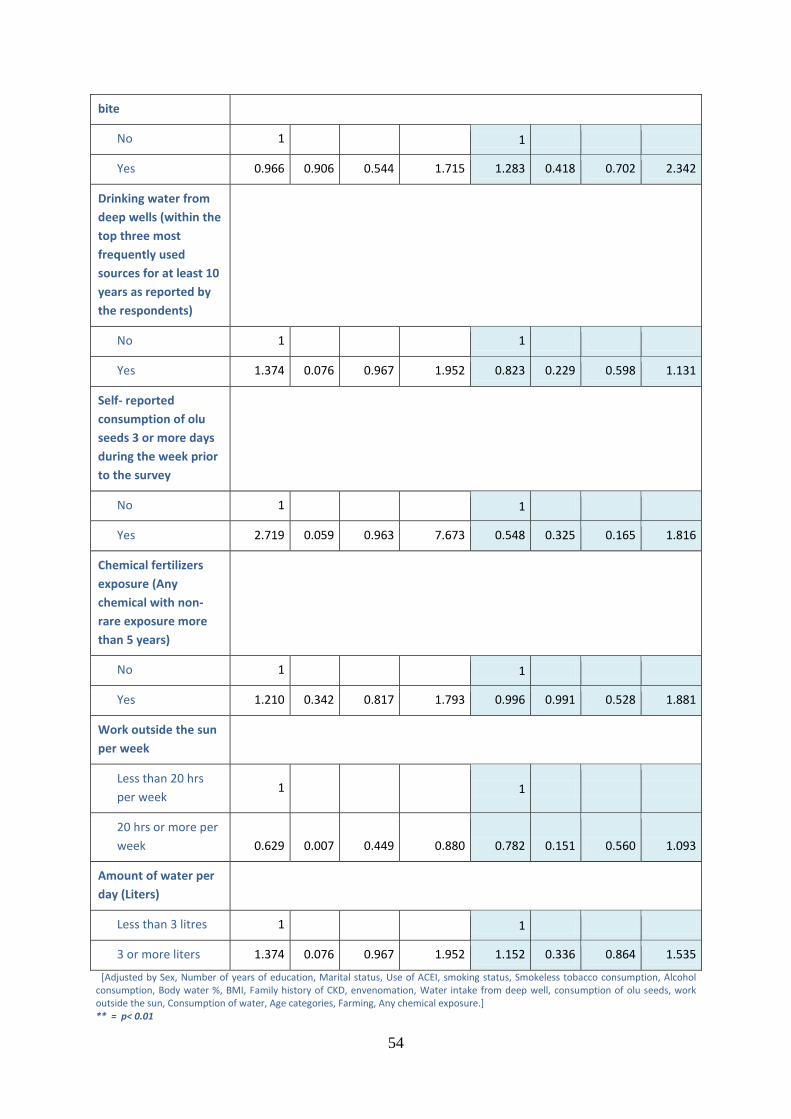
54
bite
No 1 1
Yes 0.966 0.906 0.544 1.715 1.283 0.418 0.702 2.342
Drinking water from
deep wells (within the
top three most
frequently used
sources for at least 10
years as reported by
the respondents)
No 1 1
Yes 1.374 0.076 0.967 1.952 0.823 0.229 0.598 1.131
Self- reported
consumption of olu
seeds 3 or more days
during the week prior
to the survey
No 1 1
Yes 2.719 0.059 0.963 7.673 0.548 0.325 0.165 1.816
Chemical fertilizers
exposure (Any
chemical with non-
rare exposure more
than 5 years)
No 1 1
Yes 1.210 0.342 0.817 1.793 0.996 0.991 0.528 1.881
Work outside the sun
per week
Less than 20 hrs
per week 1 1
20 hrs or more per
week 0.629 0.007 0.449 0.880 0.782 0.151 0.560 1.093
Amount of water per
day (Liters)
Less than 3 litres 1 1
3 or more liters 1.374 0.076 0.967 1.952 1.152 0.336 0.864 1.535
[Adjusted by Sex, Number of years of education, Marital status, Use of ACEI, smoking status, Smokeless tobacco consumption, Alcohol consumption, Body water %, BMI, Family history of CKD, envenomation, Water intake from deep well, consumption of olu seeds, work outside the sun, Consumption of water, Age categories, Farming, Any chemical exposure.] ** = p< 0.01
55
Being in the age categories of 41-50 years, 51-60 years, 61-70 years and > 70 years was a
significant risk factor for Suspected CKDu when adjusted for the effect of confounding in
both the sexes.
Lesser number of years of education in schools and in higher education institutes, ever
smoking, ever use of smokeless tobacco, high body water %, farming for ≥ 10 years and
working outside the sun 20 hours or more per week were risk factors for Suspected CKDu
only among males when adjusted for the effect of confounding while none were found to
be the risk factors for Suspected CKDu only among females.
56
4 Conclusions
This is the first-ever study to use the three-level Sri Lankan operational case definition for
CKDu since its publication in 2016. The estimates of the prevalence of Suspected CKDu in
the study areas show that it is a considerable public health problem with an estimated
overall prevalence of suspected CKDu of 13.3%. This study has confirmed the male
preponderance of the disease, with the male prevalence being almost the twice that of the
females (males-19.9%; females 10.5%).
When hypertensives were excluded using the definition modified to capture all possible
hypertension (i.e. both probable and possible hypertension), as well as diabetes, the
prevalence of suspected CKDu dropped considerably from 13.3% to 9.5% (Males 14.2%;
Females- 7.5%).
The presence of essential screening criteria and a known cause for CKD as identified by the
present survey was considered as a proxy indicator for the prevalence of CKD with a known
cause in the present study. The prevalence for CKD with a known cause, defined in this
manner was 6.7% (Male – 8.6%, Female – 5.8%), although it should be acknowledged that
onetime assessment of essential screening criteria is inadequate to confirm CKD. Overall;
we found that the prevalence of CKD with a known cause among males and females were
approximately half that of Suspected CKDu.
Out of the all five study areas “Puhudivula” (area 4) showed a statistically significant low
level of mean eGFR compared to others. However, the mean eGFR levels of males in all five
areas were similar. In three out of five areas the males showed significantly lower mean
eGFR compared to females in the same areas.
The survey identified several modifiable and non-modifiable risk factors for Suspected CKDu.
Being a male showed a significantly higher risk for Suspected CKDu. Being in the age
categories of 41-50 years, 51-60 years, 61-70 years and > 70 years was a significant risk
factor for Suspected CKDu when adjusted for the effect of confounding in both the sexes.
57
Lesser number of years of education in schools and in higher education institutes, ever
smoking, ever use of smokeless tobacco, high body water %, farming for ≥ 10 years and
working outside the sun 20 hours or more per week were risk factors for Suspected CKDu
only among males when adjusted for the effect of confounding while none were found to be
the risk factors for Suspected CKDu only among females.
The environmental exposures and occupational related factors studied in the present survey
were based on self-reports and were proxy measures. Overall, farming was the main
occupational/environmental risk factor for Suspected CKDu. Particular exposures associated
with farming (e.g. pesticide exposure, heat exposure) did not appear to explain the
increased risk from farming, but the available exposure information was limited, and these
findings may change when better exposure data are obtained.
It should be noted that the present study adopted a cross-sectional design which does not
allow the examination of the temporal relationship between the identified significant
risk/protective factors and the Suspected CKDu status.
58
5 Recommendations We recommend further surveys in other districts of the country using the same protocol to
estimate the prevalence of Suspected CKDu to better understand the burden and
distribution of the problem.
The modifiable risk factors identified in this study are recommended to be used in the
ongoing primary or secondary preventive activities. This study provides an additional ‘fact’
to be emphasized in advocacy and communication efforts of tobacco control.
The environmental exposures and occupational related factors studied in the present survey
were based on self-reports and were proxy measures and the cross-sectional design used
precluded assessment of the temporal relationship of the identified risk factors. Thus, it is
recommended that a prospective cohort study is conducted using quantitative
measurements of environmental exposures including agrochemical residues, weedicides
and pesticides, heat exposure, heavy metals in water, and infections.
59
6 References Caplin B, Jacobson K, Glaser J, Nitsch D, Jha V, Singh A, Correa-Rotter R, Pearce N.
International Collaboration for the Epidemiology of eGFR in Low and Middle-Income
Populations - Rationale and core protocol for the Disadvantaged Populations eGFR
Epidemiology Study (DEGREE). BMC Nephrology201718:1. https://doi.org/10.1186/s12882-
016-0417-1
Department of Census and Statistics, Sri Lanka, Population Census 2012
Department of Census and Statistics, Sri Lanka, National Survey on Self-reported Health in
Sri Lanka 2014
Ministry of Health and Indigenous Medicine, 2015. Non-communicable disease risk factor
survey.
60
7 Annexures Annexure i: The case definition of Chronic Kidney Disease of unknown aetiology (CKDu)
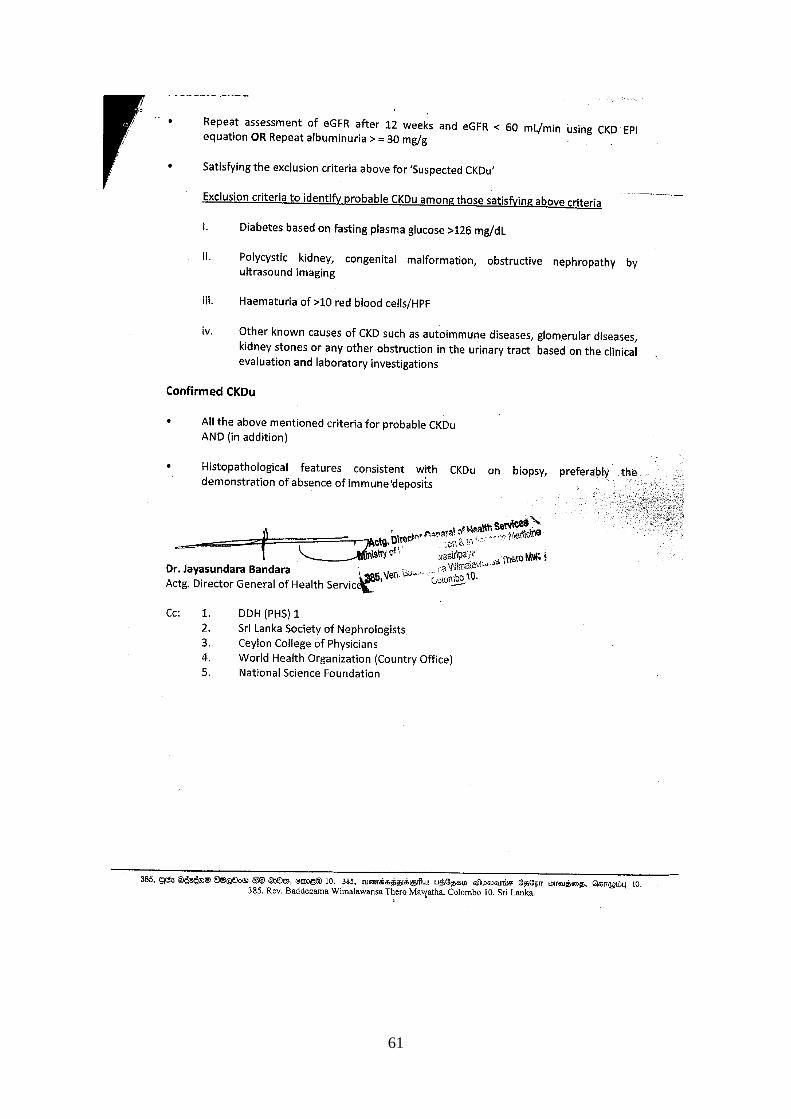
61
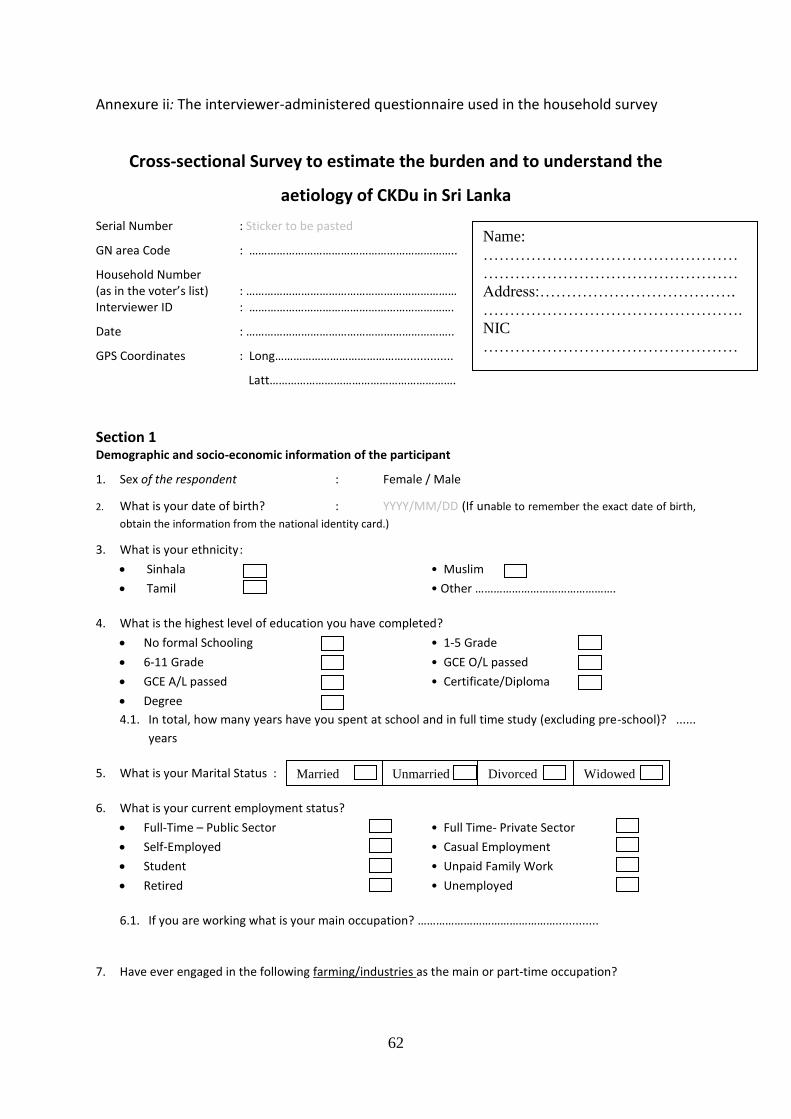
62
Annexure ii: The interviewer-administered questionnaire used in the household survey
Cross-sectional Survey to estimate the burden and to understand the
aetiology of CKDu in Sri Lanka
Serial Number : Sticker to be pasted
GN area Code : …………………………………………………………..
Household Number (as in the voter’s list) : …………………………………………………………… Interviewer ID : ………………………………………………………….
Date : …………………………………………………………..
GPS Coordinates : Long……………………………………...............
Latt…………………………………………………….
Section 1 Demographic and socio-economic information of the participant
1. Sex of the respondent : Female / Male
2. What is your date of birth? : YYYY/MM/DD (If unable to remember the exact date of birth,
obtain the information from the national identity card.)
3. What is your ethnicity :
Sinhala • Muslim
Tamil • Other ……………………………………….
4. What is the highest level of education you have completed?
No formal Schooling • 1-5 Grade
6-11 Grade • GCE O/L passed
GCE A/L passed • Certificate/Diploma
Degree
4.1. In total, how many years have you spent at school and in full time study (excluding pre-school)? ......
years
5. What is your Marital Status :
6. What is your current employment status?
Full-Time – Public Sector • Full Time- Private Sector
Self-Employed • Casual Employment
Student • Unpaid Family Work
Retired • Unemployed
6.1. If you are working what is your main occupation? ……………………………………….............
7. Have ever engaged in the following farming/industries as the main or part-time occupation?
Married Unmarried Divorced
Widowed
Name:
…………………………………………
…………………………………………
Address:……………………………….
………………………………………….
NIC
…………………………………………
………………
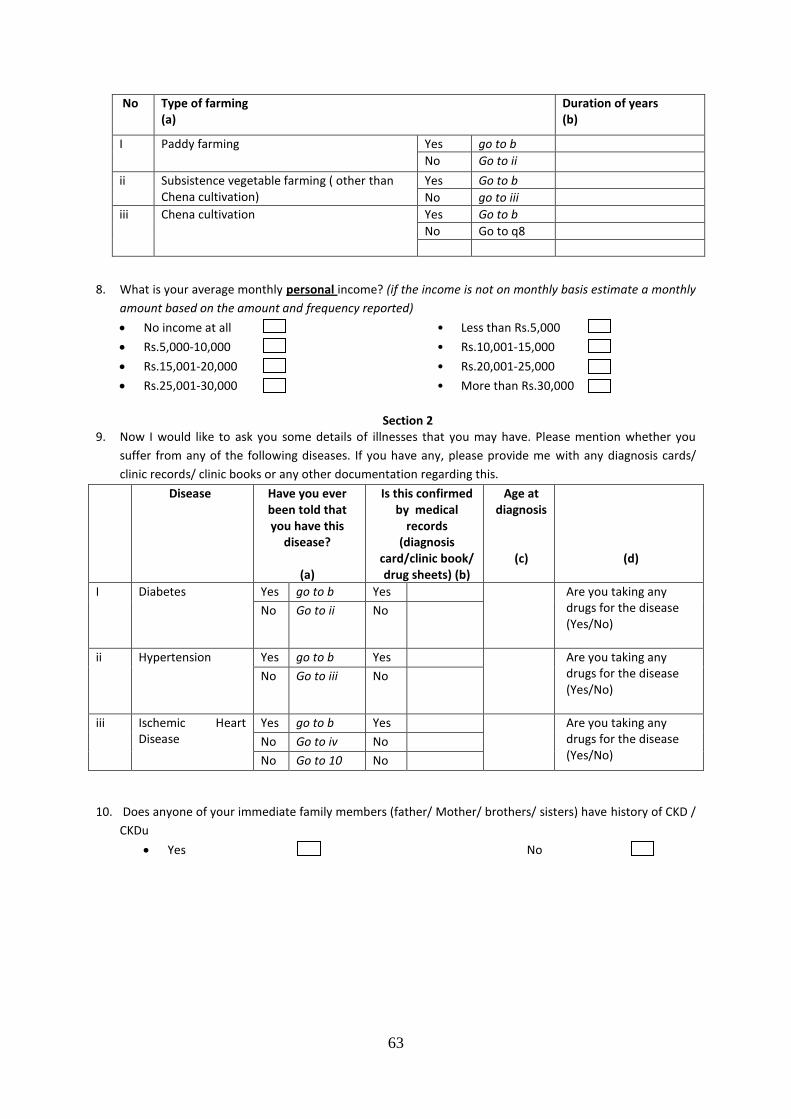
63
No Type of farming (a)
Duration of years (b)
I Paddy farming Yes go to b
No Go to ii
ii Subsistence vegetable farming ( other than Chena cultivation)
Yes Go to b
No go to iii
iii Chena cultivation Yes Go to b
No Go to q8
8. What is your average monthly personal income? (if the income is not on monthly basis estimate a monthly
amount based on the amount and frequency reported)
No income at all • Less than Rs.5,000
Rs.5,000-10,000 • Rs.10,001-15,000
Rs.15,001-20,000 • Rs.20,001-25,000
Rs.25,001-30,000 • More than Rs.30,000
Section 2
9. Now I would like to ask you some details of illnesses that you may have. Please mention whether you
suffer from any of the following diseases. If you have any, please provide me with any diagnosis cards/
clinic records/ clinic books or any other documentation regarding this.
Disease Have you ever been told that you have this
disease?
(a)
Is this confirmed by medical
records (diagnosis
card/clinic book/ drug sheets) (b)
Age at diagnosis
(c)
(d)
I Diabetes Yes go to b Yes Are you taking any drugs for the disease (Yes/No)
No Go to ii No
ii Hypertension Yes go to b Yes Are you taking any drugs for the disease (Yes/No)
No Go to iii No
iii Ischemic Heart Disease
Yes go to b Yes Are you taking any drugs for the disease (Yes/No)
No Go to iv No
No Go to 10 No
10. Does anyone of your immediate family members (father/ Mother/ brothers/ sisters) have history of CKD /
CKDu
Yes No
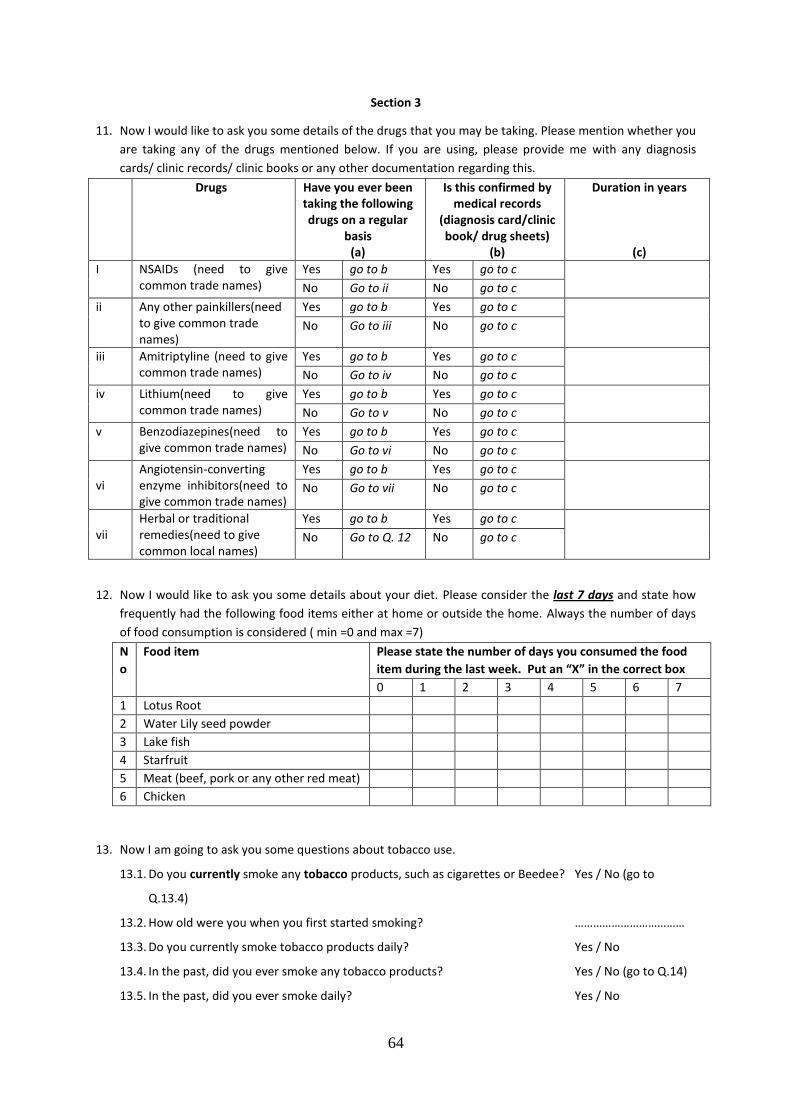
64
Section 3
11. Now I would like to ask you some details of the drugs that you may be taking. Please mention whether you
are taking any of the drugs mentioned below. If you are using, please provide me with any diagnosis
cards/ clinic records/ clinic books or any other documentation regarding this.
Drugs Have you ever been taking the following drugs on a regular
basis (a)
Is this confirmed by medical records
(diagnosis card/clinic book/ drug sheets)
(b)
Duration in years
(c)
I NSAIDs (need to give common trade names)
Yes go to b Yes go to c
No Go to ii No go to c
ii Any other painkillers(need to give common trade names)
Yes go to b Yes go to c
No Go to iii No go to c
iii Amitriptyline (need to give common trade names)
Yes go to b Yes go to c
No Go to iv No go to c
iv Lithium(need to give common trade names)
Yes go to b Yes go to c
No Go to v No go to c
v Benzodiazepines(need to give common trade names)
Yes go to b Yes go to c
No Go to vi No go to c
vi Angiotensin-converting enzyme inhibitors(need to give common trade names)
Yes go to b Yes go to c
No Go to vii No go to c
vii Herbal or traditional remedies(need to give common local names)
Yes go to b Yes go to c
No Go to Q. 12 No go to c
12. Now I would like to ask you some details about your diet. Please consider the last 7 days and state how
frequently had the following food items either at home or outside the home. Always the number of days
of food consumption is considered ( min =0 and max =7)
N
o
Food item Please state the number of days you consumed the food
item during the last week. Put an “X” in the correct box
0 1 2 3 4 5 6 7
1 Lotus Root
2 Water Lily seed powder
3 Lake fish
4 Starfruit
5 Meat (beef, pork or any other red meat)
6 Chicken
13. Now I am going to ask you some questions about tobacco use.
13.1. Do you currently smoke any tobacco products, such as cigarettes or Beedee? Yes / No (go to
Q.13.4)
13.2. How old were you when you first started smoking? ………………………………
13.3. Do you currently smoke tobacco products daily? Yes / No
13.4. In the past, did you ever smoke any tobacco products? Yes / No (go to Q.14)
13.5. In the past, did you ever smoke daily? Yes / No
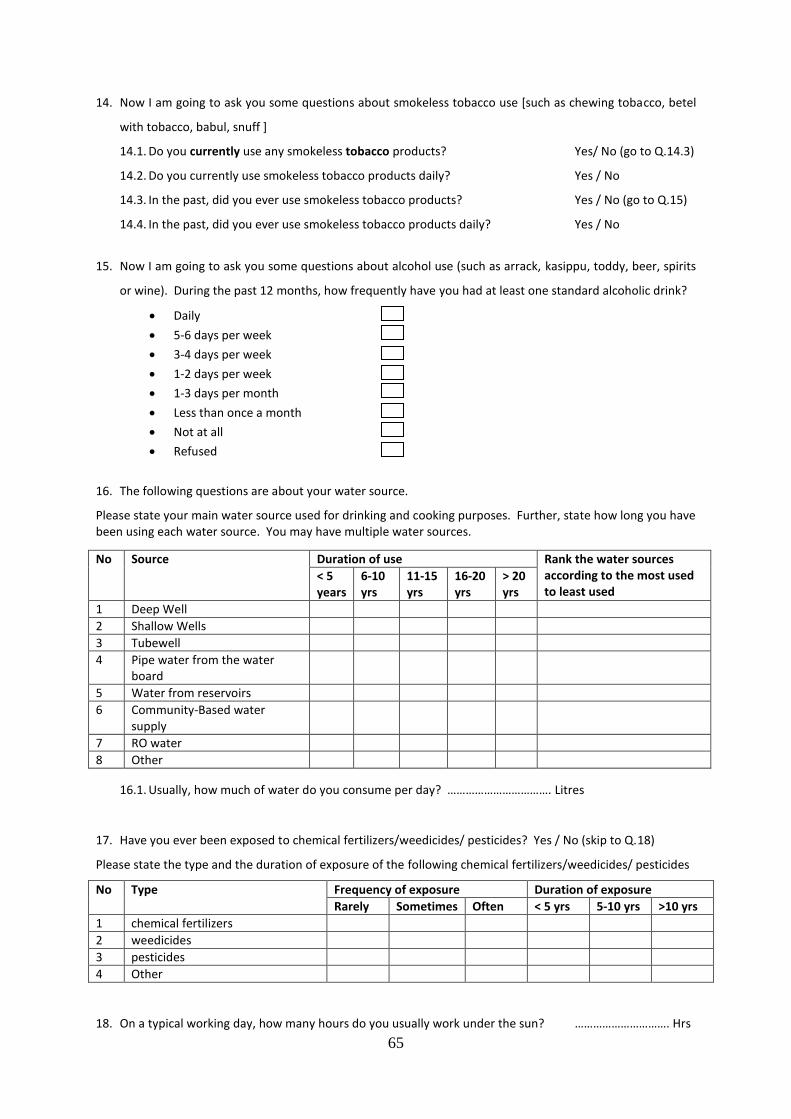
65
14. Now I am going to ask you some questions about smokeless tobacco use [such as chewing tobacco, betel
with tobacco, babul, snuff ]
14.1. Do you currently use any smokeless tobacco products? Yes/ No (go to Q.14.3)
14.2. Do you currently use smokeless tobacco products daily? Yes / No
14.3. In the past, did you ever use smokeless tobacco products? Yes / No (go to Q.15)
14.4. In the past, did you ever use smokeless tobacco products daily? Yes / No
15. Now I am going to ask you some questions about alcohol use (such as arrack, kasippu, toddy, beer, spirits
or wine). During the past 12 months, how frequently have you had at least one standard alcoholic drink?
Daily
5-6 days per week
3-4 days per week
1-2 days per week
1-3 days per month
Less than once a month
Not at all
Refused
16. The following questions are about your water source.
Please state your main water source used for drinking and cooking purposes. Further, state how long you have been using each water source. You may have multiple water sources.
No Source Duration of use Rank the water sources according to the most used to least used
< 5 years
6-10 yrs
11-15 yrs
16-20 yrs
> 20 yrs
1 Deep Well
2 Shallow Wells
3 Tubewell
4 Pipe water from the water board
5 Water from reservoirs
6 Community-Based water supply
7 RO water
8 Other
16.1. Usually, how much of water do you consume per day? ……………………………. Litres
17. Have you ever been exposed to chemical fertilizers/weedicides/ pesticides? Yes / No (skip to Q.18)
Please state the type and the duration of exposure of the following chemical fertilizers/weedicides/ pesticides
No Type Frequency of exposure Duration of exposure
Rarely Sometimes Often < 5 yrs 5-10 yrs >10 yrs
1 chemical fertilizers
2 weedicides
3 pesticides
4 Other
18. On a typical working day, how many hours do you usually work under the sun? …………………………. Hrs
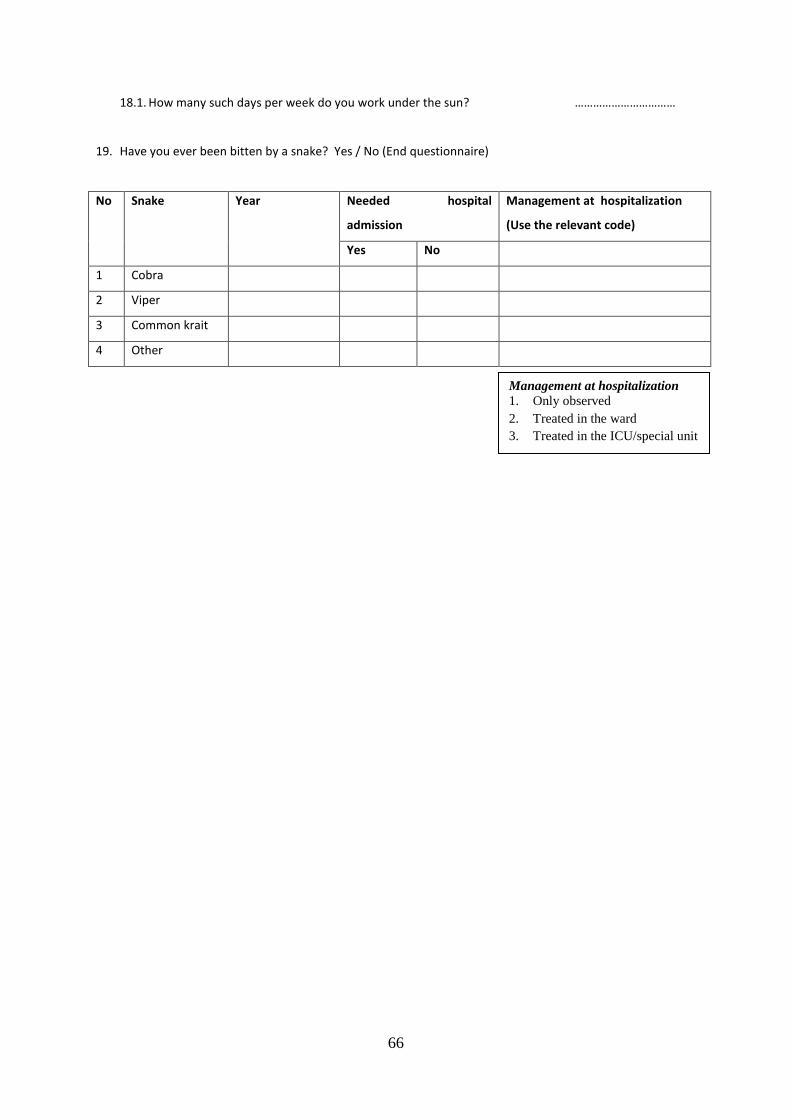
66
18.1. How many such days per week do you work under the sun? ……………………………
19. Have you ever been bitten by a snake? Yes / No (End questionnaire)
No Snake Year Needed hospital
admission
Management at hospitalization
(Use the relevant code)
Yes No
1 Cobra
2 Viper
3 Common krait
4 Other
Management at hospitalization
1. Only observed
2. Treated in the ward
3. Treated in the ICU/special unit
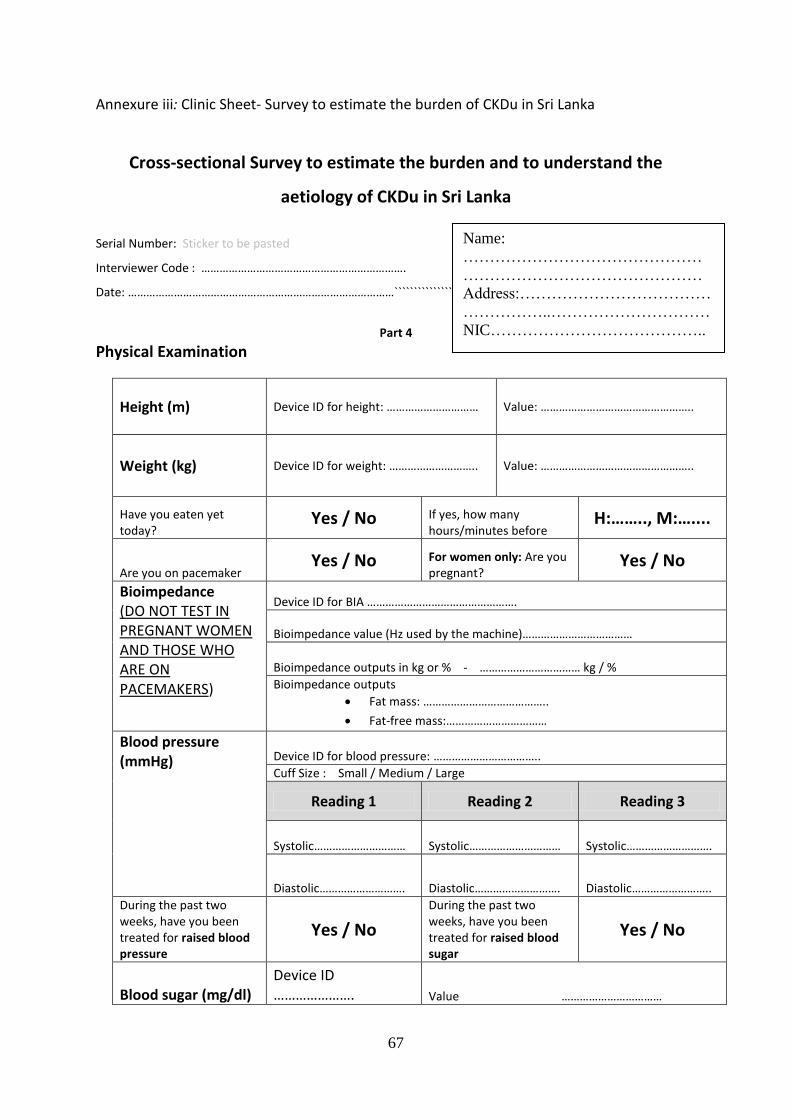
67
Annexure iii: Clinic Sheet- Survey to estimate the burden of CKDu in Sri Lanka
Cross-sectional Survey to estimate the burden and to understand the
aetiology of CKDu in Sri Lanka
Serial Number: Sticker to be pasted
Interviewer Code : ………………………………………………………….
Date: ……………………………………………………………………………```````````````*-**************
Part 4
Physical Examination
Height (m) Device ID for height: ………………………… Value: …………………………………………..
Weight (kg) Device ID for weight: ……………………….. Value: …………………………………………..
Have you eaten yet today?
Yes / No If yes, how many hours/minutes before
H:…….., M:…....
Are you on pacemaker Yes / No For women only: Are you
pregnant? Yes / No
Bioimpedance (DO NOT TEST IN PREGNANT WOMEN AND THOSE WHO ARE ON PACEMAKERS)
Device ID for BIA ………………………………………….
Bioimpedance value (Hz used by the machine)………………………………
Bioimpedance outputs in kg or % - …………………………… kg / %
Bioimpedance outputs
Fat mass: …………………………………..
Fat-free mass:……………………………
Blood pressure (mmHg)
Device ID for blood pressure: ……………………………..
Cuff Size : Small / Medium / Large
Reading 1 Reading 2 Reading 3
Systolic………………………… Systolic………………………… Systolic……………………….
Diastolic………………………. Diastolic………………………. Diastolic……………………..
During the past two weeks, have you been treated for raised blood pressure
Yes / No
During the past two weeks, have you been treated for raised blood sugar
Yes / No
Blood sugar (mg/dl)
Device ID …………………. Value ……………………………
Name:
………………………………………
………………………………………
Address:………………………………
……………..…………………………
NIC…………………………………..
……………..…………………………
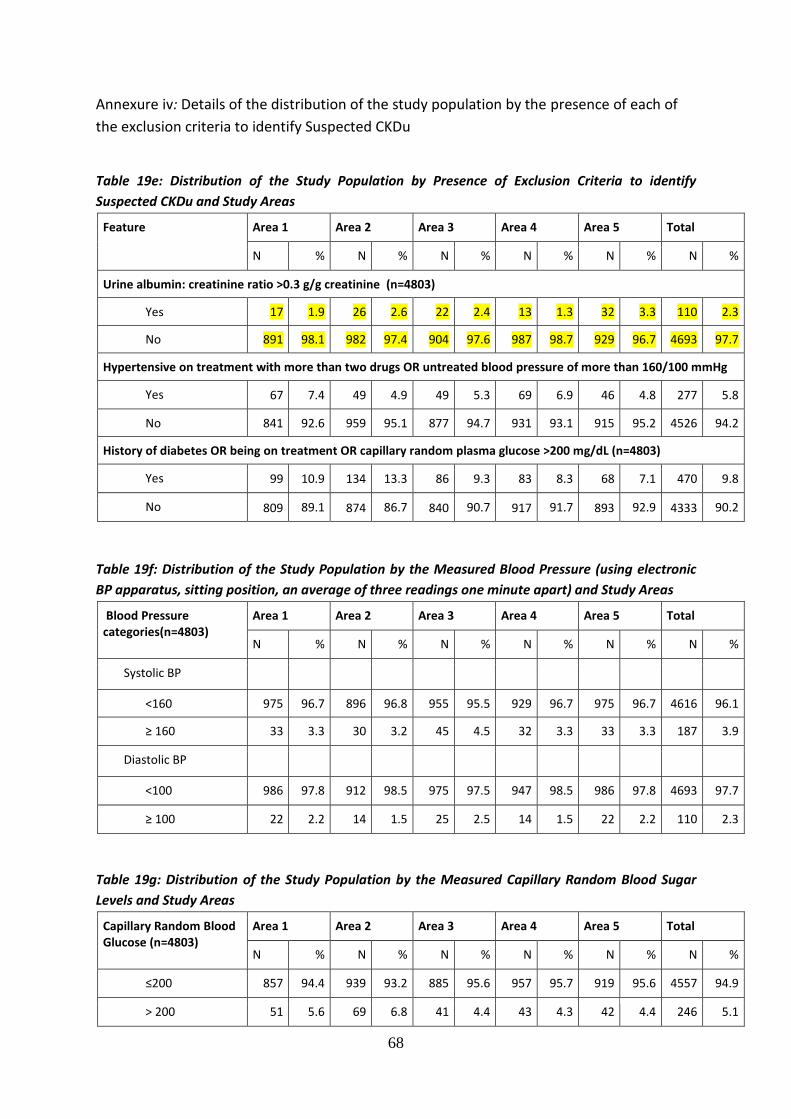
68
Annexure iv: Details of the distribution of the study population by the presence of each of
the exclusion criteria to identify Suspected CKDu
Table 19e: Distribution of the Study Population by Presence of Exclusion Criteria to identify
Suspected CKDu and Study Areas
Feature Area 1 Area 2 Area 3 Area 4 Area 5 Total
N % N % N % N % N % N %
Urine albumin: creatinine ratio >0.3 g/g creatinine (n=4803)
Yes 17 1.9 26 2.6 22 2.4 13 1.3 32 3.3 110 2.3
No 891 98.1 982 97.4 904 97.6 987 98.7 929 96.7 4693 97.7
Hypertensive on treatment with more than two drugs OR untreated blood pressure of more than 160/100 mmHg
Yes 67 7.4 49 4.9 49 5.3 69 6.9 46 4.8 277 5.8
No 841 92.6 959 95.1 877 94.7 931 93.1 915 95.2 4526 94.2
History of diabetes OR being on treatment OR capillary random plasma glucose >200 mg/dL (n=4803)
Yes 99 10.9 134 13.3 86 9.3 83 8.3 68 7.1 470 9.8
No 809 89.1 874 86.7 840 90.7 917 91.7 893 92.9 4333 90.2
Table 19f: Distribution of the Study Population by the Measured Blood Pressure (using electronic
BP apparatus, sitting position, an average of three readings one minute apart) and Study Areas
Blood Pressure categories(n=4803)
Area 1 Area 2 Area 3 Area 4 Area 5 Total
N % N % N % N % N % N %
Systolic BP
<160 975 96.7 896 96.8 955 95.5 929 96.7 975 96.7 4616 96.1
≥ 160 33 3.3 30 3.2 45 4.5 32 3.3 33 3.3 187 3.9
Diastolic BP
<100 986 97.8 912 98.5 975 97.5 947 98.5 986 97.8 4693 97.7
≥ 100 22 2.2 14 1.5 25 2.5 14 1.5 22 2.2 110 2.3
Table 19g: Distribution of the Study Population by the Measured Capillary Random Blood Sugar
Levels and Study Areas
Capillary Random Blood Glucose (n=4803)
Area 1 Area 2 Area 3 Area 4 Area 5 Total
N % N % N % N % N % N %
≤200 857 94.4 939 93.2 885 95.6 957 95.7 919 95.6 4557 94.9
> 200 51 5.6 69 6.8 41 4.4 43 4.3 42 4.4 246 5.1
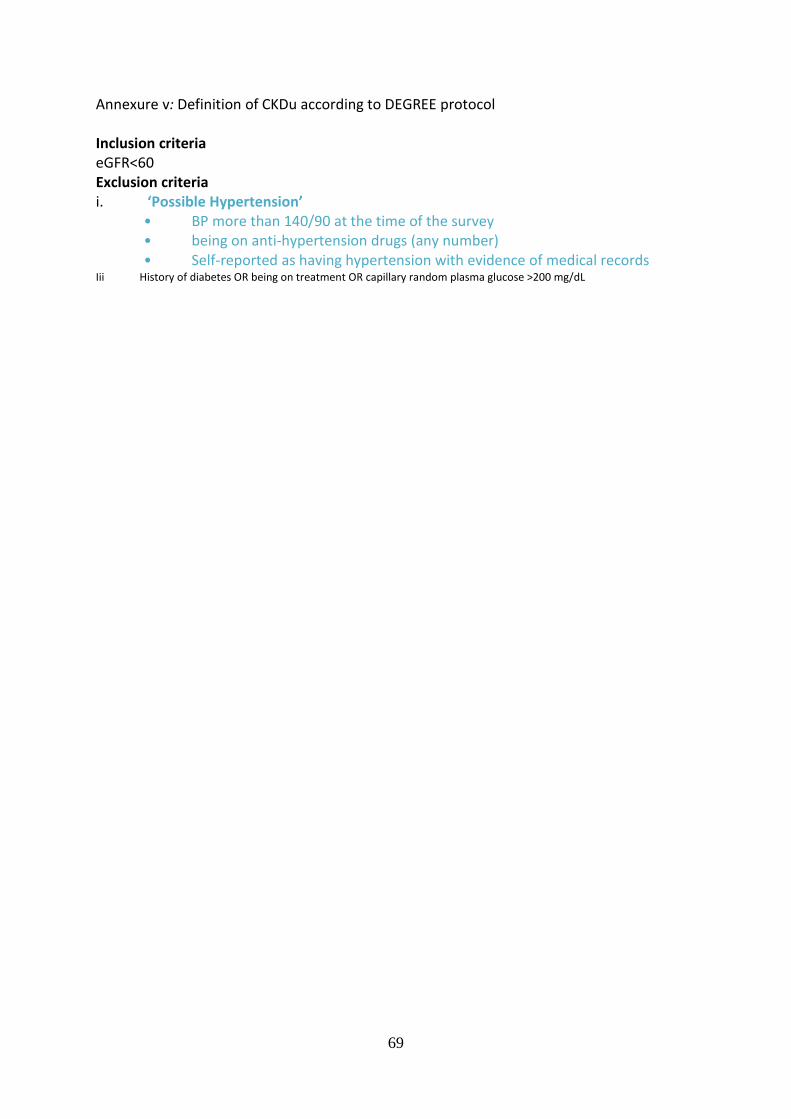
69
Annexure v: Definition of CKDu according to DEGREE protocol Inclusion criteria eGFR<60 Exclusion criteria i. ‘Possible Hypertension’
• BP more than 140/90 at the time of the survey • being on anti-hypertension drugs (any number) • Self-reported as having hypertension with evidence of medical records
Iii History of diabetes OR being on treatment OR capillary random plasma glucose >200 mg/dL
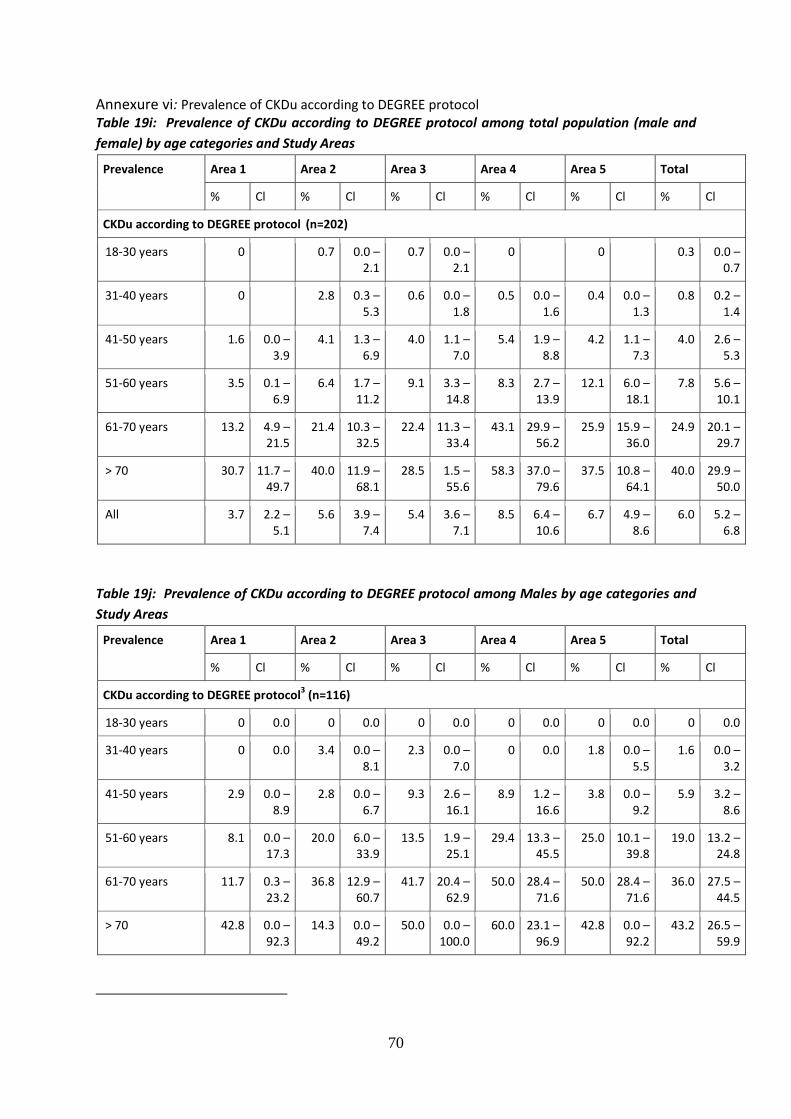
70
Annexure vi: Prevalence of CKDu according to DEGREE protocol Table 19i: Prevalence of CKDu according to DEGREE protocol among total population (male and
female) by age categories and Study Areas
Prevalence Area 1 Area 2 Area 3 Area 4 Area 5 Total
% Cl % Cl % Cl % Cl % Cl % Cl
CKDu according to DEGREE protocol (n=202)
18-30 years 0 0.7 0.0 – 2.1
0.7 0.0 – 2.1
0 0 0.3 0.0 – 0.7
31-40 years 0 2.8 0.3 – 5.3
0.6 0.0 – 1.8
0.5 0.0 – 1.6
0.4 0.0 – 1.3
0.8 0.2 – 1.4
41-50 years 1.6 0.0 – 3.9
4.1 1.3 – 6.9
4.0 1.1 – 7.0
5.4 1.9 – 8.8
4.2 1.1 – 7.3
4.0 2.6 – 5.3
51-60 years 3.5 0.1 – 6.9
6.4 1.7 – 11.2
9.1 3.3 – 14.8
8.3 2.7 – 13.9
12.1 6.0 – 18.1
7.8 5.6 – 10.1
61-70 years 13.2 4.9 – 21.5
21.4 10.3 – 32.5
22.4 11.3 – 33.4
43.1 29.9 – 56.2
25.9 15.9 – 36.0
24.9 20.1 – 29.7
> 70 30.7 11.7 – 49.7
40.0 11.9 – 68.1
28.5 1.5 – 55.6
58.3 37.0 – 79.6
37.5 10.8 – 64.1
40.0 29.9 – 50.0
All 3.7 2.2 – 5.1
5.6 3.9 – 7.4
5.4 3.6 – 7.1
8.5 6.4 – 10.6
6.7 4.9 – 8.6
6.0 5.2 – 6.8
Table 19j: Prevalence of CKDu according to DEGREE protocol among Males by age categories and
Study Areas
Prevalence Area 1 Area 2 Area 3 Area 4 Area 5 Total
% Cl % Cl % Cl % Cl % Cl % Cl
CKDu according to DEGREE protocol3 (n=116)
18-30 years 0 0.0 0 0.0 0 0.0 0 0.0 0 0.0 0 0.0
31-40 years 0 0.0 3.4 0.0 – 8.1
2.3 0.0 – 7.0
0 0.0 1.8 0.0 – 5.5
1.6 0.0 – 3.2
41-50 years 2.9 0.0 – 8.9
2.8 0.0 – 6.7
9.3 2.6 – 16.1
8.9 1.2 – 16.6
3.8 0.0 – 9.2
5.9 3.2 – 8.6
51-60 years 8.1 0.0 – 17.3
20.0 6.0 – 33.9
13.5 1.9 – 25.1
29.4 13.3 – 45.5
25.0 10.1 – 39.8
19.0 13.2 – 24.8
61-70 years 11.7 0.3 – 23.2
36.8 12.9 – 60.7
41.7 20.4 – 62.9
50.0 28.4 – 71.6
50.0 28.4 – 71.6
36.0 27.5 – 44.5
> 70 42.8 0.0 – 92.3
14.3 0.0 – 49.2
50.0 0.0 – 100.0
60.0 23.1 – 96.9
42.8 0.0 – 92.2
43.2 26.5 – 59.9
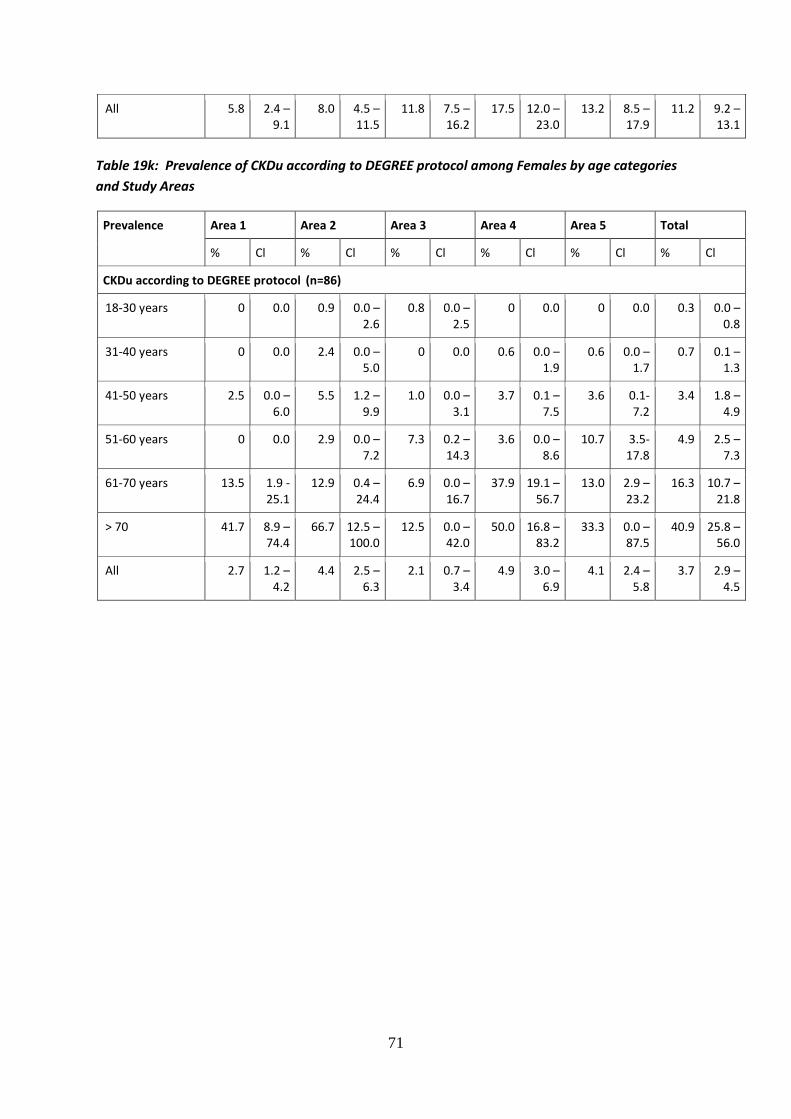
71
All 5.8 2.4 – 9.1
8.0 4.5 – 11.5
11.8 7.5 – 16.2
17.5 12.0 – 23.0
13.2 8.5 – 17.9
11.2 9.2 – 13.1
Table 19k: Prevalence of CKDu according to DEGREE protocol among Females by age categories
and Study Areas
Prevalence Area 1 Area 2 Area 3 Area 4 Area 5 Total
% Cl % Cl % Cl % Cl % Cl % Cl
CKDu according to DEGREE protocol (n=86)
18-30 years 0 0.0 0.9 0.0 – 2.6
0.8 0.0 – 2.5
0 0.0 0 0.0 0.3 0.0 – 0.8
31-40 years 0 0.0 2.4 0.0 – 5.0
0 0.0 0.6 0.0 – 1.9
0.6 0.0 – 1.7
0.7 0.1 – 1.3
41-50 years 2.5 0.0 – 6.0
5.5 1.2 – 9.9
1.0 0.0 – 3.1
3.7 0.1 – 7.5
3.6 0.1- 7.2
3.4 1.8 – 4.9
51-60 years 0 0.0 2.9 0.0 – 7.2
7.3 0.2 – 14.3
3.6 0.0 – 8.6
10.7 3.5- 17.8
4.9 2.5 – 7.3
61-70 years 13.5 1.9 - 25.1
12.9 0.4 – 24.4
6.9 0.0 – 16.7
37.9 19.1 – 56.7
13.0 2.9 – 23.2
16.3 10.7 – 21.8
> 70 41.7 8.9 – 74.4
66.7 12.5 – 100.0
12.5 0.0 – 42.0
50.0 16.8 – 83.2
33.3 0.0 – 87.5
40.9 25.8 – 56.0
All 2.7 1.2 – 4.2
4.4 2.5 – 6.3
2.1 0.7 – 3.4
4.9 3.0 – 6.9
4.1 2.4 – 5.8
3.7 2.9 – 4.5

72