Embed Size (px)
Citation preview
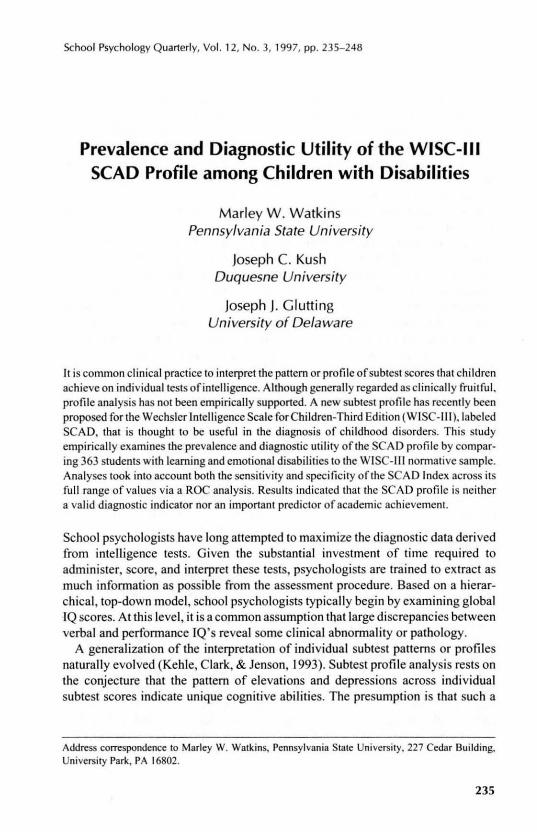
School Psychology Quanerly, Vol. 12, No.3, 1997, pp. 235- 248
Prevalence and Diagnostic Utility of the WISC-III SCAD Profile among Children with Disabilities
Marley W . Watkins Pennsylvania State University
Joseph C. Kush Duquesne University
Joseph J. G lutting University of Delaware
It is common clinical practice to interpret the pattern or profile of sub lest scores that children achieve on individual tests of intelligence. Although generally regarded as cl inically fruitful. profile analysis has not been empirically supported. A new sublest profile has recently been proposed for the Wechsler Inlelligence Scale for Chi ldren-Third Edition (WISC-1II1.labeled SCAD, that is thought to be useful in the diagnosis of childhood disorders. This study empiricall y examines the prevalence and diagnostic utility of the SCAD profile by comparing 363 students with learning and emotional disabilities to the WiSe -I II nonnative sample. Analyses took into account both the sensitivity and specificity oflhe SCAD Index across its fu ll range of va lues via a ROC analysis. Resu lts indicated that the SCAD profile is neither a valid diagnostic indicator nor an important predictor of academic achievement .
School psychologists have long attempled to maximize the diagnostic data derived from inte lligence tests. Given the substantia l investment of time required to administer. score. and interpret these tests. psychologists are trained to extract as much information as possible from the assessment procedure. Based on a hierarchical, top-down model , school psychologists typically begin by examining g lobal IQ scores. At this level, it is a common assumption that large discrepancies between verbal and perfonnance IQ's reveal some clinical abnonnali ty or pathology.
A generalization of the interpretation of individual subtest patterns or profiles naturally evolved (Kehle, Clark, & Jenson, 1993). Subtest profile analysis rests on the conjecture that the pattern of elevations and depressions across individual sublest scores indicate unique cognilive abilities. The presumpl ion is Ihal such a
Address correspondence to Marley W. Walkins. Pennsylvania State University. 227 Cedar Bu ildi ng. Uni versity Park, PA 16802.
235
236 WATKINS, KUSH, AND GLUTIING
mult idimensional view of intell igence provides greater insight into the nature of human abil ity than summary intellectual indices (Zimmerman & Woo-Sam. 1985).
Wechsler's (1958) hypothesis that childhood schizophrenia could be detected by a unique pattern ofWISC subtests is an exemplar of clinical profile analysis. This approach was extended by Bannatyne (1968), who suggested that Wl SC subtest scores could be recategorized to identi fy chi ldren with learning disabil ities. Bannatyne ( 1968. 1974) recommended that ratherthan relying on the traditional WISC Verbal and Performance IQs. subtest scores could be recategorized into "new" composite scores that would provide greater utility in identifying children with genetic dyslexia.
Eventually. more than 75 patterns of subtest variation were identified for the Wechsler series (McDermott. Fantuzzo. & Glutting. 1990). Despite the populari ty of profil e analysis. empirical research suggested that profiles fai led to offer any clinical ut il ity beyond what could be deri ved from more global scores (Hale & Raymond. 198 1; Hale & Saxe. 1983). Further, a growing body of evidence indicates that cognitive sublesl profil es are ineffective in discriminating between students with and without disabi lities (Kavale & Forness. 1984; Kramer. HenningStout. Ullman, & Schellenberg. 1987; Macmann & Barnett. 1992; McDermott. Fantuzzo. & Glutting. 1990; McDermott. Glutting, Jones, Watkins, & Kush, 1989; Mueller, Dennis, & Short. 1986; Piedmont. Sokolove. & Fleming. 1989; Reschly & Grimes, 1990; Watkins, 1996; Watkins & Kush, 1994).
The prac tice of subtest profile in terpretation has flourished due to its intuitive appeal (Bracken, McCallum. & Crain. 1993) and clinical tradition (Shaw. Swerdlik, & Laurent, 1993). These forces continue to sustain the application of profi le analysis with the most recent revision of the Wechsler Scale for Children (Wl SC- III ; Wechsler. 199 1). More importantly. Prifitera and Dersh ( 1993) recently offered preliminary empirical support for subtest analysis on the WI SC-IIl . They combined subrests from the WISC-III Freedom from Distractibil ity (FD) and Processing Speed (PS) indices to create a new profile. The incidence of this profile within the WI SC- III standardization sample was rarer than it was wi thin a sample of 99 children with learning disabil ities and another sample of 65 children with Attention-Defici t Hyperact ivity Disorder. Based upon these results. Pri fitera and Dersh ( 1993) suggested that these patterns would be "useful in the diagnosis ofLD and ADHD" (p. 53).
Kaufman ( 1994) coined the acronym SCAD for th is new profile pattern (Symbol Search. Coding. Ari thmetic. and Digit Span subtests) and recommended that the SCAD index be subtracted from the sum of the Picture Completion. Picture Arrangement, Block Design, and Object Assembly subtests to create a comparison between SCAD and the Perceptual Organization (PO) Index. The PO Index was selected because it "provides the best estimate of cognitive functioning for most children who are likely to be referred for evaluation" (Kaufman. 1994. p. 222). The SCA D subtests were hypothesized to tap important abilit ies (short-term memory. auditory processing, planning, visual-motor integration, sequencing) or pervasive
DIAGNOSTIC UTILITY OF SCAD 237
behaviors (motivation, distractibility) that were thought to constitute core deficits of a variety of exceptional learners.
Kaufman ( 1994) opined that the Arithmetic, Coding, and Digit Span subtests have:
been quite effective at identifying exceptional groups from normal ones, and ... are like a land mine that explodes on a diversity of abnormal populations but leaves most normal samples unscathed ... the fact that so many samples with medical, educational , and psychiatric-behavioral problems have difficulty with Arithmetic, Digit Span, and Coding has made the FD factor a small but potent bit of diagnostic information to consider when evaluating the presence of an abnormal condition in any chi ld referred for evaluation (p. 213).
Kaufman averred that the addition of Symbol Search created a " new tetrad [which] is a potent land mine for clinicians to continue to exploi t when searching the WISC- II1 subtest profil e .. . for diagnostic clues" (p. 2 14). The four SCA D subtests were posited to be "an important piece of evidence for diagnosing a possible abnormality" (p. 221), which "won't identi fy the type of exceptionality, but they are likely to be va luable for making a presence-absence decision and helping to pinpoint speci fic areas of deficiency" (p. 214).
Claims concerning the SCAD profile's diagnostic and prescriptive utility are based upon statistically significant group differences. "Groups of[exceptional] children differ significantly from normal children in the magnitude of the di screpancy between PO and SCAD subtests" (p. 220). However, Meehl and Rosen ( 1955) warned psychologists that they would be mi sled if they used "validity" or "discrimination" between groups to justify diagnostic decision making. That caution was cogently reiterated by Elwood (1993), who contended that "significance alone does not reflect the size of the group differences nor does it imply the test can discriminate subjects with sufficient accuracy for clinical use" (p. 409).
Although relatively rare in the social sciences, statistical methods ofdeterrnining the utility o f diagnostic decisions have been developed and employed in such fields as medicine, materials testing, and weather forecastin g (Colliver, Vu, & Barrows, 1992; Swets, 1988; Wedding & Faust, 1989). Kessel and Zimmerman ( 1993) described several of these diagnostic utility statistics: (a) Sensit ivity, or true positive, the proportion of participants with a target disability who are identified by a positi ve test finding; (b) Specificity, or proportion of participants free of the disability who are correctly identified by a negative test result; (c) False Positive Rate, the proportion of participants identified by a positive test score who do not have the target disability; (d) False Negative Rate, proportion of participants identified by a negative test score who have the target disability; and (e) Kappa, the proportion of agreement between the test and actual condition ofth. participants (d isabled vs. non-disabled) beyond that accounted by chance.
238 WATKINS, KUSH, AND GLUTTING
The purpose of the present study is to investigate the prevalence and diagnostic utility of the SCAD subtest profile among a group of children previously diagnosed as having learning and emotional disabilities.
METHOD
Participants
Students with Learning and Emotional Disabilities. Cases for this study were drawn from special education records of three southwestern, suburban school district special education programs. Students who received comprehensive psychological evaluations during a one-year period served as participants. Students were selected from special education records based upon two criteria: (a) cognitive assessment included 12 subtests oftbe WISC-III; and (b) enrollment in a learning disability (LD) or emotional disability (ED) program.
Placement in a special education program was determined by multidisciplinary evaluation teams following assessment by a certified school psychologist. Teams followed state special education rules and regulations that defined a learning disability as a significant ability-achievement discrepancy, and differentiated an emotional disability by one of five emotional characteristics adversely impacting educational progress.
These selection criteria identified 363 students enrolled in kindergarten through I I th grade. Median grade placement was 4th grade and 80% of the participants were in grades I through 6. Special education enrollment was 91 % in learning disability and 9% in emotional disability programs. Gender distribution was 70% male and 30% female. Ethnic identity, as reported by parents on school records, was 51% White, 23% Native American, 16% Hispanic. and 10% Black.
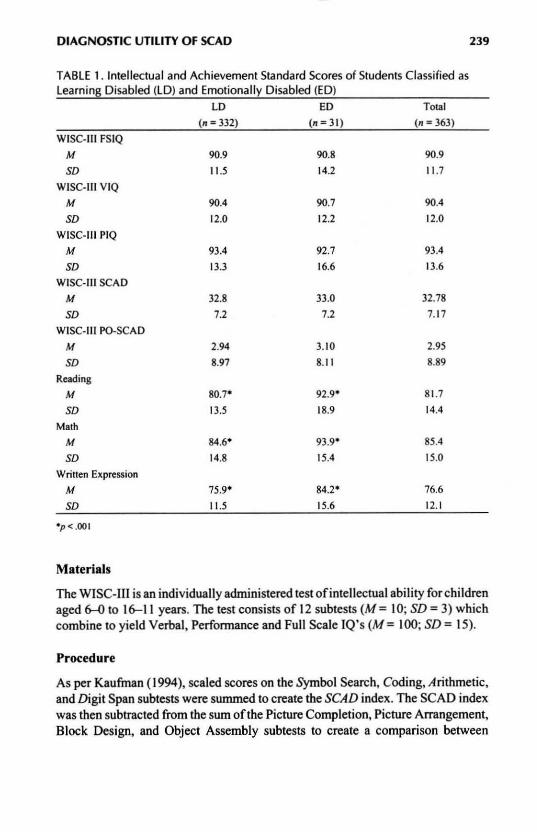
Academic achievement leve ls in reading, math, and written expression for 96% of the participants were measured with the Woodcock Johnson Tests of Achievement- Revised (Woodcock & Mather, 1989). Academic achievement of the remaining students was assessed with four other achievement tests. Table I presents intellectual and academic achievement scores for participating students by special education classification. Although lower than average, cognitive and academic achievement levels were consistent with other compi lations of data from children enrolled in special education programs (Kavale & Nye, 1985).
Students without Disabilities. These participants were from the standardization sample of the WISC-1Il (Wechsler, 1991), as reported by Prifitera and Dersh (1993). After children with Full Scale IQs less than 70 were excluded, the final sample consisted of 2,158 children aged 6-16 years. This abridged WISC-ill normative group was considered to be a nationally representative sample of students without disabilities.
DIAGNOSTIC UTILITY Of SCAD 239
TABLE 1. Intellectual and Achievement Standard Scores of Students Classified as Learnin~ Disabled (LD) and Emotionally Disabled (ED)
LD ED Total
(n = 332) (n=31) (n = 363)
WISC-III FSIQ
M 90.9 90.8 90.9
SO 11.5 14.2 I 1.7
WISC-III VIQ
M 90.4 90.7 90.4
SO 12.0 12.2 12.0
WISC-III PIQ
M 93.4 92.7 93.4
SO 13.3 16.6 13.6
WISC-III SCAD
M 32.8 33.0 32.78
SO 7.2 7.2 7.17
WISC-III PO-SCAD
M 2.94 3.10 2.95
SO 8.97 8.1 I 8.89
Reading
M 80.7- 92 .9 ' 81.7
SO 13.5 18.9 14.4
Math M 84.6' 93 .9' 85.4
SO 14.8 15.4 15.0
Written Expression
M 75.9' 84.2 ' 76.6
SO 11.5 15.6 12.1
.p < .001
Materials
The WISC-HI is an individually administered test of intellectual ability for children aged tHl to 1&-11 years. The test consislS of 12 subtests (M= 10; SD = 3) which combine to yield Verbal, Performance and Full Scale IQ's (M = 100; SD = 15).
Procedure
As per Kaufman (1994), scaled scores on the Symbol Search, Coding, Arithmetic, and Digit Span subteslS were summed to create the SCAD index. The SCAD index was then subtracted from the sum ofthe Picture Completion, Picture Arrangement, Block Design, and Object Assembly subteslS to create a comparison between
240 WATKINS, KUSH, AND GLUTTING
SCAD and Perceptual Organization (PO) cognitive skills. This PO-SCAD difference was calculated for all participants with handicaps and was extracted from Prifitera and Dersh's ( 1993) tables for participants without handicaps.
Full Scale IQs, Verbal IQs, Performance IQs, factor index scores, PO-SCAD difference scores, and SCAD scores did not significantly differ between children with learning and emotional disabilities (see Table I). When Kaufman's (1994) caution concerning variabili ty between the FD and PS factors was incorporated, and only those students with absolute FD-PS differences of less than 16 points were retained, the students wi th learning disabilities (n ; 3 1S) and emotional disabilities (II; 30) did not significantly differ on Full Scale IQs, VerballQs, Performance IQs, factor index scores, PO-SCAD difference scores, or SCAD scores. There were also no significant differences between cogni tive measures when those students with learning disabilities whose abil ity-achievement discrepancies in reading exceeded 1.96 standard errors of estimate (II ; 72) were compared to students with emotional disabilities. Nor did any of these methods of grouping participants produce discrepant diagnostic utility statistics. Consequently, data from all 363 students with disabilities were combined for subsequent analyses.
The percentage of students with PO-SCAD difference scores were compared to those reported for the standardization sample (Prifitera & Dersh, 1993) via diagnostic utility statisticsat three difference levels: 7,9, and 12 points (representative ofp < . IS, .OS, and .0 I levels of significance).
RESULTS
Table 2 presents the percentage of students who scored 1- 18 points higher on the sum of the four perceptual organization subtests than on the SCAD subtests. The current participants exhibited: (a) less extreme PO-SCAD differences than tbe sample of 99 children with learning disabilities analyzed by Prifitera and Dersh; (b) similar PO-SCAD differences as those reported by Ward, Ward, Hatt, Young, and Moller (199S) for 163 children with learning disabilities, and (c) more extreme PO-SCAD differences than reported for the 2, IS8 chi ldren with IQ's above 70 in the WISC-UI standardization sample.
Diagnostic utility statistics are presented in Table 3. Kappas of .02 to .13 refl ect "slight" or "poor" agreement beyond chance (Kraemer, 1992) and are significantly different from zero only at the most extreme cutting score. Many children were miscategorized when the PO-SCAD was used as a diagnostic indicator. For example, only S6 of the 363 children with disabilities were properly detected by the most extreme PO-SCAD cutting score, in contrast to 199 children without disabilities who were misclassified as disabled and 307 children with disabilities who were misclassified as non-disabled.
Although Table 3 reveals that the PO-SCAD difference does not efficiently separate children with disabilities from those without disabilities, it is possible that

DIAGNOSTIC UTILITY OF SCAD
TABLE 2. Cumulative Percentages of the Students with Disabilities Obtaining Various Amounts of Discrepancy Between Perceptual Organization and SCAD Subtests
Amount of Difference Cumulative
(PO-SCAD) %
18+ 4.1
17 5.0
16 6.3
15 8.3
14 8.8
13 12.7
12 15.4
II 20.4
10 24.5
9 29.2
8 35.0
7 39.7
6 42 .7
5 47.9
4 51.0
3 53.7
2 56.2
59.0
241
a smaller or larger PO-SCAD difference score would be a more efficacious cut score. This hypothesis was tested with an extension to standard diagnostic efficiency statistics that takes into account the balance between the sensitivity and specificity of a diagnostic test across all possible decision thresholds. This Receiver Operating Characteristic (ROC) was originally· developed in the context of elec-
TABLE 3. Diagnostic Efficiency of PO-SCAD Differences When Used to Predict Membership in Disabled and non-Disabled Groups
PO-SCAD PO-SCAD PO-SCAD PO-SCAO
Diagnostic Efficiency Statistic = 7a = ~
Sensitivity
Specificity
False Positive Rate
False Negative Rate
Kappa
.40
.77
.23
.60
.13
.29
.84
. 16
.71
.12
'Current study where n = 363 in disabled and n '" 2, 158 in non-disabled groups.
= 12a =9b
.15 .18
.9 1 .84
.09 . 16
.85 .82
.02· .01
b Based upon data of Ward. Ward. Han, Young, and Mollner (1995) where n "" 217 in disabled and n "" 2. 158 in non-disabled groups . • p< .OOl

242 WATKINS, KUSH, AND GLUTTING
1.0
0.8 ~ .... ~ = , ~ 0.6 RJ:
, > , ;: , ;;; , Parrl::m 0 . .
RJ: .. 0.4 , ~
, :l , '" , .... ,
0.2 ,
0.0 0.0 0.2 0.4 0.6 0.8 1.0
FALSE POSITIVE RATE
FIGURE I. Receiver operating characteristic (ROC) of PO-SCAD difference scores used to distinguish between subjects with and without disabilities
tronic signal detection experiments in radar, but it has been adapted and reformulated for biomedical applications (Hanley & McNei l, 1982; Kraemer, 1988; Murphy et a J. , 1987; Swets, 1988). ROC analysis does not depend on the prevalence of disabilities in the population and consequently provides a description of diagnostic accuracy that is independent of both prevalence and decision threshold efTects (Metz, 1978).
ROC analysis is typically presented in a graph that plots all of the sensi tivity/false positive pairs resulting from continuously varying the test's cut score across the full range of possible cut scores. Each change in cut score will reduce one type of diagnostic error at the expense of increasing another type of diagnostic error (Dwyer, 1996). Thus, a ROC analysis graphically represents a test's diagnostic accuracy across its full range of scores. As illustrated in Figure I, the ROC curve of a test with zero discriminating power is a diagonal line dubbed the " line of no information" or the "random ROC." The more accurately a test is able to discriminate between individuals with and without the target disorder, the more its ROC curve wi ll deviate toward the upper left comer of the graph. Inspection of the ROC curve of Figure I, which is based on the current PO-SCAD data, reveals that it does not substantially diverge from the random ROC.
This subjective observation can be objectified by calculating the area under the ROC curve (AUC) (Colliver, Vu, & Barrows, 1992; Hanley & McNei l, 1982) to produce an overa ll index of the accuracy of the PO-SCAD comparison. A
DIAGNOSTIC UTILITY OF SCAD 243
perfect predictor would produce an A UC of 1.0 whereas the random ROC always accounts for .50 of the AUe. Swets ( 1988) suggested that areas of.5--. 7 indicate low test accuracy, .7- .9 moderate accuracy, and .9-1.0 high accuracy. Based upon formulae provided by Hsiao, Bartko, and Potter ( 1989), the AUC of Figure I summed to .59. As described by Murphy et al. . ( 1987), the AUC "may be interpreted as an estimate of the probabi li ty that a randomly chosen ill person wi ll . at each threshold. have a higher test score than a randomly chosen well person" (p. 552). Interpretatively, the current AUC of .59 indicates that a randomly selected participant with a disability would obtain a higher PO-SCA D score than a randomly selected participant not di sabled 59% of the time. In contrast, tossing a coin would result in a correct classification rate of50%. Thus, there is no PO-SCA D cutting score that significantly exceeds chance discriminatory power. This performance is especially dismal within the context of ROC research in medical diagnostic imaging that typically generates AUC's of .87 to .97 (Swets. 1988) and ROC studies of the diagnosis of depression with rating sca les that produce AUC's ranging from .68 for the worst scales to .90 for the best sca les (Somoza, Steer. Beck. & Clark, 1994).
Although not a valid diagnostic indicator, the SCAD profile may instead be related to perfonnance on academic achievement measures. which could add to the predictive validity of the WISC-Ill. To test this hypothesis, participants' reading, math. and written expression scores were correlated wi th the SCAD while controlling for verbal comprehension and perceptual organization abilities. Results indicated that the SCAD index was not related to reading achievement (r = .045, P > .10). but did covary with math (r = .17, P < .00 I ) and written expression (r = .145, P < .001) ski lls. While stat istically significant, the SCA D index and math achievement shared only 2.9% of their variance, while the SCAD index and written expression achievement shared 2.1 % of their variance. Consequently, the SCAD profile is not an important predictor of academic achievement among children with disabilities.
DISCUSSION
The prevalence and diagnostic utility of the SCAD in distinguishing between children with learning and emotional disabilities and those without disabilities was investigated in th is study. As in previous research, children with disabilities exhibited larger mean SCAD scores than non-disabled children . However, when SCAD profiles were used to classify students into disabled and non-disabled groups, the SCAD scores operated at ncar chance levels. Inaccurate classifications were replicated across all SCAD values. Nor was the SCAD profile a robust predictor of academic achievement among chi1dren with disabilities. In agreement with Wardet al. ( 1995), these results suggest that the SCAD profile has " little utility in differential diagnosis" (p. 275) and is an invalid addition to psychoeducational diagnostic practice.
244 WATKINS, KUSH, AND GLUTIING
It is commonly argued that subtest analysis is not a diagnostic procedure but, rather, a process of hypothesis generat ion allowing the cl inician to identify specific cogniti ve strengths and weaknesses (Bracken, McCallum, & Crain, 1993). As stated by Kaufman ( 1994), "The examiner' s main role is to generate hypotheses...and then confirm or deny these hypotheses by exploring multiple sources of evidence" (p. 15). Given this perspecti ve, clinicians may believe Ihat the SCAD and other cognitive profiles wi ll generate hypotheses even if they are not valid diagnostic markers. This belief, while seemingly logical, cannot withstand close scrutiny. As noted by Faust ( 1984), "Even judgments that appear to be simple, on closer analysis, are found to contain complexity" (p. 5).
Although use of WISC-III subtest profiles to generate clinical hypotheses appears to be straightforward (Groth-Mamat, 1997; Kaufman, 1994), unavoidable complexity is introduced by cogniti ve errors that inevitably occur when decisionmak ing procedures fa il to apply available nonllative judgment methods (Faust, 1984). Cogniti ve errors are well documented and have been consistently demonstrated by both novice and seasoned clinicians (Faust, 1986). Among the most ubiquitous of these flaws in human reasoning are under-utilization of base rates, misjudgment of co variation, association of avai lability in memory with probability of occurrence, estimat ion of probabilities on the basis of similarity or representativeness, and over-reliance on confim13tory strat.egies (Arkes, 199 1; Davidow & Levinson, 1993; Faust, 1984,1986; Faust & Ziskin, 1988; Wedding & Faust, 1989). These cognitive inaccuracies interact wi th fundamental limitations in human infonnation processing to generate suboptimal decisions. This outcome has been substantiated in nearly 100 studies in the social sciences where the accuracy of actuarial predictions was equal to or bener than clinical predictions (Dawes, Faust, & Meehl, 1989). The complex interaction of cogniti ve errors and limitations of reasoning that cause the clinical hypothesis generation process to go awry have been trenchantly illustrated by Faust ( 1986):
Despite what supervisors tell their students about integrating data and examining configuraJ relat ions, the typical cognitive processes underlying psychodiagnosis are likely much closer to that ofthis example: The clinician proceeds to collect sufficient information to formu late and support (not test) hypotheses. As data are collected or analyzed, the clinician formulates hypotheses about the patient, often quite early in the process. Hypotheses are based on a few salient cues. Subsequent data collection or analysis is overly influenced by these hypotheses; although they may be further elaborated or refi ned, they are rarely changed substantially .... Much of the subsequent search may be little more than an attempt to find sufficient evidence to confinn conclusions. The final conclusions are based not on complex configural analysis but on "counting noses ...... Data that might conflict wi th conclusions are either explained away (e.g., as test artifact), ignored, or molded to fit the hypothesis through mental gymnastics. The dynamic formulat ion used to explain tbe assumed
DIAGNOSTIC UTILITY OF SCAD 245
pathological state is shaped by additional bad judgment habits ... .The process becomes an exercise in redundancy, extending the initial diagnostic conclusions to questions of cause while ensuring that a satisfactory answer is obtained regardless of its accuracy. In fact, no matter what their accuracy is, the search for such explanations is likely to increase confidence (p. 424).
Beyond the judgmental difficulties inherent in a clinical hypothesis approach, basic psychometric principles would predict a high rate of erroneous decisions. By beginning the decision-making process with a random component (the SCAD profile) and then searching for confirmation, the clinician cannot increase, and may even decrease,.judgment accuracy when trying to detect a low incidence strength or weakness (Meehl & Rosen, 1955). As Runimann (1994) summarized: "Quality of information ... is a prerequisite to usefulness of information" (p. 27).
As in all experimental designs with nonrandom assignment, the results of this research are vulnerable to threats to internal and external validity (Campbell & Stanley, 1963). First, sampling variability must be considered, and these results should be generalized to other clinical samples with caution. However, sampling error seems less of a threat to generalizabi lity as the current results closely accord with the data reported by Ward et al. (1995) and by Daley and Nagle (1996) from other samples of exceptional learners. Second, the naturally occurring assessments used in this research did not control for IQ-achievement test order. While there may have been some nonspecific practice effects that occurred as part of this study, there is no evidence to suggest that this should have significantly affected the SCAD profiles. Finally, the present results may be limited due to the inherent inability to define " true" disabilities. In medical testing, for example, the trutn about each patient 's disease state can be determined by surgery or autopsy. Such certainty regarding the " true" status ofleaming and emotional disabilities cannot be obtained and may have innuenced the current measurement of accuracy. Again, similar results from a variety of samples (Daley & Nagle, 1996; Ward, et aI., 1995) and from the mUltiple categorizat ions of the present sample reduce the likelihood of this threat.
Basic scientific method demands that, " Hypotheses must be stated in such fash ion as to be capable of disconfirmation by clearly designed and carefully described empirical studies" (Eisenberg, 1986, p. 477). The current investigation tested the hypothesis that the SCAD profile would be "useful in the diagnosis of LD and ADHD" (Prifitera & Dersh, 1993, p. 53) or would constitute "an important piece of evidence for diagnosing a possible abnormality" (Kaufman, 1994, p. 221) and found the SCAD profile to be an invalid diagnostic indicator among children with learning and emotional disabilities. When considering these results within the context ofiimitations in human information processing and the common propensity for clinicians to succumb to specific cognitive errors, appraisals that attribute clinical meaning to subtest profiles such as the SCAD should be eschewed. The utility of mental tests, while not exempt from criticism, must be judged by
246 WATKINS, KUSH, AND GLUTTING
psychometric and statistical analyses rather than impressionistic and emotional reactions. The science of practice cannol be advanced by anecdotes (Shermer, 1994), but must rely on reliable and valid assessmenl and diagnostic procedures.
REFERENCES
Arkes. H. R. ( 199 1). COSlS and benefits of judgment errors: Implications for debiasing. Psychological Bulletin , 110.486-498.
Bannalyne, A. (1968). DiagnOSing learning disabilities and writing remedial prescriptions. Journal of Learning Disabilities. t , 242- 249.
Bannalyne. A. (1974). Diagnosis: A nOle on recategorization of the wise scaled scores. Journal of Learning Disabilities. 7, 272- 273.
Bracken. B. A .• McCallum. R. S .. & Crain. R. M. ( 1993). WISe·ll( 5ublesl composite reliabilities and specificities: Interpretive aids. Journal ofPsychoeducotional Assessment, WiSe-III Monograph. 22- 34.
Campbell. D. T., & Stanley. J. C. (1963). Experimental and quasi-experimeflfal designs/or research. Chicago: Rand McNa lly.
Colliver. J. A .. Vu. N. V .. & Barrows. H. S. (1992). Screening test length for sequential testing with a standardized-patient examination: A receiver operating characteristic (ROC) analysis. Academic Medicine. 67. 592- 595.
Daley. C. E .. & Nagle. R. J. (1996). Relevance of Wise-III indicators for assessment of learning disabilities. Journal 0/ Psychoeducationol Assessment. 14. 320-333.
Davidow, J .• & Levinson. E. M. ( 1993). Heuristic principles and cognitive bias in decision making: Impl ications for assessment in school psychology. Psychology in Ihe Schools, 30. 351- 361 .
Dawes. R. M .. Faust. 0 .. & Meehl. P. E. (1989). Clinical versus actuarial judgment. Science. 243. 1668-1674.
Dwyer. C. A. (\996). Cut scores and testing: Statistics. judgment. truth. and error. Psychological Assessment. 8. 3~362.
Eisenberg. L. (1986). When is a case a case? In M. Rutter, C. E. Izard, & P. B. Read (Eds.), Depression in young people: Developmental and clinical perspectives (pp. 383-390). New York: Guilford.
Elwood. R. W. ( 1993). Psychological tests and clinical discriminations: Beginning to address the base mte problem. Clinical Psychology Review, 13. 409-419.
Faust. D. (1984). The IimilS a/scientific reasoning. Minneapolis: University of Minnesota Press. Faust. D. (1986). Research on human judgment and its application to clinical practice. Pro/essional
Psychology: Research and Practice. 17. 42~30.
Faust. D., & Ziskin. J. ( 1988). The expert witness in psychology and psychiatry. Science. 241. 31-35. Groth-Mamat, G. ( 1991). Handbook o/psychological assessment (Third Edition). New York: Wiley. Hale. R. L., & Raymond, M. R. ( 1981). Wechsler Intelligence Scale for Children-Revised (WISC-R)
patterns of strengths and weaknesses as predictors of the intelligence-achievement relationship. Diagnoslique. 7. 3S-42.
Hale. R. L .• & Saxe. J. E. (1983). Profile analysis of the Wechsler Intelligence Scale for Children-Re· vised. Journal 0/ Psychoeducational Assessment. I. 155-162.
Hanley. 1. A .. & McNeil, B. 1. (1982). The meaning and use of the area under a receiver operating characteristic (ROC) curve:. Radiology. 143. 29-36.
Hsiao, J. K., Bartko, J. 1., & Poner. W. Z. ( 1989). Diagnosing diagnoses. Archives o/General Psychiatry. 46. ~7.
Kaufman, A. S. (1994). Intelligent testing with the WISC-/II. New York: Wiley. Kavale. K. A., & Forness, S. R. (1984). A meta-analysis of the validity of Wechsler scale profiles and
recategorizations: Panerns or parodies? Learning Disabilities Quarterly. 7. 136-156.

DIAGNOSTIC UTILITY OF SCAD 247
Kavale, K. A., & Nye, C. ( 1985). Parameters of learning disabilities in achievement, linguistic. neuropsychological , and sociallbehavioral domains. The Journal of Special Education. 19. 443--458.
Kehle, T. J., Clark, E., & Jenson, W. R. (1993). The development of testing as applied to school psychology. Journal o/School Psychology. 3 J, 143--161.
Kessel, J. B., & Zi mmennan, M. (1993). Reporting errors in studies of the diagnostic performance of self-admin istered questionnaires: Extent of the problem. recommendations for standardized presentation of results. and implications for the peer review process. Psychological Assessment. 5.39S--399.
Kraemer, H. C. (1988). Assessment of2 x 2 associations: Generalization of signal-detection method· ology. American Statistician. 42. 37-49.
Kraemer. H. C. (1992). Evaluating medical tests: Objective and quantitative guidelines. Newbury Park. CA: Sage.
Kramer, J. J., Henning·Stout. M., Ullman, D. P .• & Schellenberg, R. P. (1987). The viability ofscaner analysis on the WISC-R and the SBtS: Ex.amining a vestige. Journal of Psychoeducarional Assessment. 5. 37-47.
Macmann, G. M., & Barnett. D. W. (1992). Redefining the WISC- R: Implications for professional practice and public policy. Journal o/Special Education. 26. 139-161.
McDermott. P. A., Fantuzzo, J. W., & Glutting, J. J. (1990). Just say no to subteSI analysis: A critique on Wechsler theory and practice. Journal 0/ P~ychoeduca(ional Assessment. 8. 290-302.
McDermott. P. A., Glutting, J. J.. Jones. J. N., Watkins. M. W., & Kush, J. C. (1989). Identificat ion and membershipofcore profile types in the WISC- R national standardization sample. Psychological Assessment: A Journal o/Consulting and Clinical Psychology, 1.292- 299.
Meeh l, P. E., & Rosen, A. (1955). Antecedent probability and the efficiency of psychometric signs. patterns, or cutti ng scores. Psychological Bulletin. 52. 194-216.
Metz, C. E. (1978). Basic principles of ROC analysis. Seminars in Nuclear Medicine, 8. 281-298.
Mueller, H. H .. Dennis. S. S., & Short, R. H. (1986). A meta·ex.ploration ofWISC-R factor score profiles as a function of diagnosis and intellectual level. Canadian Journal 0/ School Psychology, 2, 2 1-43.
Murphy, J. M .• Berwick. D. M. , Weinstein. M. C., Borus, J. F .. Budman, S. H .. & Klerman. G. L. (1987). Performance on screen ing and diagnostic tests. Archives of General Psychiatry. 44. 550-555.
Piedmont. R. L.. Sokolove. R. L., & Fleming, M. Z. (1989). An ex.amination of some diagnostic strategies involving the Wechsler intelligence scales. Psychological Assessment: A Journal of Consulling and Clinical Psychology. I. 181- 185 .
Prifitera. A., & Dersh. J. (1993). Base rates of WISC-Ill diagnostic subtest patterns among normal. learning-disabled. and ADHD samples. Journal of Psychoeducational Assessment. WISC- III Monograph, 43-55.
Reschl y. D. J., & Grimes, J. P. (1990). Best practices in intellectual assessment. In A. Thomas & J. Grimes (Eds.), Best practices in school psychology-lI(pp. 425-440). Washington, DC: National Association of School Psychologists.
Runimann. U. E. (1994). Statistical approaches to development and validation of predictive instrumenls. Critical Care Clinics, 10, 19-35.
Shaw. S. R .. Swerdlik . M. E .• & Laurent, J. ( 1993). [Review of the test Wechsler Intelligence Scale for Children· Third Edition]. Journal of Psychoeducational Assessment. WISC- I/J Monograph. 151-160.
Shermer. M. (1994). How thinking goes wrong. Skeptic. 2. 42-49.
Somoza. E .• Steer, R. A., Beck, A. T., & Clark, D. A. (1994). Differentiating major depression and panic disorders by self-report and cli nical rating scales: ROC analysis and information theory . Behavioral Research and Therapy. 32. 77 1- 782.
Swets, J. A. (1988). Measuri ng the accuracy of diagnostic systems. Science. 240. 1285-1293.
248 WATKINS, KUSH, AND GLUTTING
Ward. S. B., Ward. T. l , Han, C. V., Young. D. L.. & MoHner, N. R. (1995). The incidence and utility of the ACID, ACIDS, and SCAD profiles in 8 referred population. Psychology in the Schools. 32. 267- 276.
Watkins, M. W. (1996). Diagnostic utility of the Wise-III developmental index as a predictor of learning disabilities. Journal o/Learning Disabilities. 29. 30~312.
Watkins, M. W., & Kush. J. C. (1994). WISC-R sublest analysis: The right way. the wrong way. or no way? School Psychology Review. 23, 64O-OS I.
Wechsler, O. (1958). The measurement and appraisal of adult intelligence (4th ed.). Baltimore. MD: Williams & Wilkins.
Wechsler, D. (1974). Manualfor the Wechsler Intelligence Scale/or Children-Revised. New York : Psychological Corporation.
Wechsler, D. (1991). Manualfor the Wechsler Intelligence Scale/or Chjfdre~Third Edition. San Antonio, TX: Psychological Corporation.
Wedding. D., & Faust. D. (1989). Clinical judgment and decision making in neuropsychology. Archives o/Clinical Neuropsychology. 4. 233-265.
Woodcock, R. W., & Mather, N. (1989). WJ-R Tests of Achievement: Examiner's Manual. In R. W. Woodcock & M. B. Johnson. Woodcock-Johnson Psycho-Educational Battery·Revised (pp. 1- 214). Allen. TX: DLM.
Zimmennan, I. L. & Woo-Sam. J. M. (1985). Clinical applications. In B. B. Wolman (Ed.), Handbook o/intelligence: Theories. measurements, and applications (pp. 873--898). New York: Wiley.
Action Editors: Gregg M. MacMann and David W. Barnett Acceptance Date: April23, 7991

![Presentazione standard di PowerPoint€¦ · %Scad C] TOT portafC] Scad C] Scad 120 A Scad 120 C] Scad 150 A Scad 150 72468 261 618 45 go 188 527 C] Scad 180 A Scad 180 C] Scad 30](https://img.pdfslide.us/doc/110x75/60aafa6f3697c86f175cace5/presentazione-standard-di-scad-c-tot-portafc-scad-c-scad-120-a-scad-120-c-scad.jpg)