Embed Size (px)
Citation preview

Prestanda och karaktäristik för Grupp I-
basoljor
Henrik Marits,
Nynas AB, Naphthenics
Underhållsdagen 24 november 2015

Outline
A brief overview of base oils API Groups I to V
and their applications
A closer look at Group I base oil availability
and base oil markets drives
Some suggestions on how to secure supply of
base oils with Group I properties, now and
in the future

API classification of base oils
VI = 80-119
Sats<90% and/or S>0.03%
VI = 80-119
Sats>90% and S<0.03%
VI > 120
Sats>90% and S<0.03%
Group I
Group II
Group III
PAO Group IV
All other oils Group V
Paraffinic
Oils
Wide chemical spectrum
Narrower chemical spectrum
Specific molecule type

Group I base oils
Main base oil for 100+ years
Very suitable for
Industrial Lubricants
Hydraulic fluids
Industrial gear oils
Some metalworking applications
Straight grade heavy engine oils
Marine engine oils (high viscosity)
Greases
Process oils
Remember: “Thus, if it’s big, moves slowly under heavy load, that oil had
better be thick”

Group I – Key properties
SN 100 SN 150 SN 600 Bright Stock
Viscosity at 40°C, cSt 19-21 29-32 109-116 500
VI 95 95 95 95
Pour Point, °C -18 -15 -6 -6
Saturates, % 75-85 75-85 70-80 60-70
Noack Volatility, wt % 26-30 16-20 3 NA

Group II base oils
Group II is the new Orange
Production has exploded in the last 20 years
New main automotive engine base oil
Very dominant in North America for cars (PCMO) and trucks (HDDO)
Growing importance in Europe for trucks (HDDO)

Group II – Key properties
100 SUS 220 SUS 600 SUS
Viscosity at 40°C, cSt 19-21 42-46 109-116
VI 95-100 95-100 95-100
Pour Point, °C -18 -15 -12
Saturates, % >98 >98 >98
Noack Volatility, wt % 26-30 11-15 2-3

Group III base oils
Used for “Synthetic” engine oils, gear, transmission and hydraulic for almost
20 years
Made from slack wax, or from GTL wax, via hydro isomerization
Unlike cracking processes, that changes the properties of the fluid without
losing viscosity (cracking makes small molecules out of large ones)

Group III – Key properties
100 SUS 250 SUS
Viscosity at 40°C, cSt 19-21 47-51
VI 122-128 127-135
Pour Point, °C -15 -15
Saturates, % >98 >98
Noack Volatility, wt % 13-15 3-4

Group IV base oils- PAO
The poly-α-Olefin is a true synthetic fluid
Made from the oligomerization of 1-Decene
High VI
Low volatility
Good low temp properties
High cost

Nynas was founded in 1928
Nynas is the largest specialty oil producer in Europe
Offices in more than 30 countries around the globe
Net Sales: 3 Billion USD
Average number of employees: 1000
Refineries in Nynäshamn (SE), Gothenburg (SE), Harburg (DE),
Eastham JV (UK), Antwerp JV (BE), Isla JV (Curacao)
Base Oils

Nynas: The Different Oil Company
12% Fuel
18% Specialty oils
70% Bitumen
96% Fuel
4% Bitumen,
Specialty oils
and Lubes
Typical
oil company

Global Oil Consumption
Other Lubricants, 97%
(39 Mio tons / y)
Lubricants, 1% including
motor oils, base oils,
process oils, tyre oils
Tyre oils, 3%
(1.3 Mio tons / y)
Only 0.03% of
total global oil
demand
3.9 Billion tons / y

Source: Kline 2015
IEO-Ind. Engine Oils
GIO- General Ind. Oil
HF- Hydraulic fluids
PO- Process Oils

What is happening in the base oil market?
The base oil market is rapidly changing!
The needs of the automotive industry, driven by fuel economy legislation, is
driving the major shift away from traditional Group I base oils towards Gr. II
and Gr III
The needs of the industrial lubricant market is inconsequential to this
development
Collateral damage is caused to industrial lubricants blenders (and users), if
they cannot resolve their supply issue
Currently,
70% of Group I go into industrial lubricants
30% into automotive engine oils and
transmission fluids
Global Usage of Group I
Oils 2013 (total market
approx. 17 million tons)
Source: Kline Consulting

World Naphthenic market share:
A significant part of the global oil market The Global lubricant demand is 40 M Ton/y
Ca. 1% of the total petroleum market
Automotive Lubricants 56%
Industrial Lubricants 44 %
Global naphthenic potential:
About 10% of total base oil demand (3.6 M Ton) (Source Fuchs Petrolub AG presentation at 18th ICIS-LOR World Base Oils conference Feb 2014 in London)
Naphthenic Usage, %

Main applications of naphthenic oils (I)
Lubricant Industry (30%)
Lubricating greases
Metal Working Fluids (MWF)
As a component in other industrial
lubricants (hydraulic fluids, gear oils, etc.)
Electrical Industry (ELI) (30%)
Insulating oils for industrial transformers
Finished products for direct end use
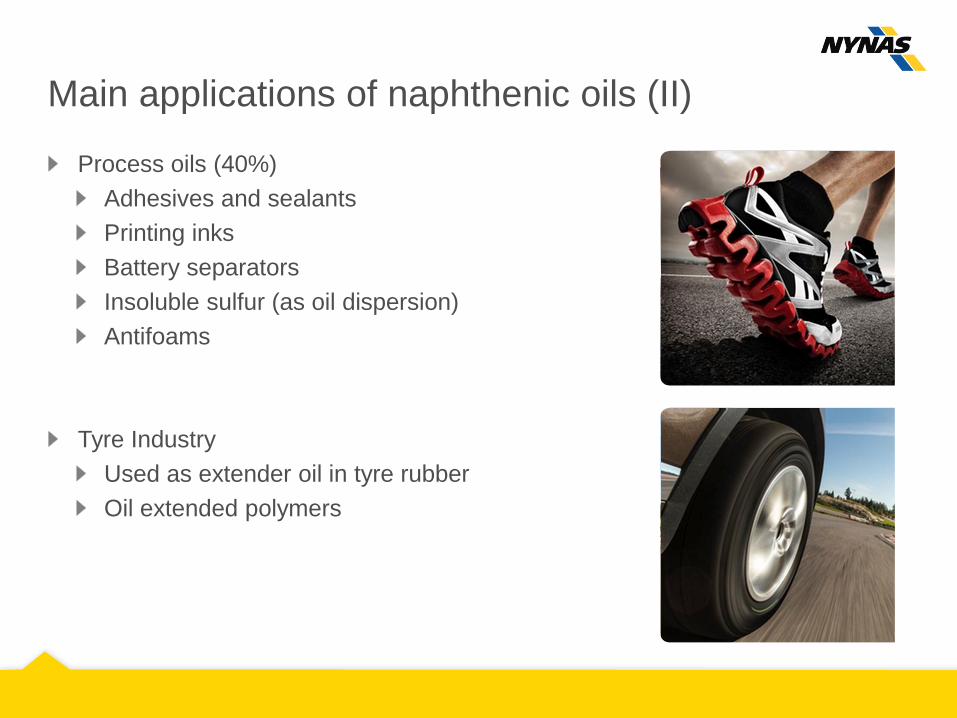
Main applications of naphthenic oils (II)
Process oils (40%)
Adhesives and sealants
Printing inks
Battery separators
Insoluble sulfur (as oil dispersion)
Antifoams
Tyre Industry
Used as extender oil in tyre rubber
Oil extended polymers

Evolution of the global base oil pool
51%
28%
11%
1% 9%
2012
Group I
Group II
Group III
PAO
Naphthenic
44%
34%
11%
1% 10%
2014
Group I
Group II
Group III
PAO
Naphthenic
26%
48%
13%
1% 12%
2019 f’cast
Group I
Group II
Group III
PAO
Naphthenic
Source. SBA Consulting
The global base oil demand scenario is here assumed to remain around 36
M mt/pa for the period

What is driving the change?
Several supply related factors – external to the lubricant industry – have a
negative impact on Group I plants:
Mandatory clean low sulphur fuel investments
Clean base oil (low Sulfur, low polyaromatics)
Crude oil cost and availability
Refining economics
Of scale and of method/technology
“Technological paradox” Gr I more expensive to make
Thus, the Group II and III market is growing at the expenses of Group I oils,
which are required for industrial use
70% of all Group I is currently utilized for Industrial lubricants
30% remains in use in Automotive lubricants

The market will have to find a way to deal with an
unbalanced supply-demand situation
As base oils represent less than 1% of the
output of a fuel refinery, the fate of base oil
plants will mostly depend on operations
and viability of the “fuel mothership”
With a growing market and a good fit with
fuel strategies and crude flexibility, Group
II and III plants are generally in a better
position
With a shrinking market and production
cost disadvantages compared to Group II
and III, Group I plants have a more
challenging future
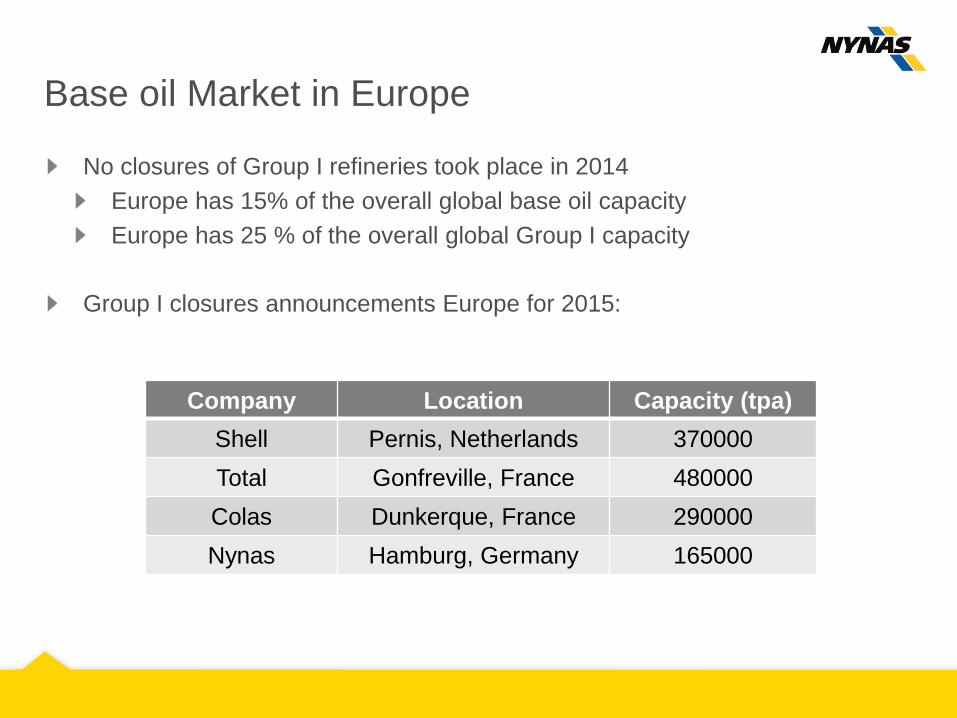
Base oil Market in Europe
No closures of Group I refineries took place in 2014
Europe has 15% of the overall global base oil capacity
Europe has 25 % of the overall global Group I capacity
Group I closures announcements Europe for 2015:
Company Location Capacity (tpa)
Shell Pernis, Netherlands 370000
Total Gonfreville, France 480000
Colas Dunkerque, France 290000
Nynas Hamburg, Germany 165000

The majority of Group I producers have an in-
house lubricant business to care for….
Lubricant producers, 89%
Non -lubricant producers, 11%
89% of the global base oil production thus originates from
producers that have an in-house lubricant business

The “collateral damage” of the paraffinic quality shift
Group II and III paraffinic oils are excellent base
stocks for the formulation of modern engine oils
However, Group II and III paraffinic oils display
lower solvency compared to Group I paraffinic
oils
Moreover, there is a limitation in the maximum
viscosity that can be reached in Group II and III
plants
Therefore, the shift from Group I to Group II and
III paraffinic oils will pose challenges to industrial
lubricant formulators, as it will lead to a loss of
solvency and viscosity range availability

The widening Solvency Gap
Solvency is an important property in most industrial
lubricant applications
In general, the base oil solvency affects the oil’s
capability of dissolving additives, oxidation products
and prevent varnish and deposit formation
In lubricating greases, the base oil solvency affects
the soap yield and the oil-soap interaction
In Metalworking fluid emulsions, the base oil
solvency affects the emulsion stability

The growing high viscosity deficiency
API group Light neutral Medium neutral Heavy neutral Brightstock
Group I 38% 13% 33% 16%
Group II 55% 25% 20% none
Group III 80% 20% none none
The ongoing shift in capacity will generate availability issues for heavy Solvent Neutrals and for Brightstock
This is already evident from the price development of Brightstock and SN 500/600 and Group II 500 SUS in markets across the regions

How is the market going to move away from Group I?
Conversion to Group II or Group III?
Conversion to Naphthenics ?
Conversion to Group II/III – Naphthenic blends?

Which are the most important base oil properties?
Viscosity (KV)
Viscosity Index (VI)
Solvency
Aniline Point (related to aromatic content)
CA Carbon Type (ASTM D 2140)
CA Carbon Type by FTIR
And, of course, availability – it must be available in the market

Solvent power / Solubility
Solvent power = The ability to solvate other molecules
Solubility = The ability of being dissolved by other molecules
From the user’s perspective, it affects:
Compatibility with polymers & resins
Pigment & filler wetting
Additive loading
Emulsion stability
Solution of impurities
Solution of oxidation products
Solvent molecule
Solute molecule

The oil solvent power in the Technical Data Sheet
Properties & Measurements:
Aniline point
Aromatic content (CA)
Naphthenic content (CN)
Viscosity
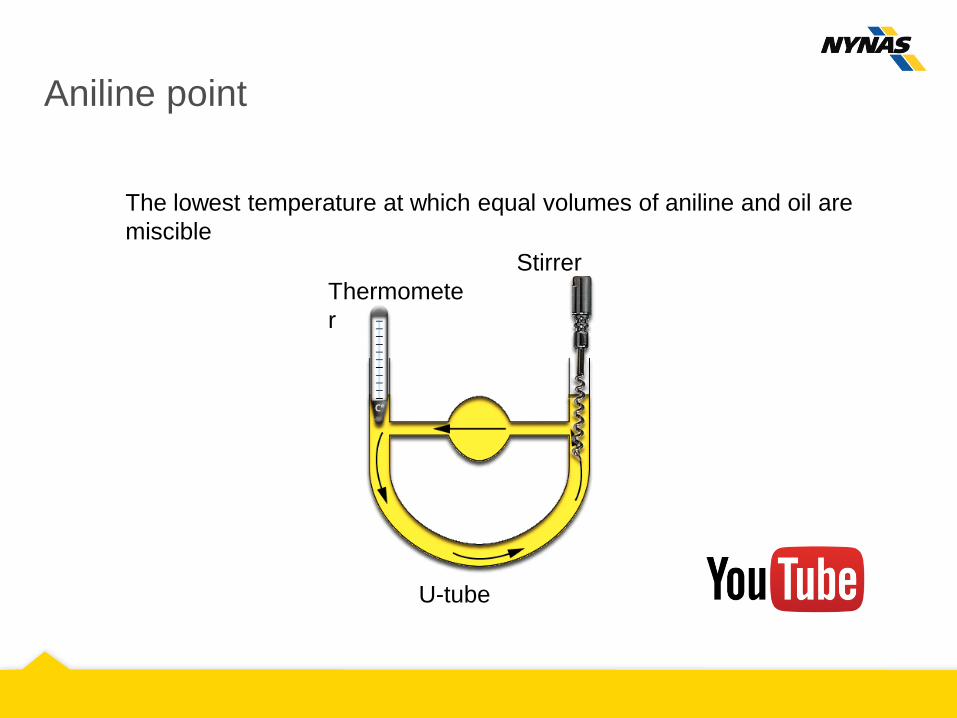
Aniline point
Thermomete
r
Stirrer
U-tube
The lowest temperature at which equal volumes of aniline and oil are
miscible

Aniline point
— 90ºC
— 80ºC
— 70ºC
— 60ºC
— 50ºC
— 40ºC
— 30ºC
— 20ºC
— 10ºC
— 0ºC
68ºC —
— 90ºC
— 80ºC
— 70ºC
— 60ºC
— 50ºC
— 40ºC
— 30ºC
— 20ºC
— 10ºC
— 0ºC
68ºC —
— 90ºC
— 80ºC
— 70ºC
— 60ºC
— 50ºC
— 40ºC
— 30ºC
— 20ºC
— 10ºC
— 0ºC
68ºC —
— 90ºC
— 80ºC
— 70ºC
— 60ºC
— 50ºC
— 40ºC
— 30ºC
— 20ºC
— 10ºC
— 0ºC
68ºC —

Aniline point
Aniline is a polar solvent
The lower the “point” temperature:
The more ”polar” the oil
The higher the solvent power
Substantial overlap between
Group I and Naphthenics
— 140ºC
— 130ºC
— 120ºC
— 110ºC
— 100ºC
— 90ºC
— 80ºC
— 70ºC
— 60ºC
— 50ºC
— 40ºC
— 30ºC
— 20ºC
Aromatic oils
Naphthenic oils
Paraffinic oils
Increasing
solvent power

CA (ASTM D 2140 method)
X
X
Increasing
solvent power
CA = 12 %

Aromatic content (CA)

Solubility comparison

Solubility comparison

Solubility comparison

Solubility comparison

Effect of CN and viscosity on solvent power
A higher naphthenic content (CN) contributes to a higher solvent power
The lower the viscosity, the higher the solvent power

Nynas Oils and Group I Replacement – the
new speciality base oil range

A new specialty base oil product range
Can be widely applied in industrial lubricant formulations
Main advantages of the New Range (NR)
Most similar (and available) product to Group I oils
High degree of flexibility in blending Optional tailor-made blends readily available
Superior low temperature performance
Main challenges vs Group I base oils
Slightly higher volatility
Lower flash point
Slightly lower VI
Lower Sulphur content

Basic requirements of the New Range
The New Range range should:
Closely match the Kinematic Viscosity (@ 40 °C) and Aniline Point of a
representative reference base oil range of Solvent Neutral (SN) Group I
paraffinic base oils
Allow industrial lubricant manufacturers to maintain key properties of their
products
Allow direct replacement, with as little re-formulation and re-working of
labels, PDS and other marketing material as possible (drop-in replacement)
…Or allow for as easy reformulation work as possible

Viscosity Range Limitations Overcome
Viscosity at 40 °C (cSt)
API Group
Group III
Group II
Group I
50 100 200 300 400 500 600 700 2500
Gr. III
Group II
Group I Viscosity at 40 °C (SUS)
7 20 40 58 80 100 115 140 500
New fluid range
Heavy Naphthenics
Bright Stock

The New Range vs. SN reference base oils

The New Range (NR) vs. SN reference base oils
NR 70 SN 70 NR 100 SN 100 NR 150 SN 150 NR 300 SN 300 NR 500 SN 500 NR 600 SN 600
Density (kg/m3) 0,873 0,849 0,867 0,859 0,871 0,868 0,886 0,876 0,889 0,879 0,876 0,880
FP COC (°C) 168 190 196 206 222 224 220 258 242 262 268 278
PP (°C) -27 -12 -24 -18 -24 -18 -21 -18 -21 -9 -15 -9
Viscosity @40 °C (cSt) 14 12 22 17 30 30 60 58 100 94 120 115
Viscosity @100°C (cSt) 3,1 2,9 4,2 3,7 5,0 5,2 7,3 7,8 10,2 10,7 12,6 12,2
VI 67 92 88 104 89 103 80 98 79 97 98 96
Aniline Pt. (°C ) 90 90 100 98 101 102 103 109 111 115 123 117
Sulfur (m-%) 0,02 0,2 0,01 0,2 0,04 0,2 0,02 0,2 0,03 0,3 0,02 0,3
CA 3 7 2 3 3 3 4 3 3 2 2 3
CN 42 27 36 32 35 33 36 32 36 31 30 29
CP 55 66 62 65 62 64 60 65 61 67 69 68
Refractive index 1,477 1,468 1,475 1,472 1,479 1,477 1,485 1,481 1,487 1,483 1,481 1,483

The New Range ISO VG vs. SN reference base oils
NR
ISO VG 32 SN 150 NR
ISO VG 46 SN 300 NR
ISO VG 68 SN 500 NR ISO VG
100 SN 600
Density (kg/m3) 0,866 0,868 0,872 0,876 0,874 0,879 0,875 0,880
FP COC (°C) 212 224 224 258 232 262 247 278
PP (°C) -18 -18 -18 -18 -18 -9 -21 -9
Viscosity @40 °C (cSt) 32 30 46 58 68 94 100 115
Viscosity @100°C (cSt) 5,3 5,2 6,7 7,8 8,75 10,7 11,1 12,2
VI 96 103 97 98 100 97 95 96
Aniline Pt. (°C ) 105 102 110 109 115 115 121 117
Sulfur (m-%) 0,02 0,2 0,02 0,2 0,02 0,3 0,02 0,3
CA 1 3 3 3 2 2 1 3
CN 31 33 31 32 31 31 31 29
CP 68 64 66 65 67 67 68 68
Refractive index 1,476 1,477 1,478 1,481 1,479 1,483 1,480 1,483

Technical evaluation of the Group I
replacement base oils

Some important base oil properties investigated
Two of the important properties of the new base oils are
Low temperature behaviour
Investigated as Pour Point measurements
Compatibility of seals and O-ring material
Examined in an elastomer material compatibility study
Some preliminary conclusions
The low temperature behaviour of the new base oils was very favourable
Low Pour Points were reached at -50% lower treat rate of Pour Point
depressant (PPD) additive
Seal materials generally changed very little when tested in the new base oils,
and compared to Group I base oil and hydraulic fluids
Small changes of rubber hardness and swelling

Hydraulic Fluids based on the new base oils

Formulation of Model Hydraulic Fluids I
Hydraulic fluids are mainly composed of
Base oils (ca 98.5%)
An additive package (anti-oxidant, anti-wear, rust & corrosion
inhibition, anti-foam) ca 1.0 %
Viscosity Index Improvers (VII) (in HV only) and Pour Point
Depressants (PPD) ca 0.5%
Viscosities (KV@ 40 °C) range from 15 cSt to 100 cSt
The largest market volumes are in ISO VG 46 and ISO VG 32

Formulation of Model Hydraulic Fluids II
We have made a series of hydraulic fluids based on the new base oil
range
All important properties measured and compared to technical
standards and existing commercially available products
Blending with existing products
All key properties were comparable
The test fluid were compatible with the existing fluids
Our screening studies support our design idea for Group I replacement
base oils

Summary
A new Group I replacement base oil range has been created
This is targeted towards industrial and metalworking lubricants
The key design parameters were viscosity and solvency
Lab trials were conducted to elucidate
PPD expression
Elastomer (seal and O-ring) material compatibility
Several model hydraulic fluids were created, and:
Benchmarked vs leading commercially
available fluids
Evaluated vs technical standards
Evaluated vs elastomer compatibility
Our lab trials and evaluations strongly
support the utilization of Nybase in hydraulic fluids

Nynas Group Head Office
P.O. Box 10700
SE-121 29 Stockholm
Sweden
Tel. +46-8-602 12 00
Fax +46-8-91 34 27