Embed Size (px)
Citation preview
AEDC-TR-71-39 Unclassified APR 14 1971
JUNI 1971
("O i* -
PRESSURE-VOLUME-TEMPERATURE
RELATIONSHIPS OF GASES .
VIRIAL COEFFICIENTS.
J. M. H. Levelt Sengers, Max Klein, and John S. Gallagher
Heat Division National Bureau of Standards
Washington, D. C.
March 1971
This document has been approved for public release and sale; its distribution is unlimited.
PBOPBKPY OP 0 s AIR FOHCB AEDC LIBSASY
P40600^7a=Cr.00OS
ARNOLD ENGINEERING DEVELOPMENT CENTER
AIR FORCE SYSTEMS COMMAND
ARNOLD AIR FORCE STATION, TENNESSEE
Unclassified
i.3?5
in 0 ; to 5 i ^ n : roi
I ° ä ; o ! n
CO
► 8
o

mm When Ü. S. Government drawings specifications, or other data are used for any purpose other than a definitely related Government procurement operation, the Government thereby incurs no responsibility nor any obligation whatsoever, and the (act thai the Government may have formulated, furnished, or in any way supplied the said drawings, specifications, or other data, is not to be regarded by implication or otherwise, or in any manner licensing the holder or any other person or corporation, or conveying any rights or permission to manufacture, use, or sell any patented invention that may in any way be related thereto.
Qualified users may obtain copies of this report from the Defense Documentation Center.
References to named commercial products in this report are not to be considered in any sense as an endorsement of the product by the United States Air Force or the Government.
AEDC TR-71-39
PRESSURE-VOLUME-TEMPERATURE
RELATIONSHIPS OF GASES
VIRIAL COEFFICIENTS
J. M. H. Levelt Sengers, Max Klein, and John S. Gallagher
Heat Division
National Bureau of Standards
Washington, D. C.
This document has been approved for public release and sale; its distribution is unlimited.
AEDC-TR-71-39
FOREWORD
The research reported herein was sponsored by the Arnold Engi- neering Development Center (AEDC), Air Force Systems Command (AFSC), under Program Element 61102F, Project Number 8951, Task 02. The work was done by the National Bureau of Standards, Washington, D. C., under Delivery Order {40-600)66-938 from July 1969 to October 1970. The manuscript was submitted for publi- cation on October 15, 1970.
The reproducibles used in the reproduction of this report were supplied by the authors.
This technical report has been reviewed and is approved.
Michael G. Buja Harry L. Maynard 1st Lt, USAF Colonel, USAF Research and Development Division Director of Technology Directorate of Technology
li

AEDC-TR-71-39
ABSTRACT
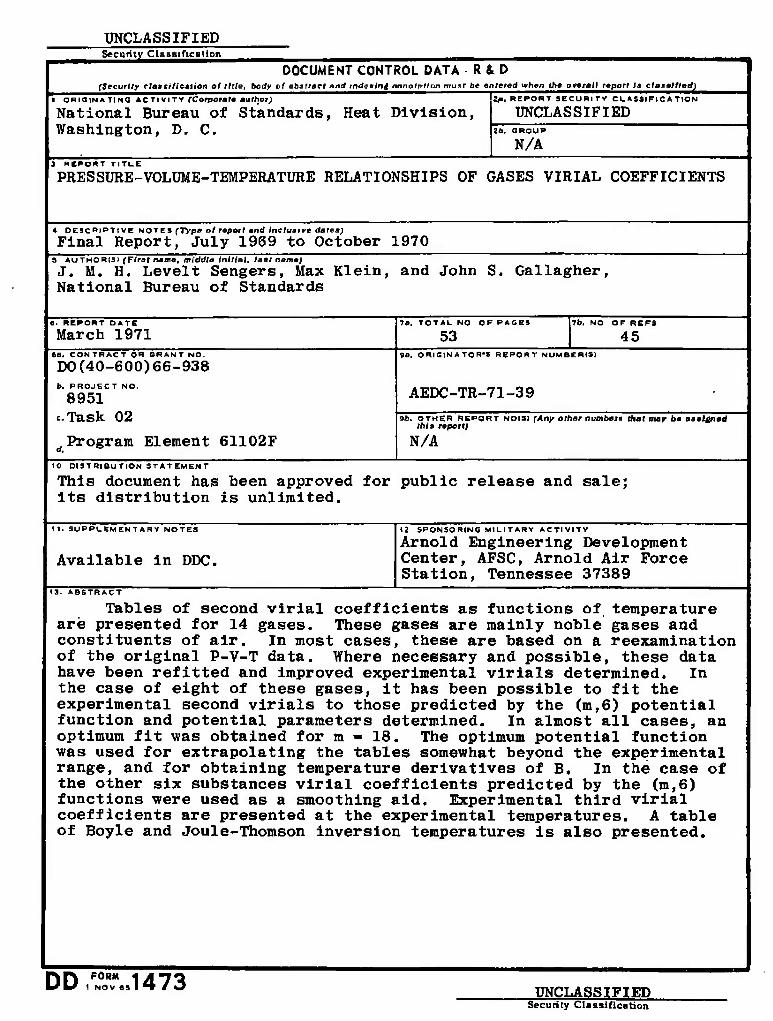
Tables of second virial coefficients as functions of temperature are presented for 14 gases. These gases are mainly noble gases and constituents of air. In most cases, these are based on a reexamination of the original P-V-T data. Where necessary and possible, these data have been refitted and improved experimental virials determined. In the case of eight of these gases, it has been possible to fit the experi- mental second virials to those predicted by the (m, 6) potential function and potential parameters determined. In almost all cases, an optimum fit was obtained for m = 18. The optimum potential function was used for extrapolating the tables somewhat beyond the experimental range, and for obtaining temperature derivatives of B. In the case of the other six substances virial coefficients predicted by the (m, 6) functions were used as a smoothing aid. Experimental third virial coefficients are presented at the experimental temperatures. A table of Boyle and Joule-Thomson inversion temperatures is also presented.
iii
AEDC-TR-71-39
CONTENTS
Page
ABSTRACT iii I. INTRODUCTION 1
II. METHODS USED 2 m. DISCUSSION 5
REFERENCES FOR TEXT 7 REFERENCES FOR TABLES 8
APPENDIXES
I. ILLUSTRATIONS
Figure
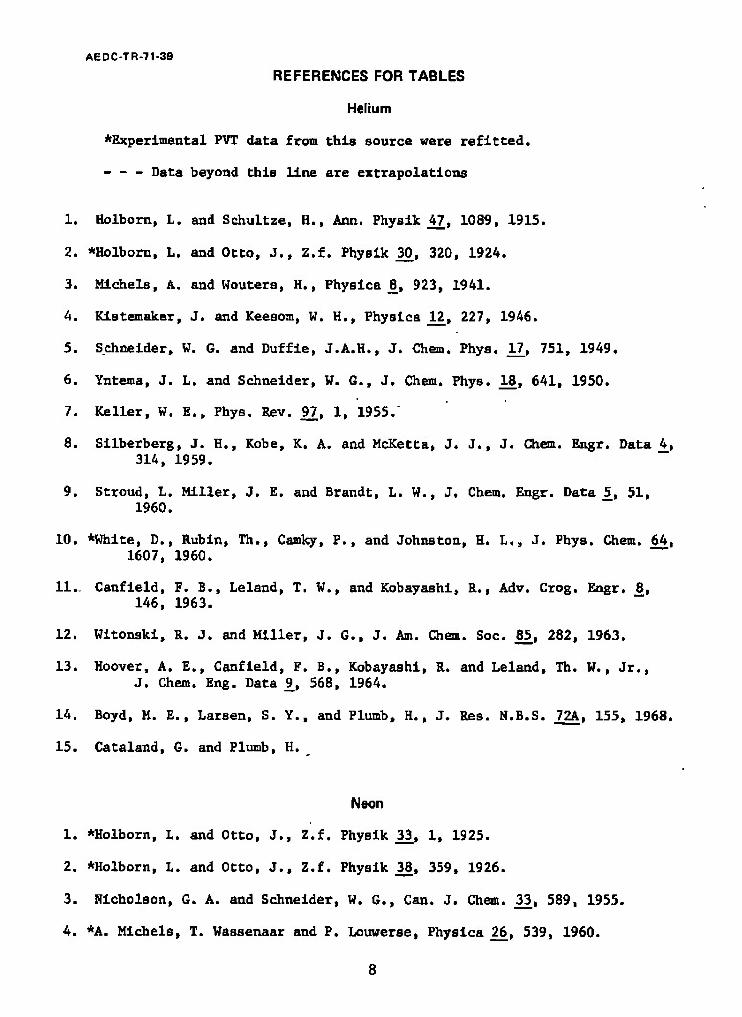
1. Deviation Plots for Helium (TL < 525°C) 15
2. Deviation Rots for Helium (T < -195°C) 16
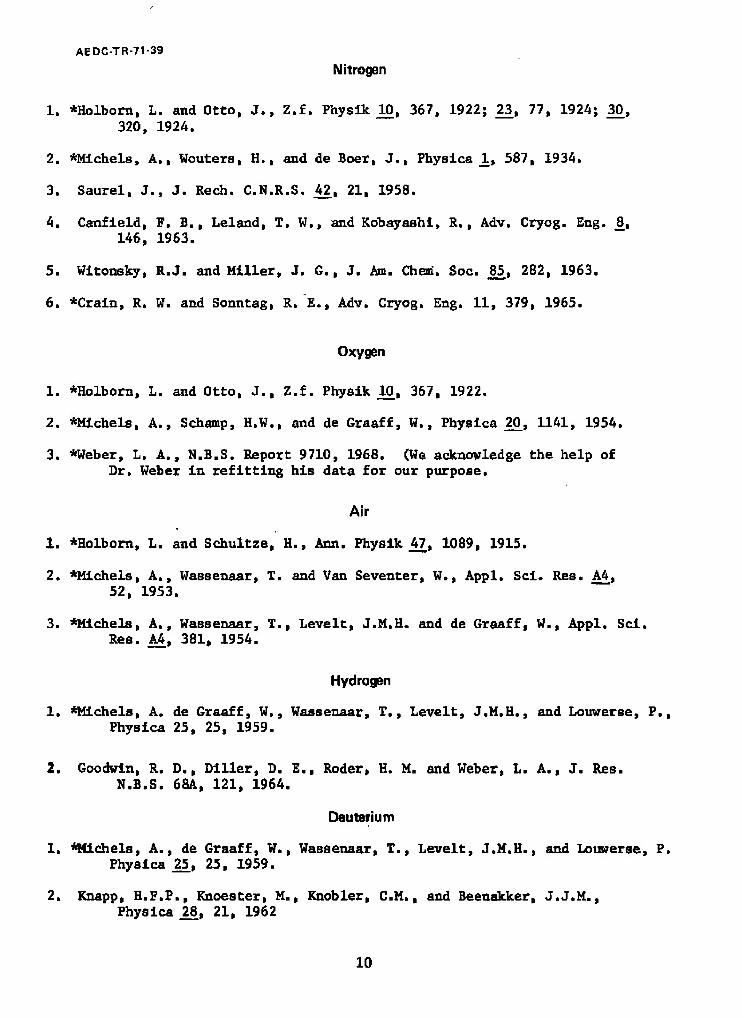
3. Deviation Plots for Neon 17
4. Deviation Plots for Argon 18
5. Deviation Plots for Krypton 19
6. Deviation Plots for Xenon 20
7. Deviation Plots for Nitrogen 21
8. Deviation Plots for Oxygen 22
9. Deviation Plots for Air 23
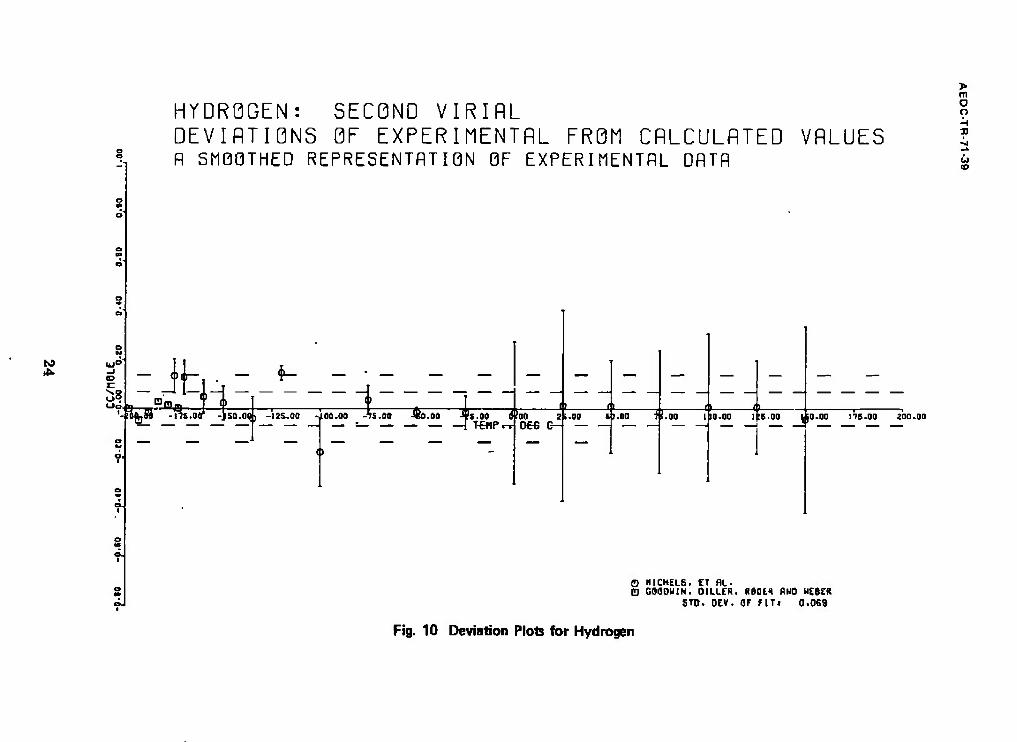
10. Deviation Plots for Hydrogen 24
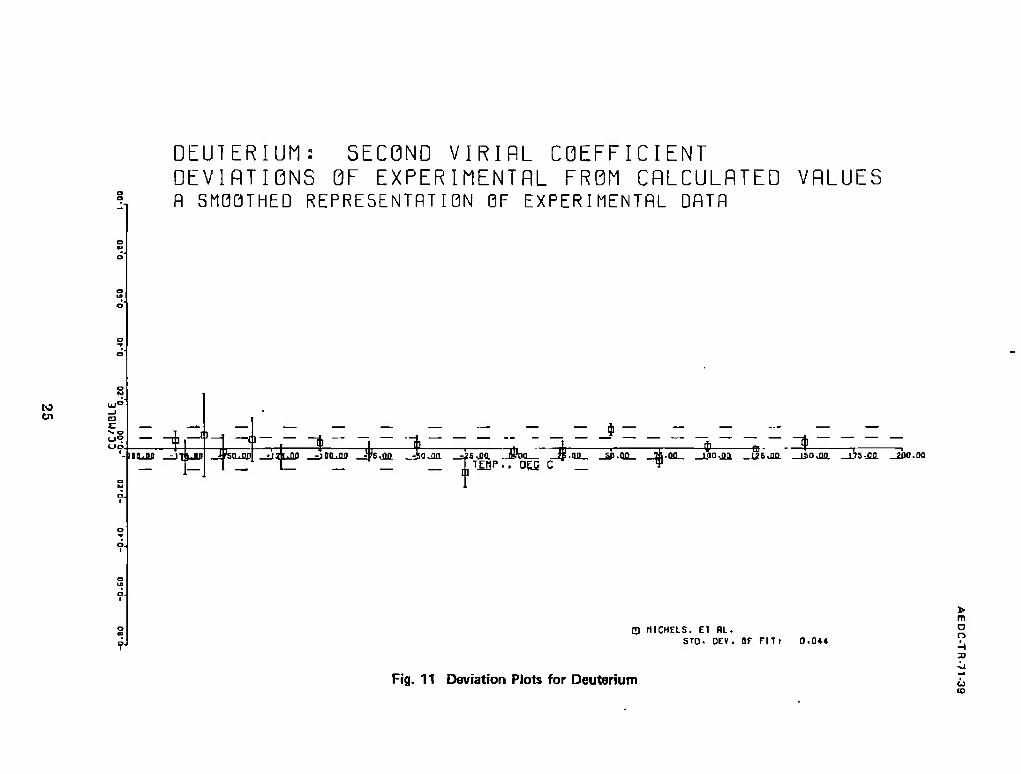
11. Deviation Plots for Deuterium 25
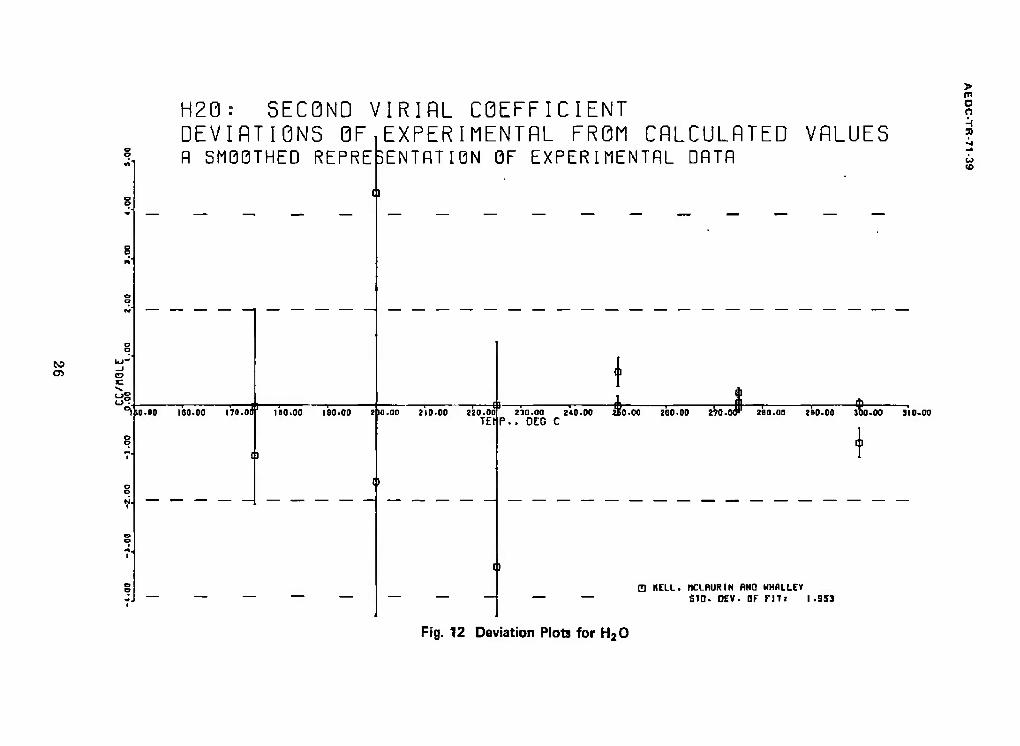
12. Deviation Plots for HaO 26
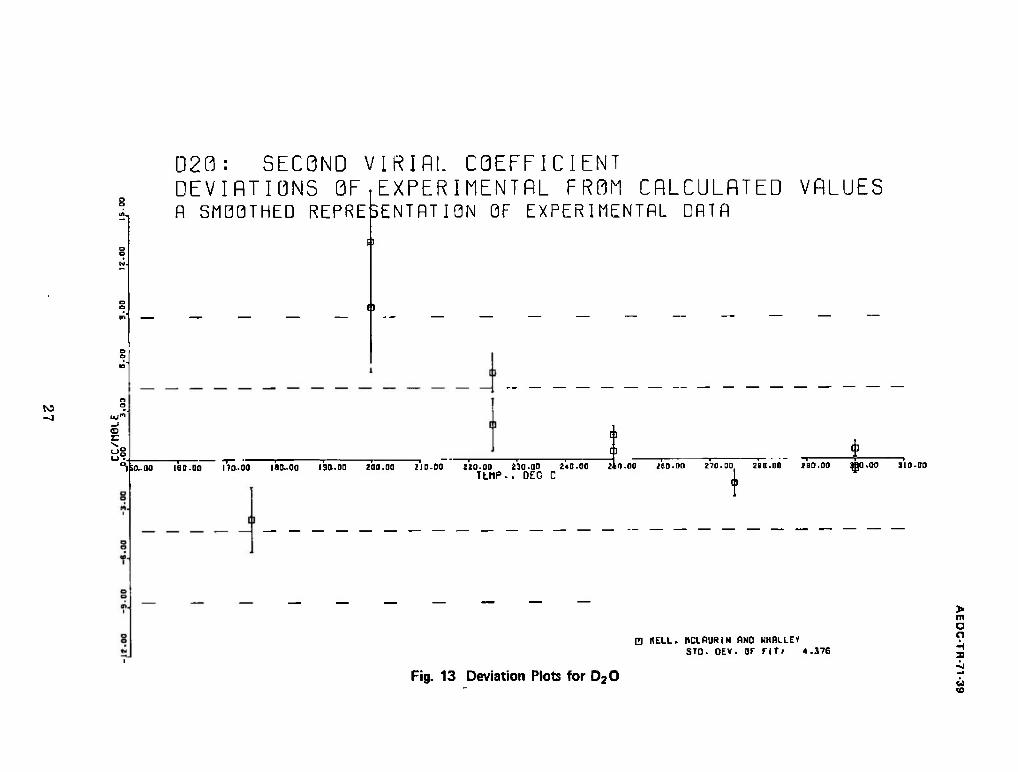
13. Deviation Plots for D20 27
14. Deviation Plots for CO2 (TL < 780°C) 28
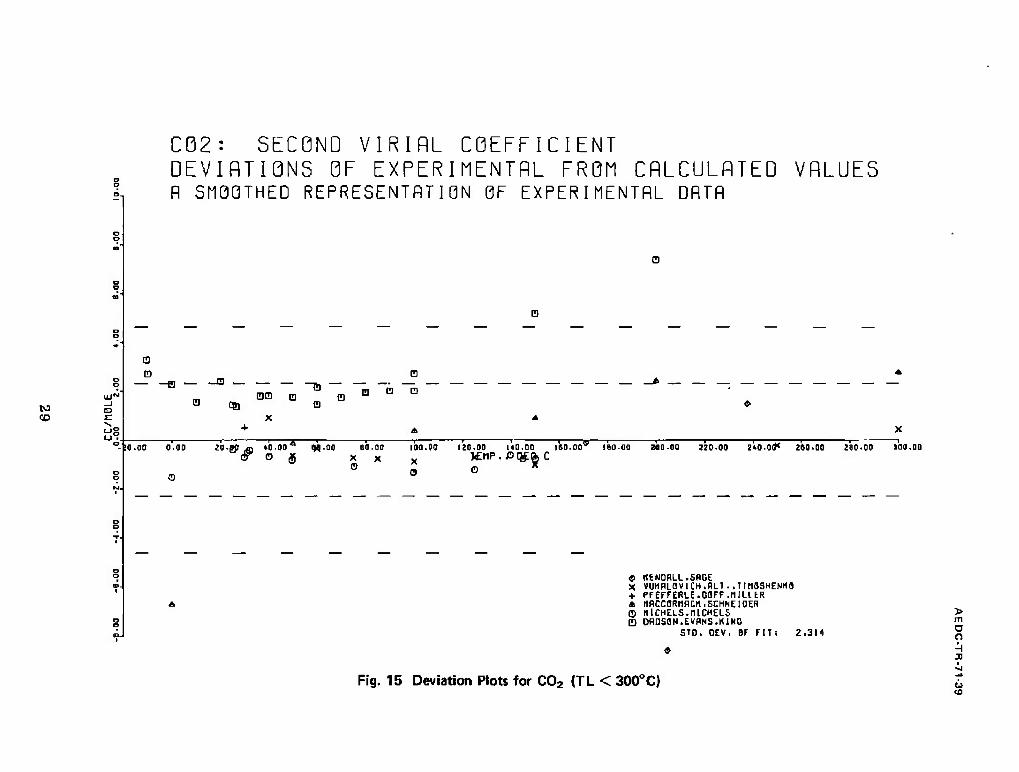
15. Deviation Plots for C02 (TL < 300°C) 29
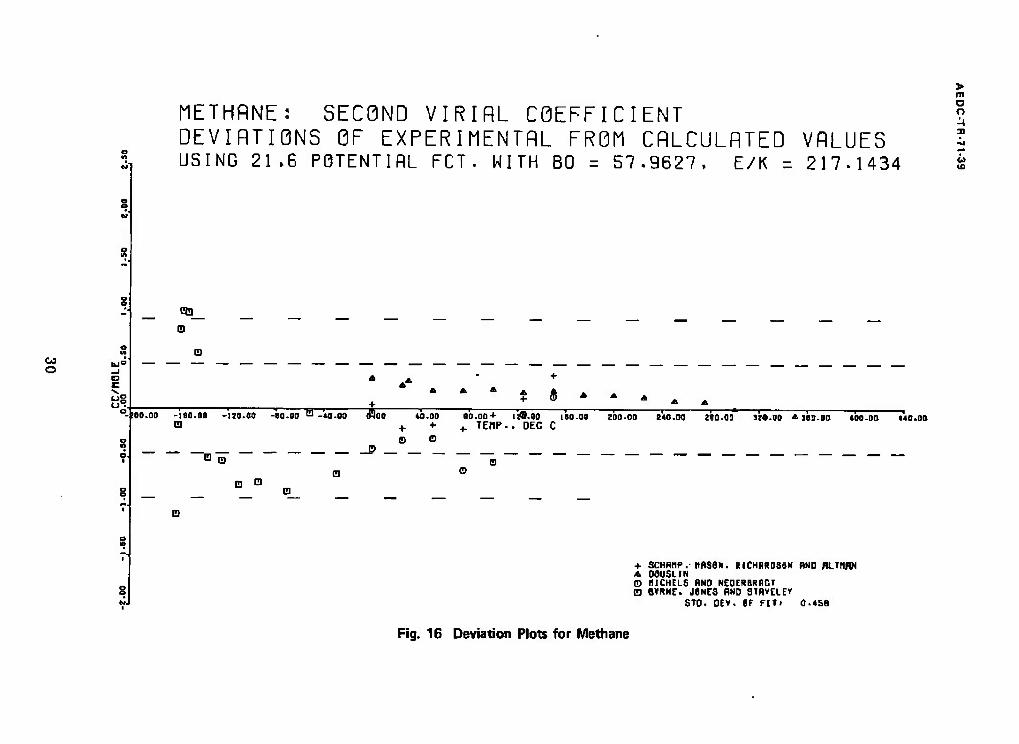
16. Deviation Plots for Methane 30
AEDCTR-71-39
II. TABLES Page
1. Relations between Volume and Pressure Virial Coeffi- cients 31
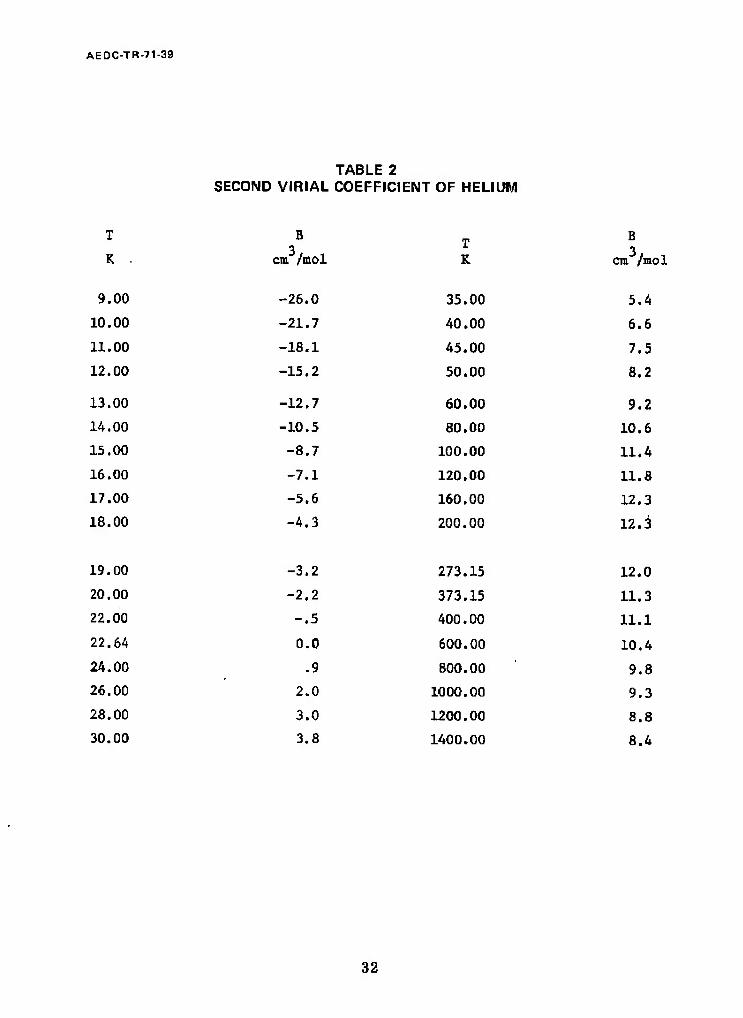
2. Second Virial Coefficient of Helium 32
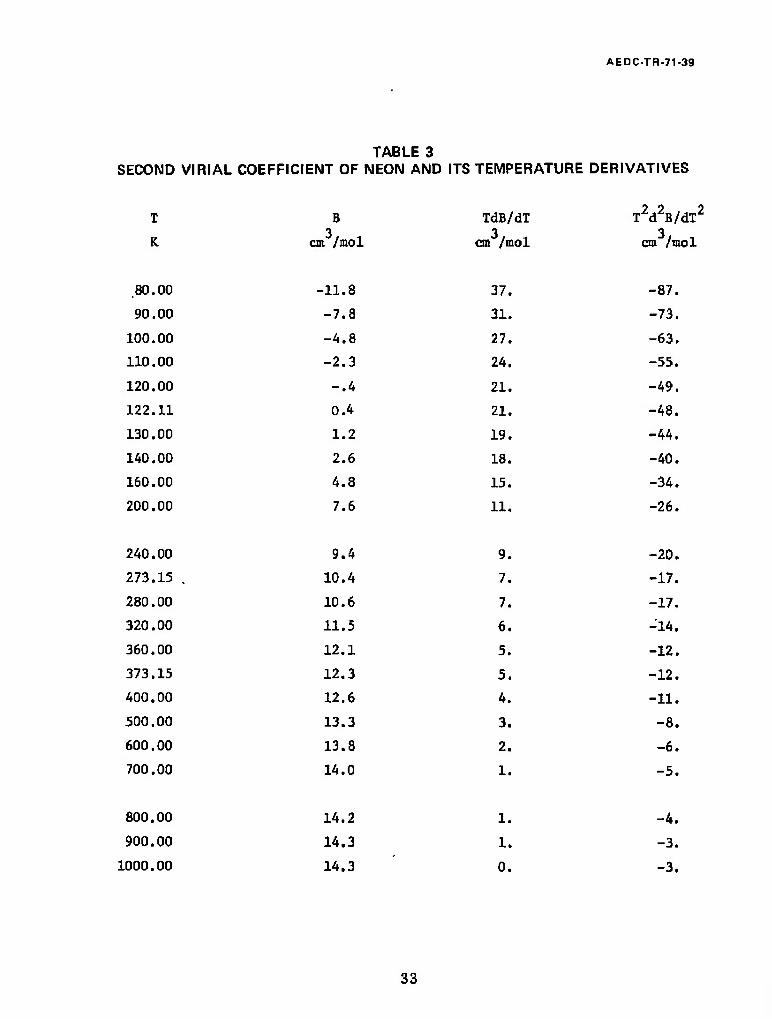
3. Second Virial Coefficient of Neon and its Temperature Derivatives. 33
4. Second Virial Coefficient of Argon and its Temperature Derivatives 34
5. Second Virial Coefficient of Krypton and its Tempera- ture Derivatives 35
6. Second Virial Coefficient of Xenon and its Temperature Derivatives 36
7. Second Virial Coefficient of Nitrogen and its Tempera- ture Derivatives ' 37
8. Second Virial Coefficient of Oxygen and its Tempera- ture Derivatives 38
9. Second Virial Coefficient of Dry C02-Free Air and its Temperature Derivatives 39
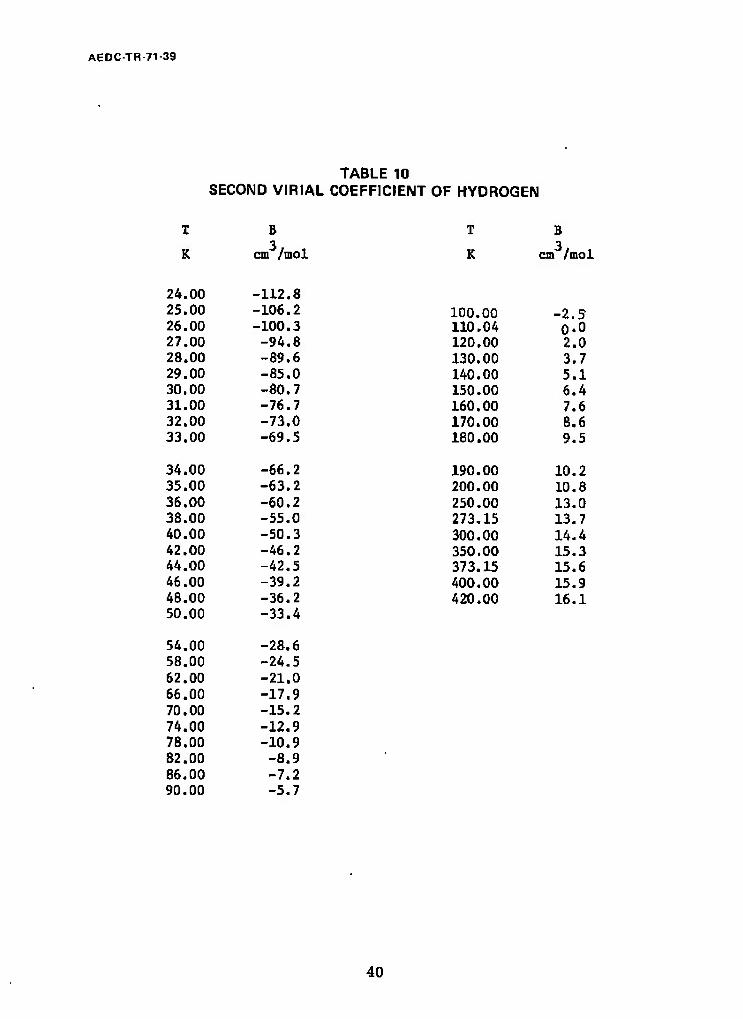
10. Second Virial Coefficient of Hydrogen 40
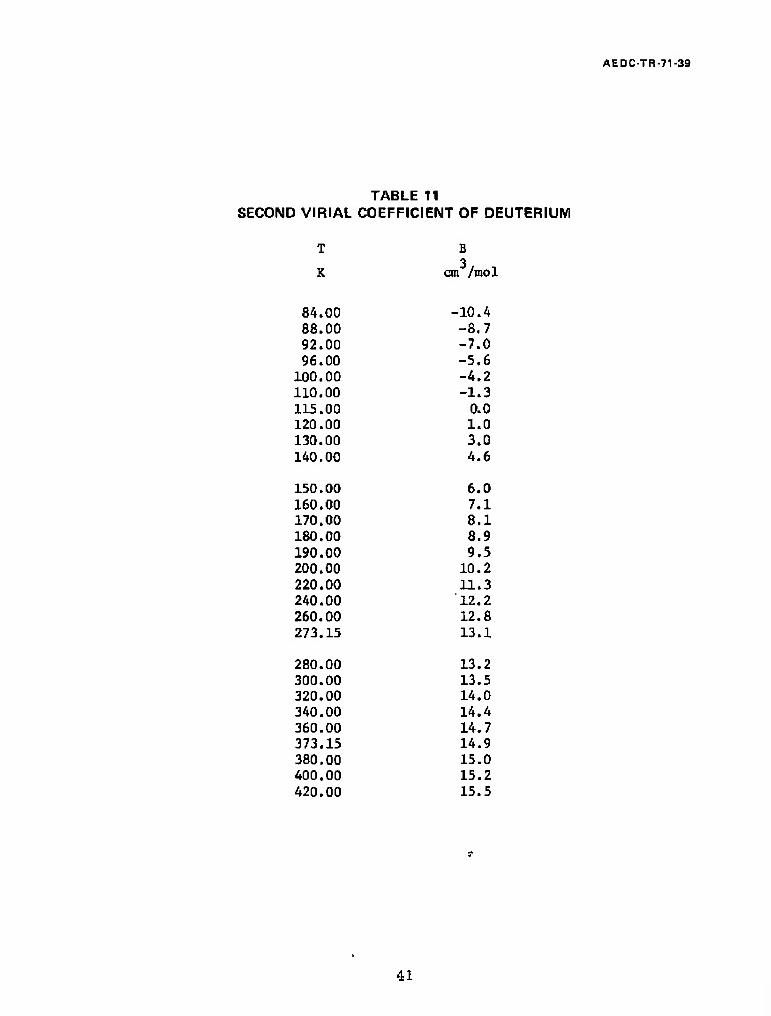
11. Second Virial Coefficient of Deuterium 41
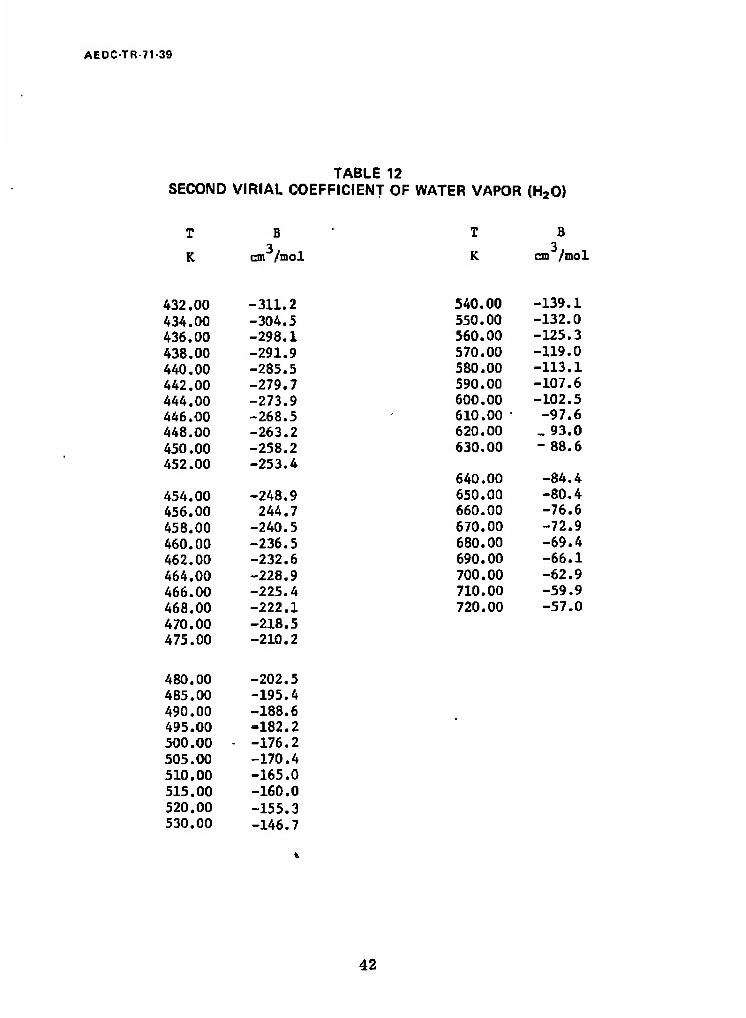
12. Second Virial Coefficient of Water Vapor (H20).... 42
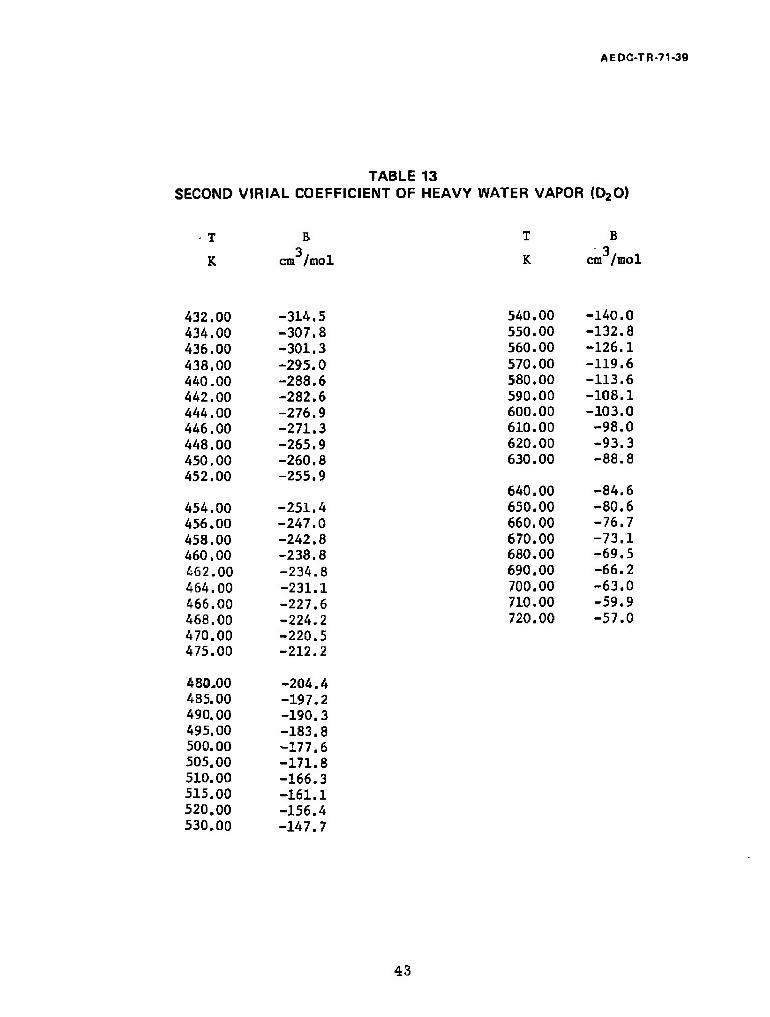
13. Second Virial Coefficient of Heavy Water Vapor <D20) 43
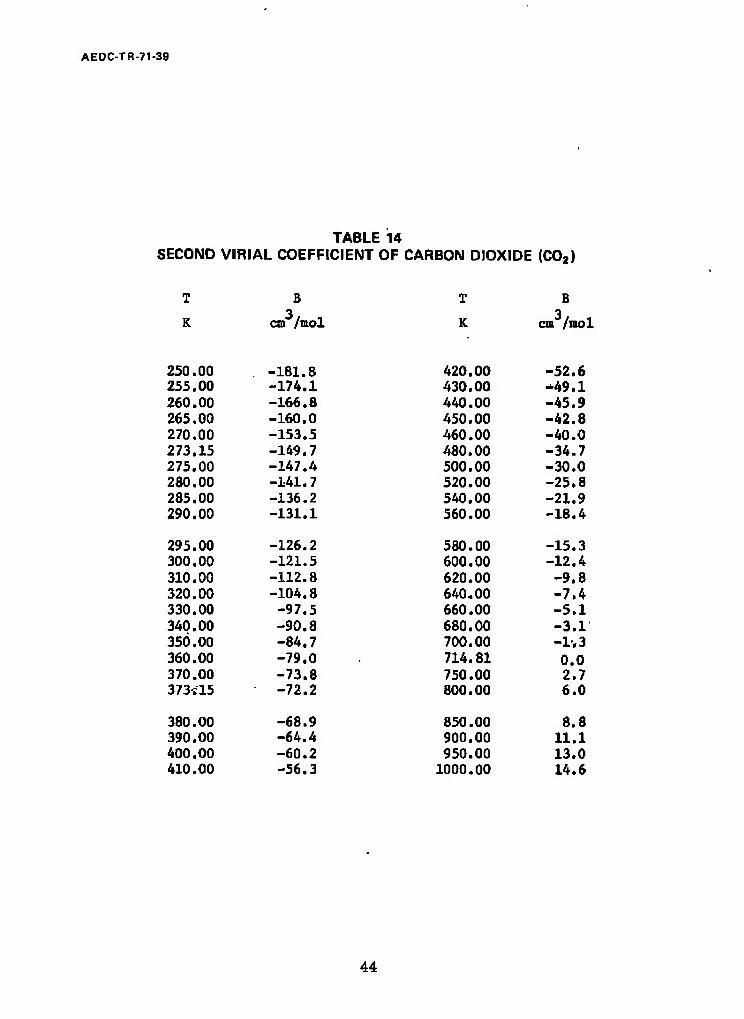
14. Second Virial Coefficient of Carbon Dioxide (CO2) . . 44
15. Second Virial Coefficient of Methane and its Tempera- ture Derivatives 45
16. Third Virial Coefficients of Various Substances ... 46
17. Boyle Temperature and the Inversion Temperature of Various Substances 47
18. Potential Parameters for the m-6 Potential of Selected Substances 47
vi
AEDC-TR-71-39
SECTION I INTRODUCTION
DEFINITION
Virial coefficients are the coefficients in the expansion of the com- pressibility factor PV of a gas in powers of the density 1/V:
PV - RT {1 + By/V + Cy/V2 + ...] (1)
or in powers of the pressure P:
PV = RT [1 + BpP + CpP2 + ...1 (2)
The density expansion is the more fundamental of the two. It can be proven that such an expansion exists for gases at moderate densities, and its con- secutive coefficients can be related to interactions between pairs, triplets ... etc. of molecules. 1 The pressure expansion Is often more practical, the pressure being more readily measured than the volume, but it usually converges slower and its coefficients are not as simply related to molecular interaction. In what follows, the emphasis will be on the expansion(l).
UNITS
The units of the virials depend on the units of volume (1) or pressure (2) chosen. We will express the volume in cm3/mol and give the virials in the corresponding units. However, a practical unit of volume frequently used is the Amagat unit; the volume in Amagat units is the ratio of the actual volume of a gas over the normal volume, I.e., that which it would occupy at 0*C and 1 atm (1.013250 bar). The normal volume for a mol of a real gas differs slightly from the normal volume V = 22,413.6 cm3/mol of a perfect gas, due to deviations from ideality at 0°C and 1 atm. The virial expansion used in con- junction with Amagat units of volume is:
PVA=AA + VVA+CA/VA2+"- (3)
Bv' Sr In Table 1, the virials B , C„; A., B., CA; are expressed in terms of
THEORETICAL INTEREST
Of great interest is the fundamental relationship of B , Cv, ... to the molecular interaction. If the molecular field is represented by a function <(i(r) where r specifies the relative coordinates of two molecules, then
BV(T)-| l(l-e-*W/kT)d? (4)
o
The virial B (T) is uniquely determined through (4) if the molecular interaction 4>(r) is known but the reverse is not true. Higher virials can be likewise

AEDC-TR-71-39
related to interactions between triplets, etc., of interacting molecules. These expressions for the higher virials are less useful in practice, not only because the higher virials are poorly known experimentally, but also because the influence of potential function non-additivity1 on these virials is poorly known theoretically. We have used the relationship (4) between second virial and potential function for smoothing the experimental B(T) values, for obtaining derivatives dB/dT, d2B/dT2, and where reasonable, for extrapolating the B(T) tables beyond the temperature range where experimental data are available.
PRACTICAL IMPORTANCE
The virials B and C represent the initial deviations of the equation of state from ideality as a gas is compressed, (1,2). Functions of these virials serve to estimate the initial density dependence of thermodynamic properties. Thus, the internal energy U. » D(V, T) - U(«, T) is given by
T ^y T ^y V"RTV dT +
2V2 dl +<" ' \
Similar expressions are valid for other thermodynamic functions.2
SECTION II METHODS USED ,;
DETERMINATION; ERRORS
Virial coefficients, in the majority of cases, are not directly measured but are obtained by analysis of PVT data of gases. The most common practice is a least-squares fit of the PV values along isotherms with either density or pressure as an independent variable. Using this procedure, the precision of the virials can then be obtained from linear least-squares estimates of their standard deviations. For a single experimental set in the very best cases, it may be better than .1 cmP/mol for B and 50 cm6/mol for C. However, virial data from different experiments usually differ by much more than their combined precision due to the presence of systematic errors. The main sources of systematic errors are:
1. Experimental: (a) errors in the value of RT because of temperature errors or the use of scales other than the thermodynamic scale; (b) systematic errors in the volume because of calibration problems and (c) difficulties with extrapolation to zero density, especially with data obtained by the Burnett method.3
2. Cut-off Problems: A finite polynomial has to be used rather than the theoretically correct infinite series (1,2) but errors arise if the powers omitted would have contributed in the density range studied.
To minimize systematic errors, if there was evidence that'there were any, we have refitted the experimental data when available. The data refitted
2

AEDC-TR-71-39
are indicated by asterisks in the literature reference for the tables. Wherever feasible, we reduced temperatures to the thermodynaraic scale, using the known relation between this scale and-the IPTS.1* If a laboratory maintains its own gas scale, this scale was used. In a few cases, notably He at low temperatures, where one of the purposes of the experiment was gas thermometry, we had to leave the intercept free. Regarding the cut-off criterion5» we chose the maximum density range in which the (k + l)th virial is necessary. In cases where it could not be obtained from the data, we used the theoretical value as calculated for the Lennard-Jones 6-12 potential. This procedure was justi- fied since only order of magnitude estimates were needed.
After second and third virials had been obtained from each set of experi- mental data for a given substance, and after obviously wrong results had been eliminated, a smoothing or averaging procedure was established. Use was made of the fundamental relation (4) between the second virial coefficient and the intermolecular potential.
POTENTIAL FUNCTIONS-DETERMINATION, USE
Equation (4) applies to substances for which quantum effects are negligible. For such substancesT^TW Is exact. Quantum effects become impor- tant for only the lightest gases", eig., helium, hydrogen, etc. These latter are generally referred to asvaijan£um gases. For such gases, (4) can only represent a first approximation whose quality goes down with decreasing molecular weight. In either case, I.e., whether (4) is exact or an approxima- tion, the use of (4) requires a knowledge of the intermolecular potential function, $(r). In principle such functions can be obtained by direct quantum mechanical calculation. In practice, this procedure is not feasible even for the simplest system. This has required, in effect, the partial reversal of the process. Thus, instead of using (4) with a known function <{>(r) to predict B(T), one uses (4), in part, to produce information on <J>(r) and, in part, to predict B(T). This is done by assuming a form for j» (r), (often referred to as a potential model), based on whatever fundamental knowledge there is, insert- ing a number of parameters in this form, (for example e and o of (5)), and varying the values of these parameters to obtain the best agreement between the B(T) values calculated from (4) and those determined from the analysis of PVT data described above. The predictive power of (4) remains essentially intact provided the number of experimental points used is far in excess of the number of parameters sought. Frequently used in this way to describe the intermolecular potential of simple nonpolar substances is the Leonard Jones 12-6 potential, a member of the more general class of spherically syymmetric m-6 potentials:
6/(m-6) m 6
♦«■&$ [(f> (f>] (5)
where e and o are parameters to be determined for each substance. This expression, with proper choice of m, adequately describes the Becond virial coefficient of simple nonpolar substances.
It should be noted that once a "best" set of parameters is decided upon, one has a potential function which can serve as a representation for the "actual" potential function appropriate to the gas of interest. The use of such potential functions need not be restricted to (4). They can also be used in various statistical mechanical theories for calculating macroscopic

AEDC-TR-71-39
thermodynamic quantities from molecular properties. In short, these potential functions have their own importance.
Various methods, of which the use of (4) is only one example, by means of which potential parameters are determined from experimental data have recently been subjected to close scrutiny.7 In that study it was determined that all reasonable three parameter potential models should produce essentially the same set of second virial coefficients. Because of this it was reasonable to fix on one particular model and we chose (5) for that purpose. A second result of the study of methods for determining potential parameters was the discovery of a reduced temperature range, for each property, over which that property cannot be used to distinguish between potential functions. For the second virial coefficient, this range is given approximately by 0.6<T/T <3.0. We have included a table (Table 17) of experimental Boyle temperatures oy
to facilitate the conversion of these numbers into experimental temperatures for the various gases studied. The second result mentioned states, in effect, that one should not use (4) with a potential function determined by data entirely contained in the Insensitive range to predict B(T) outside that range; nor should one use the resulting potential function in other theories. On the other hand, potential functions determined with data entirely outside the insensitive range can be used in an extrapolation to predict B(T) values within that range.
CONSTRUCTION OF THE TABLES
Using linear and nonlinear8 least squares techniques, calculated second virial coefficients based on the function (5) were fitted to the experimental second virial coefficient data for eight substances, Each value of m was taken to define a separate potential with e and a in (5) the adjustable parameters for the fit. The value of m was varied until the standard deviation of the fit was a minimum. The "best" m-6 potential was used to generate a table of B, T2dB/dT and T2 d2B/dT2 values at various temperatures. Furthermore, it was used for extrapolation beyond the range of experimental data. Such extrapola- tions are indicated in each case by a dashed line across the tables.
Equation (4) and the procedures described above were used for the quantum gases He, H2 and D2 as well. In these cases, however, the methods were used only to facilitate smoothing and interpolation of virial data. For H20, D20 and CO2 a potential of the form (5) was found to be inadequate. These substances were therefore treated as were the quantum gases; that is, the methods outlined were used only for smoothing and interpolation. The tables prepared for these six substances consist only of smoothed experimental B(T) values, with no extrapolations attempted. Tables of T dB/dT and T2 d2B/dT2 are not given nor are potential parameters used in the smoothing process reported since they are without clear meaning. Since the B(T) tables for these six substances are so closely tied to the experimental values, minor departures from smoothness in the tables may be detected.
Third virials, in all cases, were obtained by graphical interpolation of the (refitted) experimental values for C. They are summarized in Table 16.
Table 17 contains values for the Boyle temperature and the Inversion temperature. In those cases where the form (5) for the intermolecular poten- tial applies, the potential parameters and the value of m are summarized in Table 18.

AEDC-TR-71-39
We note that the optimum value of m is much closer to 18 than to the popular value of 12.
SECTION 111 DISCUSSION
ACCURACY OF TABLES
From a computational point of view, in all cases, the temperature spacing is sufficiently fine to allow for an interpolation to be made using a quadratic formula without the introduction of errors. Furthermore, linear interpolation can be used without Introducing an error of more than 0.3 cm3/mol in B(T) due to the neglect of quadratic terms. It should be noted that where B, TdB/dT, and T2 d2B/dT2 are available, a Taylor series expansion can be used for interpolation.
r
It is much harder to assess the absolute accuracy of the tables in any general way. Where data from many sources are available for one substance, as in the case for most of the noble gases and for nitrogen, one usually finds discrepancies up to 1.5 cm3/mol in B and up to 30% in C between data from different laboratories. Discrepancies in B may become much larger at temperatures below critical. The main source of oxygen data (L.A, Weber) is particularly precise, ~ 0.1 cm3/mol in B, and agrees with the others within combined precision. For hydrogen and deuterium, problems with the temperature scale between 100 and 273K may cause errors in B as large as .5 cm /mol. For H2O and D 0, there is only one source for which the precision ranges from several cm3/mol at the lower temperatures to .2 cm3/mol at the higher ones. For CO2, discrepancies of several cm3/mol in B exist between data of different sources, and for CH^, of 0.7 cm3/mol in B and of 10% in C.
USE OF THE TABLES *
The averaged virials presented here can be used for calculations of precise PV products at low pressures. However, in the process of separately averaging and rounding the second and third virials, correlations In their experimental errors have been obliterated; thus, they cannot be used to represent the PVT data from which they were derived within experimental precision over the entire density range. If precise PVT values are needed at higher densities it is usually preferable to interpolate in the original data.
The tables of virials and their temperature derivatives can be used to calculate the Initial density dependence of other thermodynamic properties.2
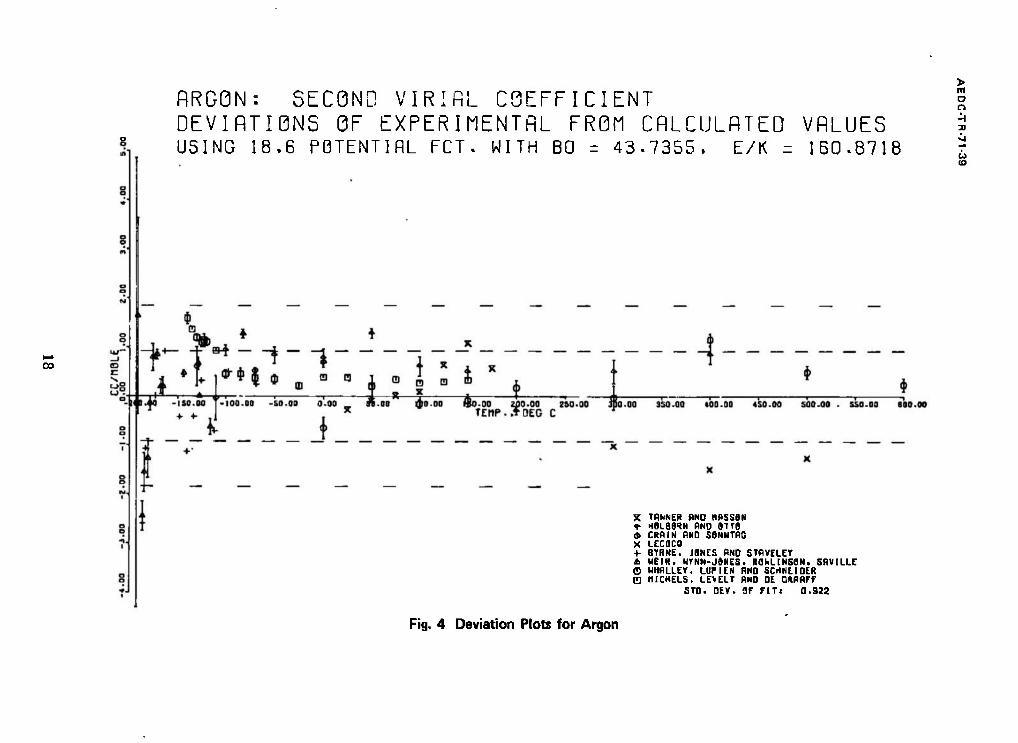
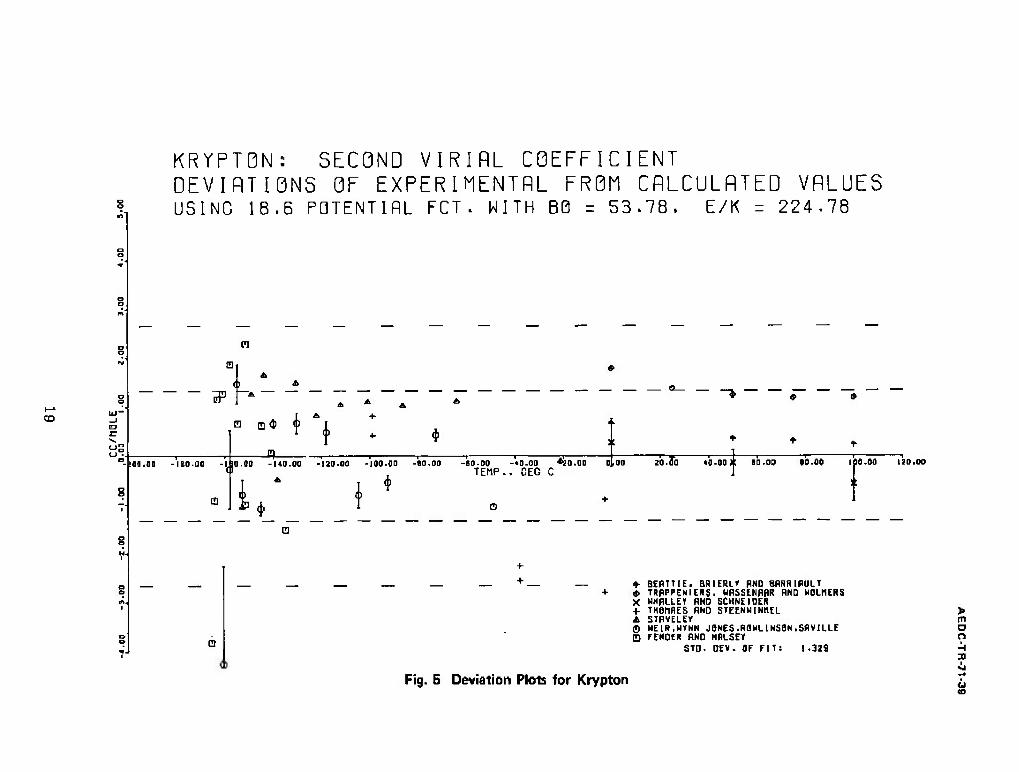
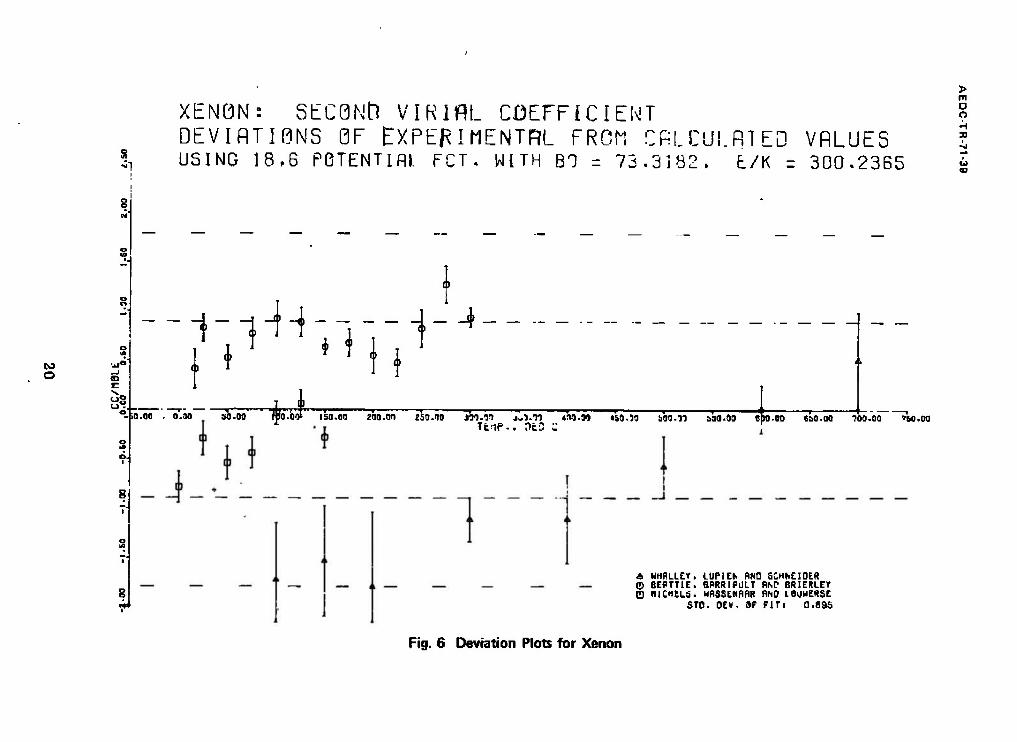
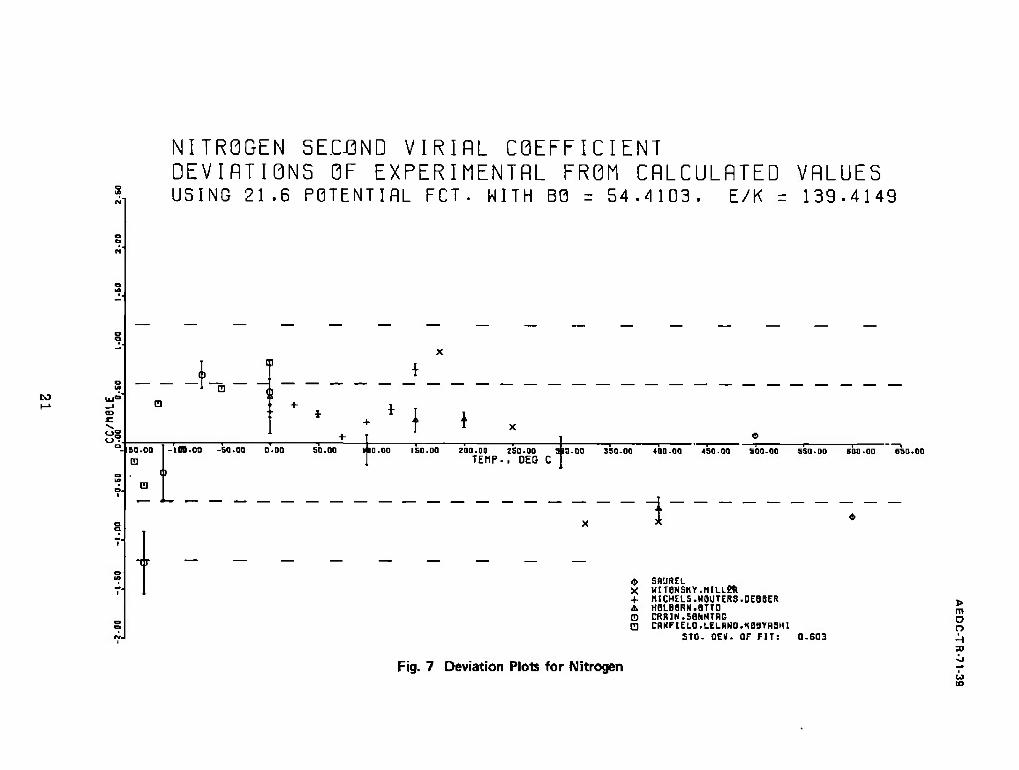
DISCUSSION OF THE DEVIATION PLOTS
Figures 1 through 16 contain plots of the deviations of "experimental" second virial coefficients from the tabulated values of Tables 2-15. In some cases, error bars are presented to indicate the estimated precision of the reported values. The figures also contain dashed horizontal lines to indicate the limits ±c and ±2a ,•the latter containing half as many dashed per unit length as the former.

I
AEDC-TR-71-39
In some instances, experimental values which differed from the least square representation by more than ±3o were deleted. In one or two instances such points were not deleted either because they were end points or, because there existed points in the same temperature range which differed from the least square fit by a slightly smaller (<3cr) amount of opposite sign. In the latter case the omission of these points would prejudice the fit in favor of other points of equal weight. Data from a laboratory which showed a strong systematic trend away from several other sets of data were not included in the fit and so do not appear in the plots.
It should be noted that where a representation derived from an inter- molecular potential function was used, that fact is contained in the figure caption. Where, for reasons already discussed, such a representation was not appropriate, the figure caption refers to the use of a smoothed representation of experimental data.
In two instances, namely helium and carbon dioxide, the experimental data cover such a large range that a second plot covering the low temperature range was included in order to present more detail in the range containing most of the data.
In many instances, there is a tendency for the data from several labora- tories to be internally consistent and highly precise but to differ from each other by much more than their combined precision. This is particularly dramatic in the case of xenon (Figure 6) and to a lesser extent for helium (Figure 1), neon (Figure 3) and carbon dioxide (Figure 15). this can be taken as an illustration of the difference between the precision of a measure- ment and its accuracy.
AEDC-TR-71-39
REFERENCES FOR TEXT
1. Hirschfelder, J.O., Curtiss, C.F., and Bird, R.B., "Molecular Theory of Gases and Liquids," Wiley Inc., New York, Chapter 3, 1954.
2. Appendix 3B of Reference 1.
3. Burnett, E. S., J. Appl. Mech., Trans. A.S.M.E. 58, A136, 1936. Hoover, A. E. Canfield, F. B., Kobayashi, R., and Leland, Th.W. Jr.,
J. Chem. Eng. Data 9_, 568, 1964.
4. Thomas, H. Preston and Kirby, C.G.M., Metrologia 4_, 30, 1968.
5. Sengers, J.M.H. Levelt, Proc. 4th Symposium Thermophyslcal Properties, A.S.M.E., p.37, 1968.
6. de Boer, J., Rep. Progr., Phys. 12, 305, 1948.
(S> l^S Klein, Max and Hanley, H.J.M., N.B.S. Technical Note 360; Trans Faraday Soc. 64, 2927 (1968).
8. Marquardt, D.W., J. Soc. Ind. Appl. Math. 11, 431, 1963.
AEDC-TR-71-39
REFERENCES FOR TABLES
Helium
♦Experimental PVT data from this source were refitted.
- - - Data beyond this line are extrapolations
1. Holborn, L. and Schultze, H., Ann. Physik 47. 1089, 1915.
2. *Holborn, L. and Otto, J., Z.f. Physik 30, 320, 1924.
3. Michels, A. and Wouters, H., Physics 8, 923, 1941.
4. Kistemakar, J. and Keesom, W. H., Physlca 12. 227, 1946.
5. Schneider, W. G. and Duffie, J.A.H., J. Chem. Phys. 17, 751, 1949.
6. Yntema, J. L. and Schneider, V. G., J. Chem. Phys. 18, 641, 1950.
7. Keller, W. E., Phys. Rev. 97» 1, 1955.
8. Silberberg, J. H., Kobe, K. A. and McKetta, J. J., J. Chem. Engr. Data 4_, 314, 1959.
9. Stroud, L. Miller, J. E. and Brandt, L. W., J, Chem. Engr. Data J), 51, 1960.
10. *White, D., Rubin, Th., Camky, P., and Johnston, H. L., J. Phys. Chem. 64, 1607, 1960.
11.. Canfield, F. B., Leland, T. W., and Kobayashi, R., Adv. Grog. Engr. 8, 146, 1963.
12. Witonski, R. J. and Miller, J. G., J. Am. Chem. Soc. 85, 282, 1963.
13. Hoover, A. E., Canfield, F. B., Kobayashi, R. and Leland, Th. W., Jr., J. Chem. Eng. Data 9, 568, 1964.
14. Boyd, M. E., Larsen, S. Y., and Plumb, H., J. Res. N.B.S. 72A, 155, 1968.
15. Cataland, G. and Plumb, H.
Neon
1. *Holborn, L. and Otto, J., Z.f. Physik 33, 1, 1925.
2. *Holbom, L. and Otto, J., Z.f. Physik 38, 359, 1926.
3. Nicholson, G. A. and Schneider, W. G., Can. J. Chem. 33, 589, 1955.
4. *A. Michels, T. Wassenaar and P. Louwerse, Physics 26, 539, 1960.
8

AEDC-TR-71-39 Argon
1. *Holborn, L. and Schultze, H., Ann. Physik 47, 1089, 1915.
2. *Holborn, L. and Otto, J., Z.f. Physik 23, 77, 1924.
3. *Holborn, L. and Otto, J., Z.F. Physik 30, 320, 1924.
4. Tanner, C. C. and Masson, I., Proc. Roy. Soc. A123, 268, 1930.
5.'*Michels, A. Wijker, H. and Wijker, H., Physica 15,627, 1949.
6. Whalley, E. Lupien, Y. and Schneider, W.G., Can. J. Chem. 31, 722, 1953.
7. *Michels, A., Levelt, J.M.H, and de Graaff, W., Physica 24, 659, 1958.
8. A. Lecocq, J. Rech. C.N.R.S. 50, 55, 1960.
9. *Crain, R. W. and Sonntag, R. E., Adv. Crog. Eng. 11, 379, 1965.
10. Weir, R. D., Jones, I. Wynn, Rowlinson, J. S. and Saville, G., Trans. Faraday Soc. 63, 1320, 1967.
11. Byrne, M. A., Jones, M. R., and Staveley, L.A.K., Trans. Faraday Soc. 64, 1747, 1968.
Krypton
1. *Beattie, J. A., Brierley, J. S. and Barriault, R. J., J. Chem. Phys. 20, 1613, 1952.
2. Whalley, E. and Schneider, W.G., Trans. A.S.M.E. 76, 1001, 1954.
3. Fender, B.E.F. and Halsey, G. D., J." Chem. Phys. 36, 1831, 1962.
4. Thomaes, G. and Van Steenwinkel, R., Nature 13, 160, 1962.
5. *Trappeniers, N.J., Wassenaar, T. and Wolkers, G. J., Physica 32, 1503, 1966.
6. Weir, R. D., Jones, 1. Wynn, Rowlinson, and Saville, G., Trans. Faraday Soc. 63, 1320, 1967.
7. Byrne, M. A., Jones, M. R., and Staveley, L.A.K., Trans. Faraday Soc. 64, 1741, 1964.
Xenon
1. *Beattie, J. M., Barriault, R. J., and Brierley, J. S., J. Chem. Phys. 19, 1219, 1951.
2. *Michels, A., Wassenaar, T., and Louwerse, P., Physica 20, 99, 1954.
3. Whalley, E. Lupien, Y., and Schneider, W. G., Can. J. Chem. 33, 633, 1955.
9
AEDC-TR-71-39
Nitrogen
1. *Holborn, L. and Otto, J., Z.f. Physik 10, 367, 1922; 23, 77, 1924; 30, 320, 1924.
2. *Michels, A., Wouters, H., and de Boer, J., Physical 587, 1934.
3. Saurel, J., J. Rech. C.N.R.S. 42, 21, 1958.
4. Canfield, F. B., Leland, T. W., and Kobayashl, R., Adv. Cryog. Eng. 8, 146, 1963.
5. Wltonsky, R.J. and Miller, J. G., J. Am. Chem. Soc. 85, 282, 1963.
6. *Crain, R. W. and Sonntag, R. E., Adv. Cryog. Eng. 11, 379, 1965.
Oxygen
1. *Holborn, L. and Otto, J., Z.f. Physik 10, 367, 1922.
2. AMichels, A., Schamp, H.W., and de Graaff, W., Physica 20, 1141, 1954.
3. *Weber, L. A., N.B.S. Report 9710, 1968. (We acknowledge the help of Dr. Weber in refitting his data for our purpose.
Air
1. *Holborn, L. and Schultze, H., Ann. Physik 47. 1089, 1915.
2. *Michels, A., Wassenaar, T. and Van Seventer, W., Appl. Sei. Res. A4, 52, 1953.
3. *Michels, A., Wassenaar, T., Levelt, J.M.H. and de Graaff, W., Appl. Sei. Res. A4, 381, 1954.
Hydrogen
1. *Michels, A. de Graaff, W., Wassenaar, T,, Levelt, J.M.H., and Louwerse, P., Physica 25, 25, 1959.
2. Goodwin, R. D., Diller, D. E., Roder, H. M. and Weber, L. A., J. Res. N.B.S. 68A, 121, 1964.
Deuterium
1. "Michels, A., de Graaff, W., Wassenaar, T., Levelt, J.M.H., and Louwerse, P. Physica 25, 25, 1959.
2. Knapp, H.F.P., Knoester, M., Knobler, CM., and Beenakker, J.J.M., Physica 28, 21, 1962
10

AEDC-TR-71-39
Water Vapor (H20)
1. Kell, G. S., McLaurin, G. E., and Whalley, E., J. Chem. Fhys. 48, 3805, 1968.
Heavy Water Vapor (D20)
1. Kell, G. S., McLaurla, G. E., and Whalley, E., J. Chem. Phya. 49, 2839, 1968.
Carbon Dioxide (C02)
1. Michels, A. and Michela, C, Proc. Roy. Soc. London A153, 201, 1935.
2. MacCormack, K. E. and Schneider, W. G., J. Chem. Phys. 18, 1269, 1950.
3. Kendall, B. J. and Sage, B. H., Petroleum 14, 184, 1951.
4. Pfefferle, W. C, Goff, J, A., and Miller, J. G., J. Chem. Phys. 23, 509, 1955.
5. Dadson, R. S., Evans, E. J., and King, J. H., Proc. Phys. Soc. 92, 1115, 1967.
6. Vukalovich, M. P. and Altunin, V. V., "Thermophysical Properties of Carbon Dioxide'.',United Kingdom Atomic Energy Authority Translation, Collet's Publishers, London and Wellingborough, England, 1968.
Methane
1. Michels, A. and Nederbragt, G. W., Physica 3.» 569» 1936-
2. Schamp, H. W., Mason, E. A., Richardson, A.C.B., and Altman, A., Phys. Fluids _1, 329, 1958.
3. Douslin, D. R., Progr. Int. Res. Therm. Trans. Prop. A.S.M.E. Princeton 1962, p. 135.
4. Byrne, M. A,, Jones, M. R., and Staveley, L.A.K., Trans. Faraday, Soc. 64, 1747, 1968.
11

AEDC-TR-71-39
APPENDIXES I. ILLUSTRATIONS
II. TABLES
13
HELIUM: SECOND VIRIHL COEFFICIENT DEVIATIONS OF EXPERIMENTAL FROM CALCULATED VflLUES fl SMOOTHED REPRESENTATION QF EXPERIMENTRL DflTR
tn ilili V
-ns.oo+ -IK.DOX -n
-t- +
7S.orf" 3 -IS-00 Tb.no 125.00 TEHP., OEG C
jf&.ob¥ ZZ5.00 Z75-0IB iJsTOB 375.045 415.00 47S.00MS .OH
U* 4--*--!-- M NITOMSKY RND MILLER V 5ILBERBERG. KBBE AND MCKETTR Z CHEN HHC SENGERS X YHTIMR BNO SCHNEIDER 4> MICHELS RND UBUTERS «> 5TRBN0. MILLER RNO BRANDT X CRNFIELQ. LELflfcD RND KBBRYRSHI 4 HeOVER.CflNFIELD.KaBRYRSHI.LELPhD A WHITE. RUOlN. CHIHIY RND JBKHSIQN O HBLBBRN HMD QTTB □ BBYD. LRRSEN RNO PLUHB
STD. QEV. Br Fit: 0.741
Fig. 1 Deviation Plots for Helium (TL < 525"C)
o o H

HELIUM: SECOND VIRIflL COEFFICIENT L0H TEMPERATURE DEVIATIONS QF EXPERIMENTAL FROM CALCULATED VALUES
Oi
i fl SMOOTHED REPRESENTATION 0F EXPERIMENTAL DRTfl
8
a o CM"
a
_l Q C 1
o !75.aa -270 Q°S.o ] -230 .00 -US.00 -att.fO -415.10 -230.
TälP.. DBB C 10 -425.00 -220. an -sis.oo -210.00 -jot.00 -200-00 -1
B Q
1 a
II J
1 "
S «.
. i
V
Q
± HMIT£, RUBIN, CfiHKr AND J8HNS1QN O HBLBBRN HNfl BTTB O 8QTD. LHRSE.N HMD PLUHB
»- STD. DtV. ÜT FITi 1.Z4B
> m D o H
u
135.00
Fig. 2 Deviation Plots for Helium (T < -195°C)
NEQN: SEC3ND V I R1 AL COEFFICIENT DEVIATIONS OF EXPERIMENTAL FROM CRI..LULRTE D VALUES USING 18,6 POTENTIAL FCT. WITH BO = 22.B251. E./K - 47.7351
1 "S "1° D 1 * E m a
!*0-00 1'200.4 10 -ISO.SO 110.00 -BO. 00 -«0.03 0.10 »9-90 69.OP 129-00 ISO.00 200-00 20-00 280.00 320.00 3G0.01 «90.00 TEMP.. OEG C
H 4- 4
A H31B8RN HMD 01TB © CR8MMELIN. tT PL. E niCHELS. HflSSENAflR AND LOjhLRSl
STO. OEV. 3f tilt 0.39i
Fig. 3 Deviation Plots for Neon
> m a n
ARGON: SECOND VIRIRL COEFFICIENT DEVIATIONS 0F EXPERIMENTAL FROM CALCULATED VALUES USING 18.6 POTENTIAL FCT. WITH BO = 43.7355. E/K = 160.8718
00
n
31 «I
CO
TANNER AND IWSSBfl H0LB83N AND 81TB CRAIN AND 59NHTAG LECOCO BYRNE. JANES AND STAVELEY HEIR. HrNN-jBMES. RQhLINSBN. SflVILLE WNfll.l.EY. LUPIEN AND SCHNEIDER NICKELS. LEVELT AND OE GftflAFF
STD. DEV. 3F FITt 0.322
Fig. 4 Deviation Plots for Argon
CD
KRYPTON: SECOND VIRIflL COEFFICIENT DEVIATIONS OF EXPERIMENTAL FROM CALCULATED VALUES USING 18.6 POTENTIAL FCT . WITH BO = 53.78, E/K = 224.78
r r) ~-,— i 1 1 1 -p 1—H 1" f 1 I I 1 -I 10.01) -140.00 -120-00 -100-00 -«0.00 -BD-00 -40.00 «20.00 Oj.00 10.00 40-00 X BO.00 00-00 IpO.OO 120.00
(l , TEriP., CEG C T mo.oo -iBo.no
* ffl
!!
O
* BEflTTIE. BRIERLr AND BflRfllflULT $ TRflPPENIEHS. UflSSENflfiR AND WOLHERS X UMRLLEr HND SCHNEIDER 4- THOnRES HNO STEENNINKEL A STPVELEr 0 HEIR.MYNN JONES. RAUL IMS6N.SHVILLE CO FENDER AND HRLSEY
STD. DEV. OF FIT: ].329
> m D O
Fig. 5 Deviation Plots for Krypton
XENON: SECOND VIRlflL COEFFICIENT DEVIATIONS 0F EXPEf? I MENTRL FROM CRLCUI.fllED VRLUES USING 18,6 POTENTIAL FCT. WITH BO = 73.3182. t/K = 300.2365
> m D O
u (D
CO O _i
<n E
u ■
• ■ * * * h 11 1
? -,0.00 sb.oo Ipo ISO.00 200.01) 250.00 jm.W Jvl-TJ 4^0.99 »iOOO bSO-T) iSQ-M 1 10-00 6b0.00 700.00 ?50.00
Tt:lP-. 0L0 w
,
4 UHflLL£Y, LUPIEf. RM) SCHNEIDE« ffi BEPTT1E. BPRR1PJLT AM? BRIESLEY ID flCHELd. HfiSSEHfiRK flNO L8jHEfiSE
STO. OE«. OF flTi 0,83b
Fig. 6 Deviation Plots for Xenon
to
NITROGEN SECOND VIRIflL COEFFICIENT DEVIATIONS OF EXPERIMENTAL FROM CALCULATED VALUES USING 21.6 POTENTIAL FCT. WITH B0 = 54.4103, E/K = 139.4149
+
i so.oo ID
□
-lBB.oo -so. aa o.oo 50.00
* 00 150.00 200.00 ZSO-00 aSO-00 3SD.00 400-00 450.00 SOO-DO 5S0-00 600-00 650.00
TEMP-, DEO C
1 « SaUREL X HLTeNSKY.HILLMl + niCHELS.H0UTERS.DE8BER A HBLB8RM.aTT0 0 CRfllN.SOhNTBG Q CHMFCELO.t.ELRNO.IBflYRSHI
STO. OEV. OF FIT: Q.6Q3
m O o
Fig. 7 Deviation Plois for Nitrogen

OXYGEN SECOND VIRIflL COEFFICIENT DEVIATIONS OF EXPERIMENTAL FROM CALCULATED VALUES USING 21.6 POTENTIAL FCT. WITH BQ - 44.4907, E/K - 172-9266
> m D n
CO
Us.
[[)
-.2! ilr OllSf JLsiJUi
•I >S. DO S-00 HE .00 - .-no 1||.00 TEHP.
35.00 . OEG
55.00 7».00 95 -oa 115.OS 135-00 158.00 ITS.00 18S-0O
A HlCHELS.SCHPnP.DEGIIRilFF O HBlBORH.aUB □ hCnERINSS BOULDER)
STO. DEV. Bf Flit 0.294
Fig. 8 Deviation Plots for Oxygen

HlR SECOND VIRIRL COEFFICIENT DEVIATIONS OF EXPERIMENTAL FROM CALCULATED VALUES USING 21.6 POTENTIAL FCT. WITH BO _ 50-9545. E/K = 147.7580
CO
Ö* -150.00
t i * ♦ $
-100-00 -75-00 -SO.00 -25.00 a -oo ■ DO 7EHP.
.oo s-no DEG C
175.00 2011-00 225.00 2SO-00
O HOLBeRN.aTTO Q MICHELS ET DL
5TD. 0E¥. Or EITi 0.392 O
Fig. 9 Deviation Plots for Air
-1
to 1^
S ?1
HYDROGEN: SECOND VIRIflL DEVIATIONS OF EXPERIMENTAL FROM CALCULATED VALUES fl SMOOTHED REPRESENTATION OF EXPERIflENTflL DflTfl
> (Tl D O
B-TH-°-fflfl Ml. , 1 * !0«LM -I7S.O0T -JäO.Oq, -I2S.00 -JOB.« -'rs.oo -So.00 00
0€6 C- zi.go 5).DD ?r 00 no-no 115.00 \V> ■00 175-DO 200.00
ID MICHELS, ET HL. E GOQOMIN. OILIER. R90EH HUO HEBER
STD. DEW- OF FIT« 0.069
Fig. 10 Deviation Ploto for Hydrogen
DEUTERIUM: SECOND VIRIAL COEFFICIENT DEVIATIONS OF EXPERI flENT AL FROM CALCULATED VALUES fl SMOOTHED REPRE5ENTRTI0N QF EXPERIMENTRL DATA
CO
S
<->C -i.-1! ■ !IUI -)•; \.nn
i ^$5jui _i ~! JSCLJÜ) -'i^.na -mn.nn -4k-on _JsaJIL _^is Jta -Tlha ZffiTÖKT
T_ _ _ _ ~TTEMP.. ote C _ HP 46 a- -3
_SP-Qfi_ _2&-Q0_ mo.03 _U6JUL isn.nn _L.15.J1Q. __JO.OO
d NICHELS. ET flL. STO. DE¥. Sf FITi D.Q44
m D o
Fig. 11 Deviation Plots for Deuterium
to 05
ä*
H2G: SECOND VIRIAL COEFFICIENT DEVIATIONS QFiEXPERIMENTflL FROM CALCULATED VALUES fl SMOOTHED REPRESENTATION OF EXPERIMENTAL DRTfl
8
SO.00 170.od 100.00 190.00
> o ("1 H 3>
_ . 1 H- ZpO.OO 210-00 220.00
TEtP
I 230.00 240.00
.. OEG C 0-00 Z60.00 270. 280.00 2B0.00 100.00 310-00
t
O HELL. nCLRURIN AND HHflLLtY STO. DEV. OF FIT» 1.953
Fig. 12 Deviation Plots for H20
ujrt
ID
1
D2ß: SECOND VlRIfll. COEFFICIENT DEVIATIONS 0F,EXPERIMENTRL FROM CflLCULRTED VALUES R SMOOTHED REPRESENTATION OF EXPER1MENTPL DRTfl
iöTöö iao oo no.oö iao..oo ISO-DD zbo.oo TID-00 «io.oo iw.oo ««a.no 2I0.00 m-DO ZTO.OO sso.ao jao.oo MO.QO SLO-OO r TLI1P.. DEG C 1
()
() *
m KELL. HCLAORIM AND UHRLLEY STO- OEV. 8F FIT« 4.376
> m O o
Fig. 13 Deviation Plots for D20

CÜ2: SECOND VIRIflL COEFFICIENT DEVIATIONS OF EXPERIMENTAL FROM CRLCULflTED VALUES fi SMOOTHED REPRESENTATION OF EXPERIMENTAL OflTfl
> m D o
CO
D
0
to CO
<->e
—._."'_Dnn HDD n
i n
-!0.00 80. DO 110.00 BO. 90 230 IT 2(0.00 130.M 330 TEflP
380.DO . OEG
430.00 480.M 530.Ä 4*0-00 630.00 680.3 730-00 7(0.00
o
4 KENOfllL.SRGE X VUKflLBVICH.RLT..Tln9SHEMKQ 4 f-FEFfEHLE.CÖff.niLLER A MRCCBRMflCH.SCHNEIDER Q nlCHEL&.nlCHELS Q 0ROS0I..EVMIS.IUNG
STD. QEV OF FIT: 2.314
Fig. 14 Deviation Plots for CQ2 (TL < 780°C)
to CO
J«-
ia
CG2: SECOND VIRIAL COEFFICIENT DEVIATIONS OF EXPERIMENTAL FROM CALCULATED VALUES fl SMOOTHED REPRESENTATION OF EXPERIMENTRL DflTfl
o
a m
-a ~a
(ft DO E a o
- ;o -oo o.ao 20-go ♦j.oo™ M-00 80.00 X X
laa.ao
X a
120.DO UO.00 ISO.DO C 0E$£
180.00 240.00 220.00 2*0.00* 200-00 290-00 SOD.aa
© KtNOflLL.SfiGE X vUMHLOVlCH.flLT..linOSHEN«a + PFEFFERLE.C<JFF.I1ILltR A MflCCQRtlHDI,SCHNEIDER © nlCHELS.nlCHELS a DHDSflN,EVANS.KINO
STD. OEV. BF FIT: Z.3I4 O el
H 3)
Fig. 15 Deviation Plots for C02 (TL < 300°C)
~1
CO o _1
O
h o
METHANE: SECOND VIRIRL COEFFICIENT DEVIATIONS 0F EXPERIMENTAL FR0M CALCULATED VALUES USING 21,6 POTENTIAL FCT. WITH BO = 57.9627, E/K = 217.1434
> m D o
CO
IS
+ $ !00.00 -ISO.BO -130.00-SO.00 a -40-00 (Woo40.00 «0.00+ Ii9.00 180.00 200-00 240.00 J80.00 31«.00 A 380.00 4DD-00 MO.00
m + + «. TEHP.. DEC C ffi o
_p _ _ . (9
GJ O CD ©
O
_
+ SCHftHP. I»RS8M. RICHRROSSM flNO fll TARN A oauSLiN CO MICHELS AND NEOERBRAGT _ BYRNE. J0NES AND SlflVELEV
STO. OEV. 8F FITi 0-4SB
Fig. 16 Deviation Plots for Methane

AEDC-TR-71-39
TABLE 1 RELATIONS BETWEEN VOLUME AND PRESSURE VIR1AL COEFFICIENTS
Gas Constant Ideal Ga6 Normal Volume per Mol
R - 8.3143 JK_1 mol"1 V = 22,413.6 cm3 mol-1
o *
(- 82.056 cm3 at K_1 mol"1)
(Both on unified scale)
Pressure virials (2) Amagat vlrlals <3)
V = V /A n oo
A- 1 - B (0°C) - CA(0°C) . O A A.
A = A T/273.15 A o
BP = BV/RT BA ■ BV AA/Vn
S = CCV - BV2)/(RT)2 CA = S AA/VB
2a
31
AEDC-TR-71-39
TABLE 2 SECOND VIRIAL COEFFICIENT OF HELIUM
T B B 3
K cm /mol K
9.00 -26.0 35.00
10.00 -21.7 40.00
11.00 -18.1 45.00
12.00 -15.2 50.00
13.00 -12.7 60.00
14.00 -10.5 80.00
15.00 -8.7 100.00
16.00 -7.1 120.00
17.00 -5.6 160.00
18.00 -4.3 200.00
19.00 -3.2 273.15
20.00 -2.2 373.15
22.00 -.5 400.00
22.64 0.0 600.00
24.00 .9 800.00
26.00 2.0 1000.00
28.00 3.0 1200.00
30.00 3.8 1400.00
cm ; 'mol
5, .4
6. 6
7. ,5
8. ,2
9. ,2
10. ,6
11, ,4
11. ,8
12. ,3
12. ,3
12. ,0
11. ,3
11. ,1
10, .4
9, .8
9, .3
8, .8
8, .4
32
AEDC-TR-71-39
TABLE 3 SECOND VIRIAL COEFFICIENT OF NEON AND ITS TEMPERATURE DERIVATIVES
T B TdB/dT T2d2B/dT2
3 3 3 K. cm /mol cm /mol cm /mol
.80.00 -11.8 37. -87.
90.00 -7.8 31. -73.
100.00 -4.8 27. -63.
110.00 -2.3 24. -55.
120.00 -.4 21. -49.
122.11 0.4 21. -48.
130.00 1.2 19. -44.
140.00 2.6 18. -40.
160.00 4.8 15. -34.
200.00 7.6 11. -26.
240.00 9.4 9. -20.
273.15 . 10.4 7. -17.
280.00 10.6 7. -17.
320.00 11.5 6. -14.
360.00 12.1 5. -12.
373.15 12.3 5. -12.
400.00 12.6 4. -11.
500.00 13.3 3. -8.
600.00 13.8 2. -6.
700.00 14.0 1. -5.
800.00 14.2 1. -4.
900.00 14.3 1. -3.
1000.00 14.3 0. -3.
33
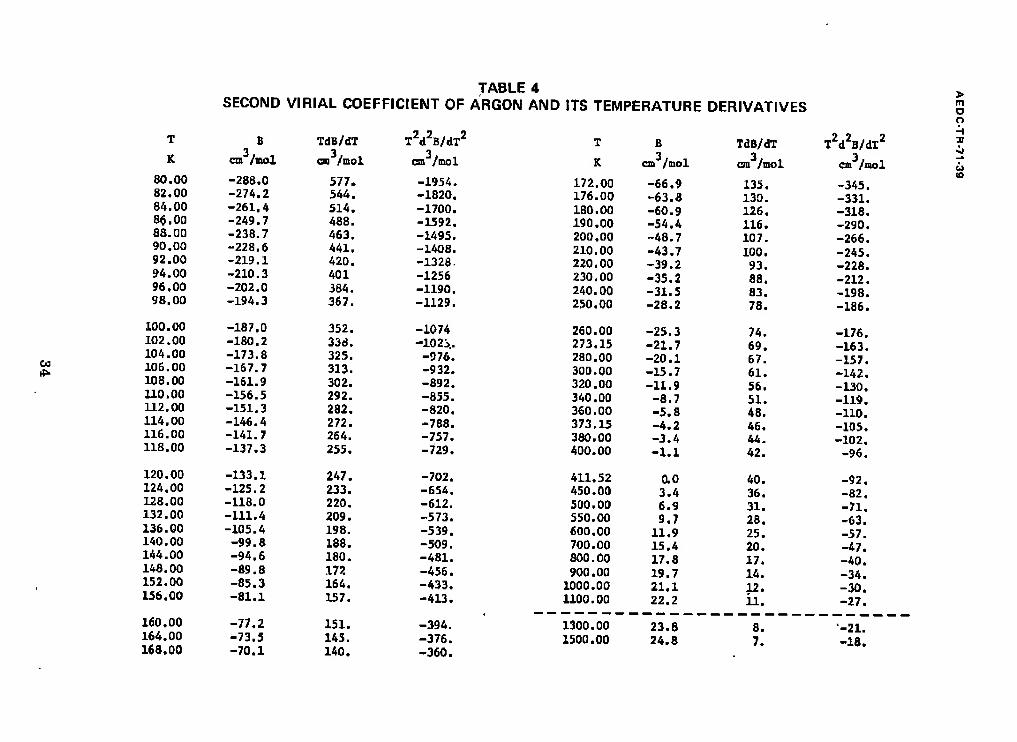
TABLE 4 SECOND VIRIAL COEFFICIENT OF ARGON AND ITS TEMPERATURE DERIVATIVES
B
OS
T B TdB/dT T2d2B/dT2
K cm /mol cm /mol cm /mol
80 .00 -288.0 577. -1954. 82 .00 -274.2 544. -1820. 84.00 -261.4 514. -1700. 8$.00 -249.7 488. -1592. 88 .00 -238.7 463. -1495. 90 .00 -228.6 441. -1408. 92 .00 -219.1 420. -1328. 94 .00 -210.3 401 -1256 96 .00 -202.0 384. -1190. 98 .00 -194.3 367. -1129.
100 .00 -187.0 352. -1074 102 .00 -180.2 33d. -102i.. 104 .00 -173.8 325. -976. 106 .00 -167.7 313. -932. 108, .00 -161.9 302. -892. 110, ,00 -156.5 292. -855. 112, .00 -151.3 282. -820. 114, ,00 -146.4 272. -788. 116. .00 -141.7 264. -757. 118.00 -137.3 255. -729.
120. ,00 -133.1 247. -702. 124, ,00 -125.2 233. -654. 128. ,00 -118.0 220. -612. 132. 00 -111.4 209. -573. 136. ,00 -105.4 198. -539. 140. ,00 -99.8 188. -509. 144. 00 -94.6 180. -481. 148. 00 -89.8 172 -456. 152. 00 -85.3 164. -433. 156, 00 -81.1 157. -413.
160. 00 -77.2 151. -394. 164.00 -73.5 145. -376. 168.00 -70.1 140. -360.
cm /mol
172.00 -66.9 176.00 -63.8 180.00 -60.9 190.00 -54.4 200.00 -48.7 210.00 -43.7 220.00 -39.2 230.00 -35.2 240.00 -31.5 250,00 -28.2
260.00 -2S.3 273.15 -21.7 280.00 -20.1 300.00 -15.7 320.00 -11.9 340.00 -8.7 360.00 -5.8 373.15 -4.2 380.00 -3,4 400.00 -1.1
411.52 0.0 450.00 3.4 500.00 6.9 550.00 9.7 600.00 11.9 700.00 15.4 800.00 17.8 900.00 19.7 1000.00 21.1 1100.00 22.2
1300.00 23.8 1500.00 24.8
TdB/dT T2d2B/dT2
cm /mol 3
cm /mol
135. -345, 130. -331. 126. -318. 116. -290. 107. -266. 100. -245. 93. -228. 88. -212. 83. -198. 78. -186.
74. -176. 69. -163. 67. -157. 61. -142. 56. -130. 51. -119. 48. -110. 46. -105. 44. -102. 42. -96.
40. -92. 36. -82. 31. -71. 28. -63. 25. -57. 20. -47. 17. -40. 14. -34. 12. -30. ii. -27.
8. -21. 7. -18.
> m a n
S
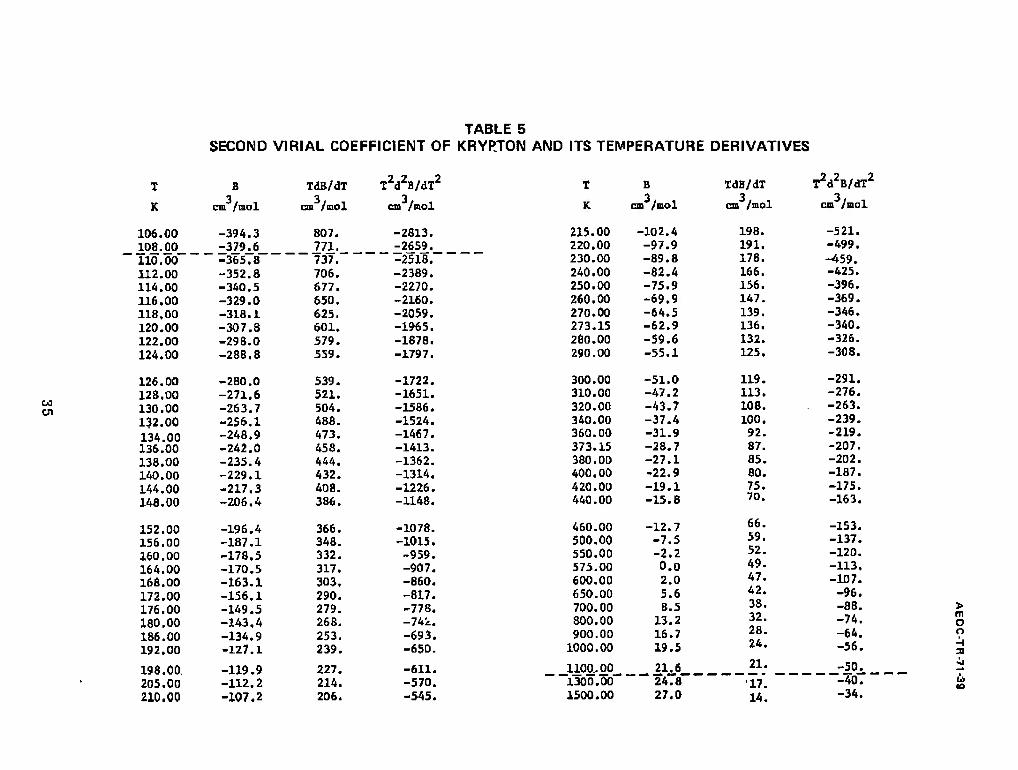
TABLE 5 SECOND VIRIAL COEFFICIENT OF KRYRTON AND ITS TEMPERATURE DERIVATIVES
GO
T B TdB/dT T2d2B/dT2
K 3/ i cm /mol cm /mol cm /mol
106.00 -394.3 807. -2813. 108.00 -379.6 771. -2659. 110.00 -365.8 737. -2518. 112.00 -352.8 706. -2389. 111.00 -340.5 677. -2270. 116.00 -329.0 650. -2160. 118.00 -318.1 625. -2059. 120.00 -307.8 601. -1965. 122.00 -298.0 579. -1878. 124.00 -288.8 559. -1797.
126.00 -280.0 539. -1722. 123.00 -271.6 521. -1651. 130.00 -263.7 504. -1586. 132,00 -256.1 488. -1524.
134.00 -248.9 473. -1467. 136.00 -242.0 458. -1413. 138.00 -235.4 444. -1362. 140.00 -229.1 432. -1314. 144.00 -217.3 408. -1226. 148.00 -206.4 386. -1148.
152.00 -196.4 366. -1078. 156.00 -187.1 348. -1015. 160.00 -178.5 332. -959. 164.00 -170.5 317. -907. 168.00 -163.1 303. -860. 172.00 -156,1 290. -817. 176.00 -149.5 279. -778. 180.00 -143,4 268. -74k. 186.00 -134.9 253. -693. 192.00 -127.1 239. -650.
198.00. -119.9 227. -611. 205.00 -112.2 214. -570. 210.00 -107.2 206. -545.
T B
K cm /mol
215.00 -102.4 220.00 -97.9 230.00 -89.8 240.00 -82.4 250.00 -75.9 260.00 -69.9 270.00 -64.5 273.15 -62.9 280.00 -59.6 290.00 -55.1
300.00 -51.0 310.00 -47.2 320.00 -43.7 340.00 -37.4 360.00 -31.9 373.15 -28.7 380.00 -27.1 400.00 -22.9 420.00 -19.1 440.00 -15.8
460.00 -12.7 500.00 -7.5 550.00 -2.2 575.00 O.O 600.00 2.0 650.00 5.6 700.00 8.5 800.00 13.2 900.00 16.7 1000.00 19.5
1100,00 21,6 1300.00 24.8 1500.00 27.0
TdB/dT
cm /mol
198. 191. 178. 166. 156. 147. 139. 136. 132. 125.
119. 113. 108. 100. 92. 87. 85. 80. 75. 70.
66. 59. 52. 49. 47. 42. 38. 32. 28. 24.
21.
■17. 14.
T2d2B/dT2
cm /mol
-521. -499. -459, -425. -396. -369. -346. -340. -326. -308.
-291. -276. -263. -239. -219. -207. -202. -187. -175. -163.
-153. -137. -120. -113. -107. -96. -88. -74. -64. -56.
-50. " -40T
-34.
m O o
(O

AEDC-TR-71-39
TABLE 6 SECOND VIRIAL COEFFICIENT OF XENON AND ITS TEMPERATURE DERIVATIVES
,2,2, » r B TdB/dT T d B/dlT
K cm /mol 3i i cm /mol cm /mol
220 .00 -230.7 429. -1225. 225 .00 -221.2 411. -1166. 230 .00 -212.4 395. -1111. 235 .00 -204.0 380. -1061. 240.00 -196.2 366. -1015. 245, .00 -188.7 353. -972. 250 .00 -181.7 341. -933. 255 .00 -175.1 329. -896. 260 .00 -168.8 319. -861. 265 .00 -162.8 308. -829.
270 .00 -157.2 299. -799. 273 .15 -153.7 293. -781 280 .00 -146.6 281. -745. 290 .00 -137.0 266. -697. 300 .00 -128.3 252. -654. 310 .00 -120.2 239. -616. 320, .00 -112.8 227. -582. 330, .00 -106.0 217. -551. 340, .00 -99.7 207. -523. 350, .00 -93.8 198. -497. 360. .00 -88.4 190. -474. 370.00 -88.3 182. -452 373, .15 -81.7 180. -446.
380, .00 -78.5 175. -433. 390, .00 -74.0 169. -415. 400, .00 -69.8 163. -398. 420.00 -62.2 152. -368. 440. .00 -55.4 142. -342. 460. .00 -49.2 133. -319. 480, ,00 -43.7 126. -299. 500. ,00 -38.8 119. -282. 525. ,00 -33.1 111. -262. 550. ,00 -28.1 104. -245.
575. 00 -23.6 98. -230. 600. .00 -19.6 93. -21S. 650, 00 -12.5 84. -193. 700. 00 —6.6 76. -175. 768. 03 0.0 67. -154, 800, 00 2.7 64. -146, 900. ,00 9.6 55. -125.
1000. ,00 15.0 48. -110. 1100, ,00 19.3 42. -97. 1200. 00 22.8 38. -87.
1300.00 25.6 34. -79. 1400.00 28.0 31. -72. 1500.00 30.1 28. -66.
36
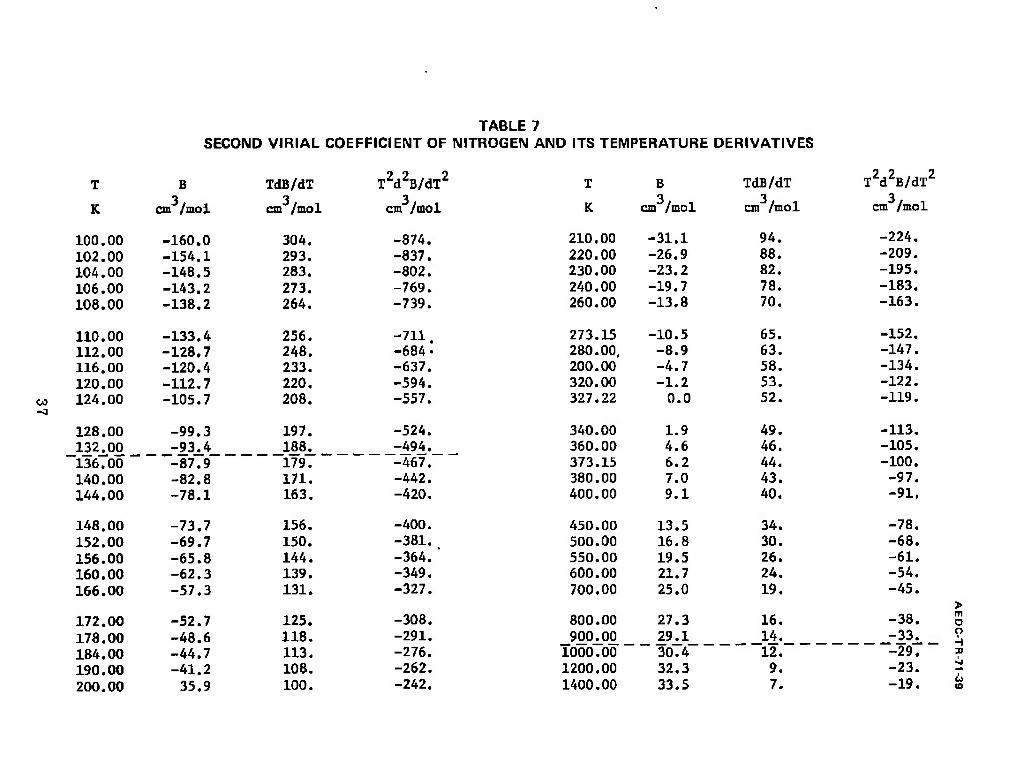
TABLE 7 SECOND VIRIAL COEFFICIENT OF NITROGEN AND ITS TEMPERATURE DERIVATIVES
CO
T B TdB/dT 7 7 2
Tdl/dT
K cm /mol cm /mol cm /möl
100.00 -160.0 304. -874. 102.00 -154.1 293. -837. 104.00 -148.5 283. -802. 106.00 -143.2 273. -769. 108.00 -138.2 264. -739.
110.00 -133.4 256. -711. 112.00 -128.7 248. -684- 116.00 -120.4 233. -637. 120.00 -112.7 220. -594. 124.00 -105.7 208. -557.
128.00 -99.3 197. -524. 132.00 -93.4 188. -494. 136.00 -87.9 179. -467. 140.00 -82.8 171. -442. 144.00 -78.1 163. -420.
148.00 -73.7 156. -400. 152.00 -69.7 150. -381. 156.00 -65.8 144. -364.' 160.00 -62.3 139. -349. 166.00 -57.3 131. -327.
172,00 -52.7 125. -308. 178.00 -48.6 118. -291. 184.00 -44.7 113. -276. 190.00 -41.2 108. -262. 200.00 35.9 100. -242.
T B TdB/dT 2 9 2
K 3/ i cm /mol cm /mol cm /mol
210.00 -31.1 94. -224. 220.00 -26.9 88. -209. 230.Q0 -23.2 82. -195. 240.00 -19.7 78. -183. 260.00 -13.8 70. -163.
273.15 -10.5 65. -152. 280.00, -8.9 63. -147. 200.00 -4.7 58. -134. 320.00 -1.2 53. -122. 327.22 0.0 52. -119.
340.00 1.9 49. -113. 360.00 4.6 46. -105. 373.15 6.2 44. -100. 380.00 7.0 43. -97. 400.00 9.1 40. -91.
450.00 13.5 34. -78. 500.00 16.8 30. -68. 550.00 19.5 26. -61. 600.00 21.7 24. -54. 700.00 25.0 19. -45.
800.00 27.3 16. -38. > m O
900.00 29.1 14. -33. o
1000.00 30.4 12. -29. 3J ■
1200.00 32.3 9. -23. -J
1400.00 33.5 7. -19. to
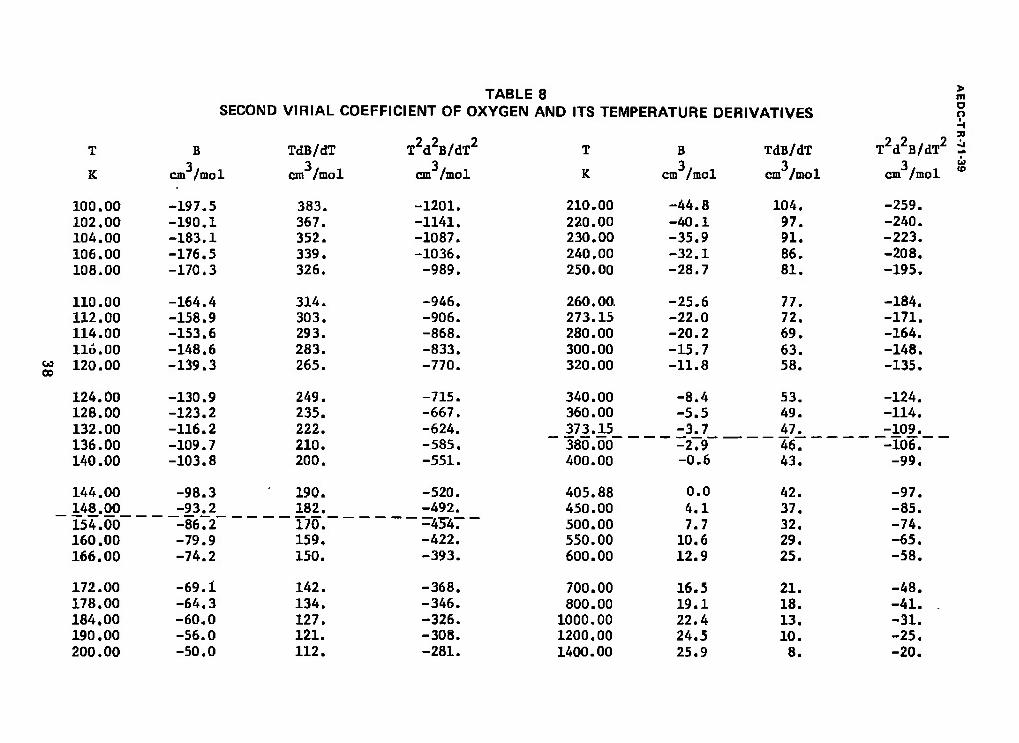
TABLE 8
00 CD
SECOND VIRIAL COEFFICIENT OF OXYGEN AND ITS TEMPERATURE DERIVATIVES o n i H
T B TdB/dT T2d2B/dT2 T B TdB/dT T2d2B/dT2 i
K cm /mol cm /mol cm /mol K cm /mol cm /mol 3 u
cm /mol *
100.00 -197.5 383. -1201. 210.00 -44.8 104. -259. 102.00 -190.1 367. -1141. 220.00 -40.1 97. -240. 104.00 -183.1 352. -1087. 230.00 -35.9 91. -223. 106.00 -176.5 339. -1036. 240.00 -32.1 86. -208. 108.00 -170.3 326. -989. 250.00 -28.7 81. -195.
110.00 -164.4 314. -946. 260.00. -25.6 77. -184. 112.00 -158.9 303. -906. 273.15 -22.0 72. -171. 114.00 -153.6 293. -868. 280.00 -20.2 69. -164. 116.00 -148.6 283. -833. 300.00 -15.7 63. -148. 120.00 -139.3 265. -770. 320.00 -11.8 58. -135.
124.00 -130.9 249. -715. 340.00 -8.4 53. -124. 128.00 -123.2 235. -667. 360.00 -5.5 49. -114. 132.00 -116.2
-109.7 222. 210.
-624. -585.
373.15 -3.7 47. -109. 136.00 380.00 -2.9 46. -106. 140.00 -103.8 200. -551. 400.00 -0.6 43. -99.
144.00 -98.3 ' 190. -520. 405.88 0.0 42. -97. 148.00 -93.2 182. -492. 450.00
500.00 4.1 7.7
37. 32.
-85. 154.00 -86.2 170. -454. -74. 160.00 -79.9 159, -422. 550.00 10.6 29. -65. 166.00 -74.2 150. -393. 600.00 12.9 25. -58.
172.00 -69.1 142. -368, 700.00 16.5 21. -48. 178.00 -64.3 134. -346. 800.00 19.1 18. -41. 184.00 -60.0 127. -326. 1000.00 22.4 13. -31. 190.00 -56.0 121. -308. 1200.00 24.5 10. -25. 200.00 -50.0 112. -281. 1400.00 25.9 8. -20.

TABLE 9 SECOND VIRIAL COEFFICIENT OF DRY C02-FREE AIR AND ITS TEMPERATURE DERIVATIVES
LO CD
r B TdB/dT 5 7 7
TdB/dT T B TdB/dT 2 2 2
TdB/dT
K 3/ i cm /mol cm /mol cm /mol K
3/ i cm /mol 3/ i cm /mol cm /mol
100.00 -167.3 318. -935. 210.00 -34.5 95. -230. 102.00 -161.2 307. -893. 220.00 -30.2 89. -214. 104.00 -155.3 295. -854. 230.00 -26.4 84. -200. 106.00 -149.8 285. -818. 240.00 -22.9 79. -187. 108.00 -144.6 275. -785. 250.00 -19.8 75. -176.
110.00 -139.6 266. -754. 260.00 -16.9 71. -166. 112.00 -134.9 258. -725. 273.15 -13.5 66. -155. 114.00 -130.4 249. -698. 280.00 -11.9 64. -150. 116.00 -126.1 242. -673. 300.00 -7.7 58. -136. •118.00 -122.0 235. -649. 320.00 -4.1 54. -124.
120.00 -118.2 228. -627. 340.00 -1.0 50. -114. 124.00 -110.9 215. -586. 346.81 0.0 4B. -HI. 128.00 -104.3 204. -550. 360.00 1.7 46. -106. 132.00 -98.1 193. -517. 373.15 3.4 44. -101 136.00 -92.5 184. -488. 380.00 4.2 43. -98.
140.00 -87.3 176. -462. 400.00 6.3 40. -92. 144.00 -82.5 168. -438. 450.00 10.7 35. -79. 148.00 -78.0 161. -416. 500.00 14.1 30. -69 152.00 -73.8 154. -396. 550.00 16.8 27. -61. 156.00 -69.9 148. -378. 600.00 19.0 24. -55.
160.00 -66.2 142. -361. 650.00 20.8 21. -50. 166.00 -61.1 134. -339. 700.00 22.3 19. -45. 172.00 -56.5 127. -319. 800.00 24.7 16. -38. J> 178.00 -52.2 121. -301. 900.00 26.4 14. -33. m
O a H 3)
184.00 -48.3 115. -284. 1000.00 27.8 12. -29.
190.00 -44.7 110. -270. 1200.00 29.7 9. -23. 200.00 -39.3 102. -248. 1400.00 30.9 7. -19. * u
<0
AEDC-TR-71-39
TABLE 10 SECOND VIR1AL COEFFICIENT OF HYDROGEN
T B
K cm /mol
24.00 -112.8 25.00 -106.2 26.00 -100.3 27.00 -94.8 28.00 -89.6 29.00 -85.0 30.00 -80.7 31.00 -76.7 32.00 -73.0 33.00 -69.5
34.00 -66.2 35.00 -63.2 36.00 -60.2 38.00 -55.0 40.00 -50.3 42.00 -46.2 44.00 -42.5 46.00 -39.2 48.00 -36.2 50.00 -33.4
54.00 -28.6 58.00 -24.5 62.00 -21.0 66.00 -17.9 70.00 -15.2 74.00 -12.9 78.00 -10.9 82.00 -8.9 86.00 -7.2 90.00 -5.7
T B
K cm /mol
100.00 -2.5 110.04 o.o 120.00 2.0 130.00 3.7 140.00 5.1 150.00 6.4 160.00 7.6 170.00 8.6 180.00 9.5
190.00 10.2 200.00 10.8 250.00 13.0 273.15 13.7 300.00 14.4 350.00 15.3 373.15 15.6 400.00 15.9 420,00 16.1
40
AEDC-TR-71-39
TABLE 11 SECOND VIR1AL COEFFICIENT OF DEUTERIUM
T B
K
84.00 88.00 92.00 96.00 100.00 110.00 115.00 120.00 130.00 140.00
150.00 160.00 170.00 180.00 190.00 200.00 220.00 240.00 260.00 273.15
280.00 300.00 320.00 340.00 360.00 373.15 380.00 400.00 420.00
cm /mol
-10. ,4 -8, 7 -7. 0 -5, 6 -4. ,2 -1. ,3
0.0 1. ,0 3, ,0 4. ,6
6. 0 7. 1 8. 1 8. ,9 9. ,5
10. 2 11. .3 12. 2 12. 8 13. ,1
13. .2 13. ,5 14. .0 14. ,4 14. ,7 14, .9 15. .0 15, .2 15. ,5
41
AEDC-TR-71-39
TABLE 12 SECOND VIRIAL COEFFICIENT OF WATER VAPOR (H20)
T B
K cm /mal
432.00 -311.2 434.00 -304.5 436.00 -298.1 438.00 -291.9 440.00 -285.5 442.00 -279.7 444.00 -273.9 446.00 -268.5 448.00 -263.2 450.00 -258.2 452.00 -253.4
454.00 -248.9 456.00 244.7 458.00 -240.5 460.00 -236.5 462.00 -232.6 464.00 -228.9 466.00 -225.4 468.00 -222.1 470.00 -218.5 475.00 -210.2
480.00 -202.5 485.00 -195.4 490.00 -188.6 495.00 -182.2 500.00 - -176.2 505.00 -170.4 510.00 -165.0 515.00 -160.0 520.00 -155.3 530.00 -146.7
T B
K cm /mol
540.00 -139.1 550.00 -132.0 560.00 -125.3 570.00 -119.0 580.00 -113.1 590.00 -107.6 600.00 -102.5 610.00 -97.6 620.00 _ 93.0 630.00 - 88.6
640.00 -84,4 650.00 -80,4 660.00 -76.6 670.00 -72.9 680.00 -69.4 690.00 -66.1 700.00 -62.9 710.00 -59.9 720.00 -57.0
42
AEDC-TR-71-39
TABLE 13 SECOND VIRIAL COEFFICIENT OF HEAVY WATER VAPOR (D20)
T 3
K cm /mol
432.00 -314.5 434.00 -307.8 436.00 -301.3 438.00 -295.0 440.00 -288.6 442.00 -282.6 444.00 -276.9 446.00 -271.3 448.00 -265.9 450.00 -260.8 452.00 -255.9
454.00 -251.4 456.00 -247.0 458.00 -242.8 460.00 -238.8 462.00 -234.8 464.00 -231.1 466.00 -227.6 468.00 -224.2 470.00 -220.5 475.00 -212.2
480.00 -204.4 485.00 -197.2 490.00 -190.3 495.00 -183.8 500.00 -177.6 505.00 -171.8 510.00 -166.3 515.00 -161.1 520.00 -156.4 530.00 -147.7
K cm /mol
540.00 -140.0 550.00 -132.8 560.00 -126.1 570.00 -119.6 580.00 -113.6 590.00 -108.1 600.00 -103.0 610.00 -98.0 620.00 -93.3 630.00 -88.8
640.00 -84.6 650.00 -80.6 660.00 -76.7 670.00 -73.1 680.00 -69.5 690.00 -66.2 700.00 -63.0 710.00 -59.9 720.00 -57.0
43
AEDC-TR-71-39
TABLE 14 SECOND VIRIAL COEFFICIENT OF CARBON DIOXIDE (COz)
T B
K cm /mol
250.00 . -181.8 255.00 -174.1 260.00 -166.8 265.00 -160.0 270.00 -153.5 273.15 -149.7 275.00 -147.4 260.00 -141.7 285.00 -136.2 290.00 -131.1
295.00 -126.2 300.00 -121.5 310.00 -112.8 320.00 -104.8 330.00 -97.5 340.00 -90.8 350.00 -84.7 360.00 -79.0 370.00 -73.8 373*15 -72.2
380.00 -68.9 390.00 -64.4 400.00 -60.2 410.00 -56.3
T B
K cm /mo!
420.00 -52.6 430.00 *49.1 440.00 -45.9 450.00 -42.8 460.00 -40.0 480.00 -34.7 500.00 -30.0 520.00 -25.8 540.00 -21.9 560.00 -18.4
580.00 -15.3 600.00 -12.4 620.00 -9.8 640,00 -7.4 660.00 -5.1 680.00 -3.1 700.00 -lv3 714.81 0.0 750.00 2.7 800.00 6.0
850.00 8.8 900.00 11.1 950.00 13.0 1000.00 14.6
44
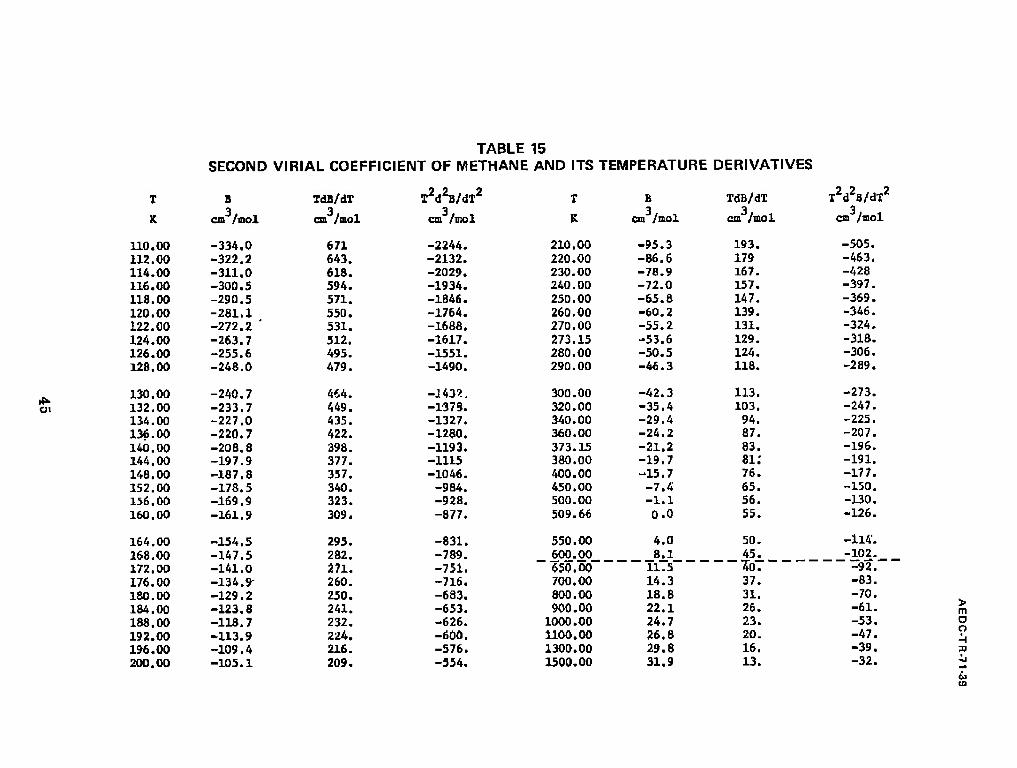
TABLE 15 SECOND VIRIAL COEFFICIENT OF METHANE AND ITS TEMPERATURE DERIVATIVES
01
T B TdB/dT T^^/dT2 T B TdB/dT T2d28/dTZ
K 3
cm /mol cm /mol cm /mol K cm /mol cm /mol cm /mol
110.00 -334.0 671 -2244. 210.00 -95.3 193. -505.
112.00 -322.2 643. -2132. 220.00 -86.6 179 -463. 114.00 -311.0 618. -2029. 230.00 -78.9 167. -428 116.00 -300.5 594. -1934. 240.0D -72.0 157. -397.
118.00 -290.5 571. -1846. 250.00 -65.8 147. -369. 120.00 -281.1 550. -1764. 260.00 -60.2 139. -346. 122.00 -272.2 ' 531. -1688. 270.00 -55.2 131. -324.
124.00 -263.7 512. -1617. 273.15 -53.6 129. -318. 126.00 -255.6 495. -1551. 280.00 -50.5 124. -306. 128.00 -248.0 479. -1490. 290.00 -46.3 118. -289.
130.00 -240.7 464. -J43?, 300.00 -42.3 113. -273. 132.00 -233.7 449. -1-37S. 320.00 -35.4 103. -247. 134.00 -227.0 435. -1327. 340.00 -29.4 94. -225. 136.00 -220.7 422. -1280. 360.00 -24.2 87. -207.
140.00 -208.8 398. -1193. 373.15 -21.2 83. -196. 144.00 -197.9 377. -1115 380.00 -19.7 81; -191. 148.00 -187.8 357. -1046. 400.00 -15.7 76. -177. 152.00 -178.5 340. -984. 450.00 -7.4 65. -150. 156.00 -169.9 323. -928. 500.00 -1.1 56. -130. 160.00 -161.9 309. -877. 509.66 0.0 55. -126.
164.00 -154.5 295. -831. 550.00 4.0 50. -114'.
168.00 -147.5 -141.0
282. 271.
-789. -751.
600.00 8.1 45. -102.
172.00 650.00 11.5 40. -92.
176.00 -134.9- 260. -716. 700.00 14.3 37. -83.
180.00 -129.2 250. -683. 800.00 18.8 31. -70. > m 184.00 -123.8 241. -653. 900.00 22.1 26. -61.
188.00 -118.7 232. -626. 1000.00 24.7 23. -53. O o H 192.00 -113.9 224. -600. 1100.00 26.8 20. -47.
196.00 -109.4 216. -576. 1300.00 29.8 16. -39. 3J
200,00 -105.1 209. -554. 1500.00 31.9 13. -32.
CO

AEDC-TR-71-39
TABLE 16 THIRD VIRIAL COEFFICIENTS OF VARIOUS SUBSTANCES
C IN UNITS OF KPcmB/mol T K He Ne Ar Kr Xe N2 °2 Air H2 D2
H20 D20 C02 CH<
25 14.0 30 16.0 35 14.3 40 12.1 45 10.7 50 9.6 55 8.9 60 2.7 4 8.4 70 2.5 4 7.4 80 2.4 4 7 ■ 6.9
90 2.3 4 9 6.4 100 2.2 4 12 6.1 6 , 110 2.1 3 16 5.9 5 120 2.0 3 20 5.7 5 130 1.9 3 23 5.5 5 140 1.8 3 ~25 ~ 23 5.4 5 150 1.7 3 23 26 5.3 5 160 1.6 3 22 26 23 24 5.2 5 180 1.5 3 20 21 20 21 5.0 5 200 1.3 3 18 19 17 19 4.8 5
220 1.2 3 16 33 17 15 18 4.6 5 240 1.1 3 15 30 16 13 17 4.5 5 260 1.1 3 13 28 \5 12 16 4.4 5 273 1.1 3 12 27 62 15 11 15 4.2 5 57 29 2 CO 1.0 3 12 26 59 15 11 15 4.1 5 56 28 300 1.0 2 11 24 54 14 10 15 3.9 5 52 26 32J 1.0 2 11 23 50 14 14 3.6 5 49 24 340 0.9 2 xo 21 46 14 14 3.4 5 45 22 360 0.8 2 9 20 41 13 3.2 5 42 21 380 0.8 2 9 19 36 13 3.0 4 38 19 400 0.7 2 9 18 34 13 2.9 4 36 18 420 0.7 9 18 32 12 3 32 17 4<0 8 17 30 12 16 460 8 16 28 12 16 4Ü0 6 16 26 12 15 503 15 24 12 -100 -150 15 SIS 15 22 -53 -64 14 f50 14 20 -17 -20 14 575 M 18 +2 0 14 600 13 9 8 13
650 13 12 12 700 12 - 10 12
46

AEDC-TR-71-39
Substance
TABLE 17 BOYLE TEMPERATURE AND THE INVERSION TEMPERATURE OF VARIOUS SUBSTANCES
Boyle temperature
Inversion temperature
Helium
Neon
Argon
Krypton
Xenon
Nitrogen
Oxygen
Air
Hydrogen
Deuterium
Carbon dioxide
Methane
22.64
122.11
411.52
575.00
768.03
327.22
405.88
346.81
110.04
115.30
714.81
509.66
231.42
779.91
1089.72
1455.79
620.63
764.43
658.79
967.81
TABLE 18 POTENTIAL PARAMETERS FOR THE m - 6 POTENTIAL OF SELECTED SUBSTANCES
Substance m e/k . , 2TIN -3. bo C = — C >
K 3/ i cm /mol
Neon 18 47,74 22.83
Argon 18 160. 87 43.74
Krypton 18 224,78 53.78
Xenon 18 300. 29 73.32
Nitrogen 21 139,41 54.41
Oxygen 21 172,93 44.49
Air 21 147.76 50.95
Methane 21 217.14 57.96
47
UNCLASSIFIED Security Classification
DOCUMENT CONTROL DATA -R&D (Security claasilication ot ttrle, body o1 abstract and indexing annotation must be entered when the overall report Ja ctaaelfled)
I ORIGINATING ACTIVITY (Corporate author)
National Bureau of Standards, Heat Division, Washington, D. C.
Zm. REPORT SECUHITV CLASSIFICATION
UNCLASSIFIED 2b, GROUP
N/A 3 REPORT TITLE
PRESSURE-VOLUME-TEMPERATURE RELATIONSHIPS OF GASES VIRIAL COEFFICIENTS
4 DESCRIPTIVE NOTES (Type ot report and inclusive dates)
Final Report, July 1969 to October 1970 3 AUTHORIS! (First name, middle initial, laat name)
J. M. H. Levelt Sengers, Max Klein, and John S. Gallagher, National Bureau of Standards
B. REPORT DATE
March 1971 7«. TOTAL NO OFPACE5
53 7b. NO OF REFa
45 IB. CONTRACT OR CRANT NO.
DO(40-600)66-938 b. PROJEC T NO.
8951 c.Task 02
Program Element 61102F
•)B. ORIGINATOR'S REPORT NUMBER1S)
AEDC-TR-71-39
96. OTHER REPORT NOtsi (Any other numbers that may be aaalgned this report)
N/A
io DISTRIBUTION STATEMENT
This document has been approved for public release and sale; its distribution is unlimited.
II. SUPPLEMENTARY NOTES
Available in DDC,
12 SPONSORING M1LI TARY ACTIVITY
Arnold Engineering Development Center, AFSC, Arnold Air Force Station, Tennessee 37389
13. ABSTRACT
Tables of second virial coefficients as functions of temperature are presented for 14 gases. These gases are mainly noble gases and constituents of air. In most cases, these are based on a reexamination of the original P-V-T data. Where necessary and possible, these data have been refitted and improved experimental virials determined. In the case of eight of these gases, it has been possible to fit the experimental second virials to those predicted by the (m,6) potential function and potential parameters determined. In almost all cases, an optimum fit was obtained for m - 18. The optimum potential function was used for extrapolating the tables somewhat beyond the experimental range, and for obtaining temperature derivatives of B. In the case of the other six substances virial coefficients predicted by the (m,6) functions were used as a smoothing aid. Experimental third virial coefficients are presented at the experimental temperatures. A table of Boyle and Joule-Thomson inversion temperatures is also presented.
DD FORM 1473 UNCLASSIFIED Security Classification

UNCLASSIFIED Security CUnatficttlOn
KimOKDI
pressure
volume
temperature
coefficients
gas molecules
*rsc An* MS Tm
LINK * LINK ■ LINK C
HOLE • T
UNCLASSIFIED Security Classification


![Temperature-pressure phase relationships in niobium … · Temperature-Pressure Phase Relationships in Niobium ... references at the end of ... with a dc Carey·Foster Bridge [4]](https://img.pdfslide.us/doc/110x75/5ac7226a7f8b9af91c8ea63b/temperature-pressure-phase-relationships-in-niobium-phase-relationships-in-niobium.jpg)
![Journal of Low Temperature Physics Volume 21 Issue 3-4 1975 [Doi 10.1007%2Fbf01141332] Anthony D. Novaco -- A Virial Coefficient Analysis of Helium Adsorption Isotherms](https://img.pdfslide.us/doc/110x75/577cc0b11a28aba71190cdcc/journal-of-low-temperature-physics-volume-21-issue-3-4-1975-doi-1010072fbf01141332.jpg)