Embed Size (px)
Citation preview
C1' 00 00 t")
z . ~ H .. z
~,
NATIONAL ADVISORY COMMITTEE FOR AERONAUTICS
TECHNICAL NOTE 3889
PRESSURE LOSSES OF TITANIA AND MAGNESIUM SLURRIES
IN PIPES AND PIPELINE TRANSITIONS
B y Ruth N . Weltmann and T h omas A. Keller
Lewis F light Propuls i on L a b o ratory Cleveland, Ohio
Washington
January 1957
https://ntrs.nasa.gov/search.jsp?R=19930084740 2018-02-18T06:53:08+00:00Z
...
...
..
NATIONAL ADVISORY COMMITI'EE FOR AERONAUTICS
TECHNI CAL NOTE 3889
PRESSURE LOSSES OF TITANIA AND MAGNESIUM SLURRIES
IN PIPES AND PIPELINE TRANSITIONS
By Ruth N. Weltmann and Thomas A. Keller
SUMMARY
Comparisons of experimental and calculated pressure losses are presented for Newtonian and non-Newtonian materials. The non-Newtonian materials were slurries of titanium dioxide particles suspended in water and of magnesium particles suspended in a hydrocarbon fluid. One of the slurries showed Bingham plastic flow behavior, while the other one behaved like a pseudoplastic material. The pressure-loss data were obtained for laminar, transitional, and turbulent flow through straight pipelines and pipe transitions of I-inch and 3/B-inch nominal pipe size. The pipeline transitions considered are 900 elbows; gate, ball, plug, and globe valves; contractions; and expansions. Transition loss coefficients, which are independent of the flow rate in the pipelines, even for laminar flow in the pipeline system, were determined for the transitions and are compared with those reported in the literat ure for Newtonian fluids.
The transition los's coefficients obtained for the Newtonian and nonNewtonian materials and those repor ted in the literature for Newtonian fluids agree within the errors of experiment. Thus, these studies indicate that, for the design of pipel ine systems, such as fuel systems, where the slurries have flow characteristics similar to those treated in this pa~er, the transition loss coefficients for Newtonian fluids can be used in the design calculations.
INTRODUCTION
With the higher speed and larger range of aircraft , fuels that provide higher thrust or that reduce fuel weight or volume consumption or both are desired. For ram-jet engines and afterburners, the use of fuel slurries, which have a paint-like consistency such as suspensions of fine metal particles suspended in a hydrocarbon liquid, is possible, since there are no moving parts in the exhaust. Theoretical combustion studies with magnesium particles suspended in a hydrocarbon liquid have shown that greater thrust and higher combustion temperatures are obtained with these slurries than with the conventional fuels (refs. I ,and 2). Another application for paintlike slurries of metal particles suspended in a liquid is their use as fuels in homogeneous atomic reactors. Aqueous uranium and thorium slurries have
2 NACA TN 3889
been used for this purpose and were shown to exhibit non-Newtonian flow behavior (ref. 3).
In both applications these slurries are passed through pipeline systems. Thus, for the design of these pipeline systems it is important to know the pressure losses in the straight pipe sections as well as in the pipeline transitions. Pressure losses of non-Newtonian materials in straight pipeline sections are treated in references 4 to 8. Pressure losses of Newtonian materials in transitions are treated in references 4, 9, 10, and 11 for turbulent flow in the pipeline system. For laminar flow of Newtonian materials in the pipeline system, only the pressure losses in contractions (ref. 12) and in elbows (ref. 13) have been treated in the literature .
The purpose of this report is to augment the experimental data for pressure losses of non-Newtonian materials in straight pipelines and to present experimental pressure-loss data for non-Newtonian materials in pipeline systems and for Newtonian materials whenever needed for purposes of comparison. This report also intends to formulate transition loss coefficients for fittings such as elbows and valves in such a way that they can be independent of the flow rate even for laminar flow of the Newtonian and non-Ne~onian materials in the pipeline system.
This report presents experimental pressure-loss data for three Newtonian liquids and two non-Newtonian slurries in laminar, transitional, and turbulent flow. One of the non-Newtonian slurries had the flow behavior of a Bingham plastic material, while the other one behaved like a pseudoplastic material. The pressure losses were measured over straight pipe sections and transitions for l-inch- and 3/8-inch-diameter pipes. Transitions such as 900 elbows; gate, ball, plug, and globe valves; contractions; and expansions are considered.
SYMBOLS
CL transition loss coefficient for total-pressure loss
Cs transition loss coefficient for static-pressure loss
D pipeline diameter, in.
f yield value, dynes/cm2
G rate of shear, sec- l
L length of pipeline, in.
N structure number
6P total-pressure loss, dynes/cm2 and lb/sq in.
Re Reynolds number
,

,
..
NACA TN 3889 3
u plastic viscosity, poise
v mean velocity (from flow rate), cm/sec and ft/sec
TJ apparent viscosity, 't /G, poise
Newtonian viscosity, poise
p density, g/cc
shearing stress, dynes /cm2 and lb/sq in.
friction factor
DESCRIPTION OF PIPELINE FLOW SYSTEM
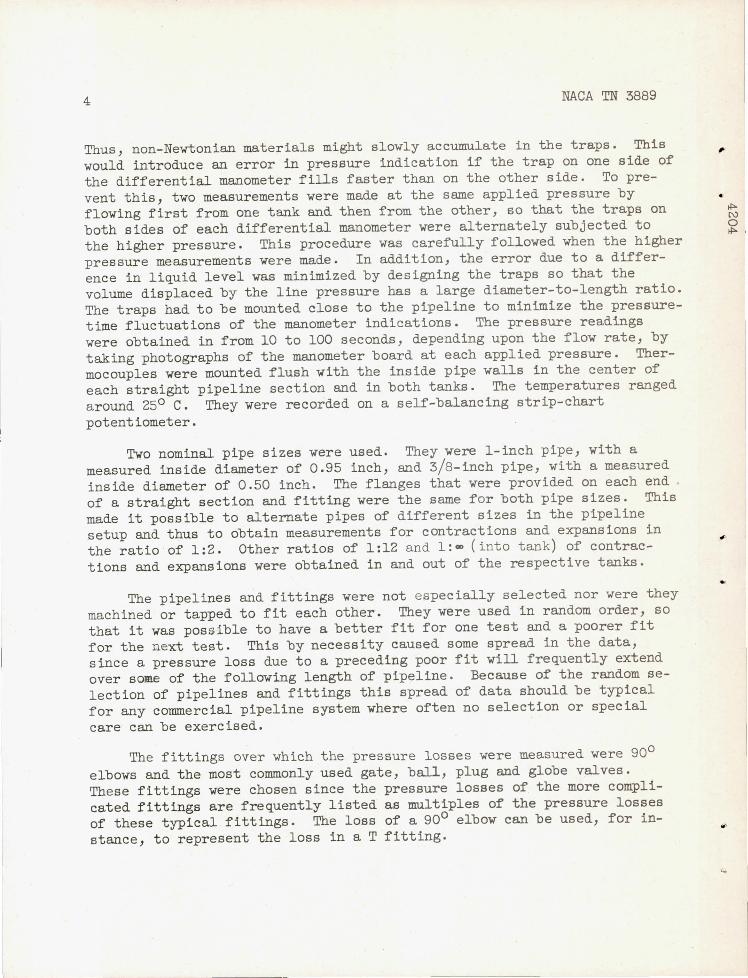
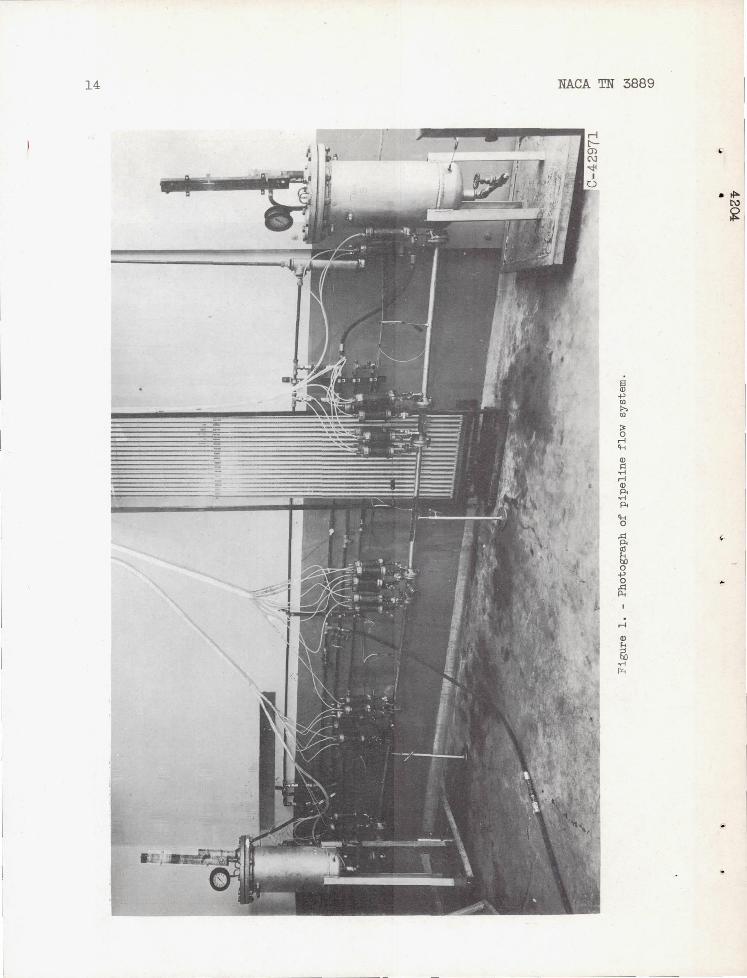
A photograph of the pipeline flow system is shown in figure 1 and a schematic sketch is shown in figure 2. The pipeline system consisted of 3-foot straight and uniform pipeline sections, which were connected by flanges so that pipe fittings could be inserted or removed between any two sections. Two 12-inch-diameter tanks, one on each end of the pipeline system, were provided to hold about 20 gallons of the material being tested. Pressures of 1 to 100 pounds per square inch could be applied to either tank. This made continuous measurements possible without sample changing. The flow rate was measured with floats. The float consisted of a ball attached to a rod. The rods moved up and down in a glass tube with a change in liquid level in the tanks, so that their positions in each tank could be registered within a measured time. Each straight pipeline section and each pipe fitting was provided with four pressure taps on each end, so that pressure differentials could be measured over each section or transition and also across each flange connection. All measurements were static-pressure measurements. The differential pressures were obtained on a 10-foot-high mercury manometer, so that differential pressures up to 60 pounds per square inch could be measured.
Traps as shown in figures 1 and 2 were provided between each pipeline pressure tap and each manometer connection. This was done so that the liquid on the two sides of each differential manometer would have nearly the same level even when a pressure differential existed between these two taps, and also to prevent the liquid material from enter'ing the airlines leading to the manometers at line pressures up to 100 pounds per square inch. The traps are especially important if non-Newtonian materials are being measured. Non-Newtonian materials frequently require a certain minimum pressure before they flow. The material, after being displaced into the trap, should flow back into the pipeline by gravity when the line pressure is released. Gravity, however, does not always supply sufficient pressure to empty the trap completely when the material is non-Newtonian.
4 NACA TN 3889
Thus, non-Newtonian materials might slowly accumulate in the traps. This would introduce an error in pressure indication if the trap on one side of the differential manometer fills faster than on the other side. To prevent this, two measurements were made at the same applied pressure by flowing first from one tank and then from the other, 60 that the traps on both sides of each differential manometer were alternately subjected to the higher pressure. This procedure was carefully followed when the higher pressure measurements were made. In addition, the error due to a difference in liquid level was minimized by designing the traps so that the volume displaced by the line pressure has a large diameter-to-length ratio. The traps had to be mounted close to the pipeline to minimize the pressuretime fluctuations of the manometer indications. The pressure readings were obtained in from 10 to 100 seconds , depending upon the flow rate, by taking photographs of the manometer board at each applied pressure. Thermocouples were mounted flush with the inside pipe walls in the center of each straight pipeline section and in both tanks. The temperatures ranged around 250 C. They were recorded on a self-balancing strip-chart potentiometer.
Two nominal pipe sizes were used. They were l-inch pipe, with a measured inside diameter of 0.95 inch, and 3/8-inch pipe, with a measured inside diameter of 0.50 inch. The flanges that were provided on each end of a straight section and fitting were the same for both pipe sizes. This made it possible to alternate pipes of different sizes in the pipeline setup and thus to obtain measurements for contractions and expansions in the ratio of 1:2. Other ratios of 1:12 and l:~ (into tank) of contractions and expansions were obtained in and out of the respective tanks.
The pipelines and fittings were not especially selected nor were they machined or tapped to fit each other. They were used in random order, so that it was possible to have a better fit for one test and a poorer fit for the next test. This by necessity caused some spread in the data, since a pressure loss due to a preceding poor fit will frequently extend over some of the following length of pipeline. Because of the random selection of pipelines and fittings this spread of data should be typical for any commercial pipeline system where often no selection or special care can be exercised.
The fittings over which the pressure losses were measured were 900
elbows and the most commonly used gate, ball, plug and globe valves. These fittings were chosen since the pressure losses of the more complicated fittings are frequently listed as multiples of the pressure losses of these typical fittings. The loss of a 900 elbow can be used, for instance, to represent the loss in a T fitting.
,
~ N o ~ ,

NACA TN 3889 5
PRESSURE LOSSES IN STRAIGHT PIPELINE SECTIONS
The total-pressure loss & in ·a pipeline system can be given as (ref s . 4 and 9)
& = p v
2 U ~ "2 D <p + CL ( 1)
The tranBition loss coefficient CL is zero in a straight and uniform
pipeline section. The friction factor <p for Newtonian, Bingham plastic, and pseudoplastic materials can be obtained from a friction-factor diagram as shown in references 4 and 5 if the flow properties of the material and t he mean velocity in the pipeline are known. The mean velocity v is obt ained by di viding the measured flow rate in the pipeline by the crosssect i onal area of the pipeline. The flow properties of the material and t he density p are determined separately. The length-to-diameter ratio LID of the pipeline is determined from length and diameter measurements.
Pressure losses of two slurries, a mineral oil, and a silicone fluid were measured in the I-inch pipeline system. Only laminar flow was obtained . The two.slurries were a suspension of titanium dioxide particles in water and a suspension of particles of magnesium in a hydrocarbon fuel. Measurements with an automatic concentric-cylinder rotational viscometer {ref . 14 ) indicated that the titanium dioxide slurry wa.s a Bingham plastic mat erial with a constant plastic viscosity and yield value at any constant t emperature, while the magnesium slurry was a pseudoplastic material with a str ucture number and an apparent viscosity that decreased with increasing r ates of shear for any constant temperature. The mineral oil and the silicone fluid were Newtonian liquids. The viscosity and density of the miner al oil were measured at the same temperature at which its pressure loss was determined over the pipeline. These two values were used in equation (1 ) t o verify the measured dimensions of the pipeline. The calculated values of LI D agreed with the measurements within 2 percent.
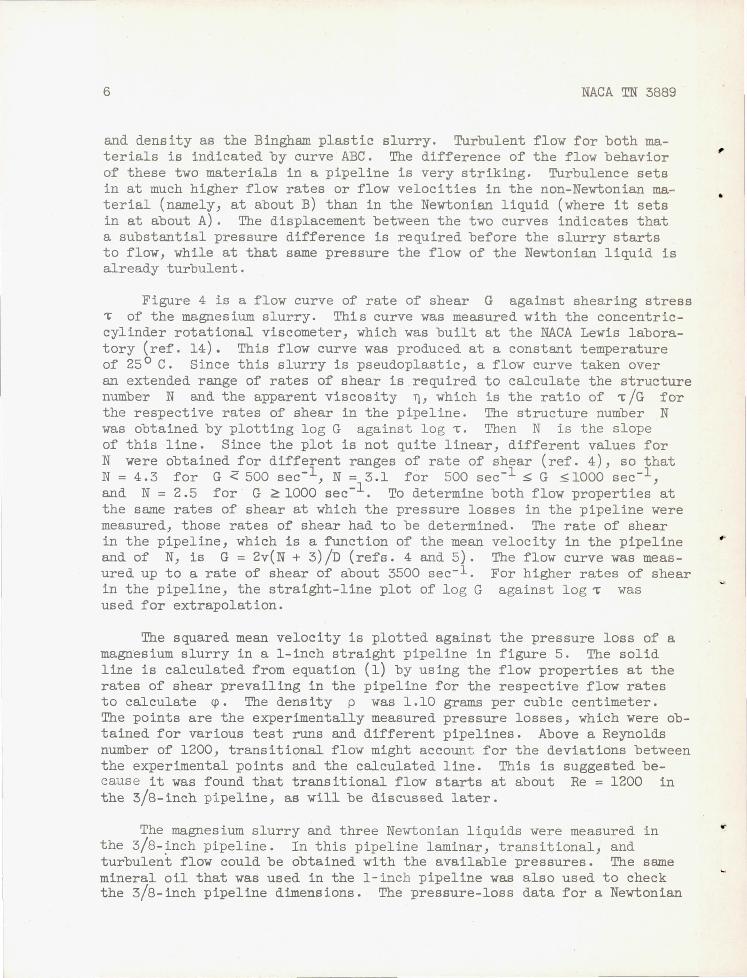
The pressure-loss data for the titanium dioxide slurry in the l-inch straight pipeline are plotted in figure 3. In this figure the squared mean velocity is plotted against the pressure loss. The solid line is calculated from equation (1). In order to do this, the friction factor <p has to b e obtained. It was determined for the measured plastic viscosity of 0 .26 poise and the measured yield value of 320 dynes per square cent i met er by using the generalized friction diagram (refs. 4 and 5). The dens i t y p of this material was 1.18 grams per cubic centimeter. These values were determined at 250 C. The points were experimentally obtained for f our pipeline sections, the length-to-diameter ratio of each pipeline be ing 34. In order to compare the pressure losses of a nonNewtonian mat erial in a pipeline with those of a Newtonian liquid, the dashed line i s calculated for a Newtonian liquid of the same viscosity
6 NACA TN 3889
and density as the Bingham plastic slurry. Turbulent flow for both materials is indicated by curve ABC. The difference of the flow behavior of these two materials in a pipeline is very striking. Turbulence sets in at much higher flow rates or flow velocities in the non-Newtonian material (namely, at about B) than in the Newtonian liquid (where it sets in at about A). The displacement between the two curves indicates that a substantial pressure difference is required before the slurry starts to flow, while at that same pressure the flow of the Newtonian liquid is already turbulent.
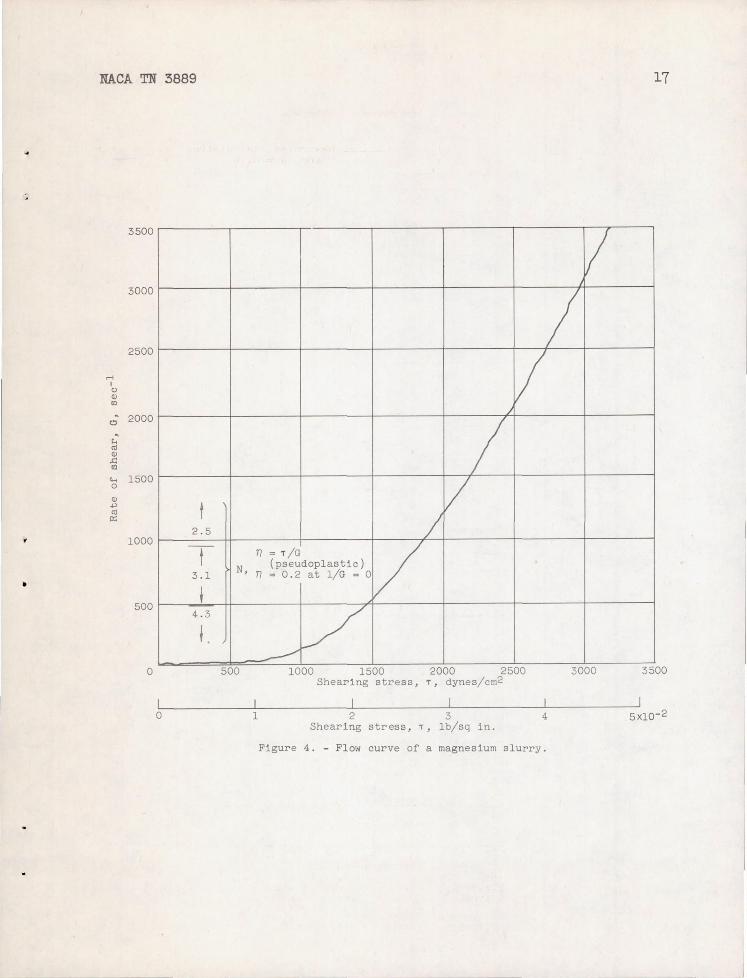
Figure 4 is a flow curve of rate of shear G against shearing stress ~ of the magnesium slurry. This curve was measured with the concentriccylinder rotational viscometer, which was built at the NACA Lewis laboratory (ref. 14). This flow curve was produced at a constant temperature of 25 0 C. Since this slurry is pseudoplastic, a flow curve taken over an extended range of rates of shear is required to calculate the structure number N and the apparent viscosity ~,which is the ratio of ~/G for the respective rates of shear in the pipeline. The structure number N was obtained by plotting log G against log~. Then N is the slope of this line. Since the plot is not quite linear, different values for N were obtained for different ranges of rate of shear (ref. 4), so that N = 4.3 for G <: 500 sec- l , N = 3.1 for 500 sec- l :s;: G 51000 sec- l , and N = 2.5 for G ~ 1000 sec-I. To determine both flow properties at the same rates of shear at which the pressure losses in the pipeline were measured, those rates of shear had to be determined. The rate of shear in the pipeline, which is a function of the mean velocity in the pipeline and of N, is G = 2v(N + 3)/D (refs. 4 and 5). The flow curve was measured up to a rate of shear of about 3500 sec- l . For higher rates of shear in the pipeline, the straight-line plot of log G against log ~ was used for extrapolation.
The squared mean velocity is plotted against the pressure loss of a magnesium slurry in a l-inch straight pipeline in figure 5. The solid line is calculated from equation (1) by using the flow properties at the rates of shear prevailing in the pipeline for the respective flow rates to calculate ~. The density p was 1.10 grams per cubic centimeter. The points are the experimentally measured pressure losses, which were obtained for various test runs and different pipelines. Above a Reynolds number of 1200, transitional flow might account for the deviations between the experimental points and the calculated line. This is suggested because it was found that transitional flow starts at about Re = 1200 in the 3!8-inch pipeline, as will be discussed later.
The magnesium slurry and three Newtonian liquids were measured in the 3/8-~nch pipeline. In this pipeline laminar, transitional, and turbulent flow could be obtained with the available pressures. The same mineral oil that was used in the I-inch pipeline was also used to check the 3!8-inch pipeline dimensions. The pressure-loss data for a Newtonian
,
•
•
•
NACA TN 3889
liquid are shown in figure 6, and for a magnes ium slurry in figure 7. Again, the squared mean velocity is plotted against the pressure loss.
7
The Newtonian liquid is a silicone fluid and has a viscosity of 0.1 poise and a density of 0.98 gram per cubic centimeter at 250 C. The solid lines are calculated from equation (1), and the points are the experimental measurements obtained for various test runs and different pipelines. At Reynolds numbers of Re < 1200 the flow in both the silicone fluid and the slurry is laminar, and the experimental points corroborate the calculations. That is also the case for Reynolds numbers Re ~ 3100, except that then the flow is turbulent. In turbulent flow the calculations were made for smooth pipelines. In the Reynolds number range between 1200 and 3100 the flow is apparently transitional; and, since these pipelines were not perfectly matched and surfaced, the experimental data deviate from the calculations in tbis region. However, the deviations even in this region are small when considering practical applications.
In turbulent flow the rates of shear in the pipelines are rather high, but difficult to determine. Therefore, an apparent viscosity extrapolated to infinite rate of shear Was used to determine Re in the case of the pseudoplastic magnesium slurry. To obtain this viscosity the reciproca l values of the rates of shear l/G were plotted against the respective apparent viscosities ~ (ref. 15). This plot was almost a straight line
above G = 5000 sec-l , with an intercept at the apparent-viscosity axis. This intercept at l/G = 0 represents the apparent viscosity at infinite rate of shear. This apparent viscosity was equal to 0.20 poise and is used in all turbulent-flow calculations for the magnesium slurry. No structure number N is required, since in turbulent flow the pressure loss of a nonNewtonian material depends on one flow property only, the viscosity (ref. 4). To obtain turbulent flOW, especially with the slurry, pressures above 60 pounds per square inch had to be applied. At those pressures minute leaks frequently developed in the airlines to the manometers. When the non-Newtonian slurries were being tested, these leaks caused the traps to fill rapidly with slurry; and, since these slurries had difficulty in flowing back into the pipelines, these leaks led to errors in the pressureloss measurements. Thus, fewer and less reliable data were obtained for turbulent flow than for laminar and transitional flow.
PRESSURE LOSSES IN PIPELINE TRANSITIONS
The transition loss coefficient CL for a pipeline transition as given in equation (1) is the coefficient for the total-pressure loss. In this investigation static-pressure losses were measured, from which CL was determined. In most fittings such as elbows and valves the
-------------- --- - -

8 NACA TN 3889
transition 10s6 coefficient CL equals the transition 10s6 coefficient
Cs , which is obtained from static-pressure measurements. However, in transitions such as expansions and contractions that is not the case. The following relations (ref. 10) exist:
For expansions:
( 2)
For contractions:
( 3)
where Vo is the mean velocity in the larger pipe and v is the mean
velocity in the smaller pipeline.
In the literature, the pressure losses in pipe transitions are frequently given in numbers of "velocity heads." For transitions such as contractions and expansions, which are considered to have "zero" length, the number of velocity heads is identical to the transition loss coefficient CL• This, however, is not necessarily so when considering transi-
tions such as elbows, valves, and other fittings. Fittings in analogy to a pipeline have a definite length, which is the length that separates the two pipeline sections between which the fitting is inserted. Therefore, the pressure losses that are measured over these pipeline transitions are considered as composed of a "transition loss" and of an "equiva~ent pipe lOss." The latter is equivalent to the pressure loss in a straight pipeline section with a length equal to that of the transition and with a diameter equal to that of the connecting pipelines. If the equivalent pipe loss is small compared with the transition loss, the number of velocity heads and the transition loss coefficient CL will be approximately
equal. This is usually the case in turbulent flow. However, in laminar flow the equivalent pipe loss can become large compared with the transition lossj and, since in laminar flow the equivalent pipe loss increases with increasing Reynolds number at a rate that is less than proportional to v 2 , the number of velocity heads will then not be a constant. Thus, to determine transition loss coefficients, which are independent of the velocity in the pipeline system, the equivalent pipe losses were deducted from the measured pressure losses. This was also done to obtain the transition loss coefficients for contractions and eXpansions, since the pressure losses of these transitions also had to be measured over a finite length. The equivalent pipe loss is calculated from equation (1) by treating the transition as if it were a straight and uniform pipeline for which CL = 0 with a length equal to that over which the pressure loss was meas-
ured and with a diameter equal to that of the connecting pipelines. In
•
•
N I
P=1 o
•
NACA TN 3889 9
contractions and expansions the equivalent pipe loss in the larger diameter pipeline can usually be neglected. In laminar Rnd turbulent flow the equivalent pipe losses were calculated by using equation (1) and references 4 and 5; however, in transitional flow the experimental data were used to calculate the equivalent pipe losses.
The transition losses that are available in the literature for Newtonian liquids are given either as numbers of velocity heads or as transition loss coefficients. These values from the literature are listed in table I together with the transition loss coefficients obtained in these studies.
For turbulent flow, experimental data are available in the literature for some valves, elbows, contractions, and expansions (refs. 9 and 11). In laminar flow the transition loss coefficients for contractions, also called "entrance loss coefficients," have been calculated (ref. 12) and experimentally verified. Some experimental data are given for elbows for laminar and turbulent flow in reference 13. The experimental data for elbows for laminar flow (ref. 13) were recalculated to represent numbers of velocity heads. These values were found .to decrease with increasing Reynolds number. This is not surprising, since the equivalent pipe loss would increase with increasing Reynolds numbers at a rate that is less than proportional to v2 •
The transition loss coefficients obtained in these studies for elbows in laminar flow seem independent of the velocity in the pipeline. An example of this is shown in figure 8. Figures 8 and 9 are examples of the experimental pressure losses obtained over the different transitions, from which the transition loss coefficients were calculated. Figure 8 gives the pressure-loss measurements across a 3!8-inch 900 elbow in laminar and transitional flow. Figure 9 represents the pressure losses over l-inch gate and globe valves in laminar flow. The points are the experimental pressure-loss measurements obtained for two test runs. The solid lines represent the computed pressure losses over the transition when the calculated constant value of CL is used in equation (1), and the dashed lines
represent the equivalent pipe losses obtained from equation (1) for CL = O.
Table I indicates a moderate spread in the data for the transition loss coefficients that were obtained for the same transition and pipe size for the different Newtonian liquids. This spread, as previously mentioned, is due to the fact that the pipelines and pipe transitions were used in random order and no attempt was made to fit them to each other. The transition loss coefficients from any test without change in setup were within 10 percent or ±0.2, whichever was greater. But the coefficients tabulated in the table are averages obtained from many tests, where some measurements were made after a complete reassembly of the pipeline system. Therefore, the errors in the tabulated data could be greater than ±10 percent or ±0.2 because of changes in alinement for the different tests. Two

10 NACA TN 3889
distinct average values were obtained with the magnesium slurry for the transition loss coefficients in the 3/8-inch globe valve and the 3/8-inch elbow. The two values for the globe valve are within the stated uncertainty. The two values for the elbow differ appreciably. These measurements, in contrast to all others, included the length of two flanges. Since the transition loss coefficient over a flange could r ange from 0 to about 0.4 depending upon the alinement, a difference in alinement of the elbow in regard to its neighboring pipelines could account for the fact that two distinct values were repeatedly obtained for this transition loss coefficient. The measurements that gave one of these two values are shown in figure 8.
A study of table I shows that the transition loss coefficients obtained for the different Newtonian liquids vary over the same range as those obtained for the non-Newtonian materials. This indicates that the transition loss coefficients obtained from Newtonian liquids are valid at least for such non-Newtonian slurries as were treated in these studies.
The transition loss coefficients for the fittings, which were obtained for laminar flow in the pipelines, do not seem to differ much from those obtained for turbulent flow. This is not surprising, since the pressure losses in fittings are due to a combination of contractions and expansions and the transition loss coefficients Cs for static-pressure
losses in contractions are not much higher for laminar flow than for turbulent flow, namely in the ratio of 2.2 to 1.5. In fact, a careful study of table I indicates that the transition loss coefficients for the fittings might be somewhat smaller in turbulent flow than in laminar flow.
Two pipe sizes were used to determine whether the transition loss coefficient changes with pipe size. Even though the data are not sufficient to give a definite answer, they indicate that the transition loss coefficients are not much affected by the pipe size. Again, this would be expected, since the transition loss coefficients for the contractions and expansions also are hardly affected by the pipe size. The transition loss coefficient for the globe valve is somewhat higher for the 3/8-inch valve than for the l-inch valve. The ratio of the orifice diameters of these two valves is 2.3, while the r a tio of the pipe diameters is only 1.9. Therefore, the difference in transition loss coefficients for these two valves might be explained by differences in the construction of the two valves rather than in the pipe size.
CONCLUDING REMARKS
Experimental pressure-loss data have been presented for two nonNewtonian slurries that flow like a Bingham plastic and a pseudoplastic
•

•
..
NACA TN 3889 11
material. These data show that pressure losses in straight and uniform pipelines can be calculated if the density, the flow properties for the pipeline flow condition, and the mean velocity in the pipeline are known. For the pseudoplastic slurry these data are determined for laminar, transitional, and turbulent flow in the pipeline. The calculated and experi- . mental pressure losses agree closely in the laminar- and turbulent-flow regions but deviate for transitional flow. However, these deviations are negligible in most cases where practical applications are considered.
Pressure losses over pipeline transitions such as valves, 900 elbows, contractions, and expansions were measured for these same slurries and some Newtonian liquids for laminar, transitional) and turbulent flow in the pipeline. Transition loss coefficients, which are independent of the flow rate in the pipelines, even for laminar flow in the pipeline system, were determined for these transitions. The data indicate that for nonNewtonian slurries such as those considered in these studies the transition 10s8 coefficients are equal to those obtained for Newtonian liquids within the spread of the experimental data. Thus, in designing a pipeline system for similar non-Newtonian slurries, such as a fuel system for a ram jet or an afterburner or for a homogeneous reactor, the sizing of the pipeline system can be done by using the transition loss coefficients established for Newtonian fluids.
The transition loss coefficients for the fittings seem to be nearly the same for laminar and turbulent flow in the pipeline system, at least within the spread of the experimental data, except that those for contractions are higher in laminar than in turbulent flow. The data obtained for the two pipeline sizes seem to indicate that the transition loss coefficients are almost independent of the pipeline size.
Lewis Flight Propulsion Laboratory National Advisory Committee for Aeronautics
Cleveland, Ohio, September 20, 1956
REFERENCES
1. Gammon, Benson E.: Preliminary Evaluation of the Air and Fuel SpecificImpulse Characteristics of Several Potentie.l Ram-Jet Fuels. IIMagnesium, and Magnesium - Octene-l Slurries. NACA RM E51C23, 1951.
2. Breitwieser) Roland, Gordon, Sanford, and Gammon, Benson: Summary Report on Analytical Evaluation of Air and Fuel Specific-Impulse Characteristics of Several Nonhydrocarbon Jet-Engine Fuels. NACA RM E52L08, 1953.
12 NACA TN 3889
3. Kitzes, A. S., and Lyon, R. N.: Aqueous Uranium and Thorium Slurries. p/8ll, International Conference on the Peaceful Uses of Atomic Energy. Vol. 9. United Nations Pub. (N.Y.), 1956, pp. 414-422.
4. Weltmann, Ruth N.: An Evaluation of Non-Newtonian Flow in Pipe Lines. NACA TN 3397, 1955.
5. Weltmann, Ruth N.: Friction Factors for Flow of Non-Newtonian Materials in Pipelines. Ind. and Eng. Chern., vol. 48, no. 3, Mar. 1956, pp. 386-387.
6. Hedstrom, Bengt O. A.: Flow of Plastic Materials in Pipes. Ind. and Eng. Chern., vol. 44, no. 3, Mar. 1952, pp. 651-656.
7. Metzner, A. B., and Reed, J. C.: Flow of Non-Newtonian Fluids -Correlation of the Laminar, Transition, and Turbulent-Flow Regions. A.I.Ch.E. Jour., vol. 1, no. 4, Dec. 1955, pp. 434-440.
8 . Christiansen, E. B., Ryan, N. W., and Stevens, W. E.: Pipe-Line Design for Non-Newtonian Fluids in Streamline Flow. A.I.Ch.E. Jour., vol. 1, no. 4, Dec. 1955, pp. 544-548.
9. Rouse, Hunter, and Howe, J. W.: Basic Mechanics of Fluids. John Wiley & Sons, Inc., 1953.
10. McAdams, William H.: Heat Transmission. Third ed., McGraw-Hill Book Co., Inc., 1954.
11. Perry, John H., ed.: Chemical Engineers' Handbook. Third ed., McGrawHill Book Co., Inc., 1950.
12. Schiller, L.: Die Entwicklung der laminaren Geschwindigkeitsverteilung und ihre Bedeutung fur Zahigkeitsmessungen. Z.a.M.M., Bd. 2, Heft 2, Apr. 1922, pp. 96-105.
13 . Wilson, Robert E., McAdams, W. H., and Seltzer, M.: The Flow of Fluids through Commercial Pipe Lines. Ind. and Eng. Chern., vol. 14, no. 2, Feb. 1, 1922, pp. 105-119.
14. Weltmann, Ruth N., and Kuhns, Perry W.: An Automatic Viscometer for Non-Newtonian Materials. NACA TN 3510, 1955.
15. Goodeve, C. F., and Whitfield, G. W.: The Measurements of Thixotropy in Absolute Units. Trans. Faraday Soc., pt. 3, vol. 34, Mar. 19 38 , pp. 511-520.
,
•

TABLE I. - TRANSITION LOSS COEFFICIENTS FOR PIPELINE TRANSITIONS
Flow Transition Mineral oil Silicone Silicone Mg slurry Ti02 slurry (~ ~ 1.S~ fluid fluid (pseudoplastic) (Bingham p - 0.88 (~ ~ 0 .1, (~ - 0.2, Nand n
p - 0.98) p ,. 0.98) U - 0 . 2S, f - 320)
Transition loss coefficients Cs for pipe diameters of -
0.50" 0.95" 0.50" 0.95" 0 . 50" 0 . 50" 0.95" 0.95"
Laminar Expansion: 1:- 0 1:12 0 0 0 1:2 0 0 0.1 0
Contraction: .:1 2 . 2
12:1 2.2 2.2 2.2 2:1 2.0 2.1 2.1 2.0
Valve: Gate 1.0 0.4 0.8 0.7 0.7 0.8 Ball 1.1 .7 1.2
/ Plug 1.2 1.3 1.1 Globe 7 . 6 4 . 2 S.5 5.8,7.1 4.6 4.4
900 Elbow 0 . 6 1.5 1.5 1.3 0.8,1.5 1.4 1.5 Transi- Expansion: tional 1: . 0
1 : 12 1 : 2 0.1 0
Contraction: -:1 1.5
12 : 1 2:1 1.4 1.4
Valve: Gate 0.7 0.6 O.S Ball Plug 1.3 1.0 Globe 7.7 4.3 4.5 5.0
900 Elbow 1.0 1.3 0.8,1.5
Turbu- Expansion: lent 1:110 0
1:12 1:2 0.1 0
Contraction: .:1 1.5
12:1 2:1 1.4 1.3
Valve: Gate 0.7 Ball Plug 1.3 1.0 Globe 7.7
90 0 Elbow 0.7 0.9 - ---- - - --- ---
aNumber of velocity heads.
bCalculated from experimental data of ref. 13.
· 4204 •
Literature, Newtonian fluids
Cs CL
2.1S LIS 2.lS LIS 2.1S LIS
0.7-2.5 a,oO.7_2 . 5
0 1.0 0 1.0 - 0 . 4 .S
1.5 0.5 1.5 .5 1.3 .3
0.1-0.2 aO.l-0.2
S-IO as-lO
0.7-1.3 aO.7-1.3
~ > ~ UI CO CO to
t-' UI
14 NACA TN 3889
13 Q)
+' Ul h Ul
~ 0 .--l 'H
Q)
I=l ...... .--l Q)
P< ...... P<
'H 0
,q ,. P< ttl H !lIJ 0 +' 0
~
~ Q)
H
~ .r< J%<
--~- -----

Flow indicator
Control valve
..
A A A A A
A
To manometers
Typical pressure pickup
A A A
A. A
Traps
Pipe or ranslt10n
A
A
A A
A
Figure 2. - Schemat1c sketch of pipeline flow system ("A" indicates cormectlon to manometer traps).
A A
A A
4204
A
•
o Fuel tonk
FloW' indicator
Icr-S?:'4!
~ &: ~ C..I'l CD CD (!)
I-' U1

16
20 18
16
160
14
(\J (\J
<.l <.l QJ QJ 12 '" '" '-.... ~ ...,
"-< <.l
120 (\J (\J
> > , 10
;., ;., ..., ..., orl orl <.l <.l 0 0 rl rl QJ QJ > > C c 8 cd cd QJ QJ E 80 E
'd 'd QJ QJ ~ ~ cd cd ;:l ;:l 6 0' 0'
ct) ct)
4 40
2
o 0
NACA TN 3889
4 XIO I I I I --- Newtonian, calculated for
~ = 0.26, P = 1.18 Bingham plastic, calcu-
lated for U = 0.26, Ie r---- f = 320, P = 1.18
V 00'11::. Ti02 slurry, experimental for various pipeline sections /
/ AB
/// /
/ l: / 1::. 0 '1 U ~ 1// .J ill
/
l:i~ / Op /
/ /
"A. vr , /
yAQ / /
/ '1~ 1 ~ /A '16. gf;.
~ I
/ L ' I'm-
/
~ /
o~i / .,..../
2 4 6 8 10 12 Pressure loss, 6P, dynes/cm2
1 1 0 .5 1.0 1.5
Pressure loss, 6P, Ib/sq in.
Figure 3. - Pressure losses of titanium dioxide slurry in I-inch straight pipelines. Length-diameter ratio, 34.
2 .0
•
NACA TN 3889 17
3500
/ 2500
rl I t.) Q) co
3000
L V
0 2000 ~
r.. ttl Q)
..c: co .... 1500 0
Q) ~ ttl p:;
1000
L
L t V
J 2.5
-t n = T /0 V N, (pseudoplastic) 3.1 n = 0.2 at 1/0 = 0
~ 4.3 V L
-------
500
o 500 1000 1500 2000 2500 3000 3500 Shearing stress, T, dynes/cm2
o 1 2 3 4 Shearing stress, T, Ib/sq in.
Figure 4. - Flow curve of a magnesium slurry.

18
600
500
C\l 400
<l Q) (/l
......... C\l ....,
""' <l Q) (/l
(\J ~ > <l
» ...., (\J ..... > <l 300 0 rl » Q) ...., > .....
<l so: 0 ro rl Q) Q)
E > '0 so: Q) ro ~ Q)
ro E ;:l 0' '0 CIl Q)
200 ~ ro ;:l 0' CIl
100
o
NACA TN 3889
50X104
OO.6'V Mg slurry, experimental for various test runs
45 and pipelines Pseudoplastic, calcu-
lated for p = 1.10; 0 N = 4 . 3, 3.1, 2.5; TI = T /G (fig. 3), where G = 2v(N + 3)/D 0 0
40 0
.6
.6 0
35 0 .6
'0 0
30 .6
'V
25 Re • 1200
20
.6
15
10 ~------+--------r--~~~no-.~--+-------~
5 ~-------+--------~-4~~~~-------4--------~
o
o
10 20 30 40 Pressure loss, 6P, dynes/cm2
I o 1 2 3 4 5 6 7 8
Pressure loss, 6P, Ib/sq tn.
Figure 5. - Pressure losses of magnesium slurry in I-inch straight pipelines. Length - diameter ratio, 34.
;:
•

i
,
NACA TN 3889 19
20 XI04 I I I A
200
Newtonian, calculated
10' for IJ. = 0 . 10, P = 0.98
o I::.. Silicone fluid, ex-
180 16
160
14 N
C)
<lJ
140 rn N ~
C) C)
<lJ ~ 12 rn ""'-.p N '+-< >
120 »
N .p > .;
C) 10 ~ 0 » rl
.p <lJ
.; 100 >
C)
0 C rl (\j <lJ <lJ > E
C '1:l 8 (\j <lJ <lJ 80 I'< E (\j
;; '1:l 0' <lJ r:fl I'< (\j ;; 6 0'
r:fl 60
perimental for two
[ test runs
r-.
r M( ~
0
0
~ AI
V I
u
- Re = 3100 -
;!
18
I ~ 40 6~6
4
20 2
o
J~ - r = 1200 ~
o 5 10 15 20 25 Pressure loss, t,p, dynes/cm2
I I I I o 1 2 3 4 5
Pressure loss, t,p, Ib/sq in.
Figure 6. - Pressure losses of silicone fluid in 3/8-inch straight pipelines. Length-diameter ratio, 66.

20
2000
1800
1600
(\J
<:)
1400 Q)
(\J Ul
<:) 'g-Q) <:)
Ul
""-..., "-< (\J
1200 :>
(\J ?> :> ..., ...
<:)
?> 0 ..., rl ... Q) <:) 1000 :> 0 rl .:: Q) cd :> Q)
E .:: cd '0 Q)
800 Q)
E H cd
'0 ;:l Q) 0' H U) cd ;:l 0'
U)
600
400
200
o
NACA TN 3889
200 XI04 Pseudoplastic cal- 0 culated for
p = 1.10; N = 2.5; n = T /G (fig. 3), 0 where
180 G = 2v(N + 3 J/D 0 OLlO\7 Mg slurry, experi- 0
mental for l::6. various test 0 runs and pipe-
lines 160
0
140 0
Ll
0 120
- Re 3100 -
100
80
0
60
40 - Re
20~------~-'~~~--------~------~--------~------~
o 50 100 150 200 250 Pressure loss, 6P, dynes/cm2
I I I I o 10 20 30 40
Pressure loss, 6P, Ib/sq in.
Figure 7. - Pressure losses of magnesium slurry in 3/8-inch straight pipelines. Length-diameter ratio, 66.
50
..
,

NACA TN 3889 21
1100 100 X104 I
~! 1000
90
900 80
800
70 N N
() ()
Q) Q) <1) <1)
"-.. .p 700 ~ 4-< ()
60
N N > >
600 » » .p .p oM ..-I () () 50 0 0 rl rl Q) Q)
> 500 > c c '" '" Q) Q)
E E 40 '<::l '<::l Q) Q)
H 400
H
'" '" ;:; ;:; 0- 0-
CIJ CIJ
30 300
20 200
100 10
o 0
I 0
I I I I II I I
~ 0
I
I l I I
I [6 I I )
6.
I 6.
I ;f I
I 6.V 0
I I I I 1/
u
- Re = 1200 - I 6. I
J 0
I I -- Calculated equivalent
I pipe loss
--- Computed pressure loss
I across elbow for CL = 1. 5
I
V 6.0 Mg slurry, experimental
I for two test runs
I.~t
0( ~ 20 40 60 80 100 120
Pressure loss, 6P , dynes/cm2
I I I I I I I I I 2 4 6 8 10 12 14 16 18
Pressure loss, 6P , lb/sq in.
Figure 8. - Pressure losses of magnesium slurry in 3/8- inch 900
elbow. Length- diameter ratio , 24 ; transition loss coefficient, CL' 1. 5 .
140Xl04
20
I
J

22
300
250
200
150
100
50
(\J (\J
" " ., ., III III
"- ';a-.., 0 .... " , ,
(\J (\J
> >
:.: :.: .., .., ,... ,... " " 0 0
..... ..... ., ., > >
" " '" '" ., 300
Q)
E E
'" '" ., Q)
H H
'" '" " " .,. .,. '" 250 '"
200
150
100
50
0
25Xl04
20
15
10~----~+---~~~------~------~------~
5~----~~~-----
o 5 10 Pressure loss,
I o 1
Pr essure loss ,
60
LIP,
Calculated equivalent pipe loss
Computed pressure loss across valve
Mg slurry, exper i mental for two test
• 15 20xl04
dynes/cm2
I 2 3
LIP, lb/sq in .
(a) Gate valve . Length - diameter ratiO , 4 . 5 ; transition loss coefficient, CL, 0.8 .
30xl04 -----.---------r--------~---=---r--------,
NACA TN 3889
0 20 40 60 80 100x1Q4
I 0
Pressure loss, LIP , dynes/cm2
I I 2 4 6 8 10 12
Pressure loss , LIP , lb/sq in .
(b) Globe valve. Length- diameter ratiO, 7 . 1 ; transition loss coefficient, CL, 4.6 .
Figure 9 . - Pres sure losses of magnesium slu rry in I- i nch gate and globe valves .
NAC A - Langley Fie ld , Va .


![Materials Science and Engineering Avolinsky/UFGSteel.pdf · aluminum and some of its alloys [9,10], magnesium alloys [11], titanium[12],middleandlowcarbonsteels[13,14].However,there](https://img.pdfslide.us/doc/110x75/60c5d1ac7a08944929157e21/materials-science-and-engineering-a-volinsky-aluminum-and-some-of-its-alloys.jpg)