Embed Size (px)
Citation preview
Pressure and Temperature Behavior of ThermoplasticPolymer Melts During High-Pressure ExpansionInjection Molding
Saso Rogelj,1 Matjaz Krajnc21 Lesnik L.L.C., Zgornje Bitnje 100a, SI 4209 Zabnica, Slovenia, EU
2 Faculty of Chemistry and Chemical Technology, University of Ljubljana, Askerceva 5,SI 1000 Ljubljana, Slovenia, EU
The development of expansion injection molding asnew technology for producing thin plastic parts hasraised questions about polymer melt behavior in theprocess of rapid high pressure compression andexpansion. To investigate those phenomena, the newin-line injection molding machine mounted measure-ment system has been developed. Measuring nozzleequipped with hydraulically driven closing bolts andcontact fast response pressure and infrared tempera-ture sensors enabled us to measure the compressionand expansion of polymer melts at different startingconditions. Results presented for high impact polysty-rene and polyamide show that polymer melt tempera-ture rise is linearly dependent on compression pres-sure as well as it is dependent on compression speed.Comparable effect of temperature fall has beenrecorded during the polymer expansion, resulting in nonoticeable loss of dissipation energy during this re-versible process. Measurements have been comparedwith modified 2-domain Tait equation of state. Curvefitting analysis to manufacturer’s material data showthat measurements fit well with the model, even at veryhigh compression speeds. POLYM. ENG. SCI., 48:1815–1823, 2008. ª 2008 Society of Plastics Engineers
INTRODUCTION
Plastic products are indispensable in our everyday life.
They are made out of different kind of polymeric materi-
als, most commonly out of thermoplastic polymeric mate-
rials.
Thermoplastic polymeric materials consist mostly of
high molecular weight polymers which are deformable
when heated to liquid melts, and plastic when cooled suf-
ficiently to brittle, glassy state. Using processes like injec-
tion molding, these materials can be remelted and
remolded in new shape several times.
Today, the injection molding is the most used method
for producing plastics parts. Process starts with plasticiz-
ing of the polymer granulate in the injection unit. With
the advance of the plasticizing screw, molten polymer
material is injected at high pressure in the mold cavity of
desired product shape. After cooling time and solidifying
of the polymer material, mold halves open and the prod-
uct is ejected. With the closure of the mold, the new
injection molding cycle starts.
Number of products per time unit determines the yield
of the process. Therefore shorter cycle times are an objec-
tive. Parts with thinner wall need shorter cooling time,
which contribute to the trend of the miniaturization of
components but need significantly higher injection speed.
Higher injection speeds are needed, because during the
injection of polymer melt into the cavity, melt quickly
solidifies in contact with colder mold surface. This hap-
pens only to thin melt layer near the mold wall, whereas
the melt core solidifies slower because of small thermal
conductivity of polymers. Polymer thermal conductivity
values are about two or three orders of magnitude lower
than values of most metals [1]. Therefore, when produc-
ing thin products, the whole cavity has to be filled in very
short time to prevent solidification of melt before the end
of the flow path. Classic approach to increase injection
speed is to use the accumulator supported hydraulic. The
hydraulic oil is pressurized in the accumulator and then
released to push plasticizing screw forward and thus
injecting polymer melt. At plasticizing screw speeds over
600 mm/s, this becomes highly demanding because large
amount of oil has to be transferred in controlled condi-
tions in very short time. Highly dynamic servo-valves and
64bit electronics are needed to control rapid acceleration
to full speed in less than a tenth of a second [2]. Today,
fast cycling injection molding machines can achieve plas-
ticizing screw movement speeds of 1000 mm/s [3].
Correspondence to: Matjaz Krajnc; e-mail: [email protected]
Contract grant sponsor: Ministry of Higher Education, Science and Tech-
nology of Republic of Slovenia; contract grant number: 3311-03-831832.
DOI 10.1002/pen.21149
Published online in Wiley InterScience (www.interscience.wiley.com).
VVC 2008 Society of Plastics Engineers
POLYMER ENGINEERING AND SCIENCE—-2008
Despite achieving very high plasticizing screw move-
ment speeds, it has been found out that the flow front of
polymeric material has much lower speed [2, 4]. Large
part of energy introduced during the screw movement is
used to compress the melt in the barrel in front of the
screw, which results in delayed and slower movement of
polymer flow front. It is commonly known that polymers
are viscoelastic substances which deform under stress,
and quickly return to their original state once the stress is
removed. When the load is applied, long polymer mole-
cule chains rearrange and change position. Through this
process they dissipate energy and in comparison with
elastic materials lose some energy as heat. Because of its
chemical structure, during compression different polymers
experience different volume deformation. In general, at
about 200 MPa polymer volume reduction for about 10%
may be expected [4]. Volume reduction is defined with
change of specific volume as function of temperature and
pressure. The relationship between those state variables
has been investigated thoroughly through the past. Labo-
ratory machines working on different principles have been
developed especially for measurement of those material
properties. Two such major experimental techniques were
surveyed by Zoller and Fakhreddine [5].
The desirability of formulating an adequate equation of
state (EOS) to follow those measured relations formed
many mathematical models. Spencer and Gilmore pub-
lished simplified version of well-known van der Waals
equation [6]. With desire to predict shrinkage and warp-
age of polymer products while cooling in molds, models
that include also cooling rate effects and crystallization
kinetics when cooling into solid state were developed.
Rodgers [7] reviewed classical Tait equation and six other
theoretical equations of state including lately frequently
used Simha-Somcynsky hole model [8]. Among many
models for representing EOS, Tait equation is purely em-
pirical and assumes that the specific volume only depends
on pressure and temperature [9]. This equation was
derived by Tait in 1888 and is still one of the most used
and proven approximations of actual PVT behavior [10].
2-domain Tait equation uses high temperature asymptote
besides low temperature asymptote to represent solid
state. Both asymptotes are connected with Nakamura
equation at pressure-dependent transition temperature
[11]. This equation is further modified into modified 2-do-
main Tait Equation [12, 13], where in range close to tran-
sitional temperature, low temperature asymptote exponen-
tially approaches melt asymptote, as observed at many
semicrystalline polymers.
Those equations predict compression volume of poly-
mer melts, which may be then used for expansion into a
mold cavity. As a result of that finding, new injection
molding process known as expansion injection molding or
‘‘Xmelt’’ has been recently developed and patented [2, 4,
14]. The expansion injection molding process takes
advantage of the polymer compressibility and is using
compressed polymer melt as the energy accumulator for
expansion into the mold cavity. During the injection
phase, with rotation of the plasticizing screw, polymer
melt is plasticized and transferred in front of plasticizing
screw. With forward movement of the screw, polymer
melt is then compressed against closed shut-off nozzle or
closed hot runner system to high pressure. With opening
of the nozzle or hot runner, the melt is then released to
rapidly expand into the product cavity.
Because of the absence of the screw movement in the
injection phase, expansion injection molding represents a
new step in development of micro and thin wall injection
molding. Using this technology, until now the highest
injection speeds are achieved. Questions how polymer
melts behave in such conditions arise, and therefore pres-
sure and temperature behavior in compression and expan-
sion process has been investigated. Questions also arise,
whether pressure-volume-temperature data measured in
laboratory at isotherm or isobaric conditions also hold for
this highly dynamic industrial process.
To be able to examine the behavior of polymer melts
in the process of compression and expansion, special
measuring nozzle has been developed and mounted to full
electric injection molding machine. Objective of the noz-
zle as the main measurement tool in this research is to
follow pressure and temperature behavior of polymer
melts in this high pressure and high speed process of
compression and expansion at true industrial conditions of
expansion injection molding.
EXPERIMENTAL
Nozzle Design
Measuring nozzle is based on well known slit die rhe-
ometer principle [1], but to be used at true industrial con-
ditions it had to be transferred from lab extruder to an
injection molding machine as already reported before
[15–17]. To be able to follow polymer melt compression
and expansion, nozzle has been further developed and
upgraded with two hydraulically driven bolts able to close
or open the melt channel.
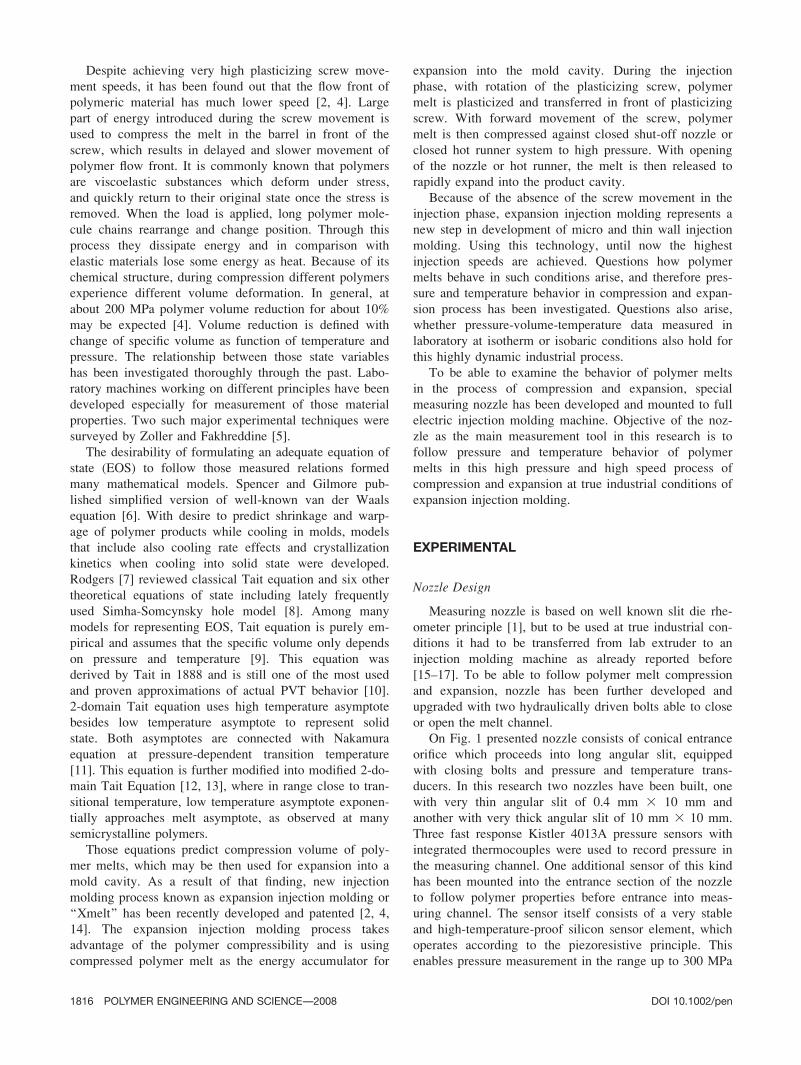
On Fig. 1 presented nozzle consists of conical entrance
orifice which proceeds into long angular slit, equipped
with closing bolts and pressure and temperature trans-
ducers. In this research two nozzles have been built, one
with very thin angular slit of 0.4 mm 3 10 mm and
another with very thick angular slit of 10 mm 3 10 mm.
Three fast response Kistler 4013A pressure sensors with
integrated thermocouples were used to record pressure in
the measuring channel. One additional sensor of this kind
has been mounted into the entrance section of the nozzle
to follow polymer properties before entrance into meas-
uring channel. The sensor itself consists of a very stable
and high-temperature-proof silicon sensor element, which
operates according to the piezoresistive principle. This
enables pressure measurement in the range up to 300 MPa
1816 POLYMER ENGINEERING AND SCIENCE—-2008 DOI 10.1002/pen
(3000 bar) and 3508C. Usual piezoelectric pressure
sensors used in injection molding molds are not suitable
for use in the nozzle of an injection molding machine.
Sensor element is located directly behind the extremely
rugged steel diaphragm. The design of the sensor requires
no transmission medium and has very good stability under
load [18]. As those sensors also have integrated thermo-
couples, it was possible to measure temperature as well.
In contrast to fast pressure measurement, fast temperature
readout of the sensor can not be expected. This is due to
contact with the nozzle wall and the thermal capacity of
the sensor itself. This temperature readout was used to
control the nozzle temperature state and to control the
infrared temperature sensor response in an isothermal
state. Because of extremely rapid dynamics of polymer
melt expansion, fast response temperature sensors were
searched. As distinguished from usually used thermocou-
ples or Pt100 resistive temperature sensors, infrared tem-
perature sensors have much shorter response time. There-
fore FOS NTS 2-IR sensors with response time below 15
ms were used [19]. Infrared sensors function on the prin-
ciple of infrared pyrometers and detect heat radiation
from molten plastic. This radiation enters in the sensor
through sapphire window where it is detected by IR
diode. As shown by Obendrauf et al. [20], due to the fact
that plastics are partially penetrable for electromagnetic
radiation in the near infrared range, polymer absorption
coefficient can influence temperature measurement. There-
fore, infrared temperature sensors have been placed
directly in front of the pressure sensors with integrated
thermocouples. In an isothermal state, infrared sensor
response of polymer melt has been calibrated against cor-
responding facing thermocouple.
Sensor signals were guided to corresponding signal
amplifiers, which according to sensor measured value give
0–10 V output. Those outputs were guided into data log-
ger that was further connected to personal computer.
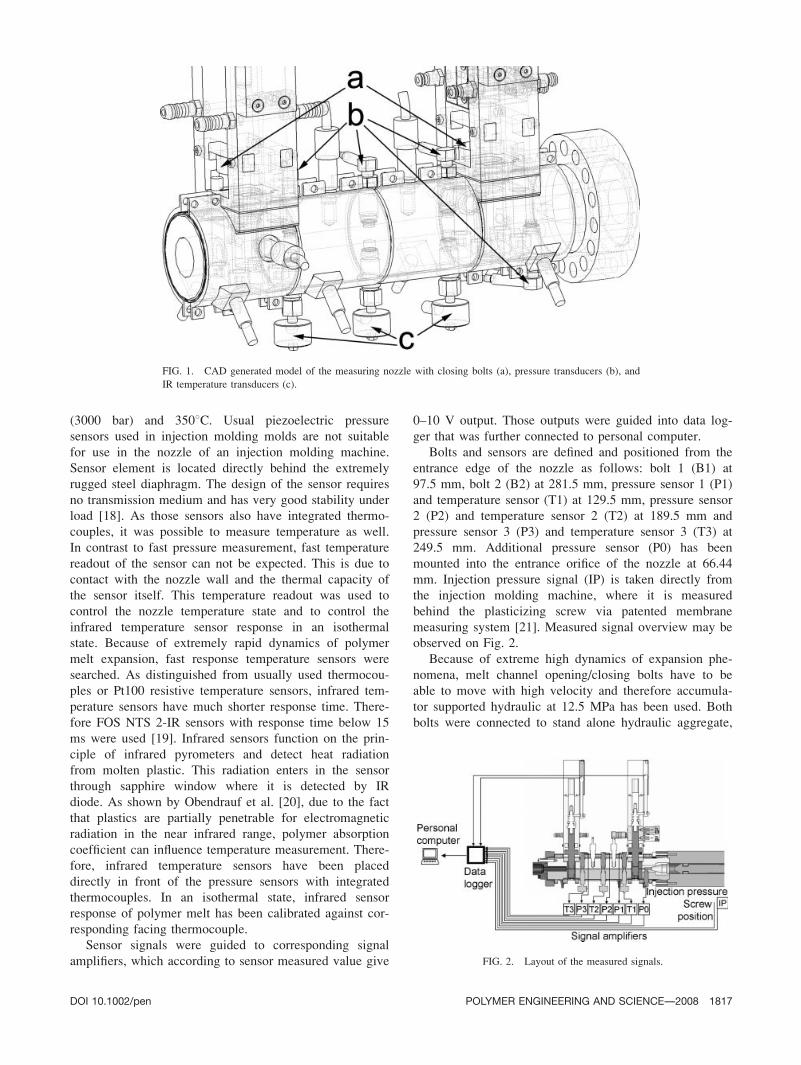
Bolts and sensors are defined and positioned from the
entrance edge of the nozzle as follows: bolt 1 (B1) at
97.5 mm, bolt 2 (B2) at 281.5 mm, pressure sensor 1 (P1)
and temperature sensor (T1) at 129.5 mm, pressure sensor
2 (P2) and temperature sensor 2 (T2) at 189.5 mm and
pressure sensor 3 (P3) and temperature sensor 3 (T3) at
249.5 mm. Additional pressure sensor (P0) has been
mounted into the entrance orifice of the nozzle at 66.44
mm. Injection pressure signal (IP) is taken directly from
the injection molding machine, where it is measured
behind the plasticizing screw via patented membrane
measuring system [21]. Measured signal overview may be
observed on Fig. 2.
Because of extreme high dynamics of expansion phe-
nomena, melt channel opening/closing bolts have to be
able to move with high velocity and therefore accumula-
tor supported hydraulic at 12.5 MPa has been used. Both
bolts were connected to stand alone hydraulic aggregate,
FIG. 1. CAD generated model of the measuring nozzle with closing bolts (a), pressure transducers (b), and
IR temperature transducers (c).
FIG. 2. Layout of the measured signals.
DOI 10.1002/pen POLYMER ENGINEERING AND SCIENCE—-2008 1817
monitored and controlled over injection molding machine.
Valves for movement of the bolts were also independently
controlled with the signals from the injection molding
machine. Two stroke transducers monitored bolt move-
ments and their positions. To prevent melt leakage at high
pressures and elevated temperatures, bolt rings and very
tight manufacture tolerances were used. Four separately
regulated heating zones were used along the nozzle, to
keep the nozzle at desired temperature. Heaters were
regulated over four thermocouples, positioned close to the
measuring channel. They were controlled and regulated
directly from the injection molding machine. To prevent
overheating of the hydraulic cylinders on top of the bolts,
water cooling system was also integrated.
Nozzle has been mounted directly on the injection
molding machine plasticizing cylinder. High pressure re-
sistant plasticizing cylinder and abrasion and corrosion re-
sistant screw with 25 mm diameter and L/D 24 on fully
electric tiebarless Engel E-motion 200/100 injection mold-
ing machine have been used. The use of fully electric
injection molding machine is compulsory due to the fact
that during the pressure fall in the expansion process,
plasticizing screw must stay ‘‘locked’’ in the position. In
case of hydraulic injection molding machine, the melt
pressure in front of the plasticizing screw is always in
balance with the hydraulic oil pressure behind the screw.
All the experiments were carried out in the machine pro-
grammed automatic cycle. To be able to free program the
cycle including the nozzle bolt movements the new Engel
CC200 controller was used. Measured signals have been
sent to high speed 16 channel data logger and further to
personal computer. Up to 2000 Hz signal readout per
channel has been used to record fast expansion phenom-
ena. Beside trigger signal, additional 15 signals have been
used: three IR temperature readings, four pressure read-
ings, four temperature readings from pressure sensor inte-
grated thermocouples, two signals from bolt stroke trans-
ducers, reading of plasticizing screw position and machine
injection pressure reading.
Materials and Experimental Conditions
In this work, one amorphous and one semicrystalline
material commonly used in injection molding have been
chosen:
• HIPS high impact polystyrene, Polystyrol 495 F
(BASF)
• PA polyamide (6,6), Durethan A30S (Lanxess)
PA is hygroscopic material and has been dried before use
for 4 h at 858C. Before the measurements, polymeric
materials have been plasticized to desired starting com-
pression volume before the screw. Slightly rising injection
unit temperature profile up to set temperature has been
used.
Polymer melt compression and expansion in the meas-
uring channel have been investigated at following variable
starting conditions:
Injection (compression) rate of 2 to 100 cm3/s;
Temperature from 210 to 2508C for HIPS and from 260
to 3008C for PA;
Compression pressure of 100, 150, 200 and for certain
experiments also of 240 MPa;
Compression volume from 15 to 35 cm3.
All the melts were compressed also with compression
rate of 200 cm3/s. After true screw movement velocity
has been investigated, it has been found out that between
the very short time of compression to desired pressure,
due to servo motor acceleration, above mentioned rates
were not actually achieved. Therefore they are not shown
among the results.
Compression and Expansion Procedure
In addition to in-line rheological measurements, two
independently driven bolts are enabling us to investigate
following phenomena: compression of polymer melts,
expansion of polymer melt into the channel, and expan-
sion of polymer melt out of the channel.
To be able to produce expansion injection molded
parts, polymer melt must first be compressed to high pres-
sure. With the bolts B1 open and the B2 closed, it was
possible to follow polymer compression behavior along
the measuring channel while moving with injection mold-
ing machine screw forward to desired pressure at desired
‘‘injection’’ rate, starting melt volume and temperature.
While expanding into the cavity, it is necessary to
know what happens with compressed melt in the volume
before cavity. This is achieved with the B1 in open and
B2 in closed position. After the compression in the melt
channel and opening of the B2, expansion out of the
channel takes place. In this case it is possible to close B1
and expand only the volume in the measuring channel, or
leave B1 open and expand the whole volume in front of
the plasticizing screw.
RESULTS AND DISCUSSION
Compression
Material has been plasticized at set temperature to
defined volume and then compressed to desired pressure
with variable compression rates. Recorded pressure and
temperature signals from all three nozzle positions, pres-
sure signal P0 from nozzle entry section and machine IP
are represented in Fig. 3. For representation, compression
of PA to 240 MPa at rate of 10 cm3/s and at starting
2808C and 35 cm3 is shown.
For analyses, peak temperature at position 2 (T2) has
been used. The influence of starting conditions on this
1818 POLYMER ENGINEERING AND SCIENCE—-2008 DOI 10.1002/pen
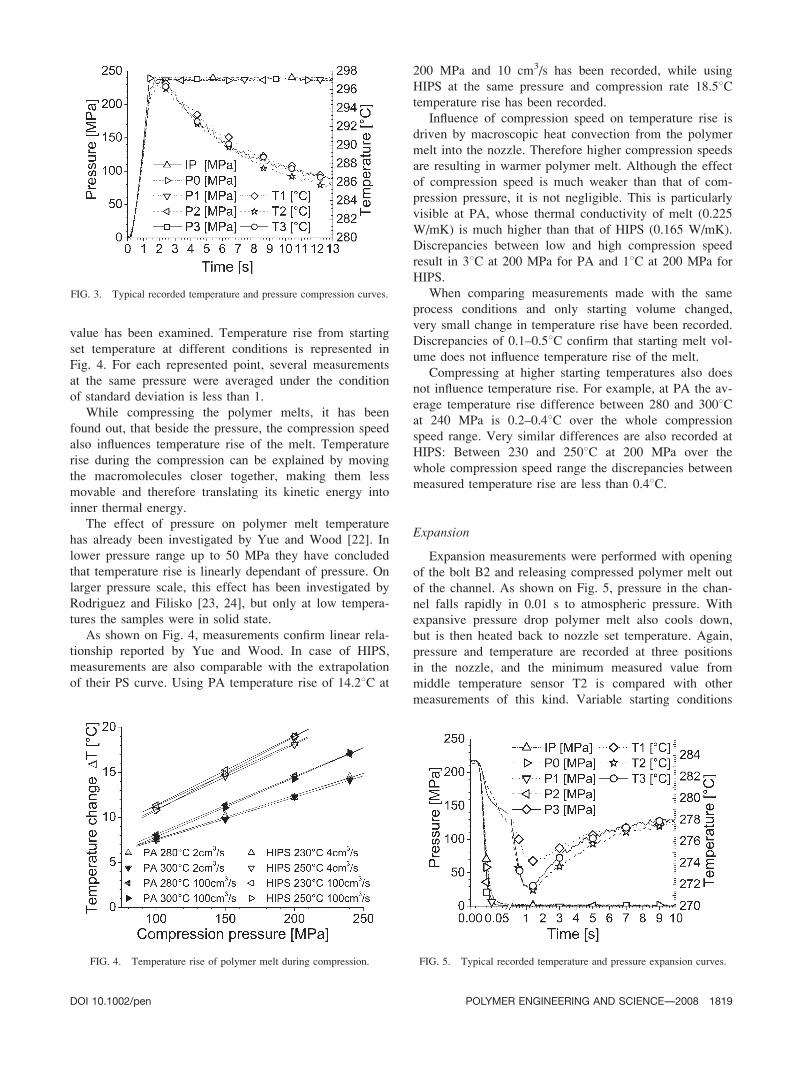
value has been examined. Temperature rise from starting
set temperature at different conditions is represented in
Fig. 4. For each represented point, several measurements
at the same pressure were averaged under the condition
of standard deviation is less than 1.
While compressing the polymer melts, it has been
found out, that beside the pressure, the compression speed
also influences temperature rise of the melt. Temperature
rise during the compression can be explained by moving
the macromolecules closer together, making them less
movable and therefore translating its kinetic energy into
inner thermal energy.
The effect of pressure on polymer melt temperature
has already been investigated by Yue and Wood [22]. In
lower pressure range up to 50 MPa they have concluded
that temperature rise is linearly dependant of pressure. On
larger pressure scale, this effect has been investigated by
Rodriguez and Filisko [23, 24], but only at low tempera-
tures the samples were in solid state.
As shown on Fig. 4, measurements confirm linear rela-
tionship reported by Yue and Wood. In case of HIPS,
measurements are also comparable with the extrapolation
of their PS curve. Using PA temperature rise of 14.28C at
200 MPa and 10 cm3/s has been recorded, while using
HIPS at the same pressure and compression rate 18.58Ctemperature rise has been recorded.
Influence of compression speed on temperature rise is
driven by macroscopic heat convection from the polymer
melt into the nozzle. Therefore higher compression speeds
are resulting in warmer polymer melt. Although the effect
of compression speed is much weaker than that of com-
pression pressure, it is not negligible. This is particularly
visible at PA, whose thermal conductivity of melt (0.225
W/mK) is much higher than that of HIPS (0.165 W/mK).
Discrepancies between low and high compression speed
result in 38C at 200 MPa for PA and 18C at 200 MPa for
HIPS.
When comparing measurements made with the same
process conditions and only starting volume changed,
very small change in temperature rise have been recorded.
Discrepancies of 0.1–0.58C confirm that starting melt vol-
ume does not influence temperature rise of the melt.
Compressing at higher starting temperatures also does
not influence temperature rise. For example, at PA the av-
erage temperature rise difference between 280 and 3008Cat 240 MPa is 0.2–0.48C over the whole compression
speed range. Very similar differences are also recorded at
HIPS: Between 230 and 2508C at 200 MPa over the
whole compression speed range the discrepancies between
measured temperature rise are less than 0.48C.
Expansion
Expansion measurements were performed with opening
of the bolt B2 and releasing compressed polymer melt out
of the channel. As shown on Fig. 5, pressure in the chan-
nel falls rapidly in 0.01 s to atmospheric pressure. With
expansive pressure drop polymer melt also cools down,
but is then heated back to nozzle set temperature. Again,
pressure and temperature are recorded at three positions
in the nozzle, and the minimum measured value from
middle temperature sensor T2 is compared with other
measurements of this kind. Variable starting conditions
FIG. 3. Typical recorded temperature and pressure compression curves.
FIG. 4. Temperature rise of polymer melt during compression. FIG. 5. Typical recorded temperature and pressure expansion curves.
DOI 10.1002/pen POLYMER ENGINEERING AND SCIENCE—-2008 1819
were material, pressure before expansion, temperature
before expansion, and expansion volume.
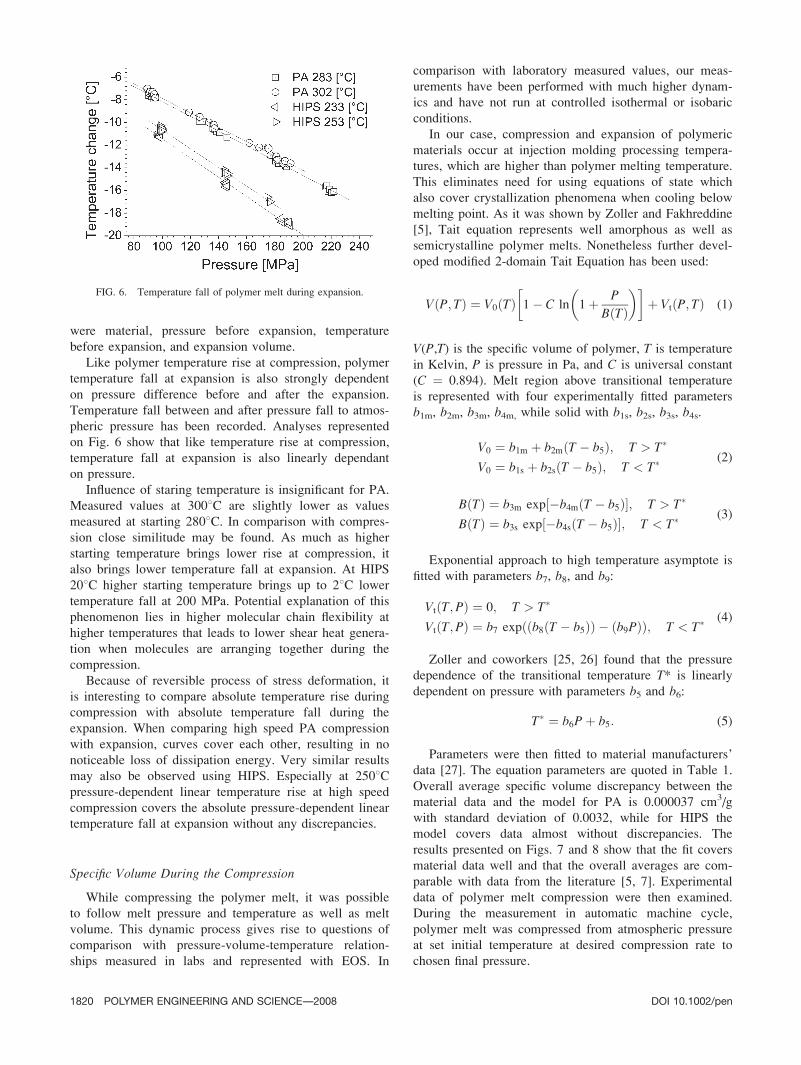
Like polymer temperature rise at compression, polymer
temperature fall at expansion is also strongly dependent
on pressure difference before and after the expansion.
Temperature fall between and after pressure fall to atmos-
pheric pressure has been recorded. Analyses represented
on Fig. 6 show that like temperature rise at compression,
temperature fall at expansion is also linearly dependant
on pressure.
Influence of staring temperature is insignificant for PA.
Measured values at 3008C are slightly lower as values
measured at starting 2808C. In comparison with compres-
sion close similitude may be found. As much as higher
starting temperature brings lower rise at compression, it
also brings lower temperature fall at expansion. At HIPS
208C higher starting temperature brings up to 28C lower
temperature fall at 200 MPa. Potential explanation of this
phenomenon lies in higher molecular chain flexibility at
higher temperatures that leads to lower shear heat genera-
tion when molecules are arranging together during the
compression.
Because of reversible process of stress deformation, it
is interesting to compare absolute temperature rise during
compression with absolute temperature fall during the
expansion. When comparing high speed PA compression
with expansion, curves cover each other, resulting in no
noticeable loss of dissipation energy. Very similar results
may also be observed using HIPS. Especially at 2508Cpressure-dependent linear temperature rise at high speed
compression covers the absolute pressure-dependent linear
temperature fall at expansion without any discrepancies.
Specific Volume During the Compression
While compressing the polymer melt, it was possible
to follow melt pressure and temperature as well as melt
volume. This dynamic process gives rise to questions of
comparison with pressure-volume-temperature relation-
ships measured in labs and represented with EOS. In
comparison with laboratory measured values, our meas-
urements have been performed with much higher dynam-
ics and have not run at controlled isothermal or isobaric
conditions.
In our case, compression and expansion of polymeric
materials occur at injection molding processing tempera-
tures, which are higher than polymer melting temperature.
This eliminates need for using equations of state which
also cover crystallization phenomena when cooling below
melting point. As it was shown by Zoller and Fakhreddine
[5], Tait equation represents well amorphous as well as
semicrystalline polymer melts. Nonetheless further devel-
oped modified 2-domain Tait Equation has been used:
VðP; TÞ ¼ V0ðTÞ 1� C ln 1þ P
BðTÞ� �� �
þ VtðP; TÞ (1)
V(P,T) is the specific volume of polymer, T is temperature
in Kelvin, P is pressure in Pa, and C is universal constant
(C ¼ 0.894). Melt region above transitional temperature
is represented with four experimentally fitted parameters
b1m, b2m, b3m, b4m, while solid with b1s, b2s, b3s, b4s.
V0 ¼ b1m þ b2mðT � b5Þ; T > T�
V0 ¼ b1s þ b2sðT � b5Þ; T < T� (2)
BðTÞ ¼ b3m exp½�b4mðT � b5Þ�; T > T�
BðTÞ ¼ b3s exp½�b4sðT � b5Þ�; T < T� (3)
Exponential approach to high temperature asymptote is
fitted with parameters b7, b8, and b9:
VtðT;PÞ ¼ 0; T > T�
VtðT;PÞ ¼ b7 expððb8ðT � b5ÞÞ � ðb9PÞÞ; T < T� (4)
Zoller and coworkers [25, 26] found that the pressure
dependence of the transitional temperature T* is linearly
dependent on pressure with parameters b5 and b6:
T� ¼ b6Pþ b5: (5)
Parameters were then fitted to material manufacturers’
data [27]. The equation parameters are quoted in Table 1.
Overall average specific volume discrepancy between the
material data and the model for PA is 0.000037 cm3/g
with standard deviation of 0.0032, while for HIPS the
model covers data almost without discrepancies. The
results presented on Figs. 7 and 8 show that the fit covers
material data well and that the overall averages are com-
parable with data from the literature [5, 7]. Experimental
data of polymer melt compression were then examined.
During the measurement in automatic machine cycle,
polymer melt was compressed from atmospheric pressure
at set initial temperature at desired compression rate to
chosen final pressure.
FIG. 6. Temperature fall of polymer melt during expansion.
1820 POLYMER ENGINEERING AND SCIENCE—-2008 DOI 10.1002/pen
Beside temperature and pressure measurement also
screw position has been recorded. With known nozzle ge-
ometry, melt volume was calculated. At 50 MPa it is safe
to confirm that the plasticizing screw nonreturn valve is
completely closed and therefore at this point mass of the
melt has been calculated. This constant mass is further
compressed, giving us the measured specific volume of
the melt.
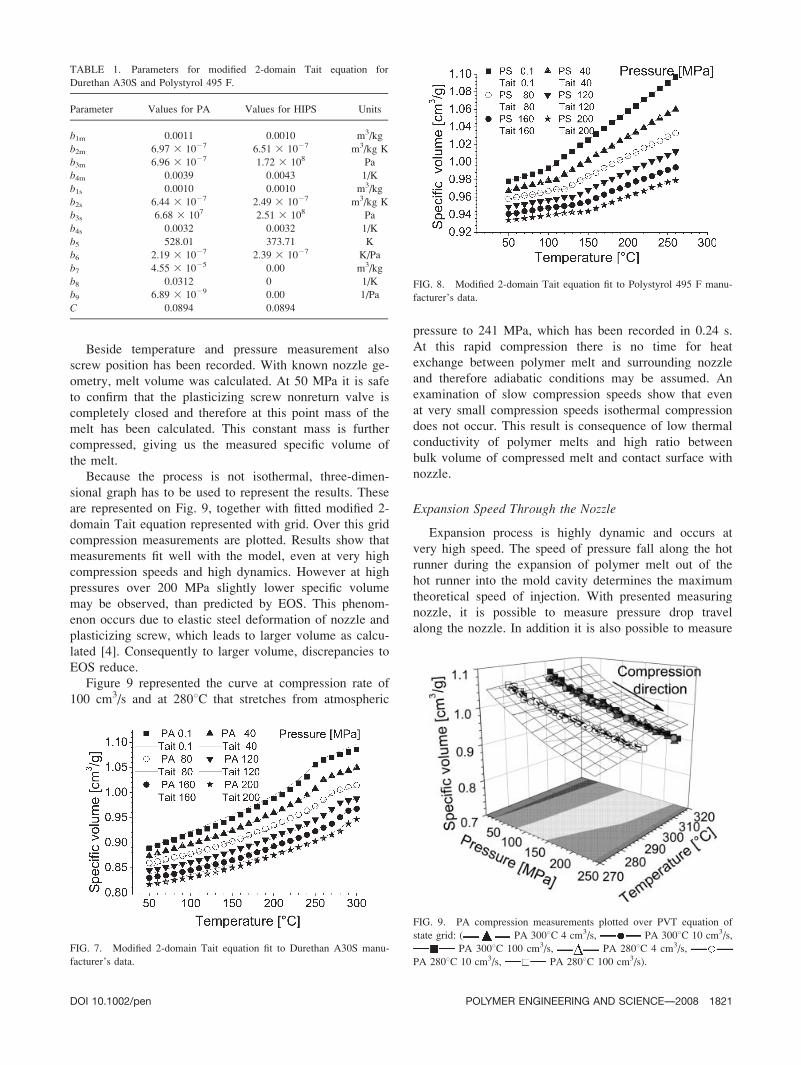
Because the process is not isothermal, three-dimen-
sional graph has to be used to represent the results. These
are represented on Fig. 9, together with fitted modified 2-
domain Tait equation represented with grid. Over this grid
compression measurements are plotted. Results show that
measurements fit well with the model, even at very high
compression speeds and high dynamics. However at high
pressures over 200 MPa slightly lower specific volume
may be observed, than predicted by EOS. This phenom-
enon occurs due to elastic steel deformation of nozzle and
plasticizing screw, which leads to larger volume as calcu-
lated [4]. Consequently to larger volume, discrepancies to
EOS reduce.
Figure 9 represented the curve at compression rate of
100 cm3/s and at 2808C that stretches from atmospheric
pressure to 241 MPa, which has been recorded in 0.24 s.
At this rapid compression there is no time for heat
exchange between polymer melt and surrounding nozzle
and therefore adiabatic conditions may be assumed. An
examination of slow compression speeds show that even
at very small compression speeds isothermal compression
does not occur. This result is consequence of low thermal
conductivity of polymer melts and high ratio between
bulk volume of compressed melt and contact surface with
nozzle.
Expansion Speed Through the Nozzle
Expansion process is highly dynamic and occurs at
very high speed. The speed of pressure fall along the hot
runner during the expansion of polymer melt out of the
hot runner into the mold cavity determines the maximum
theoretical speed of injection. With presented measuring
nozzle, it is possible to measure pressure drop travel
along the nozzle. In addition it is also possible to measure
TABLE 1. Parameters for modified 2-domain Tait equation for
Durethan A30S and Polystyrol 495 F.
Parameter Values for PA Values for HIPS Units
b1m 0.0011 0.0010 m3/kg
b2m 6.97 3 1027 6.51 3 1027 m3/kg K
b3m 6.96 3 1027 1.72 3 108 Pa
b4m 0.0039 0.0043 1/K
b1s 0.0010 0.0010 m3/kg
b2s 6.44 3 1027 2.49 3 1027 m3/kg K
b3s 6.68 3 107 2.51 3 108 Pa
b4s 0.0032 0.0032 1/K
b5 528.01 373.71 K
b6 2.19 3 1027 2.39 3 1027 K/Pa
b7 4.55 3 1025 0.00 m3/kg
b8 0.0312 0 1/K
b9 6.89 3 1029 0.00 1/Pa
C 0.0894 0.0894
FIG. 7. Modified 2-domain Tait equation fit to Durethan A30S manu-
facturer’s data.
FIG. 8. Modified 2-domain Tait equation fit to Polystyrol 495 F manu-
facturer’s data.
FIG. 9. PA compression measurements plotted over PVT equation of
state grid: ( PA 3008C 4 cm3/s, PA 3008C 10 cm3/s,
PA 3008C 100 cm3/s, PA 2808C 4 cm3/s,
PA 2808C 10 cm3/s, PA 2808C 100 cm3/s).
DOI 10.1002/pen POLYMER ENGINEERING AND SCIENCE—-2008 1821
pressure fall to atmospheric pressure at certain position in
the nozzle. Measurements were made with nozzle with
thick 10 mm 3 10 mm cross section channel and also
with very thin 0.4 mm 3 10 mm cross section channel.
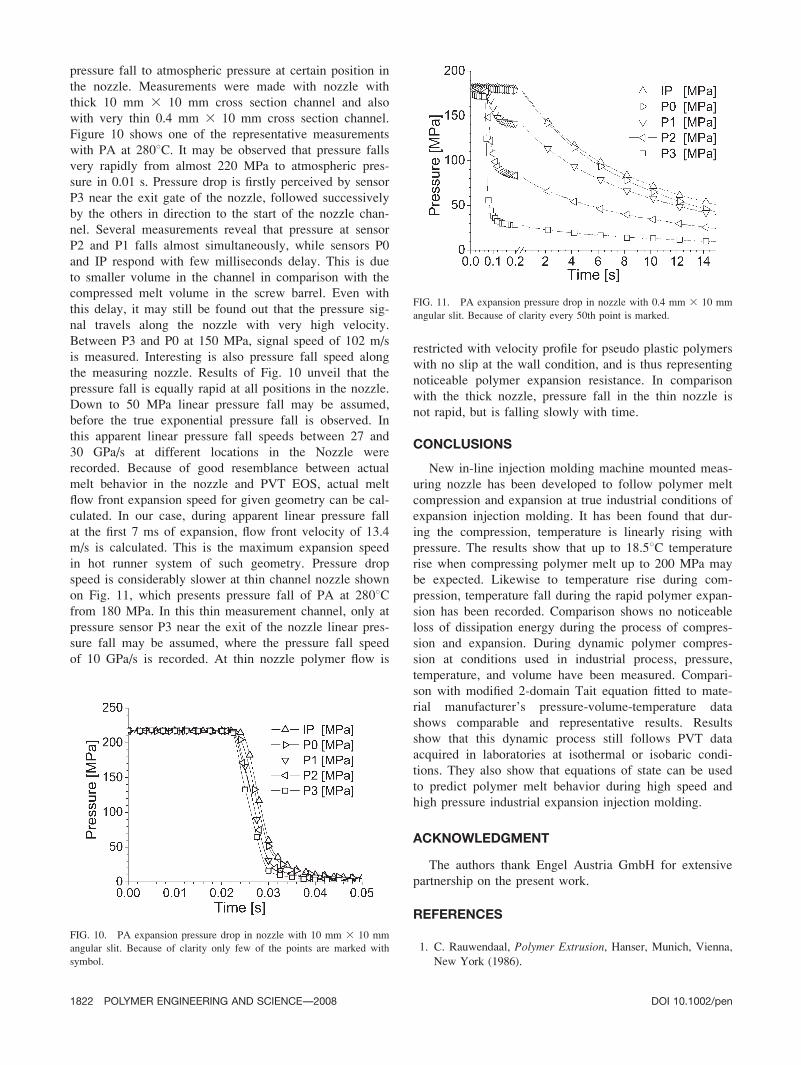
Figure 10 shows one of the representative measurements
with PA at 2808C. It may be observed that pressure falls
very rapidly from almost 220 MPa to atmospheric pres-
sure in 0.01 s. Pressure drop is firstly perceived by sensor
P3 near the exit gate of the nozzle, followed successively
by the others in direction to the start of the nozzle chan-
nel. Several measurements reveal that pressure at sensor
P2 and P1 falls almost simultaneously, while sensors P0
and IP respond with few milliseconds delay. This is due
to smaller volume in the channel in comparison with the
compressed melt volume in the screw barrel. Even with
this delay, it may still be found out that the pressure sig-
nal travels along the nozzle with very high velocity.
Between P3 and P0 at 150 MPa, signal speed of 102 m/s
is measured. Interesting is also pressure fall speed along
the measuring nozzle. Results of Fig. 10 unveil that the
pressure fall is equally rapid at all positions in the nozzle.
Down to 50 MPa linear pressure fall may be assumed,
before the true exponential pressure fall is observed. In
this apparent linear pressure fall speeds between 27 and
30 GPa/s at different locations in the Nozzle were
recorded. Because of good resemblance between actual
melt behavior in the nozzle and PVT EOS, actual melt
flow front expansion speed for given geometry can be cal-
culated. In our case, during apparent linear pressure fall
at the first 7 ms of expansion, flow front velocity of 13.4
m/s is calculated. This is the maximum expansion speed
in hot runner system of such geometry. Pressure drop
speed is considerably slower at thin channel nozzle shown
on Fig. 11, which presents pressure fall of PA at 2808Cfrom 180 MPa. In this thin measurement channel, only at
pressure sensor P3 near the exit of the nozzle linear pres-
sure fall may be assumed, where the pressure fall speed
of 10 GPa/s is recorded. At thin nozzle polymer flow is
restricted with velocity profile for pseudo plastic polymers
with no slip at the wall condition, and is thus representing
noticeable polymer expansion resistance. In comparison
with the thick nozzle, pressure fall in the thin nozzle is
not rapid, but is falling slowly with time.
CONCLUSIONS
New in-line injection molding machine mounted meas-
uring nozzle has been developed to follow polymer melt
compression and expansion at true industrial conditions of
expansion injection molding. It has been found that dur-
ing the compression, temperature is linearly rising with
pressure. The results show that up to 18.58C temperature
rise when compressing polymer melt up to 200 MPa may
be expected. Likewise to temperature rise during com-
pression, temperature fall during the rapid polymer expan-
sion has been recorded. Comparison shows no noticeable
loss of dissipation energy during the process of compres-
sion and expansion. During dynamic polymer compres-
sion at conditions used in industrial process, pressure,
temperature, and volume have been measured. Compari-
son with modified 2-domain Tait equation fitted to mate-
rial manufacturer’s pressure-volume-temperature data
shows comparable and representative results. Results
show that this dynamic process still follows PVT data
acquired in laboratories at isothermal or isobaric condi-
tions. They also show that equations of state can be used
to predict polymer melt behavior during high speed and
high pressure industrial expansion injection molding.
ACKNOWLEDGMENT
The authors thank Engel Austria GmbH for extensive
partnership on the present work.
REFERENCES
1. C. Rauwendaal, Polymer Extrusion, Hanser, Munich, Vienna,
New York (1986).
FIG. 10. PA expansion pressure drop in nozzle with 10 mm 3 10 mm
angular slit. Because of clarity only few of the points are marked with
symbol.
FIG. 11. PA expansion pressure drop in nozzle with 0.4 mm 3 10 mm
angular slit. Because of clarity every 50th point is marked.
1822 POLYMER ENGINEERING AND SCIENCE—-2008 DOI 10.1002/pen
2. P. Pokorny, Kunststoffe, 91(7), 51 (2001).
3. G. Dimmler, G. Steinbichler, and H. Wobbe, KunststoffeInt., 9, 112 (2005).
4. G. Steinbichler, A. Lampl, and A Pottler, Kunststoffe Int.,12, 126 (2004).
5. P. Zoller and Y.A. Fakhreddine, Thermochim. Acta, 238,397 (1994).
6. R.S. Spencer and G.D. Gilmore, J. Appl. Phys., 20, 502
(1949).
7. P.A. Rodgers, J. Appl. Polym. Sci., 48, 1061 (1993).
8. R. Simha and T. Somcynsky, Macromolecules, 2, 342
(1969).
9. B. Busch, M.D. Lechner, and L.A. Kleintjens, Thermochim.Acta, 160, 131 (1990).
10. P.G. Tait, Physics and Chemistry of the Voyage of H.M.S.Challenger, Vol. 2, Part IV, HMSO, London (1888).
11. C.A. Hieber, Int. Polym. Proc., 12, 249 (1997).
12. A. Osorio and L.S. Turng, Polym. Eng. Sci., 44, 2274
(2004).
13. D.W. van Krevelen, Properties of Polymers: Their Correla-tion with Chemical Structure; Their Numerical Estimationand Prediction from Additive Group Contributions, 3rd ed.,Elsevier, Amsterdam (1990).
14. G. Steinbichler and P. Pokorny, European Patent No. EP
1,074,374 A1 (2001) and European Patent No. EP
1,074,374 B1 (2005).
15. A. Haddout and G. Villoutreix, Int. Polym. Proc., 15, 291 (2000).
16. C. Gornik, Kunststoffe Int., 4, 88 (2005).
17. X. Qin, M.R. Thompson, A.N. Hrymak, and A. Torres,
Polym. Eng. Sci., 45, 1108 (2005).
18. Melt Pressure Measuring Chain for Injection Molding
Machines or Hot Runner Systems. Kistler 4013 Datasheet.Kistler Instrumente AG (2007).
19. Nozzle Temperature Sensor. FOS NTS2 Datasheet. FOS
Messtechnik GmbH (2005).
20. W. Obendrauf, G.R. Langecker, and W. Friesenbichler, Int.Polym. Proc., 13, 71 (1998).
21. S. Eppich, A. Ellinger, and J. Frechinger, European Patent
No. EP 1,151,843 A1 (2001), European Patent No. EP
1,151,843 B1 (2003), and U.S. Patent 6,494,701 B2 (2002).
22. M. Yue and A.K. Wood, Polym. Bull., 33, 127 (1994).
23. E.L. Rodriguez and F.E. Filisko, Polym. Eng. Sci., 26, 1060(1986).
24. E.L. Rodriguez and F.E. Filisko, High Temp. High Press.,20, 585 (1988).
25. H.W. Starkweather, G.A. Jones, and P. Zoller, J. Polym.Sci. Part B: Polym. Phys., 26, 257 (1988).
26. P. Zoller, T.A. Kehl, H.W. Starkweather, and G.A. Jones,
J. Polym. Sci. Part B: Polym. Phys., 27, 993 (1989).
27. CAMPUS 5.1 Plastics database. A joint development of
companies in the plastics industry. CWFG mbH, Frankfurt/
Main (2001). Available at: www.CAMPUSplastics.com.
DOI 10.1002/pen POLYMER ENGINEERING AND SCIENCE—-2008 1823


![The pMELTS: A revision of MELTS for improved calculation ... · MELTS that we will term pMELTS (the ‘‘p’’ stands for pressure). 1.1. Overview of the Problem [6] From afar,](https://img.pdfslide.us/doc/110x75/5fadfd3344bfd04d380bb25e/the-pmelts-a-revision-of-melts-for-improved-calculation-melts-that-we-will.jpg)