Embed Size (px)
Citation preview
PRESS/820
12 April 2018
(18-2199) Page: 1/22
PRESS RELEASE E M B A R G O
N O T F O R P U B L I C A T I O N , O R D I S T R I B U T I O N B Y N E W S A G E N C I E S U N T I L 1 2 : 0 0 G E N E V A T I M E 1 2 A P R I L 2 0 1 8
TRADE STATISTICS AND OUTLOOK
Strong trade growth in 2018 rests on policy choices
World merchandise trade growth is expected to remain strong in 2018 and 2019 after posting its largest increase in six years in 2017, but continued expansion depends on robust global economic growth and governments pursuing appropriate monetary, fiscal and especially trade policies, WTO economists said. The WTO anticipates merchandise trade volume growth of 4.4% in 2018, as measured by the average of exports and imports, roughly matching the 4.7% increase recorded for 2017. Growth is expected to moderate to 4.0% in 2019, below the average rate of 4.8% since 1990 but still firmly above the post-crisis average of 3.0%. However, there are signs that escalating trade tensions may already be affecting business confidence and investment decisions, which could compromise the current outlook. "The strong trade growth that we are seeing today will be vital for continued economic growth and recovery and to support job creation. However this important progress could be quickly undermined if governments resort to restrictive trade policies, especially in a tit-for-tat process that could lead to an unmanageable escalation. A cycle of retaliation is the last thing the world economy needs. The pressing trade problems confronting WTO members is best tackled through collective action. I urge governments to show restraint and settle their differences through dialogue and serious engagement," said WTO Director-General Roberto Azevêdo.
MAIN POINTS
• World merchandise trade volume is expected to grow 4.4% in 2018, accompanied by GDP growth of 3.2% at market exchange rates.
• Faster trade expansion is being driven by stronger economic growth across regions, led by increased investment and fiscal expansion.
• Trade growth in 2018 is likely to fall within a range from 3.1% to 5.5% if current GDP forecasts come to pass, although a continued escalation of trade restrictive policies could lead to a significantly lower figure.
• Trade growth should moderate to 4.0% in 2019 even as global GDP growth slows slightly to 3.1%.
• The ratio of trade growth to GDP growth should remain at 1.4 in 2018, down slightly from 1.5 in 2017.
• Risks are centred on trade and monetary policy, where missteps could undermine economic growth and confidence.
• An index of export orders has recently weakened, possibly signalling an effect of greater uncertainty brought about by heightened trade tensions.
PRESS/820
- 2 -
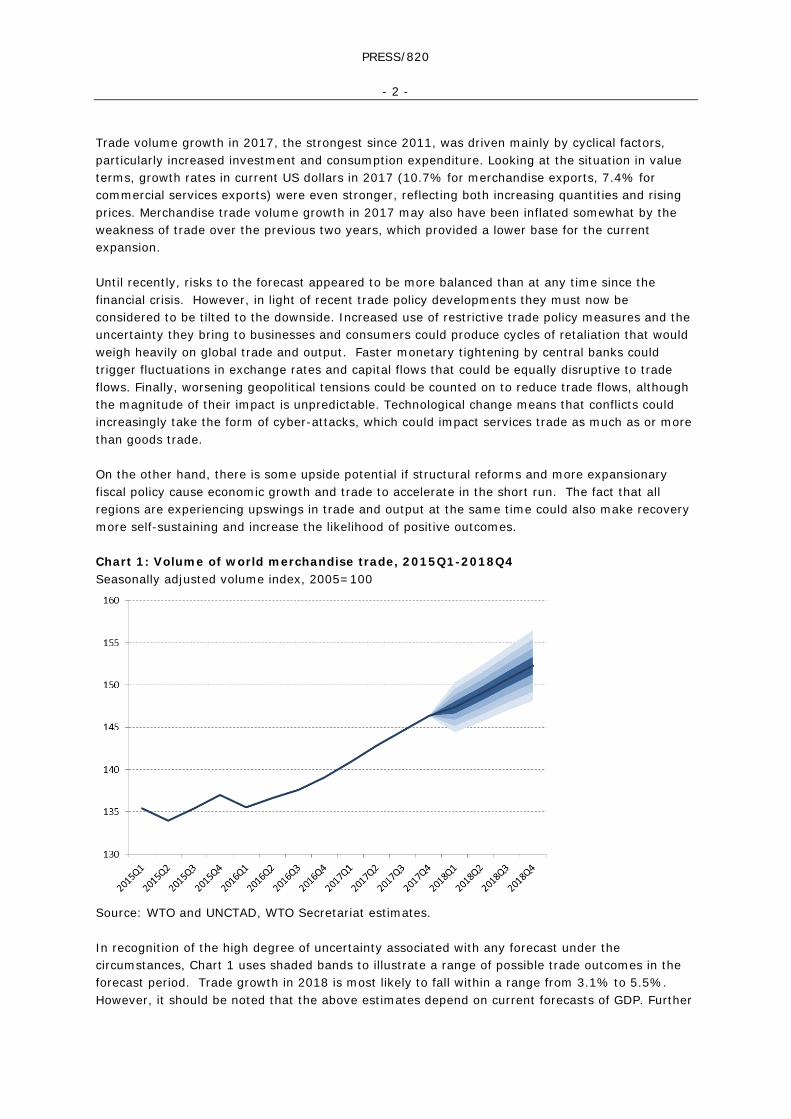
Trade volume growth in 2017, the strongest since 2011, was driven mainly by cyclical factors, particularly increased investment and consumption expenditure. Looking at the situation in value terms, growth rates in current US dollars in 2017 (10.7% for merchandise exports, 7.4% for commercial services exports) were even stronger, reflecting both increasing quantities and rising prices. Merchandise trade volume growth in 2017 may also have been inflated somewhat by the weakness of trade over the previous two years, which provided a lower base for the current expansion. Until recently, risks to the forecast appeared to be more balanced than at any time since the financial crisis. However, in light of recent trade policy developments they must now be considered to be tilted to the downside. Increased use of restrictive trade policy measures and the uncertainty they bring to businesses and consumers could produce cycles of retaliation that would weigh heavily on global trade and output. Faster monetary tightening by central banks could trigger fluctuations in exchange rates and capital flows that could be equally disruptive to trade flows. Finally, worsening geopolitical tensions could be counted on to reduce trade flows, although the magnitude of their impact is unpredictable. Technological change means that conflicts could increasingly take the form of cyber-attacks, which could impact services trade as much as or more than goods trade. On the other hand, there is some upside potential if structural reforms and more expansionary fiscal policy cause economic growth and trade to accelerate in the short run. The fact that all regions are experiencing upswings in trade and output at the same time could also make recovery more self-sustaining and increase the likelihood of positive outcomes. Chart 1: Volume of world merchandise trade, 2015Q1-2018Q4 Seasonally adjusted volume index, 2005=100
Source: WTO and UNCTAD, WTO Secretariat estimates. In recognition of the high degree of uncertainty associated with any forecast under the circumstances, Chart 1 uses shaded bands to illustrate a range of possible trade outcomes in the forecast period. Trade growth in 2018 is most likely to fall within a range from 3.1% to 5.5%. However, it should be noted that the above estimates depend on current forecasts of GDP. Further
PRESS/820
- 3 -
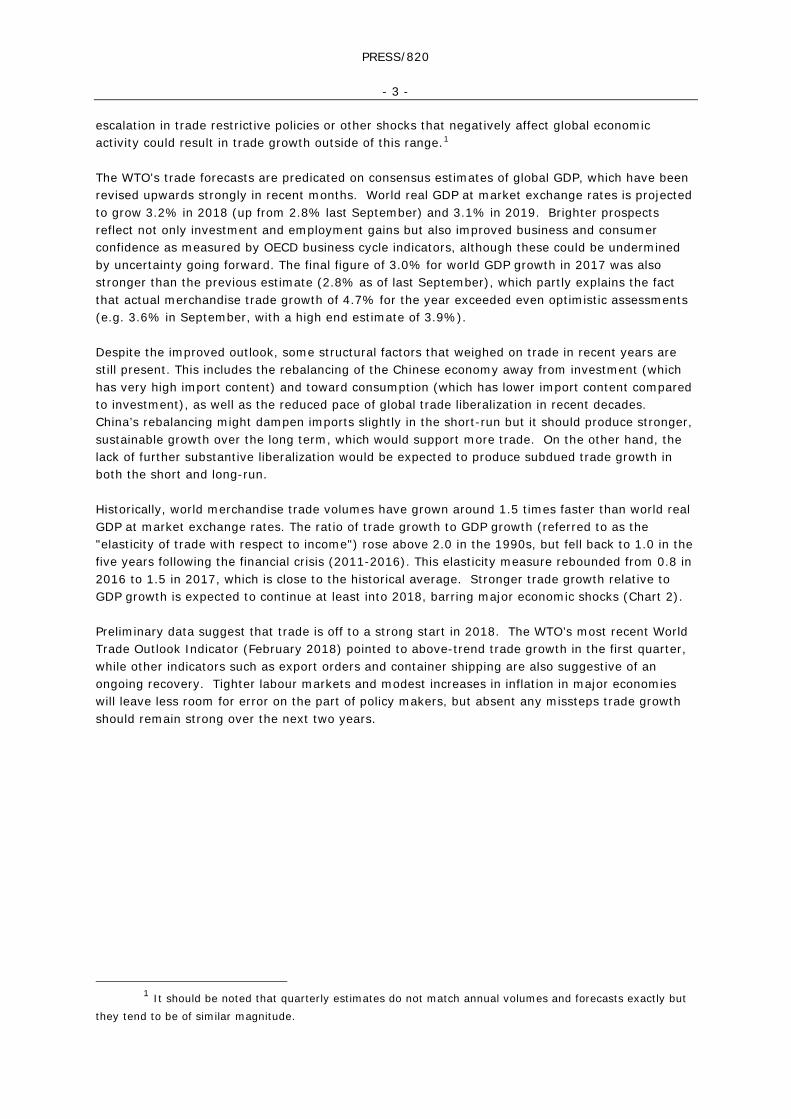
escalation in trade restrictive policies or other shocks that negatively affect global economic activity could result in trade growth outside of this range.1 The WTO's trade forecasts are predicated on consensus estimates of global GDP, which have been revised upwards strongly in recent months. World real GDP at market exchange rates is projected to grow 3.2% in 2018 (up from 2.8% last September) and 3.1% in 2019. Brighter prospects reflect not only investment and employment gains but also improved business and consumer confidence as measured by OECD business cycle indicators, although these could be undermined by uncertainty going forward. The final figure of 3.0% for world GDP growth in 2017 was also stronger than the previous estimate (2.8% as of last September), which partly explains the fact that actual merchandise trade growth of 4.7% for the year exceeded even optimistic assessments (e.g. 3.6% in September, with a high end estimate of 3.9%). Despite the improved outlook, some structural factors that weighed on trade in recent years are still present. This includes the rebalancing of the Chinese economy away from investment (which has very high import content) and toward consumption (which has lower import content compared to investment), as well as the reduced pace of global trade liberalization in recent decades. China’s rebalancing might dampen imports slightly in the short-run but it should produce stronger, sustainable growth over the long term, which would support more trade. On the other hand, the lack of further substantive liberalization would be expected to produce subdued trade growth in both the short and long-run. Historically, world merchandise trade volumes have grown around 1.5 times faster than world real GDP at market exchange rates. The ratio of trade growth to GDP growth (referred to as the "elasticity of trade with respect to income") rose above 2.0 in the 1990s, but fell back to 1.0 in the five years following the financial crisis (2011-2016). This elasticity measure rebounded from 0.8 in 2016 to 1.5 in 2017, which is close to the historical average. Stronger trade growth relative to GDP growth is expected to continue at least into 2018, barring major economic shocks (Chart 2). Preliminary data suggest that trade is off to a strong start in 2018. The WTO’s most recent World Trade Outlook Indicator (February 2018) pointed to above-trend trade growth in the first quarter, while other indicators such as export orders and container shipping are also suggestive of an ongoing recovery. Tighter labour markets and modest increases in inflation in major economies will leave less room for error on the part of policy makers, but absent any missteps trade growth should remain strong over the next two years.
1 It should be noted that quarterly estimates do not match annual volumes and forecasts exactly but
they tend to be of similar magnitude.
PRESS/820
- 4 -
Chart 2: Ratio of world merchandise trade volume growth to world real GDP growth, 1981-2018 % change and ratio
Sources: WTO and UNCTAD for trade, consensus estimates for GDP.
Details on trade developments in 2017
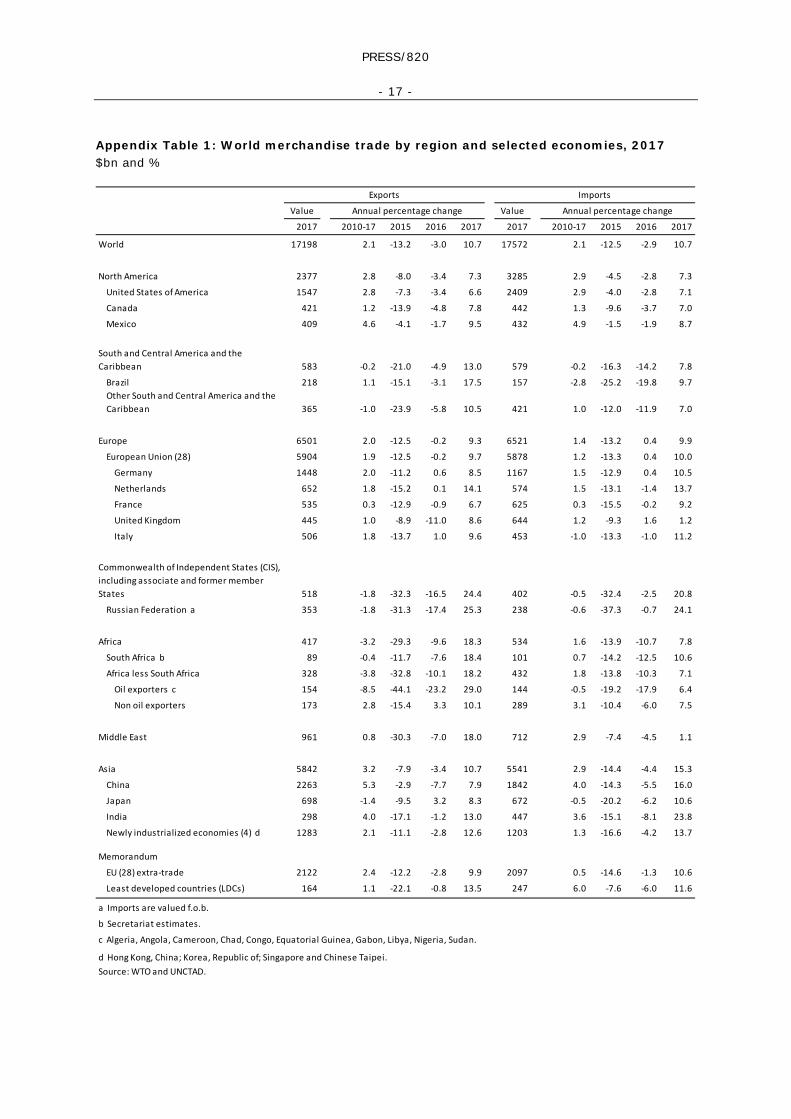
The acceleration of world merchandise trade volume growth to 4.7% in 2017 from 1.8% in 2016 was broad based, driven by rising import demand across regions but most notably in Asia. The largest gains were recorded on the import side in developing economies, where trade growth surged to 7.2% in 2017 from 1.9% in 2016. Import demand also picked up in developed countries, albeit less dramatically, as merchandise trade growth in volume terms increased to 3.1% in 2017 from 2.0% in 2016. Meanwhile, merchandise exports grew 3.5% in developed countries and 5.7% in developing countries last year, up from 1.1% and 2.3% respectively in the previous year (Table 1).
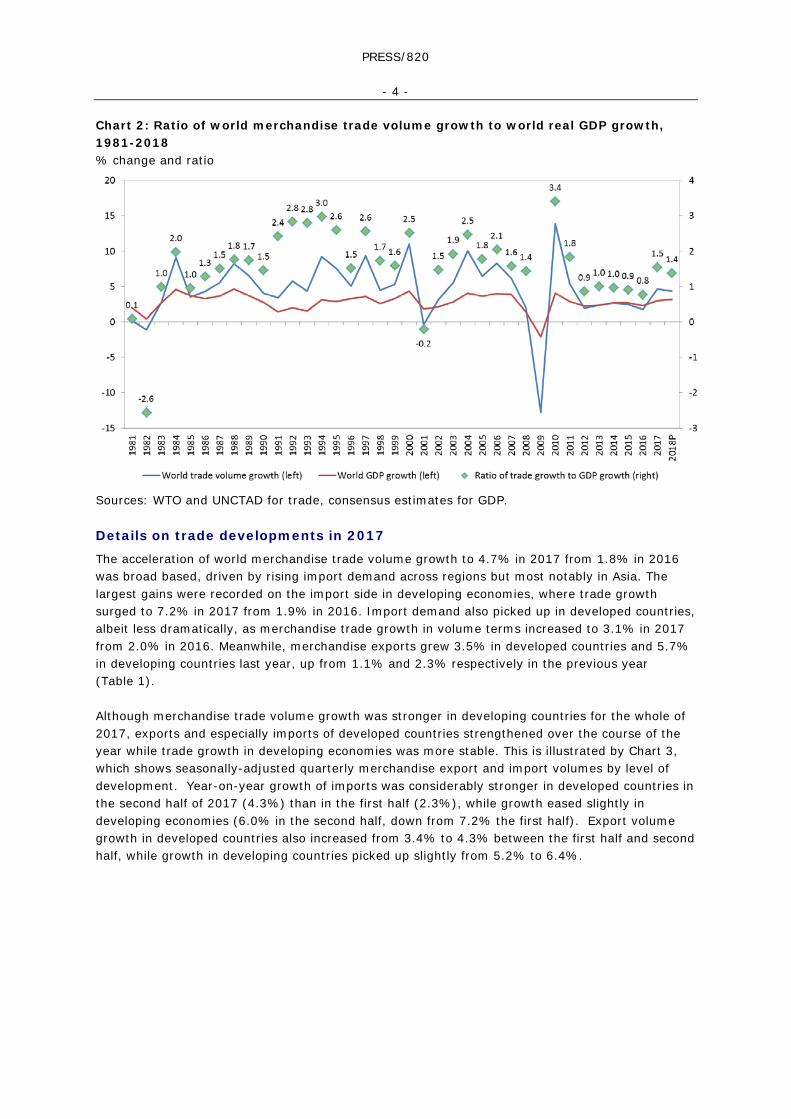
Although merchandise trade volume growth was stronger in developing countries for the whole of 2017, exports and especially imports of developed countries strengthened over the course of the year while trade growth in developing economies was more stable. This is illustrated by Chart 3, which shows seasonally-adjusted quarterly merchandise export and import volumes by level of development. Year-on-year growth of imports was considerably stronger in developed countries in the second half of 2017 (4.3%) than in the first half (2.3%), while growth eased slightly in developing economies (6.0% in the second half, down from 7.2% the first half). Export volume growth in developed countries also increased from 3.4% to 4.3% between the first half and second half, while growth in developing countries picked up slightly from 5.2% to 6.4%.
PRESS/820
- 5 -
Chart 3: World merchandise exports and imports by level of development, 2012Q1-2017Q4 (Volume index, 2012Q1=100)
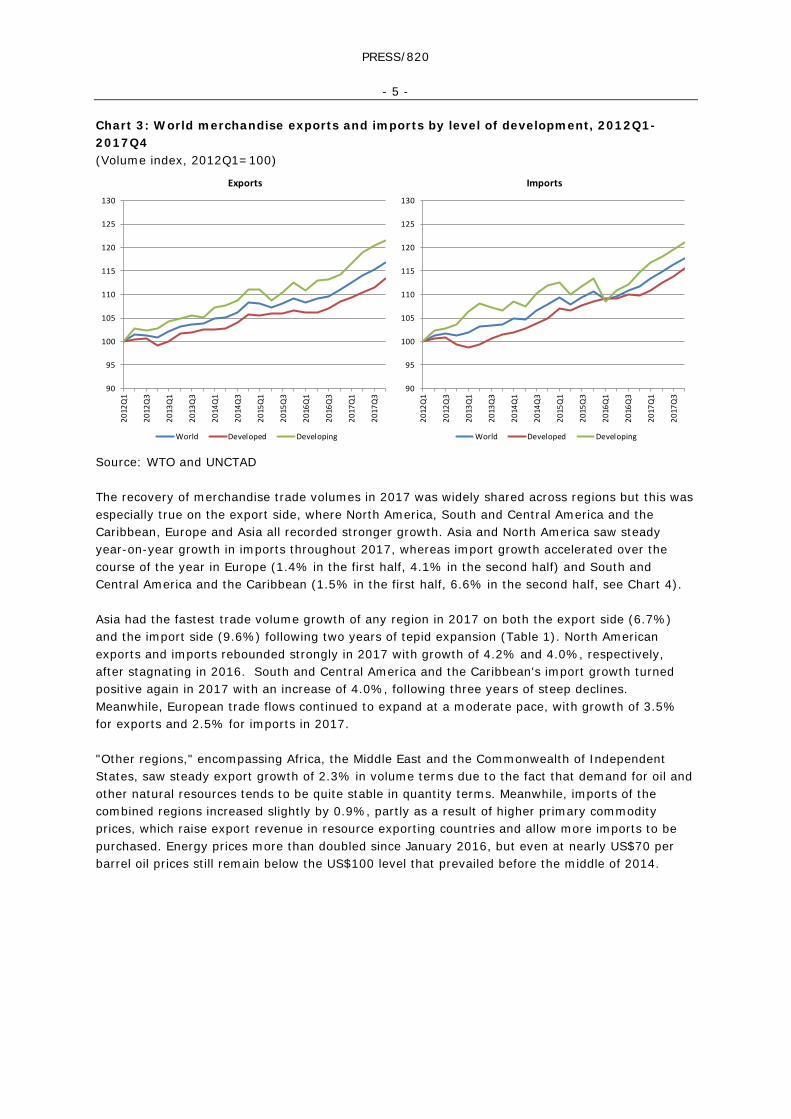
Source: WTO and UNCTAD The recovery of merchandise trade volumes in 2017 was widely shared across regions but this was especially true on the export side, where North America, South and Central America and the Caribbean, Europe and Asia all recorded stronger growth. Asia and North America saw steady year-on-year growth in imports throughout 2017, whereas import growth accelerated over the course of the year in Europe (1.4% in the first half, 4.1% in the second half) and South and Central America and the Caribbean (1.5% in the first half, 6.6% in the second half, see Chart 4). Asia had the fastest trade volume growth of any region in 2017 on both the export side (6.7%) and the import side (9.6%) following two years of tepid expansion (Table 1). North American exports and imports rebounded strongly in 2017 with growth of 4.2% and 4.0%, respectively, after stagnating in 2016. South and Central America and the Caribbean's import growth turned positive again in 2017 with an increase of 4.0%, following three years of steep declines. Meanwhile, European trade flows continued to expand at a moderate pace, with growth of 3.5% for exports and 2.5% for imports in 2017. "Other regions," encompassing Africa, the Middle East and the Commonwealth of Independent States, saw steady export growth of 2.3% in volume terms due to the fact that demand for oil and other natural resources tends to be quite stable in quantity terms. Meanwhile, imports of the combined regions increased slightly by 0.9%, partly as a result of higher primary commodity prices, which raise export revenue in resource exporting countries and allow more imports to be purchased. Energy prices more than doubled since January 2016, but even at nearly US$70 per barrel oil prices still remain below the US$100 level that prevailed before the middle of 2014.
90
95
100
105
110
115
120
125
130
2012
Q1
2012
Q3
2013
Q1
2013
Q3
2014
Q1
2014
Q3
2015
Q1
2015
Q3
2016
Q1
2016
Q3
2017
Q1
2017
Q3
Exports
World Developed Developing
90
95
100
105
110
115
120
125
130
2012
Q1
2012
Q3
2013
Q1
2013
Q3
2014
Q1
2014
Q3
2015
Q1
2015
Q3
2016
Q1
2016
Q3
2017
Q1
2017
Q3
Imports
World Developed Developing
PRESS/820
- 6 -
Chart 4: Merchandise exports and imports by region, 2012Q1-2017Q4 Volume index, 2012Q1=100
a Refers to South and Central America and the Caribbean b Other regions comprise Africa, Middle East and the Commonwealth of Independent States, including associate and former member States. Source: WTO and UNCTAD. Asia was responsible for much of the recovery of world merchandise trade in 2017 on both the export and import sides. This is illustrated by Chart 5, which shows regional contributions to world trade volume growth. On the export side, Asia contributed 2.3 percentage points to global growth of 4.5% in the latest year, or 51% of the total increase. Asia also added 2.9 percentage points to world import growth of 4.8%, or 60% of the overall increase. North America made substantial positive contributions to exports and imports as well, after adding very little to trade growth in 2016 as internal and external demand faltered. Europe added less to merchandise import growth in 2017 than it did in 2016, but South and Central America and the Caribbean made a positive contribution for the first time since 2013 as Brazil exited its recession.
90
95
100
105
110
115
120
125
130
2012
Q1
2012
Q3
2013
Q1
2013
Q3
2014
Q1
2014
Q3
2015
Q1
2015
Q3
2016
Q1
2016
Q3
2017
Q1
2017
Q3
Exports
North America South America a Europe
Asia Other regions b
90
95
100
105
110
115
120
125
130
2012
Q1
2012
Q3
2013
Q1
2013
Q3
2014
Q1
2014
Q3
2015
Q1
2015
Q3
2016
Q1
2016
Q3
2017
Q1
2017
Q3
Imports
North America South America a Europe
Asia Other regions b
PRESS/820
- 7 -
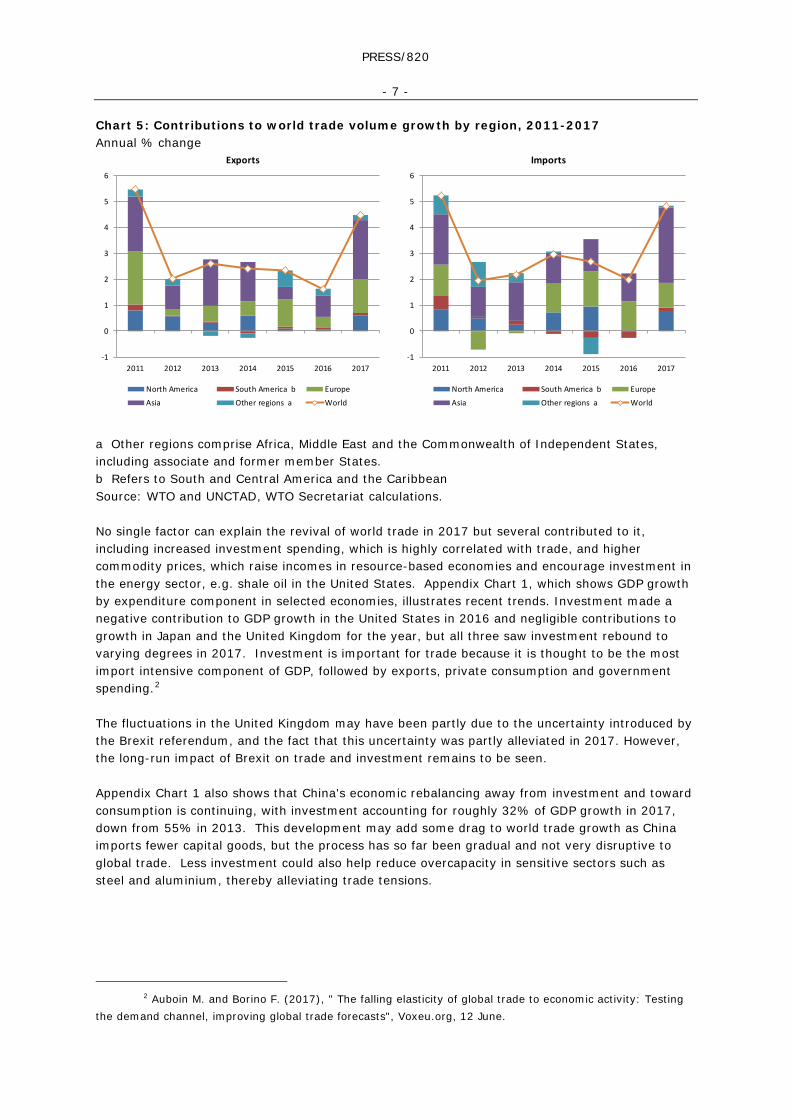
Chart 5: Contributions to world trade volume growth by region, 2011-2017 Annual % change
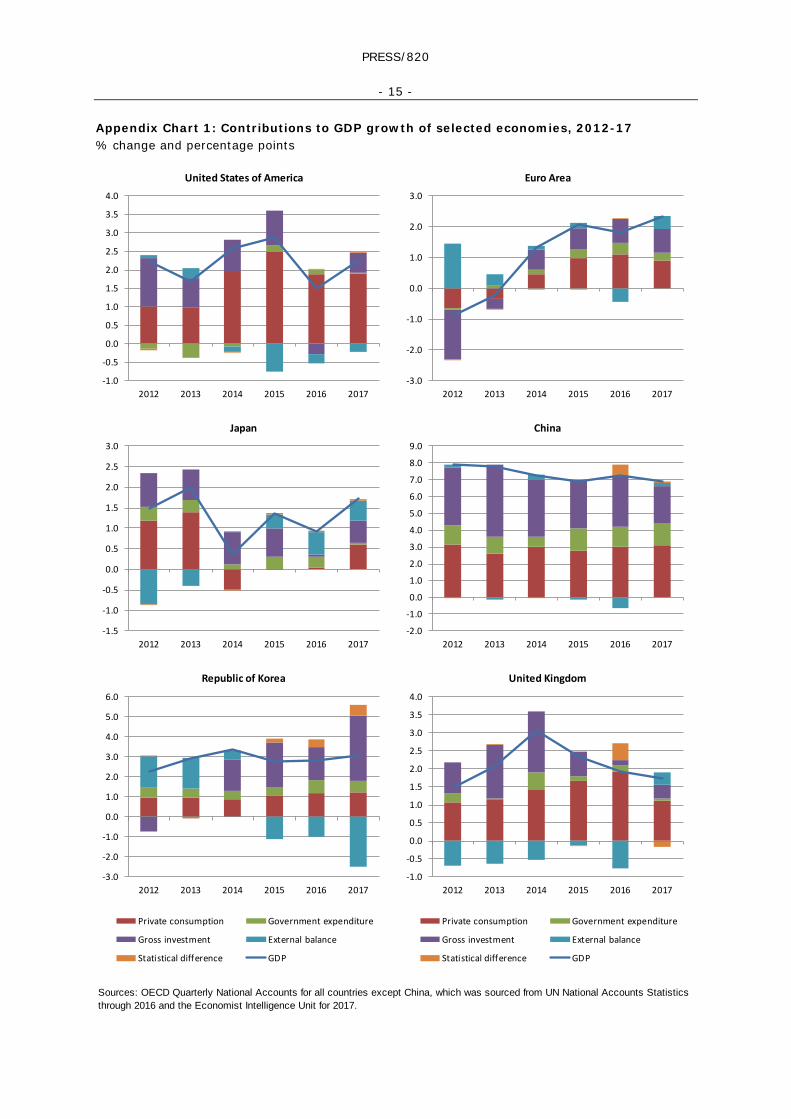
a Other regions comprise Africa, Middle East and the Commonwealth of Independent States, including associate and former member States. b Refers to South and Central America and the Caribbean Source: WTO and UNCTAD, WTO Secretariat calculations. No single factor can explain the revival of world trade in 2017 but several contributed to it, including increased investment spending, which is highly correlated with trade, and higher commodity prices, which raise incomes in resource-based economies and encourage investment in the energy sector, e.g. shale oil in the United States. Appendix Chart 1, which shows GDP growth by expenditure component in selected economies, illustrates recent trends. Investment made a negative contribution to GDP growth in the United States in 2016 and negligible contributions to growth in Japan and the United Kingdom for the year, but all three saw investment rebound to varying degrees in 2017. Investment is important for trade because it is thought to be the most import intensive component of GDP, followed by exports, private consumption and government spending.2 The fluctuations in the United Kingdom may have been partly due to the uncertainty introduced by the Brexit referendum, and the fact that this uncertainty was partly alleviated in 2017. However, the long-run impact of Brexit on trade and investment remains to be seen. Appendix Chart 1 also shows that China's economic rebalancing away from investment and toward consumption is continuing, with investment accounting for roughly 32% of GDP growth in 2017, down from 55% in 2013. This development may add some drag to world trade growth as China imports fewer capital goods, but the process has so far been gradual and not very disruptive to global trade. Less investment could also help reduce overcapacity in sensitive sectors such as steel and aluminium, thereby alleviating trade tensions.
2 Auboin M. and Borino F. (2017), " The falling elasticity of global trade to economic activity: Testing
the demand channel, improving global trade forecasts", Voxeu.org, 12 June.
Exports Imports
-1
0
1
2
3
4
5
6
2011 2012 2013 2014 2015 2016 2017
North America South America b Europe
Asia Other regions a World
-1
0
1
2
3
4
5
6
2011 2012 2013 2014 2015 2016 2017
North America South America b Europe
Asia Other regions a World
PRESS/820
- 8 -
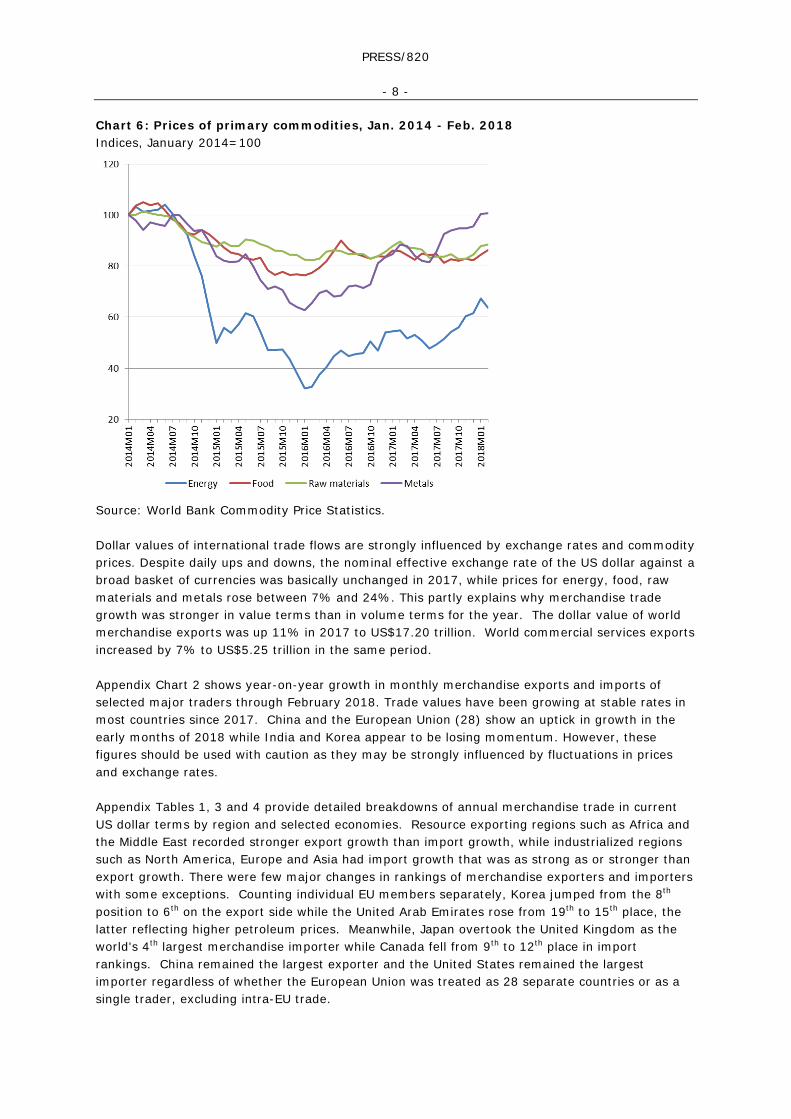
Chart 6: Prices of primary commodities, Jan. 2014 - Feb. 2018 Indices, January 2014=100
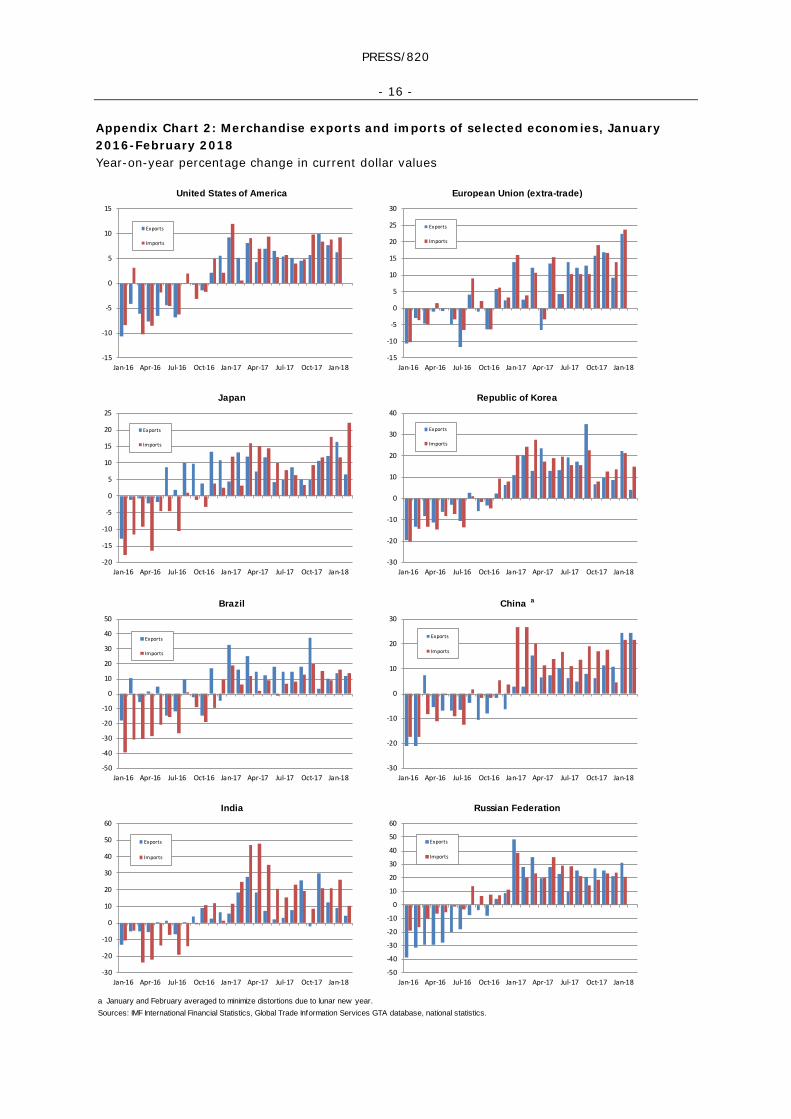
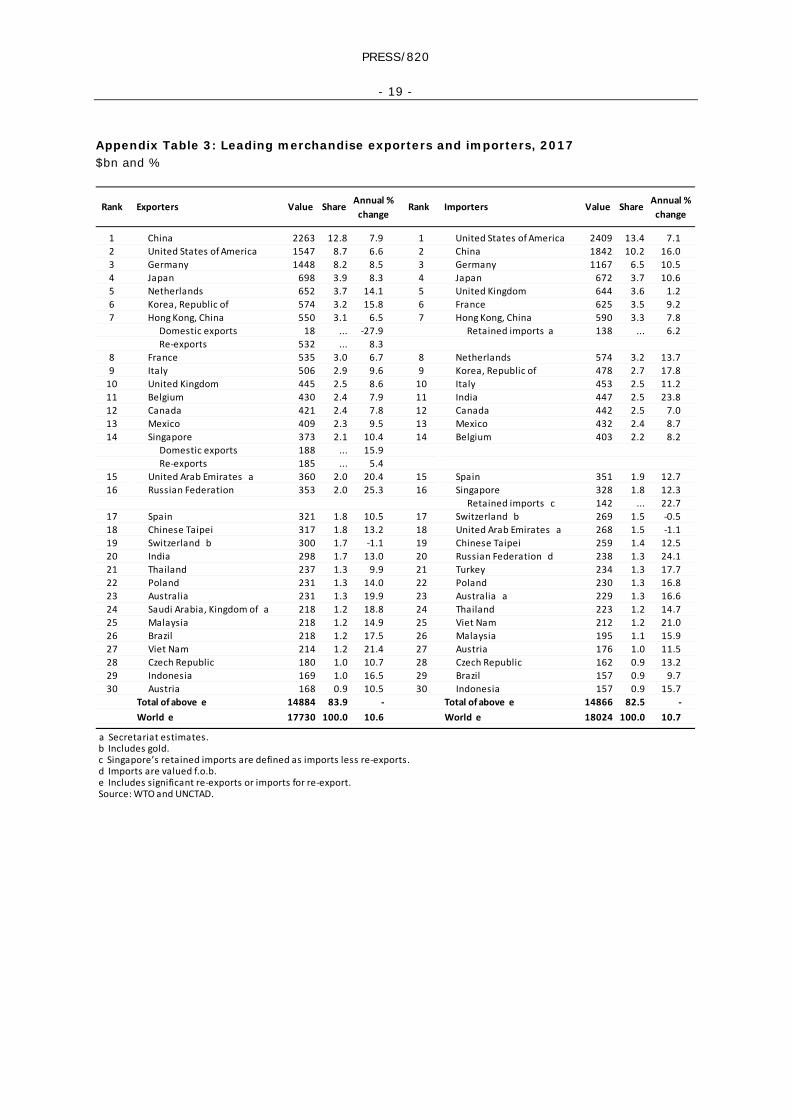
Source: World Bank Commodity Price Statistics. Dollar values of international trade flows are strongly influenced by exchange rates and commodity prices. Despite daily ups and downs, the nominal effective exchange rate of the US dollar against a broad basket of currencies was basically unchanged in 2017, while prices for energy, food, raw materials and metals rose between 7% and 24%. This partly explains why merchandise trade growth was stronger in value terms than in volume terms for the year. The dollar value of world merchandise exports was up 11% in 2017 to US$17.20 trillion. World commercial services exports increased by 7% to US$5.25 trillion in the same period. Appendix Chart 2 shows year-on-year growth in monthly merchandise exports and imports of selected major traders through February 2018. Trade values have been growing at stable rates in most countries since 2017. China and the European Union (28) show an uptick in growth in the early months of 2018 while India and Korea appear to be losing momentum. However, these figures should be used with caution as they may be strongly influenced by fluctuations in prices and exchange rates. Appendix Tables 1, 3 and 4 provide detailed breakdowns of annual merchandise trade in current US dollar terms by region and selected economies. Resource exporting regions such as Africa and the Middle East recorded stronger export growth than import growth, while industrialized regions such as North America, Europe and Asia had import growth that was as strong as or stronger than export growth. There were few major changes in rankings of merchandise exporters and importers with some exceptions. Counting individual EU members separately, Korea jumped from the 8th position to 6th on the export side while the United Arab Emirates rose from 19th to 15th place, the latter reflecting higher petroleum prices. Meanwhile, Japan overtook the United Kingdom as the world's 4th largest merchandise importer while Canada fell from 9th to 12th place in import rankings. China remained the largest exporter and the United States remained the largest importer regardless of whether the European Union was treated as 28 separate countries or as a single trader, excluding intra-EU trade.
PRESS/820
- 9 -
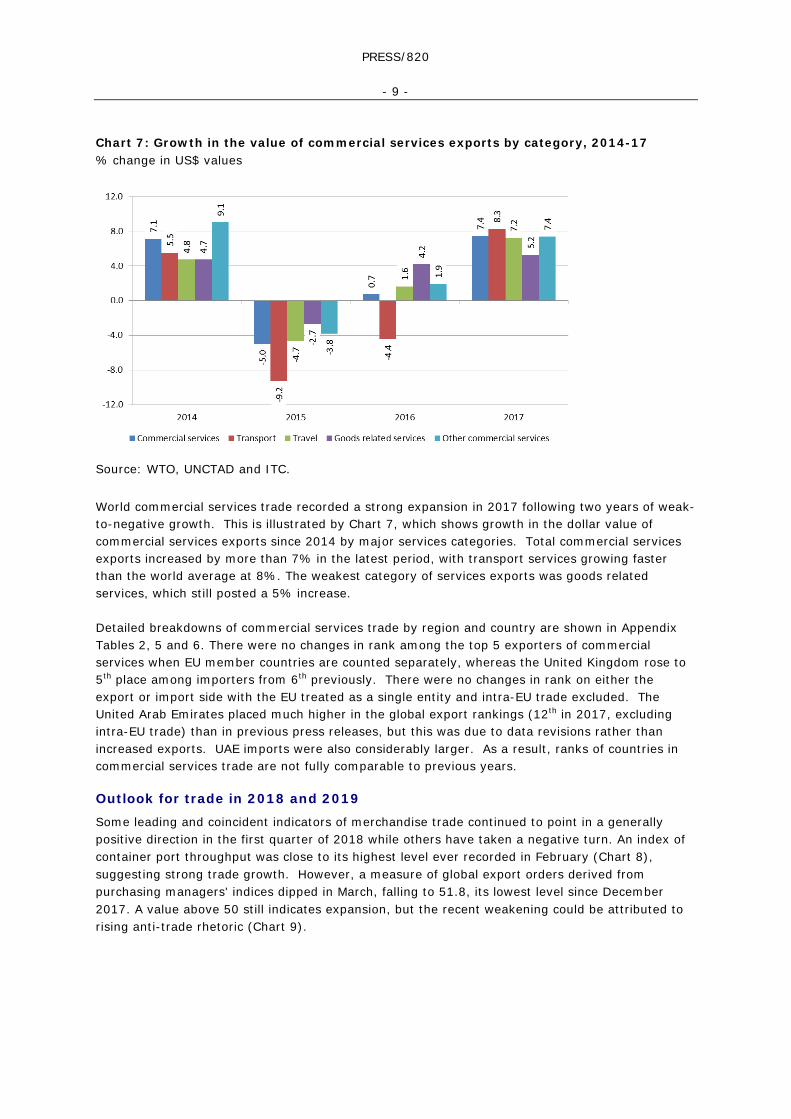
Chart 7: Growth in the value of commercial services exports by category, 2014-17 % change in US$ values
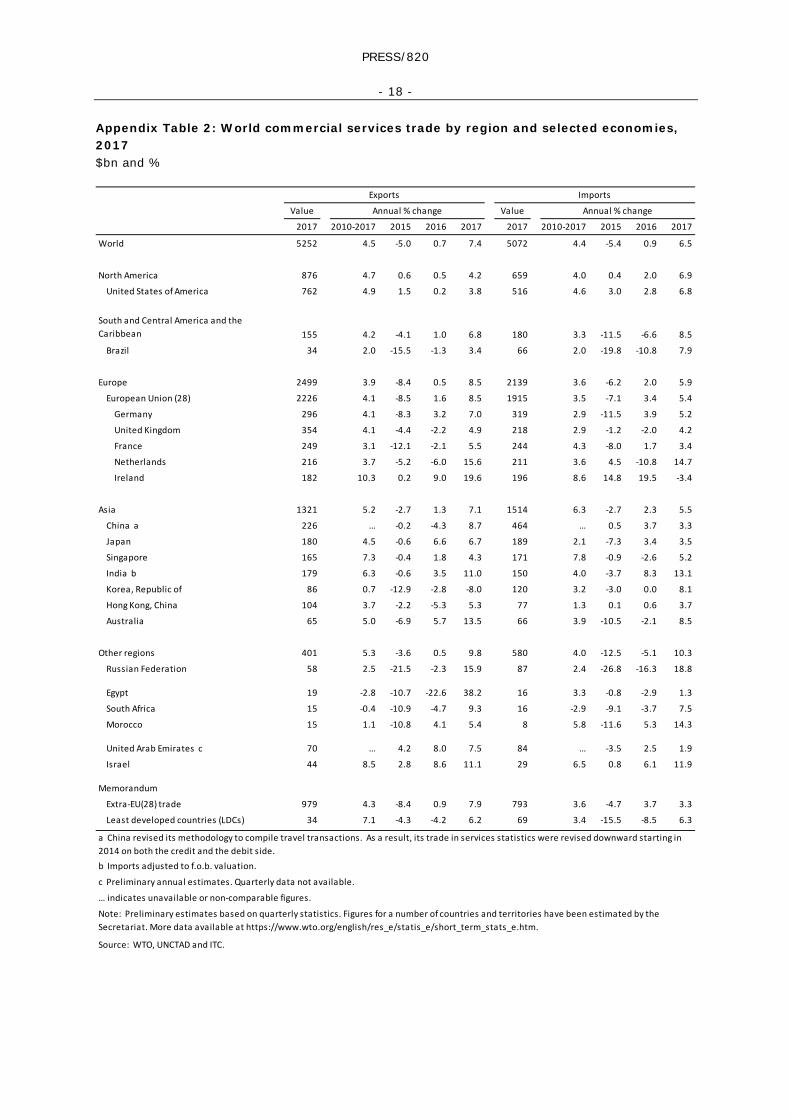
Source: WTO, UNCTAD and ITC. World commercial services trade recorded a strong expansion in 2017 following two years of weak-to-negative growth. This is illustrated by Chart 7, which shows growth in the dollar value of commercial services exports since 2014 by major services categories. Total commercial services exports increased by more than 7% in the latest period, with transport services growing faster than the world average at 8%. The weakest category of services exports was goods related services, which still posted a 5% increase. Detailed breakdowns of commercial services trade by region and country are shown in Appendix Tables 2, 5 and 6. There were no changes in rank among the top 5 exporters of commercial services when EU member countries are counted separately, whereas the United Kingdom rose to 5th place among importers from 6th previously. There were no changes in rank on either the export or import side with the EU treated as a single entity and intra-EU trade excluded. The United Arab Emirates placed much higher in the global export rankings (12th in 2017, excluding intra-EU trade) than in previous press releases, but this was due to data revisions rather than increased exports. UAE imports were also considerably larger. As a result, ranks of countries in commercial services trade are not fully comparable to previous years.
Outlook for trade in 2018 and 2019
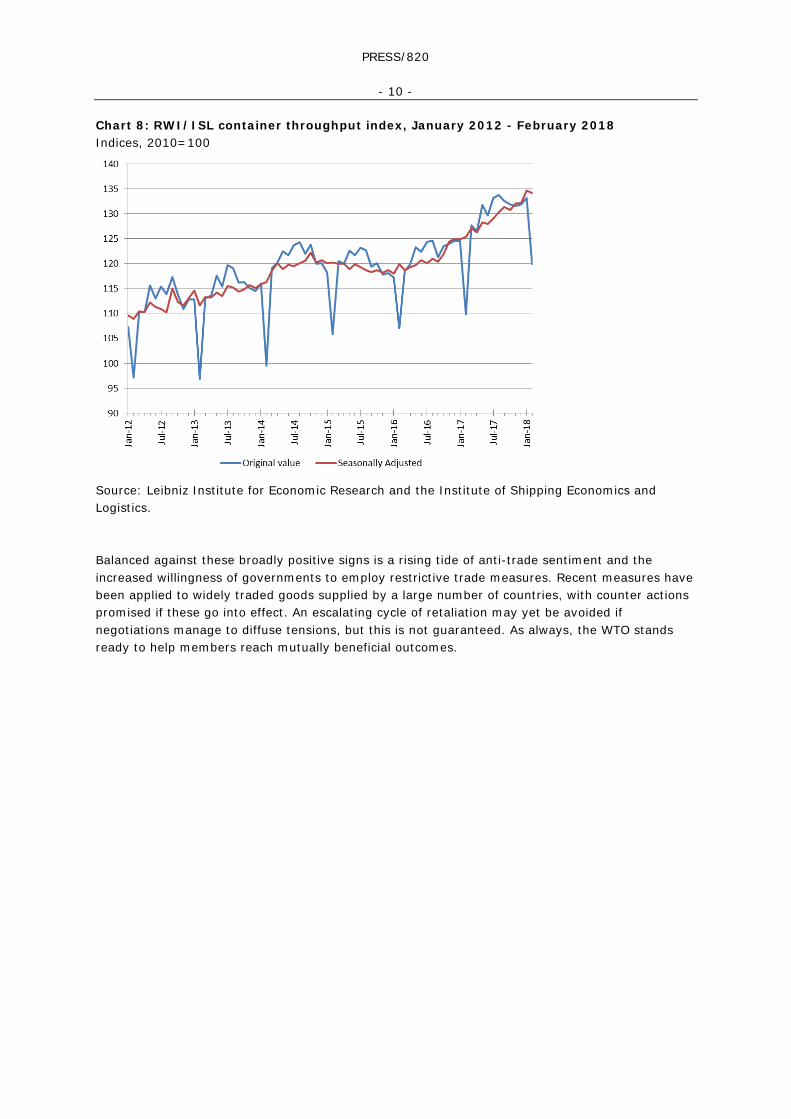
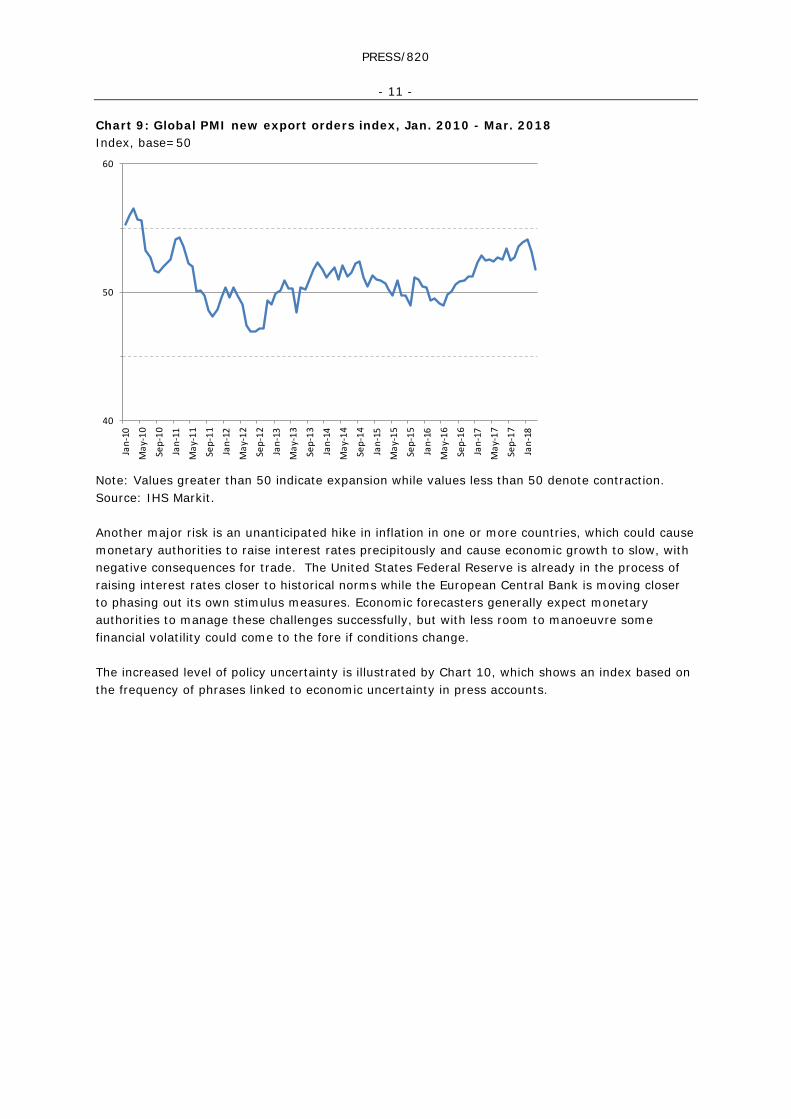
Some leading and coincident indicators of merchandise trade continued to point in a generally positive direction in the first quarter of 2018 while others have taken a negative turn. An index of container port throughput was close to its highest level ever recorded in February (Chart 8), suggesting strong trade growth. However, a measure of global export orders derived from purchasing managers' indices dipped in March, falling to 51.8, its lowest level since December 2017. A value above 50 still indicates expansion, but the recent weakening could be attributed to rising anti-trade rhetoric (Chart 9).
PRESS/820
- 10 -
Chart 8: RWI/ISL container throughput index, January 2012 - February 2018 Indices, 2010=100
Source: Leibniz Institute for Economic Research and the Institute of Shipping Economics and Logistics. Balanced against these broadly positive signs is a rising tide of anti-trade sentiment and the increased willingness of governments to employ restrictive trade measures. Recent measures have been applied to widely traded goods supplied by a large number of countries, with counter actions promised if these go into effect. An escalating cycle of retaliation may yet be avoided if negotiations manage to diffuse tensions, but this is not guaranteed. As always, the WTO stands ready to help members reach mutually beneficial outcomes.
PRESS/820
- 11 -
Chart 9: Global PMI new export orders index, Jan. 2010 - Mar. 2018 Index, base=50
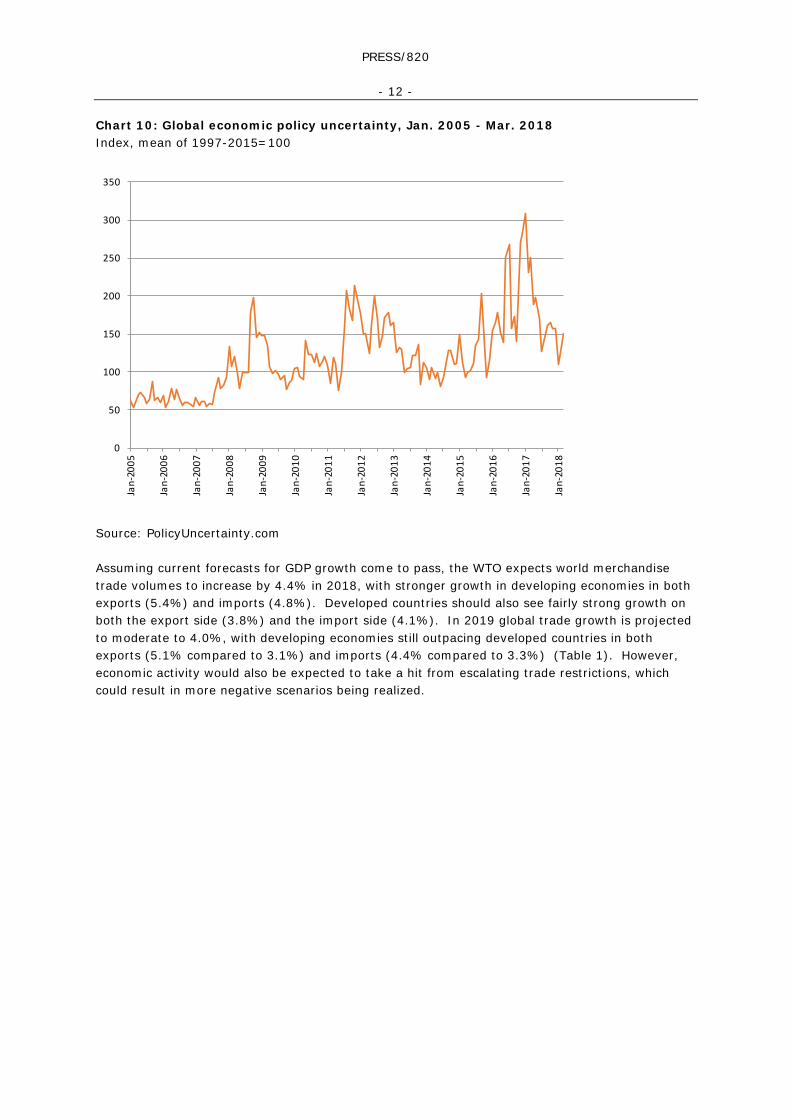
Note: Values greater than 50 indicate expansion while values less than 50 denote contraction. Source: IHS Markit. Another major risk is an unanticipated hike in inflation in one or more countries, which could cause monetary authorities to raise interest rates precipitously and cause economic growth to slow, with negative consequences for trade. The United States Federal Reserve is already in the process of raising interest rates closer to historical norms while the European Central Bank is moving closer to phasing out its own stimulus measures. Economic forecasters generally expect monetary authorities to manage these challenges successfully, but with less room to manoeuvre some financial volatility could come to the fore if conditions change. The increased level of policy uncertainty is illustrated by Chart 10, which shows an index based on the frequency of phrases linked to economic uncertainty in press accounts.
40
50
60
Jan-
10
May
-10
Sep-
10
Jan-
11
May
-11
Sep-
11
Jan-
12
May
-12
Sep-
12
Jan-
13
May
-13
Sep-
13
Jan-
14
May
-14
Sep-
14
Jan-
15
May
-15
Sep-
15
Jan-
16
May
-16
Sep-
16
Jan-
17
May
-17
Sep-
17
Jan-
18
PRESS/820
- 12 -
Chart 10: Global economic policy uncertainty, Jan. 2005 - Mar. 2018 Index, mean of 1997-2015=100
Source: PolicyUncertainty.com Assuming current forecasts for GDP growth come to pass, the WTO expects world merchandise trade volumes to increase by 4.4% in 2018, with stronger growth in developing economies in both exports (5.4%) and imports (4.8%). Developed countries should also see fairly strong growth on both the export side (3.8%) and the import side (4.1%). In 2019 global trade growth is projected to moderate to 4.0%, with developing economies still outpacing developed countries in both exports (5.1% compared to 3.1%) and imports (4.4% compared to 3.3%) (Table 1). However, economic activity would also be expected to take a hit from escalating trade restrictions, which could result in more negative scenarios being realized.
0
50
100
150
200
250
300
350
Jan-
2005
Jan-
2006
Jan-
2007
Jan-
2008
Jan-
2009
Jan-
2010
Jan-
2011
Jan-
2012
Jan-
2013
Jan-
2014
Jan-
2015
Jan-
2016
Jan-
2017
Jan-
2018
PRESS/820
- 13 -
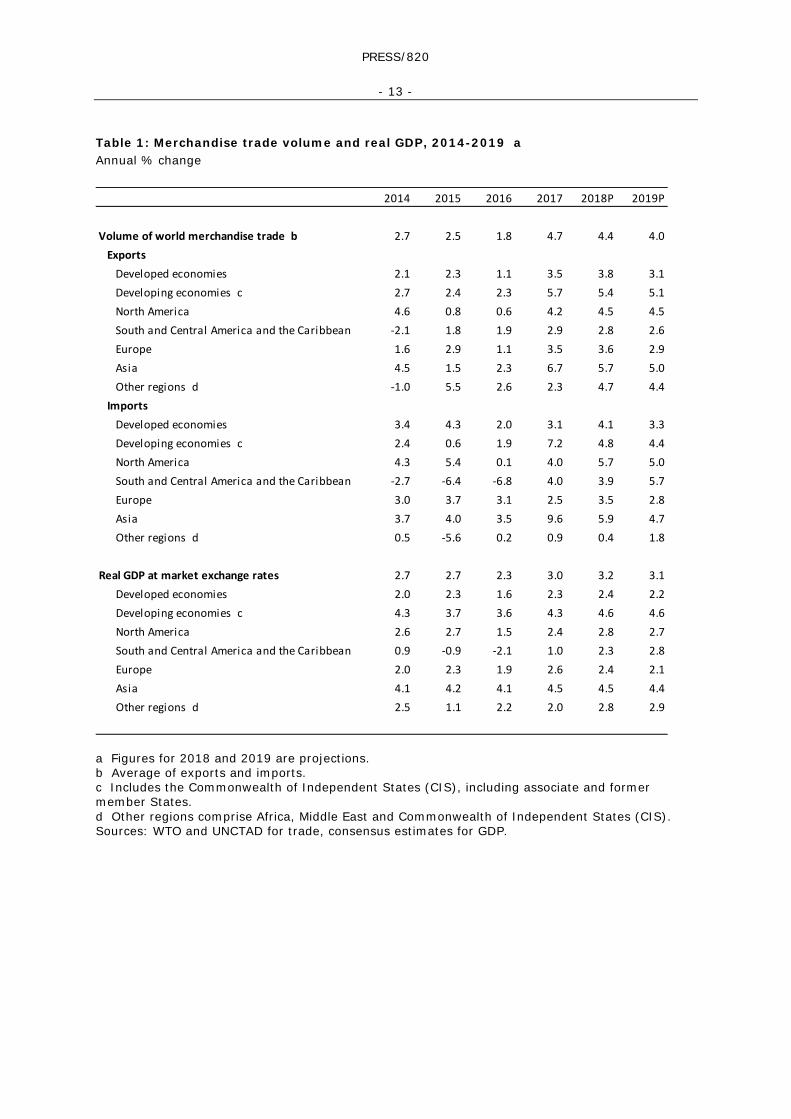
Table 1: Merchandise trade volume and real GDP, 2014-2019 a Annual % change
a Figures for 2018 and 2019 are projections. b Average of exports and imports. c Includes the Commonwealth of Independent States (CIS), including associate and former member States. d Other regions comprise Africa, Middle East and Commonwealth of Independent States (CIS). Sources: WTO and UNCTAD for trade, consensus estimates for GDP.
2014 2015 2016 2017 2018P 2019P
Volume of world merchandise trade b 2.7 2.5 1.8 4.7 4.4 4.0Exports
Developed economies 2.1 2.3 1.1 3.5 3.8 3.1Developing economies c 2.7 2.4 2.3 5.7 5.4 5.1North America 4.6 0.8 0.6 4.2 4.5 4.5South and Central America and the Caribbean -2.1 1.8 1.9 2.9 2.8 2.6Europe 1.6 2.9 1.1 3.5 3.6 2.9Asia 4.5 1.5 2.3 6.7 5.7 5.0Other regions d -1.0 5.5 2.6 2.3 4.7 4.4
ImportsDeveloped economies 3.4 4.3 2.0 3.1 4.1 3.3Developing economies c 2.4 0.6 1.9 7.2 4.8 4.4North America 4.3 5.4 0.1 4.0 5.7 5.0South and Central America and the Caribbean -2.7 -6.4 -6.8 4.0 3.9 5.7Europe 3.0 3.7 3.1 2.5 3.5 2.8Asia 3.7 4.0 3.5 9.6 5.9 4.7Other regions d 0.5 -5.6 0.2 0.9 0.4 1.8
Real GDP at market exchange rates 2.7 2.7 2.3 3.0 3.2 3.1Developed economies 2.0 2.3 1.6 2.3 2.4 2.2Developing economies c 4.3 3.7 3.6 4.3 4.6 4.6North America 2.6 2.7 1.5 2.4 2.8 2.7South and Central America and the Caribbean 0.9 -0.9 -2.1 1.0 2.3 2.8Europe 2.0 2.3 1.9 2.6 2.4 2.1Asia 4.1 4.2 4.1 4.5 4.5 4.4Other regions d 2.5 1.1 2.2 2.0 2.8 2.9

PRESS/820
- 14 -
Appendix Tables and Charts
PRESS/820
- 15 -
Appendix Chart 1: Contributions to GDP growth of selected economies, 2012-17 % change and percentage points
Sources: OECD Quarterly National Accounts for all countries except China, which was sourced from UN National Accounts Statisticsthrough 2016 and the Economist Intelligence Unit for 2017.
United Kingdom
United States of America Euro Area
ChinaJapan
Republic of Korea
-1.0
-0.5
0.0
0.5
1.0
1.5
2.0
2.5
3.0
3.5
4.0
2012 2013 2014 2015 2016 2017
-2.0
-1.0
0.0
1.0
2.0
3.0
4.0
5.0
6.0
7.0
8.0
9.0
2012 2013 2014 2015 2016 2017-1.5
-1.0
-0.5
0.0
0.5
1.0
1.5
2.0
2.5
3.0
2012 2013 2014 2015 2016 2017
-3.0
-2.0
-1.0
0.0
1.0
2.0
3.0
4.0
5.0
6.0
2012 2013 2014 2015 2016 2017
Private consumption Government expenditure
Gross investment External balance
Statistical difference GDP
-1.0
-0.5
0.0
0.5
1.0
1.5
2.0
2.5
3.0
3.5
4.0
2012 2013 2014 2015 2016 2017
Private consumption Government expenditure
Gross investment External balance
Statistical difference GDP
-3.0
-2.0
-1.0
0.0
1.0
2.0
3.0
2012 2013 2014 2015 2016 2017
PRESS/820
- 16 -
Appendix Chart 2: Merchandise exports and imports of selected economies, January 2016-February 2018 Year-on-year percentage change in current dollar values
a January and February averaged to minimize distortions due to lunar new year.Sources: IMF International Financial Statistics, Global Trade Information Services GTA database, national statistics.
India Russian Federation
United States of America European Union (extra-trade)
Japan Republic of Korea
Brazil China a
-15
-10
-5
0
5
10
15
20
25
30
Jan-16 Apr-16 Jul-16 Oct-16 Jan-17 Apr-17 Jul-17 Oct-17 Jan-18
Exports
Imports
-20
-15
-10
-5
0
5
10
15
20
25
Jan-16 Apr-16 Jul-16 Oct-16 Jan-17 Apr-17 Jul-17 Oct-17 Jan-18
Exports
Imports
-30
-20
-10
0
10
20
30
40
Jan-16 Apr-16 Jul-16 Oct-16 Jan-17 Apr-17 Jul-17 Oct-17 Jan-18
Exports
Imports
-50
-40
-30
-20
-10
0
10
20
30
40
50
Jan-16 Apr-16 Jul-16 Oct-16 Jan-17 Apr-17 Jul-17 Oct-17 Jan-18
Exports
Imports
-30
-20
-10
0
10
20
30
Jan-16 Apr-16 Jul-16 Oct-16 Jan-17 Apr-17 Jul-17 Oct-17 Jan-18
Exports
Imports
-30
-20
-10
0
10
20
30
40
50
60
Jan-16 Apr-16 Jul-16 Oct-16 Jan-17 Apr-17 Jul-17 Oct-17 Jan-18
Exports
Imports
-50
-40
-30
-20
-10
0
10
20
30
40
50
60
Jan-16 Apr-16 Jul-16 Oct-16 Jan-17 Apr-17 Jul-17 Oct-17 Jan-18
Exports
Imports
-15
-10
-5
0
5
10
15
Jan-16 Apr-16 Jul-16 Oct-16 Jan-17 Apr-17 Jul-17 Oct-17 Jan-18
Exports
Imports
PRESS/820
- 17 -
Appendix Table 1: World merchandise trade by region and selected economies, 2017 $bn and %
Value Value
2017 2010-17 2015 2016 2017 2017 2010-17 2015 2016 2017
World 17198 2.1 -13.2 -3.0 10.7 17572 2.1 -12.5 -2.9 10.7
North America 2377 2.8 -8.0 -3.4 7.3 3285 2.9 -4.5 -2.8 7.3
United States of America 1547 2.8 -7.3 -3.4 6.6 2409 2.9 -4.0 -2.8 7.1
Canada 421 1.2 -13.9 -4.8 7.8 442 1.3 -9.6 -3.7 7.0
Mexico 409 4.6 -4.1 -1.7 9.5 432 4.9 -1.5 -1.9 8.7
South and Central America and the Caribbean 583 -0.2 -21.0 -4.9 13.0 579 -0.2 -16.3 -14.2 7.8
Brazil 218 1.1 -15.1 -3.1 17.5 157 -2.8 -25.2 -19.8 9.7Other South and Central America and the Caribbean 365 -1.0 -23.9 -5.8 10.5 421 1.0 -12.0 -11.9 7.0
Europe 6501 2.0 -12.5 -0.2 9.3 6521 1.4 -13.2 0.4 9.9
European Union (28) 5904 1.9 -12.5 -0.2 9.7 5878 1.2 -13.3 0.4 10.0
Germany 1448 2.0 -11.2 0.6 8.5 1167 1.5 -12.9 0.4 10.5
Netherlands 652 1.8 -15.2 0.1 14.1 574 1.5 -13.1 -1.4 13.7
France 535 0.3 -12.9 -0.9 6.7 625 0.3 -15.5 -0.2 9.2
United Kingdom 445 1.0 -8.9 -11.0 8.6 644 1.2 -9.3 1.6 1.2
Italy 506 1.8 -13.7 1.0 9.6 453 -1.0 -13.3 -1.0 11.2
Commonwealth of Independent States (CIS), including associate and former member States 518 -1.8 -32.3 -16.5 24.4 402 -0.5 -32.4 -2.5 20.8
Russian Federation a 353 -1.8 -31.3 -17.4 25.3 238 -0.6 -37.3 -0.7 24.1
Africa 417 -3.2 -29.3 -9.6 18.3 534 1.6 -13.9 -10.7 7.8
South Africa b 89 -0.4 -11.7 -7.6 18.4 101 0.7 -14.2 -12.5 10.6
Africa less South Africa 328 -3.8 -32.8 -10.1 18.2 432 1.8 -13.8 -10.3 7.1
Oil exporters c 154 -8.5 -44.1 -23.2 29.0 144 -0.5 -19.2 -17.9 6.4
Non oil exporters 173 2.8 -15.4 3.3 10.1 289 3.1 -10.4 -6.0 7.5
Middle East 961 0.8 -30.3 -7.0 18.0 712 2.9 -7.4 -4.5 1.1
Asia 5842 3.2 -7.9 -3.4 10.7 5541 2.9 -14.4 -4.4 15.3
China 2263 5.3 -2.9 -7.7 7.9 1842 4.0 -14.3 -5.5 16.0
Japan 698 -1.4 -9.5 3.2 8.3 672 -0.5 -20.2 -6.2 10.6
India 298 4.0 -17.1 -1.2 13.0 447 3.6 -15.1 -8.1 23.8
Newly industrialized economies (4) d 1283 2.1 -11.1 -2.8 12.6 1203 1.3 -16.6 -4.2 13.7
Memorandum
EU (28) extra-trade 2122 2.4 -12.2 -2.8 9.9 2097 0.5 -14.6 -1.3 10.6
Least developed countries (LDCs) 164 1.1 -22.1 -0.8 13.5 247 6.0 -7.6 -6.0 11.6
a Imports are valued f.o.b.
b Secretariat estimates.
c Algeria, Angola, Cameroon, Chad, Congo, Equatorial Guinea, Gabon, Libya, Nigeria, Sudan.
d Hong Kong, China; Korea, Republic of; Singapore and Chinese Taipei.Source: WTO and UNCTAD.
Exports Imports
Annual percentage change Annual percentage change
PRESS/820
- 18 -
Appendix Table 2: World commercial services trade by region and selected economies, 2017 $bn and %
Value Value
2017 2010-2017 2015 2016 2017 2017 2010-2017 2015 2016 2017
World 5252 4.5 -5.0 0.7 7.4 5072 4.4 -5.4 0.9 6.5
North America 876 4.7 0.6 0.5 4.2 659 4.0 0.4 2.0 6.9
United States of America 762 4.9 1.5 0.2 3.8 516 4.6 3.0 2.8 6.8
South and Central America and the Caribbean 155 4.2 -4.1 1.0 6.8 180 3.3 -11.5 -6.6 8.5
Brazil 34 2.0 -15.5 -1.3 3.4 66 2.0 -19.8 -10.8 7.9
Europe 2499 3.9 -8.4 0.5 8.5 2139 3.6 -6.2 2.0 5.9
European Union (28) 2226 4.1 -8.5 1.6 8.5 1915 3.5 -7.1 3.4 5.4
Germany 296 4.1 -8.3 3.2 7.0 319 2.9 -11.5 3.9 5.2
United Kingdom 354 4.1 -4.4 -2.2 4.9 218 2.9 -1.2 -2.0 4.2
France 249 3.1 -12.1 -2.1 5.5 244 4.3 -8.0 1.7 3.4
Netherlands 216 3.7 -5.2 -6.0 15.6 211 3.6 4.5 -10.8 14.7
Ireland 182 10.3 0.2 9.0 19.6 196 8.6 14.8 19.5 -3.4
Asia 1321 5.2 -2.7 1.3 7.1 1514 6.3 -2.7 2.3 5.5
China a 226 … -0.2 -4.3 8.7 464 … 0.5 3.7 3.3
Japan 180 4.5 -0.6 6.6 6.7 189 2.1 -7.3 3.4 3.5
Singapore 165 7.3 -0.4 1.8 4.3 171 7.8 -0.9 -2.6 5.2
India b 179 6.3 -0.6 3.5 11.0 150 4.0 -3.7 8.3 13.1
Korea, Republic of 86 0.7 -12.9 -2.8 -8.0 120 3.2 -3.0 0.0 8.1
Hong Kong, China 104 3.7 -2.2 -5.3 5.3 77 1.3 0.1 0.6 3.7
Australia 65 5.0 -6.9 5.7 13.5 66 3.9 -10.5 -2.1 8.5
Other regions 401 5.3 -3.6 0.5 9.8 580 4.0 -12.5 -5.1 10.3
Russian Federation 58 2.5 -21.5 -2.3 15.9 87 2.4 -26.8 -16.3 18.8
Egypt 19 -2.8 -10.7 -22.6 38.2 16 3.3 -0.8 -2.9 1.3
South Africa 15 -0.4 -10.9 -4.7 9.3 16 -2.9 -9.1 -3.7 7.5
Morocco 15 1.1 -10.8 4.1 5.4 8 5.8 -11.6 5.3 14.3
United Arab Emirates c 70 … 4.2 8.0 7.5 84 … -3.5 2.5 1.9
Israel 44 8.5 2.8 8.6 11.1 29 6.5 0.8 6.1 11.9
Memorandum
Extra-EU(28) trade 979 4.3 -8.4 0.9 7.9 793 3.6 -4.7 3.7 3.3
Least developed countries (LDCs) 34 7.1 -4.3 -4.2 6.2 69 3.4 -15.5 -8.5 6.3
b Imports adjusted to f.o.b. valuation.
c Preliminary annual estimates. Quarterly data not available.
… indicates unavailable or non-comparable figures.
Source: WTO, UNCTAD and ITC.
Note: Preliminary estimates based on quarterly statistics. Figures for a number of countries and territories have been estimated by the Secretariat. More data available at https://www.wto.org/english/res_e/statis_e/short_term_stats_e.htm.
Exports Imports
Annual % change Annual % change
a China revised its methodology to compile travel transactions. As a result, its trade in services statistics were revised downward starting in 2014 on both the credit and the debit side.
PRESS/820
- 19 -
Appendix Table 3: Leading merchandise exporters and importers, 2017 $bn and %
Rank Exporters Value ShareAnnual %
changeRank Importers Value Share
Annual % change
1 China 2263 12.8 7.9 1 United States of America 2409 13.4 7.12 United States of America 1547 8.7 6.6 2 China 1842 10.2 16.03 Germany 1448 8.2 8.5 3 Germany 1167 6.5 10.54 Japan 698 3.9 8.3 4 Japan 672 3.7 10.65 Netherlands 652 3.7 14.1 5 United Kingdom 644 3.6 1.26 Korea, Republic of 574 3.2 15.8 6 France 625 3.5 9.27 Hong Kong, China 550 3.1 6.5 7 Hong Kong, China 590 3.3 7.8
Domestic exports 18 ... -27.9 Retained imports a 138 ... 6.2Re-exports 532 ... 8.3
8 France 535 3.0 6.7 8 Netherlands 574 3.2 13.79 Italy 506 2.9 9.6 9 Korea, Republic of 478 2.7 17.8
10 United Kingdom 445 2.5 8.6 10 Italy 453 2.5 11.211 Belgium 430 2.4 7.9 11 India 447 2.5 23.812 Canada 421 2.4 7.8 12 Canada 442 2.5 7.013 Mexico 409 2.3 9.5 13 Mexico 432 2.4 8.714 Singapore 373 2.1 10.4 14 Belgium 403 2.2 8.2
Domestic exports 188 ... 15.9 Re-exports 185 ... 5.4
15 United Arab Emirates a 360 2.0 20.4 15 Spain 351 1.9 12.716 Russian Federation 353 2.0 25.3 16 Singapore 328 1.8 12.3
Retained imports c 142 ... 22.717 Spain 321 1.8 10.5 17 Switzerland b 269 1.5 -0.518 Chinese Taipei 317 1.8 13.2 18 United Arab Emirates a 268 1.5 -1.119 Switzerland b 300 1.7 -1.1 19 Chinese Taipei 259 1.4 12.520 India 298 1.7 13.0 20 Russian Federation d 238 1.3 24.121 Thailand 237 1.3 9.9 21 Turkey 234 1.3 17.722 Poland 231 1.3 14.0 22 Poland 230 1.3 16.823 Australia 231 1.3 19.9 23 Australia a 229 1.3 16.624 Saudi Arabia, Kingdom of a 218 1.2 18.8 24 Thailand 223 1.2 14.725 Malaysia 218 1.2 14.9 25 Viet Nam 212 1.2 21.026 Brazil 218 1.2 17.5 26 Malaysia 195 1.1 15.927 Viet Nam 214 1.2 21.4 27 Austria 176 1.0 11.528 Czech Republic 180 1.0 10.7 28 Czech Republic 162 0.9 13.229 Indonesia 169 1.0 16.5 29 Brazil 157 0.9 9.730 Austria 168 0.9 10.5 30 Indonesia 157 0.9 15.7
Total of above e 14884 83.9 - Total of above e 14866 82.5 -World e 17730 100.0 10.6 World e 18024 100.0 10.7
a Secretariat estimates.b Includes gold. c Singapore’s retained imports are defined as imports less re-exports.d Imports are valued f.o.b.e Includes significant re-exports or imports for re-export.Source: WTO and UNCTAD.
PRESS/820
- 20 -
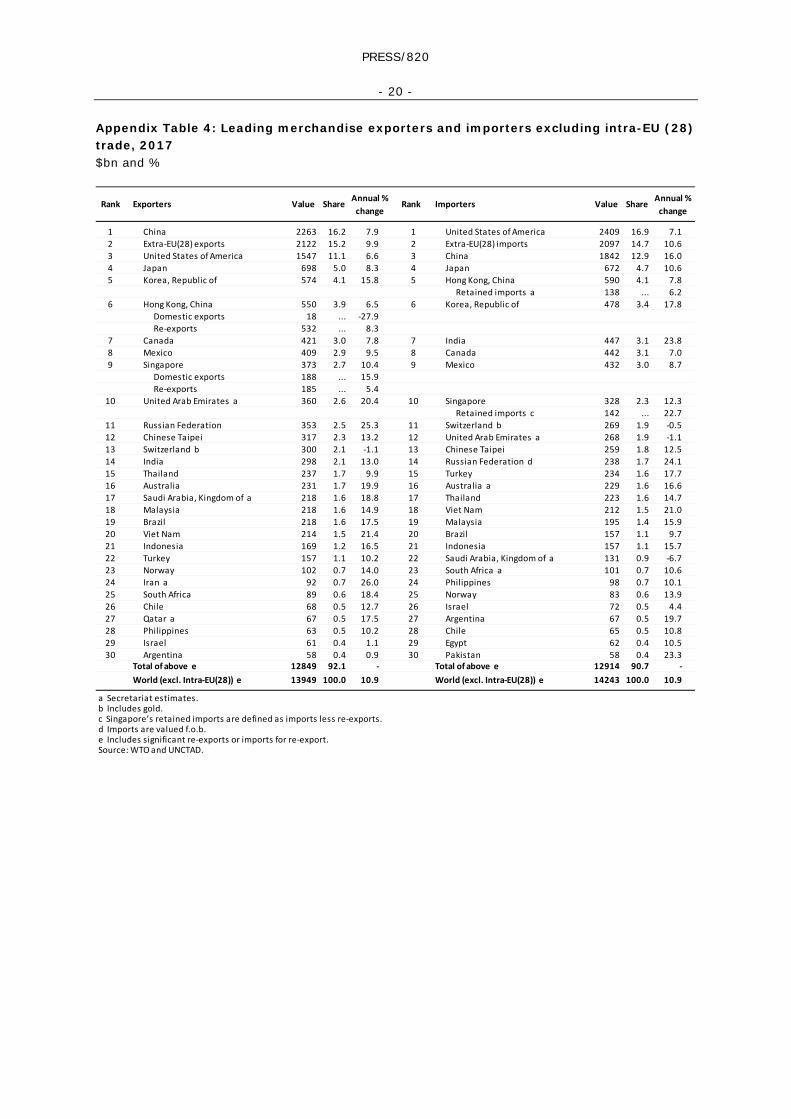
Appendix Table 4: Leading merchandise exporters and importers excluding intra-EU (28) trade, 2017 $bn and %
Rank Exporters Value ShareAnnual %
changeRank Importers Value Share
Annual % change
1 China 2263 16.2 7.9 1 United States of America 2409 16.9 7.12 Extra-EU(28) exports 2122 15.2 9.9 2 Extra-EU(28) imports 2097 14.7 10.63 United States of America 1547 11.1 6.6 3 China 1842 12.9 16.04 Japan 698 5.0 8.3 4 Japan 672 4.7 10.65 Korea, Republic of 574 4.1 15.8 5 Hong Kong, China 590 4.1 7.8
Retained imports a 138 ... 6.26 Hong Kong, China 550 3.9 6.5 6 Korea, Republic of 478 3.4 17.8
Domestic exports 18 ... -27.9 Re-exports 532 ... 8.3
7 Canada 421 3.0 7.8 7 India 447 3.1 23.88 Mexico 409 2.9 9.5 8 Canada 442 3.1 7.09 Singapore 373 2.7 10.4 9 Mexico 432 3.0 8.7
Domestic exports 188 ... 15.9 Re-exports 185 ... 5.4
10 United Arab Emirates a 360 2.6 20.4 10 Singapore 328 2.3 12.3 Retained imports c 142 ... 22.7
11 Russian Federation 353 2.5 25.3 11 Switzerland b 269 1.9 -0.512 Chinese Taipei 317 2.3 13.2 12 United Arab Emirates a 268 1.9 -1.113 Switzerland b 300 2.1 -1.1 13 Chinese Taipei 259 1.8 12.514 India 298 2.1 13.0 14 Russian Federation d 238 1.7 24.115 Thailand 237 1.7 9.9 15 Turkey 234 1.6 17.716 Australia 231 1.7 19.9 16 Australia a 229 1.6 16.617 Saudi Arabia, Kingdom of a 218 1.6 18.8 17 Thailand 223 1.6 14.718 Malaysia 218 1.6 14.9 18 Viet Nam 212 1.5 21.019 Brazil 218 1.6 17.5 19 Malaysia 195 1.4 15.920 Viet Nam 214 1.5 21.4 20 Brazil 157 1.1 9.721 Indonesia 169 1.2 16.5 21 Indonesia 157 1.1 15.722 Turkey 157 1.1 10.2 22 Saudi Arabia, Kingdom of a 131 0.9 -6.723 Norway 102 0.7 14.0 23 South Africa a 101 0.7 10.624 Iran a 92 0.7 26.0 24 Philippines 98 0.7 10.125 South Africa 89 0.6 18.4 25 Norway 83 0.6 13.926 Chile 68 0.5 12.7 26 Israel 72 0.5 4.427 Qatar a 67 0.5 17.5 27 Argentina 67 0.5 19.728 Philippines 63 0.5 10.2 28 Chile 65 0.5 10.829 Israel 61 0.4 1.1 29 Egypt 62 0.4 10.530 Argentina 58 0.4 0.9 30 Pakistan 58 0.4 23.3
Total of above e 12849 92.1 - Total of above e 12914 90.7 -World (excl. Intra-EU(28)) e 13949 100.0 10.9 World (excl. Intra-EU(28)) e 14243 100.0 10.9
a Secretariat estimates.b Includes gold. c Singapore’s retained imports are defined as imports less re-exports.d Imports are valued f.o.b.e Includes significant re-exports or imports for re-export.Source: WTO and UNCTAD.
PRESS/820
- 21 -
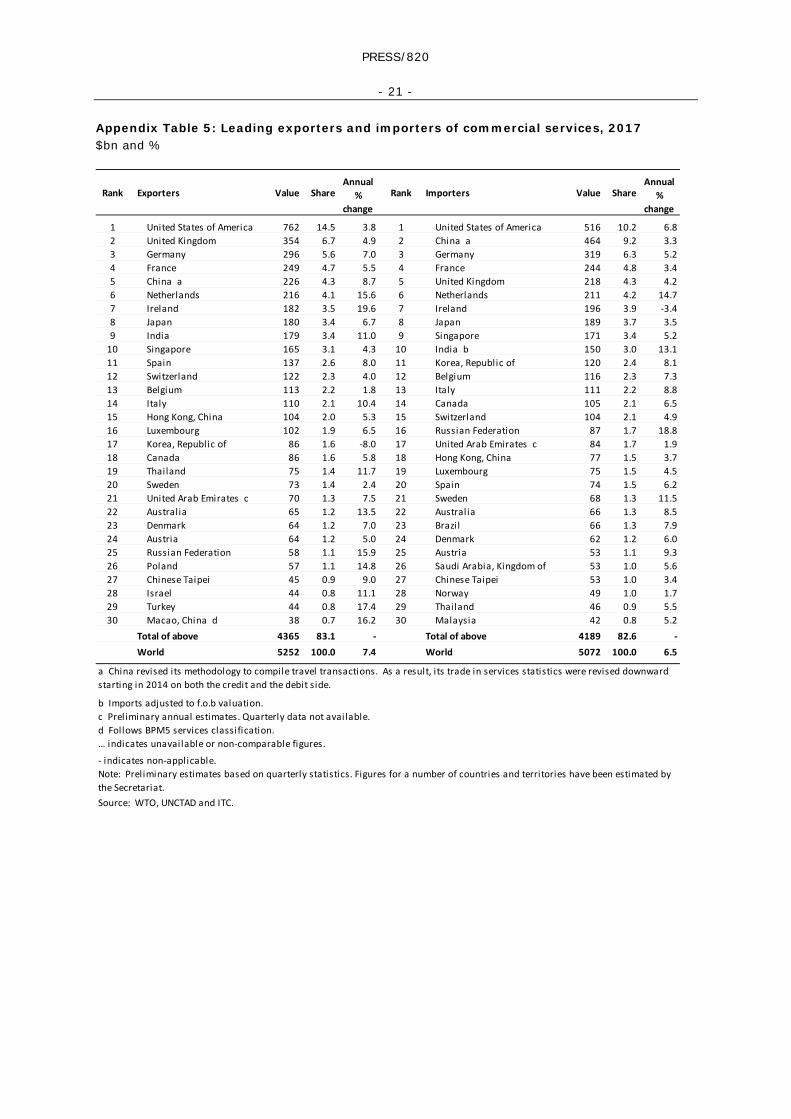
Appendix Table 5: Leading exporters and importers of commercial services, 2017 $bn and %
Rank Exporters Value ShareAnnual
% change
Rank Importers Value ShareAnnual
% change
1 United States of America 762 14.5 3.8 1 United States of America 516 10.2 6.82 United Kingdom 354 6.7 4.9 2 China a 464 9.2 3.33 Germany 296 5.6 7.0 3 Germany 319 6.3 5.24 France 249 4.7 5.5 4 France 244 4.8 3.45 China a 226 4.3 8.7 5 United Kingdom 218 4.3 4.26 Netherlands 216 4.1 15.6 6 Netherlands 211 4.2 14.77 Ireland 182 3.5 19.6 7 Ireland 196 3.9 -3.48 Japan 180 3.4 6.7 8 Japan 189 3.7 3.59 India 179 3.4 11.0 9 Singapore 171 3.4 5.2
10 Singapore 165 3.1 4.3 10 India b 150 3.0 13.111 Spain 137 2.6 8.0 11 Korea, Republic of 120 2.4 8.112 Switzerland 122 2.3 4.0 12 Belgium 116 2.3 7.313 Belgium 113 2.2 1.8 13 Italy 111 2.2 8.814 Italy 110 2.1 10.4 14 Canada 105 2.1 6.515 Hong Kong, China 104 2.0 5.3 15 Switzerland 104 2.1 4.916 Luxembourg 102 1.9 6.5 16 Russian Federation 87 1.7 18.817 Korea, Republic of 86 1.6 -8.0 17 United Arab Emirates c 84 1.7 1.918 Canada 86 1.6 5.8 18 Hong Kong, China 77 1.5 3.719 Thailand 75 1.4 11.7 19 Luxembourg 75 1.5 4.520 Sweden 73 1.4 2.4 20 Spain 74 1.5 6.221 United Arab Emirates c 70 1.3 7.5 21 Sweden 68 1.3 11.522 Australia 65 1.2 13.5 22 Australia 66 1.3 8.523 Denmark 64 1.2 7.0 23 Brazil 66 1.3 7.924 Austria 64 1.2 5.0 24 Denmark 62 1.2 6.025 Russian Federation 58 1.1 15.9 25 Austria 53 1.1 9.326 Poland 57 1.1 14.8 26 Saudi Arabia, Kingdom of 53 1.0 5.627 Chinese Taipei 45 0.9 9.0 27 Chinese Taipei 53 1.0 3.428 Israel 44 0.8 11.1 28 Norway 49 1.0 1.729 Turkey 44 0.8 17.4 29 Thailand 46 0.9 5.530 Macao, China d 38 0.7 16.2 30 Malaysia 42 0.8 5.2
Total of above 4365 83.1 - Total of above 4189 82.6 -World 5252 100.0 7.4 World 5072 100.0 6.5
b Imports adjusted to f.o.b valuation.c Preliminary annual estimates. Quarterly data not available.d Follows BPM5 services classification.
- indicates non-applicable.
Source: WTO, UNCTAD and ITC.
Note: Preliminary estimates based on quarterly statistics. Figures for a number of countries and territories have been estimated by the Secretariat.
… indicates unavailable or non-comparable figures.
a China revised its methodology to compile travel transactions. As a result, its trade in services statistics were revised downward starting in 2014 on both the credit and the debit side.
PRESS/820
- 22 -
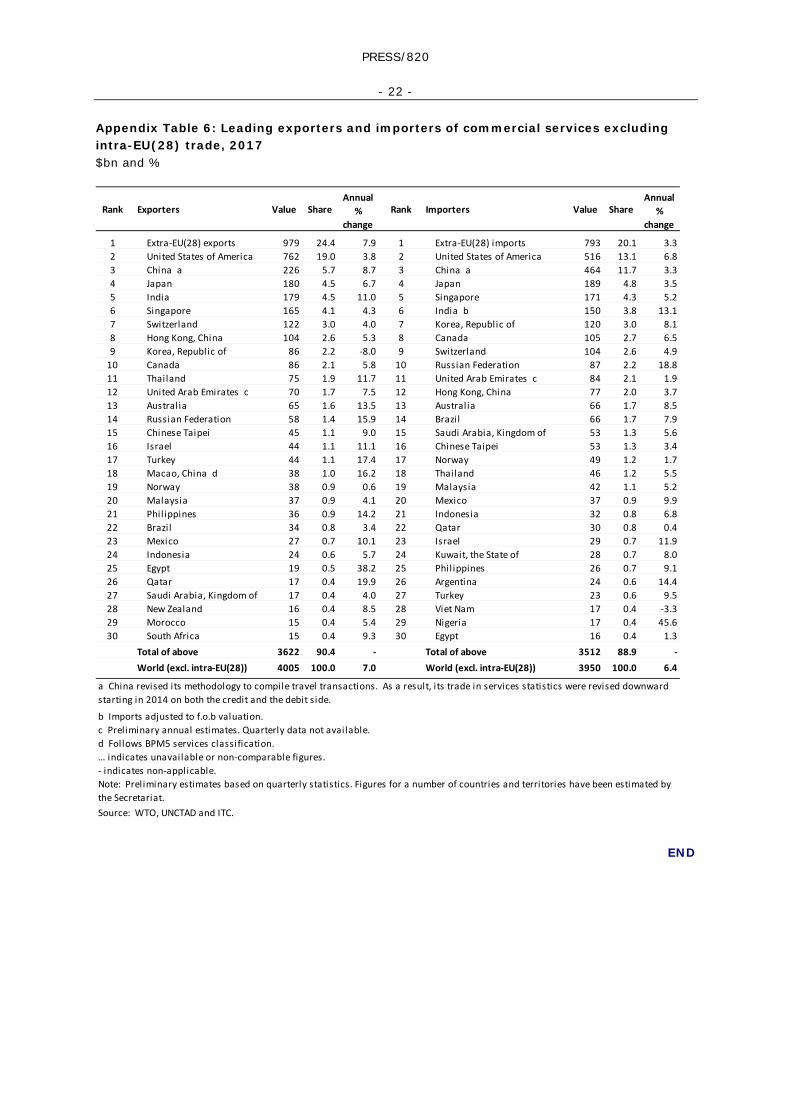
Appendix Table 6: Leading exporters and importers of commercial services excluding intra-EU(28) trade, 2017 $bn and %
END
Rank Exporters Value ShareAnnual
% change
Rank Importers Value ShareAnnual
% change
1 Extra-EU(28) exports 979 24.4 7.9 1 Extra-EU(28) imports 793 20.1 3.32 United States of America 762 19.0 3.8 2 United States of America 516 13.1 6.83 China a 226 5.7 8.7 3 China a 464 11.7 3.34 Japan 180 4.5 6.7 4 Japan 189 4.8 3.55 India 179 4.5 11.0 5 Singapore 171 4.3 5.26 Singapore 165 4.1 4.3 6 India b 150 3.8 13.17 Switzerland 122 3.0 4.0 7 Korea, Republic of 120 3.0 8.18 Hong Kong, China 104 2.6 5.3 8 Canada 105 2.7 6.59 Korea, Republic of 86 2.2 -8.0 9 Switzerland 104 2.6 4.9
10 Canada 86 2.1 5.8 10 Russian Federation 87 2.2 18.811 Thailand 75 1.9 11.7 11 United Arab Emirates c 84 2.1 1.912 United Arab Emirates c 70 1.7 7.5 12 Hong Kong, China 77 2.0 3.713 Australia 65 1.6 13.5 13 Australia 66 1.7 8.514 Russian Federation 58 1.4 15.9 14 Brazil 66 1.7 7.915 Chinese Taipei 45 1.1 9.0 15 Saudi Arabia, Kingdom of 53 1.3 5.616 Israel 44 1.1 11.1 16 Chinese Taipei 53 1.3 3.417 Turkey 44 1.1 17.4 17 Norway 49 1.2 1.718 Macao, China d 38 1.0 16.2 18 Thailand 46 1.2 5.519 Norway 38 0.9 0.6 19 Malaysia 42 1.1 5.220 Malaysia 37 0.9 4.1 20 Mexico 37 0.9 9.921 Philippines 36 0.9 14.2 21 Indonesia 32 0.8 6.822 Brazil 34 0.8 3.4 22 Qatar 30 0.8 0.423 Mexico 27 0.7 10.1 23 Israel 29 0.7 11.924 Indonesia 24 0.6 5.7 24 Kuwait, the State of 28 0.7 8.025 Egypt 19 0.5 38.2 25 Philippines 26 0.7 9.126 Qatar 17 0.4 19.9 26 Argentina 24 0.6 14.427 Saudi Arabia, Kingdom of 17 0.4 4.0 27 Turkey 23 0.6 9.528 New Zealand 16 0.4 8.5 28 Viet Nam 17 0.4 -3.329 Morocco 15 0.4 5.4 29 Nigeria 17 0.4 45.630 South Africa 15 0.4 9.3 30 Egypt 16 0.4 1.3
Total of above 3622 90.4 - Total of above 3512 88.9 -World (excl. intra-EU(28)) 4005 100.0 7.0 World (excl. intra-EU(28)) 3950 100.0 6.4
b Imports adjusted to f.o.b valuation.c Preliminary annual estimates. Quarterly data not available.d Follows BPM5 services classification.… indicates unavailable or non-comparable figures.- indicates non-applicable.
a China revised its methodology to compile travel transactions. As a result, its trade in services statistics were revised downward starting in 2014 on both the credit and the debit side.
Note: Preliminary estimates based on quarterly statistics. Figures for a number of countries and territories have been estimated by the Secretariat.
Source: WTO, UNCTAD and ITC.


![[Arms and Armour Press] German Half-Tracked Vehicles of World War 2](https://img.pdfslide.us/doc/110x75/55302b294a7959d6288b4670/arms-and-armour-press-german-half-tracked-vehicles-of-world-war-2.jpg)