Embed Size (px)
Citation preview
PRESS RELEASE UNIVISION COMMUNICATIONS INC. Page 1 of 18
UNIVISION COMMUNICATIONS INC. ANNOUNCES 2017 THIRD QUARTER RESULTS
THIRD QUARTER 2017 TOTAL REVENUE OF $778.2 MILLION, UP 5.9% THIRD QUARTER 2017 TOTAL CORE REVENUE OF $725.5 MILLION, UP 3.9%
THIRD QUARTER 2017 NET INCOME OF $104.0 MILLION COMPARED TO NET LOSS OF $30.5 MILLION
THIRD QUARTER 2017 ADJUSTED OIBDA OF $339.8 MILLION, UP 6.9%
THIRD QUARTER 2017 ADJUSTED CORE OIBDA OF $322.0 MILLION, UP 13.2%
NEW YORK, NY – November 2, 2017 – Univision Communications Inc. (the “Company”), the leading media company serving Hispanic America, today announced financial results for the third quarter ended September 30, 2017.
• Total revenue for the third quarter 2017 increased 5.9% to $778.2 million compared to $734.8 million for the same prior period. Total core revenue1 for the third quarter 2017 increased 3.9% to $725.5 million compared to $698.5 million for the same prior period. On a pro forma basis2 assuming all 2016 acquisitions occurred on January 1, 2016, total core revenue increased 1.0% to $725.5 million from $718.0 million.
• Net income attributable to Univision Communications Inc. for the third quarter 2017 was $104.0 million compared to net loss attributable to Univision Communications Inc. of $30.5 million for the same prior period. Net loss attributable to Univision Communications Inc. for the third quarter 2016 included a non-cash pretax impairment loss of $199.5 million primarily related to the write down of broadcast licenses and a trade name in the Radio segment.
• Adjusted OIBDA3 for the third quarter 2017 increased 6.9% to $339.8 million compared to $317.9 million for the same prior period. Adjusted Core OIBDA4 increased 13.2% to $322.0 million from $284.5 million. On a pro forma basis, Adjusted Core OIBDA increased 16.4% to $322.0 million from $276.6 million.
• The Company continues to deleverage and has reduced total indebtedness, net of cash and cash equivalents by $506.7 million for the third quarter 2017, and by $721.0 million for the nine months ended September 30, 2017.
“Our financial results for the quarter reflect growth across revenue, net income and Adjusted OIBDA. We continued to reduce our debt and improve our capital structure, highlighted by our $721 million net debt reduction year to date,” said Randy Falco, president and CEO of Univision Communications Inc. “We finished as the #1 Spanish Language Network for the 25th consecutive broadcast season and continue to have the #1 Spanish Language Sports and Cable Networks. We reinforced our position as the home of soccer in the U.S. with the successful Gold Cup tournament and launch of the new Liga MX season. I am also very proud of our response to the recent natural disasters that devastated many of our communities as well as the position that we have staked out on DACA and other issues that are important to the audience that we serve. Our teams have gone to extraordinary lengths to live our mission and serve our audience, and I thank them for all of their continuing efforts.”
1 Total core revenue excludes estimated incremental major soccer advertising, political/advocacy advertising and content licensing revenue in both periods and deferred revenue recognized in 2016 due to the termination of a pre existing contractual relationship associated with support services provided to Fusion Media Networks, LLC (“Fusion”) prior to the acquisition of our former joint venture partner’s interest in Fusion (the “Fusion acquisition”). These items have been excluded to allow for comparability between both periods. 2 The pro forma basis assumes the Fusion acquisition and the acquisition of certain digital media assets and assumed liabilities of the Gawker Media Group, Inc. and related companies (the “Gawker Media acquisition”) occurred on January 1, 2016. The Onion is a component of the Company’s actual financial results effective January 1, 2016. 3 See pages 11-16 for a description of the non-GAAP term Adjusted OIBDA, a reconciliation to net income attributable to Univision Communications Inc. and subsidiaries and limitations on its use. 4 Adjusted Core OIBDA excludes the estimated incremental impact of major soccer advertising, political/advocacy advertising and content licensing revenue in both periods and deferred revenue recognized in 2016 due to the termination of a pre existing contractual relationship associated with support services provided to Fusion prior to the Fusion acquisition. These items have been excluded to allow for comparability between both periods.
PRESS RELEASE UNIVISION COMMUNICATIONS INC. Page 2 of 18
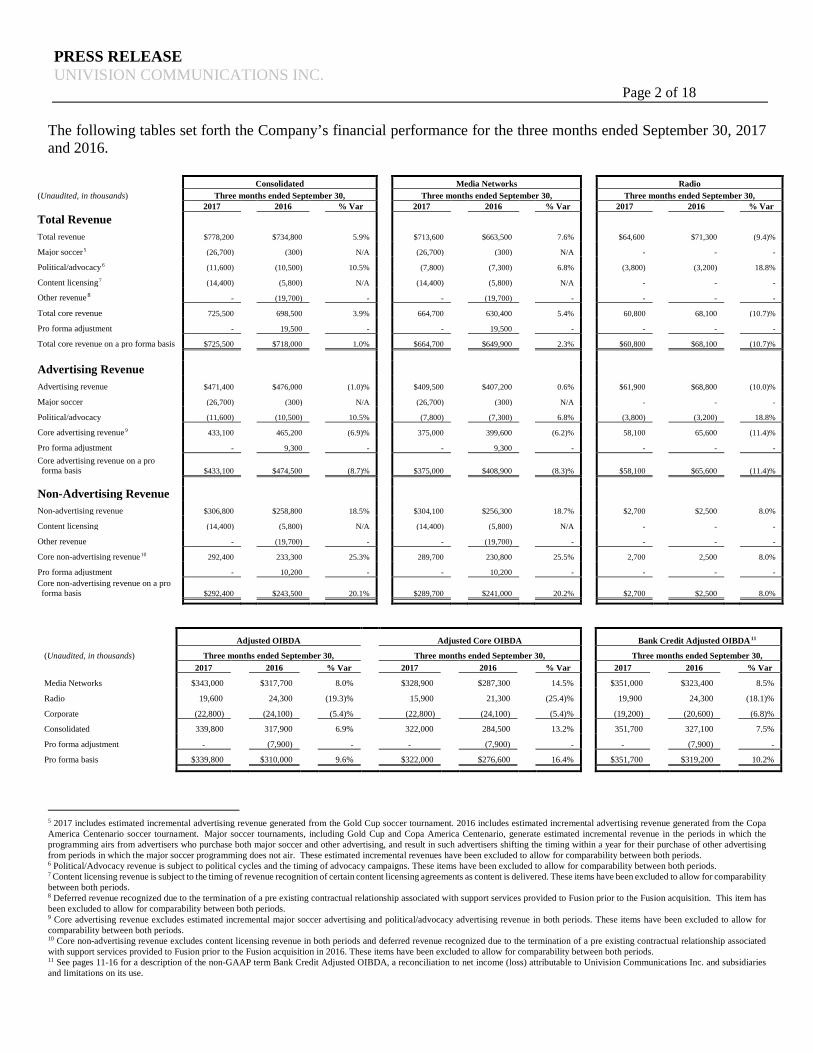
The following tables set forth the Company’s financial performance for the three months ended September 30, 2017 and 2016.
5 2017 includes estimated incremental advertising revenue generated from the Gold Cup soccer tournament. 2016 includes estimated incremental advertising revenue generated from the Copa America Centenario soccer tournament. Major soccer tournaments, including Gold Cup and Copa America Centenario, generate estimated incremental revenue in the periods in which the programming airs from advertisers who purchase both major soccer and other advertising, and result in such advertisers shifting the timing within a year for their purchase of other advertising from periods in which the major soccer programming does not air. These estimated incremental revenues have been excluded to allow for comparability between both periods. 6 Political/Advocacy revenue is subject to political cycles and the timing of advocacy campaigns. These items have been excluded to allow for comparability between both periods. 7 Content licensing revenue is subject to the timing of revenue recognition of certain content licensing agreements as content is delivered. These items have been excluded to allow for comparability between both periods. 8 Deferred revenue recognized due to the termination of a pre existing contractual relationship associated with support services provided to Fusion prior to the Fusion acquisition. This item has been excluded to allow for comparability between both periods. 9 Core advertising revenue excludes estimated incremental major soccer advertising and political/advocacy advertising revenue in both periods. These items have been excluded to allow for comparability between both periods. 10 Core non-advertising revenue excludes content licensing revenue in both periods and deferred revenue recognized due to the termination of a pre existing contractual relationship associated with support services provided to Fusion prior to the Fusion acquisition in 2016. These items have been excluded to allow for comparability between both periods. 11 See pages 11-16 for a description of the non-GAAP term Bank Credit Adjusted OIBDA, a reconciliation to net income (loss) attributable to Univision Communications Inc. and subsidiaries and limitations on its use.
Consolidated Media Networks Radio (Unaudited, in thousands) Three months ended September 30, Three months ended September 30, Three months ended September 30,
2017 2016 % Var 2017 2016 % Var 2017 2016 % Var Total Revenue
Total revenue $778,200 $734,800 5.9% $713,600 $663,500 7.6% $64,600 $71,300 (9.4)%
Major soccer5 (26,700) (300) N/A (26,700) (300) N/A - - -
Political/advocacy6 (11,600) (10,500) 10.5% (7,800) (7,300) 6.8% (3,800) (3,200) 18.8%
Content licensing7 (14,400) (5,800) N/A (14,400) (5,800) N/A - - -
Other revenue 8 - (19,700) - - (19,700) - - - -
Total core revenue 725,500 698,500 3.9% 664,700 630,400 5.4% 60,800 68,100 (10.7)%
Pro forma adjustment - 19,500 - - 19,500 - - - -
Total core revenue on a pro forma basis $725,500 $718,000 1.0% $664,700 $649,900 2.3% $60,800 $68,100 (10.7)%
Advertising Revenue
Advertising revenue $471,400 $476,000 (1.0)% $409,500 $407,200 0.6% $61,900 $68,800 (10.0)%
Major soccer (26,700) (300) N/A (26,700) (300) N/A - - -
Political/advocacy (11,600) (10,500) 10.5% (7,800) (7,300) 6.8% (3,800) (3,200) 18.8%
Core advertising revenue9 433,100 465,200 (6.9)% 375,000 399,600 (6.2)% 58,100 65,600 (11.4)%
Pro forma adjustment - 9,300 - - 9,300 - - - - Core advertising revenue on a pro forma basis $433,100 $474,500 (8.7)% $375,000 $408,900 (8.3)% $58,100 $65,600 (11.4)%
Non-Advertising Revenue
Non-advertising revenue $306,800 $258,800 18.5% $304,100 $256,300 18.7% $2,700 $2,500 8.0%
Content licensing (14,400) (5,800) N/A (14,400) (5,800) N/A - - -
Other revenue - (19,700) - - (19,700) - - - -
Core non-advertising revenue10 292,400 233,300 25.3% 289,700 230,800 25.5% 2,700 2,500 8.0%
Pro forma adjustment - 10,200 - - 10,200 - - - - Core non-advertising revenue on a pro forma basis $292,400 $243,500 20.1% $289,700 $241,000 20.2% $2,700 $2,500 8.0%
Adjusted OIBDA Adjusted Core OIBDA Bank Credit Adjusted OIBDA11
(Unaudited, in thousands) Three months ended September 30, Three months ended September 30, Three months ended September 30, 2017 2016 % Var 2017 2016 % Var 2017 2016 % Var
Media Networks $343,000 $317,700 8.0% $328,900 $287,300 14.5% $351,000 $323,400 8.5%
Radio 19,600 24,300 (19.3)% 15,900 21,300 (25.4)% 19,900 24,300 (18.1)%
Corporate (22,800) (24,100) (5.4)% (22,800) (24,100) (5.4)% (19,200) (20,600) (6.8)%
Consolidated 339,800 317,900 6.9% 322,000 284,500 13.2% 351,700 327,100 7.5%
Pro forma adjustment - (7,900) - - (7,900) - - (7,900) -
Pro forma basis $339,800 $310,000 9.6% $322,000 $276,600 16.4% $351,700 $319,200 10.2%
PRESS RELEASE UNIVISION COMMUNICATIONS INC. Page 3 of 18
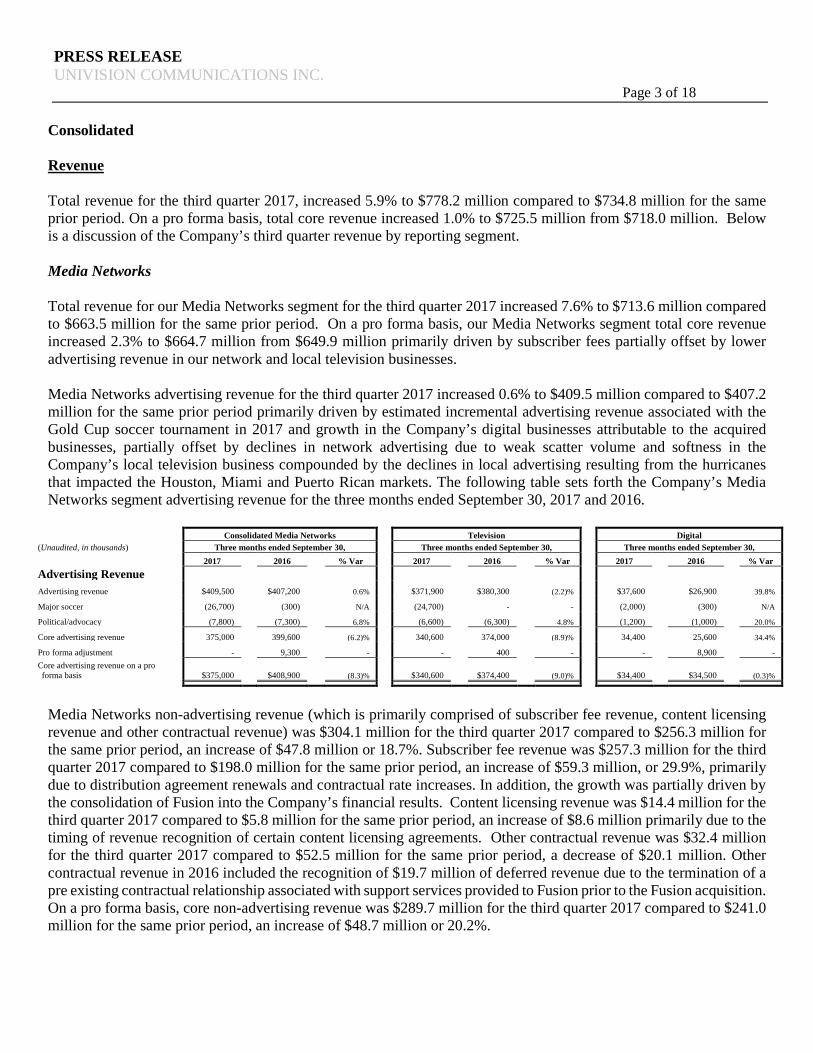
Consolidated Revenue Total revenue for the third quarter 2017, increased 5.9% to $778.2 million compared to $734.8 million for the same prior period. On a pro forma basis, total core revenue increased 1.0% to $725.5 million from $718.0 million. Below is a discussion of the Company’s third quarter revenue by reporting segment. Media Networks Total revenue for our Media Networks segment for the third quarter 2017 increased 7.6% to $713.6 million compared to $663.5 million for the same prior period. On a pro forma basis, our Media Networks segment total core revenue increased 2.3% to $664.7 million from $649.9 million primarily driven by subscriber fees partially offset by lower advertising revenue in our network and local television businesses. Media Networks advertising revenue for the third quarter 2017 increased 0.6% to $409.5 million compared to $407.2 million for the same prior period primarily driven by estimated incremental advertising revenue associated with the Gold Cup soccer tournament in 2017 and growth in the Company’s digital businesses attributable to the acquired businesses, partially offset by declines in network advertising due to weak scatter volume and softness in the Company’s local television business compounded by the declines in local advertising resulting from the hurricanes that impacted the Houston, Miami and Puerto Rican markets. The following table sets forth the Company’s Media Networks segment advertising revenue for the three months ended September 30, 2017 and 2016.
Media Networks non-advertising revenue (which is primarily comprised of subscriber fee revenue, content licensing revenue and other contractual revenue) was $304.1 million for the third quarter 2017 compared to $256.3 million for the same prior period, an increase of $47.8 million or 18.7%. Subscriber fee revenue was $257.3 million for the third quarter 2017 compared to $198.0 million for the same prior period, an increase of $59.3 million, or 29.9%, primarily due to distribution agreement renewals and contractual rate increases. In addition, the growth was partially driven by the consolidation of Fusion into the Company’s financial results. Content licensing revenue was $14.4 million for the third quarter 2017 compared to $5.8 million for the same prior period, an increase of $8.6 million primarily due to the timing of revenue recognition of certain content licensing agreements. Other contractual revenue was $32.4 million for the third quarter 2017 compared to $52.5 million for the same prior period, a decrease of $20.1 million. Other contractual revenue in 2016 included the recognition of $19.7 million of deferred revenue due to the termination of a pre existing contractual relationship associated with support services provided to Fusion prior to the Fusion acquisition. On a pro forma basis, core non-advertising revenue was $289.7 million for the third quarter 2017 compared to $241.0 million for the same prior period, an increase of $48.7 million or 20.2%.
Consolidated Media Networks Television Digital (Unaudited, in thousands) Three months ended September 30, Three months ended September 30, Three months ended September 30,
2017 2016 % Var 2017 2016 % Var 2017 2016 % Var Advertising Revenue
Advertising revenue $409,500 $407,200 0.6% $371,900 $380,300 (2.2)% $37,600 $26,900 39.8%
Major soccer (26,700) (300) N/A (24,700) - - (2,000) (300) N/A
Political/advocacy (7,800) (7,300) 6.8% (6,600) (6,300) 4.8% (1,200) (1,000) 20.0%
Core advertising revenue 375,000 399,600 (6.2)% 340,600 374,000 (8.9)% 34,400 25,600 34.4%
Pro forma adjustment - 9,300 - - 400 - - 8,900 - Core advertising revenue on a pro forma basis $375,000 $408,900 (8.3)% $340,600 $374,400 (9.0)% $34,400 $34,500 (0.3)%
PRESS RELEASE UNIVISION COMMUNICATIONS INC. Page 4 of 18
Radio Total revenue for our Radio segment for the third quarter 2017 decreased 9.4% to $64.6 million compared to $71.3 million for the same prior period. Total core revenue for our Radio segment decreased 10.7% to $60.8 million from $68.1 million. Advertising revenue for the Radio segment for the third quarter 2017 decreased 10.0% to $61.9 million from $68.8 million for the same prior period. Core advertising revenue for our Radio segment decreased 11.4% to $58.1 million from $65.6 million, driven by declines in national, network and local advertising revenue and compounded by the declines in local advertising resulting from the hurricanes that impacted the Houston, Miami and Puerto Rican markets.
Non-advertising revenue for the Radio segment for the third quarter 2017 (which was primarily comprised of other contractual revenue) increased to $2.7 million from $2.5 million for the same prior period. Expenses Below is a discussion of the Company’s third quarter expenses on a consolidated basis. Direct operating expenses related to programming, excluding variable program license fees, for the third quarter 2017 increased $10.5 million or 6.9% to $162.8 million from $152.3 million for the same prior period. The increase was primarily due to costs associated with the Gold Cup soccer tournament of $27.4 million in 2017 and the expenses of the acquired businesses of $4.5 million, partially offset by a decrease in entertainment and news programming of $21.0 million driven by the mix of acquired and produced programming in our entertainment division and news costs associated with the political cycle last year and a decrease in the cost of sports programming of $0.4 million. Direct operating expenses related to programming, excluding variable program license fees, on a pro forma basis, decreased $8.0 million or 4.7%. Direct operating expenses related to the variable program license fees for the third quarter 2017 increased 10.8% to $76.7 million from $69.2 million for the same prior period, primarily as a result of an increase in revenue. Other direct operating expenses for the third quarter 2017 increased 14.0% to $24.5 million from $21.5 million for the same prior period. The increase in other direct operating expenses was primarily due to increases in costs associated with the acquired businesses of $2.4 million. Other direct operating expenses, on a pro forma basis, increased $1.4 million or 6.1%. Selling, general and administrative expenses for the third quarter 2017 increased 2.1% to $183.5 million from $179.7 million for the same prior period. The increase was primarily due to costs associated with the acquired businesses of $7.1 million, partially offset by lower employee costs. Selling, general and administrative expenses, on a pro forma basis, decreased $3.5 million or 1.9%.
PRESS RELEASE UNIVISION COMMUNICATIONS INC. Page 5 of 18
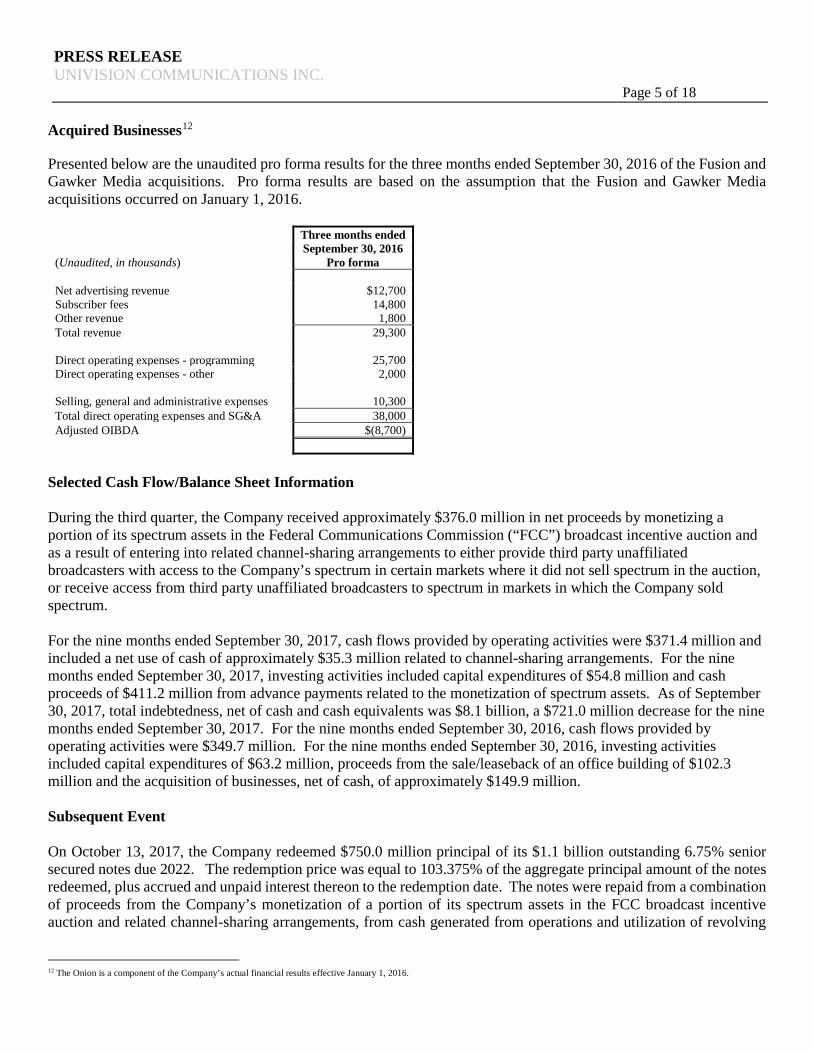
Acquired Businesses12
Presented below are the unaudited pro forma results for the three months ended September 30, 2016 of the Fusion and Gawker Media acquisitions. Pro forma results are based on the assumption that the Fusion and Gawker Media acquisitions occurred on January 1, 2016. Three months ended September 30, 2016 (Unaudited, in thousands) Pro forma Net advertising revenue $12,700 Subscriber fees 14,800 Other revenue 1,800 Total revenue 29,300 Direct operating expenses - programming 25,700 Direct operating expenses - other 2,000 Selling, general and administrative expenses 10,300 Total direct operating expenses and SG&A 38,000 Adjusted OIBDA $(8,700)
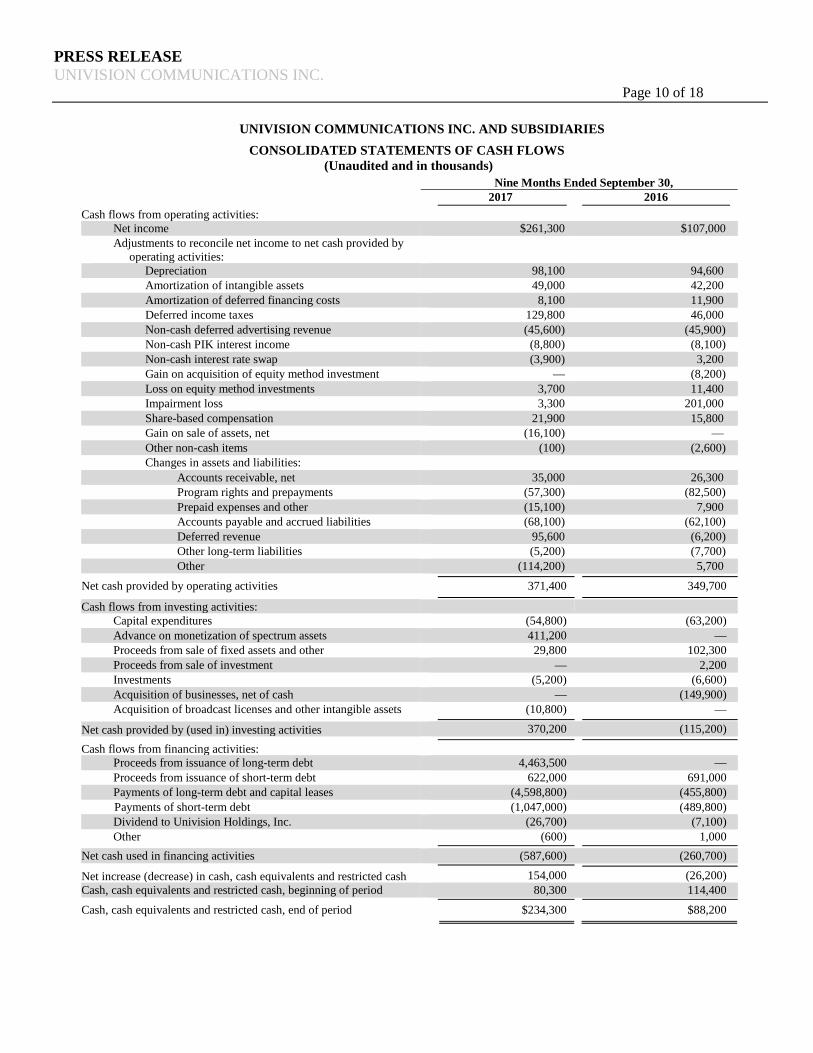
Selected Cash Flow/Balance Sheet Information During the third quarter, the Company received approximately $376.0 million in net proceeds by monetizing a portion of its spectrum assets in the Federal Communications Commission (“FCC”) broadcast incentive auction and as a result of entering into related channel-sharing arrangements to either provide third party unaffiliated broadcasters with access to the Company’s spectrum in certain markets where it did not sell spectrum in the auction, or receive access from third party unaffiliated broadcasters to spectrum in markets in which the Company sold spectrum. For the nine months ended September 30, 2017, cash flows provided by operating activities were $371.4 million and included a net use of cash of approximately $35.3 million related to channel-sharing arrangements. For the nine months ended September 30, 2017, investing activities included capital expenditures of $54.8 million and cash proceeds of $411.2 million from advance payments related to the monetization of spectrum assets. As of September 30, 2017, total indebtedness, net of cash and cash equivalents was $8.1 billion, a $721.0 million decrease for the nine months ended September 30, 2017. For the nine months ended September 30, 2016, cash flows provided by operating activities were $349.7 million. For the nine months ended September 30, 2016, investing activities included capital expenditures of $63.2 million, proceeds from the sale/leaseback of an office building of $102.3 million and the acquisition of businesses, net of cash, of approximately $149.9 million. Subsequent Event On October 13, 2017, the Company redeemed $750.0 million principal of its $1.1 billion outstanding 6.75% senior secured notes due 2022. The redemption price was equal to 103.375% of the aggregate principal amount of the notes redeemed, plus accrued and unpaid interest thereon to the redemption date. The notes were repaid from a combination of proceeds from the Company’s monetization of a portion of its spectrum assets in the FCC broadcast incentive auction and related channel-sharing arrangements, from cash generated from operations and utilization of revolving
12 The Onion is a component of the Company’s actual financial results effective January 1, 2016.
PRESS RELEASE UNIVISION COMMUNICATIONS INC. Page 6 of 18
credit facilities. The principal balance of the remaining 6.75% senior secured notes due 2022 is approximately $357.8 million. CONFERENCE CALL Univision will conduct a conference call to discuss its third quarter financial results at 11:00 a.m. ET/8:00 a.m. PT on Thursday, November 2, 2017. To participate in the conference call, please dial (866) 547-1509 (within U.S.) or (920) 663-6208 (outside U.S.) fifteen minutes prior to the start of the call and provide the following pass code: 72405601. A playback of the conference call will be available beginning at 2:00 p.m. ET, Thursday, November 2, 2017, through Thursday, November 16, 2017. To access the playback, please dial (800) 585-8367 (within U.S.) or (404) 537-3406 (outside U.S.) and enter reservation number 72405601. About Univision Communications Inc. Univision Communications Inc. (UCI) is the leading media company serving Hispanic America. The Company, a leading content creator in the U.S., includes Univision Network, one of the leading networks in the U.S. regardless of language and the most-watched Spanish-language broadcast television network in the country available in approximately 90% of U.S. Hispanic television households; UniMás, a leading Spanish-language broadcast television network available in approximately 85% of U.S. Hispanic television households; Univision Cable Networks, including Galavisión, the most-watched U.S. Spanish-language entertainment cable network, as well as UDN (Univision Deportes Network), the most-watched U.S. Spanish-language sports cable network, Univision tlnovelas, a 24-hour Spanish-language cable network dedicated to telenovelas, ForoTV, a 24-hour Spanish-language cable network dedicated to international news, and an additional suite of cable offerings - De Película, De Película Clásico, Bandamax, Ritmoson and Telehit; Univision Local Media, which owns and/or operates 60 television stations and 59 radio stations in major U.S. Hispanic markets and Puerto Rico; and Univision Now, a direct-to-consumer, on demand and live streaming subscription service. The Company also includes the Fusion Media Group (FMG), a division that serves young, diverse audiences. FMG includes two cable networks: news and lifestyle English language network FUSION TV and UCI’s interest in El Rey Network, a general entertainment English language cable network; Univision.com, the most-visited Spanish-language website among U.S. Hispanics; Uforia, a music application featuring multimedia music content; as well as a collection of leading digital brands that span a range of categories: technology (Gizmodo), sports (Deadspin), music (TrackRecord), lifestyle (Lifehacker), modern women’s interests (Jezebel), news and politics (Splinter), African American news and culture (The Root), gaming (Kotaku), and car culture (Jalopnik). FMG also includes the Company’s interest in comedy and news satire brands The Onion, Clickhole and The A.V. Club. Headquartered in New York City, UCI has content creation facilities and sales offices in major cities throughout the United States. For more information, please visit corporate.univision.com. Investor Contacts: Media Contact: Adam Shippee 646-560-4992 Bobby Amirshahi 646-560-4902
PRESS RELEASE UNIVISION COMMUNICATIONS INC. Page 7 of 18
Safe Harbor Certain statements contained within this press release constitute “forward-looking statements” within the meaning of the Private Securities Litigation Reform Act of 1995. In some cases you can identify forward-looking statements by terms such as “anticipate,” “plan,” “may,” “intend,” “will,” “expect,” “believe,” “optimistic” or the negative of these terms, and similar expressions intended to identify forward-looking statements. These forward-looking statements reflect the Company’s current views with respect to future events and are based on assumptions and are subject to risks and uncertainties. Also, these forward-looking statements present our estimates and assumptions only as of the date of this press release. The Company undertakes no obligation to modify or revise any forward-looking statements to reflect events or circumstances occurring after the date that the forward looking statement was made. Factors that could cause actual results to differ materially from those expressed or implied by the forward-looking statements include: cancellations, reductions or postponements of advertising or other changes in advertising practices among the Company’s advertisers; any impact of adverse economic conditions on the Company’s industry, business and financial condition, including reduced advertising revenue; changes in the size of the U.S. Hispanic population, including the impact of federal and state immigration legislation and policies on both the U.S. Hispanic population and persons emigrating from Latin America; lack of audience acceptance of the Company’s content; varying popularity for programming, which the Company cannot predict at the time the Company may incur related costs; the failure to renew existing carriage agreements or reach new carriage agreements with multichannel video programming distributors (“MVPD”) on acceptable terms; consolidation in the cable or satellite MVPD industry; the impact of increased competition from new technologies; competitive pressures from other broadcasters and other entertainment and news media; damage to the Company’s brands, particularly the Univision brand, or reputation; fluctuations in the Company’s quarterly results, making it difficult to rely on period-to-period comparisons; failure to retain the rights to sports programming to attract advertising revenue; the loss of the Company’s ability to rely on Grupo Televisa S.A.B. and its affiliates (“Televisa”) for a significant amount of its network programming; an increase in royalty payments pursuant to the program license agreement between the Company and Televisa; the failure of the Company’s new or existing businesses to produce projected revenues or cash flows; failure to monetize the Company’s content on its digital platforms; the Company’s success in acquiring, investing in and integrating complementary businesses; failure to further monetize the Company’s spectrum assets; the failure or destruction of satellites or transmitter facilities that the Company depends on to distribute its programming; disruption of the Company’s business due to network and information systems-related events, such as computer hackings, viruses, or other destructive or disruptive software or activities; inability to realize the full value of the Company’s intangible assets; failure to utilize the Company’s net operating loss carryforwards; the loss of key executives; possible strikes or other union job actions; piracy of the Company’s programming and other content; environmental, health and safety laws and regulations; Federal Communications Commission (“FCC”) media ownership rules; compliance with, and/or changes in, the rules and regulations of the FCC; new laws or regulations concerning retransmission consent or “must carry” rights; increased enforcement or enhancement of FCC indecency and other programming content rules; the impact of legislation on the reallocation of broadcast spectrum which may result in additional costs and affect the Company’s ability to provide competitive services; net losses in the future and for an extended period of time; the Company’s substantial indebtedness; failure to service the Company’s debt or inability to comply with the agreements contained in the Company’s senior secured credit facilities and indentures, including any financial covenants and ratios; the Company’s dependency on lenders to execute its business strategy and its inability to secure financing on suitable terms or at all; volatility and weakness in the capital markets; and risks relating to the Company’s ownership. Actual results may differ materially due to these risks and uncertainties. The Company assumes no obligation to update forward-looking information contained in this press release.
PRESS RELEASE UNIVISION COMMUNICATIONS INC. Page 8 of 18
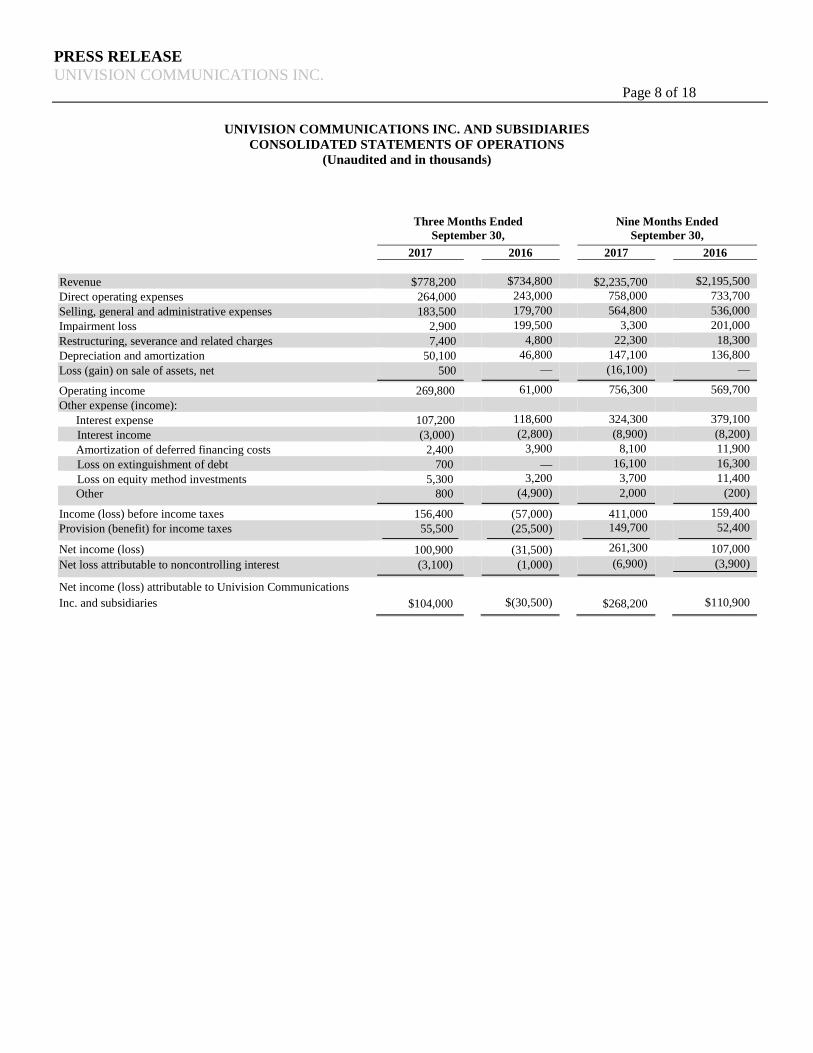
UNIVISION COMMUNICATIONS INC. AND SUBSIDIARIES CONSOLIDATED STATEMENTS OF OPERATIONS
(Unaudited and in thousands)
Three Months Ended
September 30, Nine Months Ended
September 30, 2017 2016 2017 2016 Revenue $778,200 $734,800 $2,235,700 $2,195,500 Direct operating expenses 264,000 243,000 758,000 733,700 Selling, general and administrative expenses 183,500 179,700 564,800 536,000 Impairment loss 2,900 199,500 3,300 201,000 Restructuring, severance and related charges 7,400 4,800 22,300 18,300 Depreciation and amortization 50,100 46,800 147,100 136,800 Loss (gain) on sale of assets, net 500 — (16,100) —
Operating income 269,800 61,000 756,300 569,700 Other expense (income): Interest expense 107,200 118,600 324,300 379,100 Interest income (3,000) (2,800) (8,900) (8,200) Amortization of deferred financing costs 2,400 3,900 8,100 11,900
Loss on extinguishment of debt 700 — 16,100 16,300 Loss on equity method investments 5,300 3,200 3,700 11,400
Other 800 (4,900) 2,000 (200) Income (loss) before income taxes 156,400 (57,000) 411,000 159,400 Provision (benefit) for income taxes 55,500 (25,500) 149,700 52,400
Net income (loss) 100,900 (31,500) 261,300 107,000 Net loss attributable to noncontrolling interest (3,100) (1,000) (6,900) (3,900)
Net income (loss) attributable to Univision Communications Inc. and subsidiaries $104,000
$(30,500)
$268,200
$110,900
PRESS RELEASE UNIVISION COMMUNICATIONS INC. Page 9 of 18
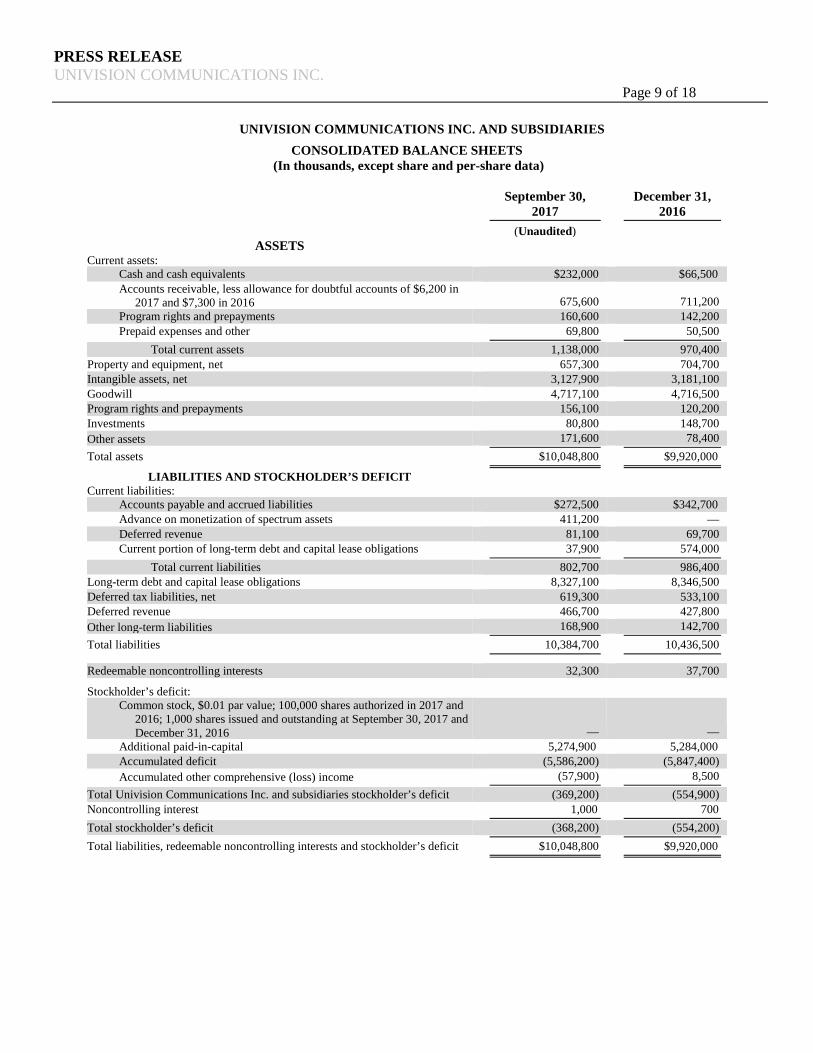
UNIVISION COMMUNICATIONS INC. AND SUBSIDIARIES CONSOLIDATED BALANCE SHEETS
(In thousands, except share and per-share data)
September 30,
2017 December 31,
2016 (Unaudited)
ASSETS
Current assets: Cash and cash equivalents $232,000 $66,500 Accounts receivable, less allowance for doubtful accounts of $6,200 in
2017 and $7,300 in 2016 675,600 711,200 Program rights and prepayments 160,600 142,200 Prepaid expenses and other 69,800 50,500
Total current assets 1,138,000 970,400 Property and equipment, net 657,300 704,700 Intangible assets, net 3,127,900 3,181,100 Goodwill 4,717,100 4,716,500 Program rights and prepayments 156,100 120,200 Investments 80,800 148,700 Other assets 171,600 78,400 Total assets $10,048,800 $9,920,000
LIABILITIES AND STOCKHOLDER’S DEFICIT
Current liabilities: Accounts payable and accrued liabilities $272,500 $342,700 Advance on monetization of spectrum assets 411,200 — Deferred revenue 81,100 69,700 Current portion of long-term debt and capital lease obligations 37,900 574,000
Total current liabilities 802,700 986,400 Long-term debt and capital lease obligations 8,327,100 8,346,500 Deferred tax liabilities, net 619,300 533,100 Deferred revenue 466,700 427,800 Other long-term liabilities 168,900 142,700 Total liabilities 10,384,700 10,436,500
Redeemable noncontrolling interests 32,300 37,700
Stockholder’s deficit:
Common stock, $0.01 par value; 100,000 shares authorized in 2017 and 2016; 1,000 shares issued and outstanding at September 30, 2017 and December 31, 2016 — —
Additional paid-in-capital 5,274,900 5,284,000 Accumulated deficit (5,586,200) (5,847,400) Accumulated other comprehensive (loss) income (57,900) 8,500
Total Univision Communications Inc. and subsidiaries stockholder’s deficit (369,200) (554,900) Noncontrolling interest 1,000 700 Total stockholder’s deficit (368,200) (554,200) Total liabilities, redeemable noncontrolling interests and stockholder’s deficit $10,048,800 $9,920,000
PRESS RELEASE UNIVISION COMMUNICATIONS INC. Page 10 of 18
UNIVISION COMMUNICATIONS INC. AND SUBSIDIARIES CONSOLIDATED STATEMENTS OF CASH FLOWS
(Unaudited and in thousands)
Nine Months Ended September 30,
2017 2016 Cash flows from operating activities:
Net income $261,300 $107,000 Adjustments to reconcile net income to net cash provided by
operating activities: Depreciation 98,100 94,600
Amortization of intangible assets 49,000 42,200 Amortization of deferred financing costs 8,100 11,900 Deferred income taxes 129,800 46,000 Non-cash deferred advertising revenue (45,600) (45,900) Non-cash PIK interest income (8,800) (8,100) Non-cash interest rate swap (3,900) 3,200 Gain on acquisition of equity method investment — (8,200) Loss on equity method investments 3,700 11,400 Impairment loss 3,300 201,000 Share-based compensation 21,900 15,800 Gain on sale of assets, net (16,100) — Other non-cash items (100) (2,600) Changes in assets and liabilities:
Accounts receivable, net 35,000 26,300 Program rights and prepayments (57,300) (82,500) Prepaid expenses and other (15,100) 7,900 Accounts payable and accrued liabilities (68,100) (62,100) Deferred revenue 95,600 (6,200) Other long-term liabilities (5,200) (7,700) Other (114,200) 5,700
Net cash provided by operating activities 371,400 349,700 Cash flows from investing activities:
Capital expenditures (54,800) (63,200) Advance on monetization of spectrum assets 411,200 — Proceeds from sale of fixed assets and other 29,800 102,300 Proceeds from sale of investment — 2,200 Investments (5,200) (6,600) Acquisition of businesses, net of cash — (149,900) Acquisition of broadcast licenses and other intangible assets (10,800) —
Net cash provided by (used in) investing activities 370,200 (115,200) Cash flows from financing activities:
Proceeds from issuance of long-term debt 4,463,500 — Proceeds from issuance of short-term debt 622,000 691,000 Payments of long-term debt and capital leases (4,598,800) (455,800) Payments of short-term debt (1,047,000) (489,800) Dividend to Univision Holdings, Inc. (26,700) (7,100) Other (600) 1,000
Net cash used in financing activities (587,600) (260,700) Net increase (decrease) in cash, cash equivalents and restricted cash 154,000 (26,200) Cash, cash equivalents and restricted cash, beginning of period 80,300 114,400 Cash, cash equivalents and restricted cash, end of period $234,300 $88,200
PRESS RELEASE UNIVISION COMMUNICATIONS INC. Page 11 of 18
RECONCILIATION OF NET INCOME (LOSS) ATTRIBUTABLE TO UNIVISION COMMUNICATIONS INC. Management of the Company evaluates operating performance for planning and forecasting future business operations by considering Adjusted OIBDA (as described below), Adjusted Core OIBDA (as described below) and Bank Credit Adjusted OIBDA (as described below). Management also uses Bank Credit Adjusted OIBDA to assess the Company’s ability to satisfy certain financial covenants contained in the Company’s senior secured credit facilities and the indentures governing its senior notes. Adjusted OIBDA, Adjusted Core OIBDA and Bank Credit Adjusted OIBDA eliminate the effects of certain items that the Company does not consider indicative of its core operating performance. Adjusted OIBDA and Adjusted Core OIBDA represent operating income before depreciation, amortization and certain additional adjustments to operating income. Adjusted Core OIBDA also excludes the impact of certain items that have been excluded to allow for comparability between the periods because such items do not occur in every period. In calculating Adjusted OIBDA and Adjusted Core OIBDA the Company’s operating income (loss) is adjusted for share-based compensation and other non-cash charges, restructuring and severance charges, as well as other non-operating related items. Bank Credit Adjusted OIBDA represents Adjusted OIBDA with certain additional adjustments permitted under the Company’s senior secured credit facilities and its indentures governing the senior notes that include add-backs and/or deductions, as applicable, for specified business optimization expenses, income (loss) from equity investments in entities, the results of which are consolidated in the Company’s operating income (loss), that are not treated as subsidiaries, and from subsidiaries designated as unrestricted subsidiaries, in each case under such credit facilities and indentures, and certain other expenses. Bank Credit Adjusted OIBDA is further adjusted for such purposes to give effect to the redesignation of unrestricted subsidiaries as restricted subsidiaries for the 12 month period then ended upon such redesignation. Adjusted OIBDA, Adjusted Core OIBDA and Bank Credit Adjusted OIBDA are not, and should not be used as, indicators of or alternatives to operating income or net income (loss) as reflected in the consolidated financial statements. They are not measures of financial performance under GAAP and they should not be considered in isolation or as a substitute for measures of performance prepared in accordance with GAAP. Since the definition of Adjusted OIBDA, Adjusted Core OIBDA and Bank Credit Adjusted OIBDA may vary among companies and industries, neither should be used as a measure of performance among companies. The Company is providing a reconciliation of the non-GAAP terms Adjusted OIBDA, Adjusted Core OIBDA and Bank Credit Adjusted OIBDA to net income (loss) attributable to Univision Communications Inc. and subsidiaries, which is the most directly comparable GAAP financial measure.
PRESS RELEASE UNIVISION COMMUNICATIONS INC. Page 12 of 18
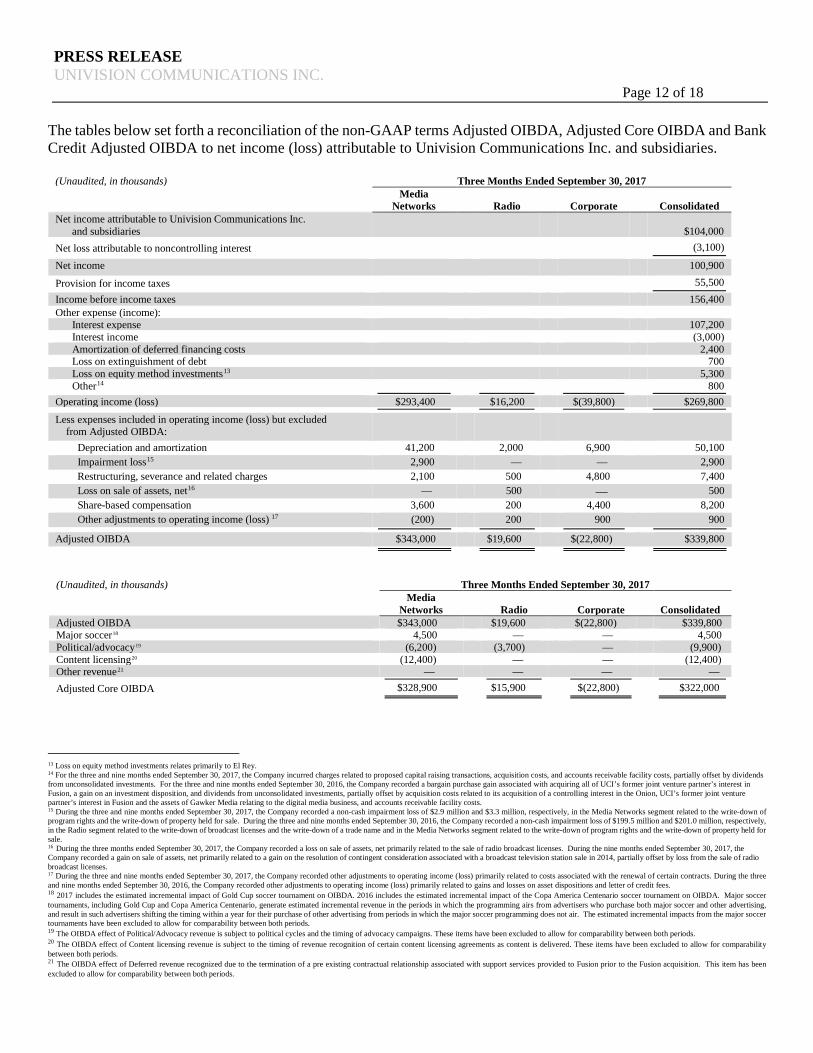
The tables below set forth a reconciliation of the non-GAAP terms Adjusted OIBDA, Adjusted Core OIBDA and Bank Credit Adjusted OIBDA to net income (loss) attributable to Univision Communications Inc. and subsidiaries.
(Unaudited, in thousands) Three Months Ended September 30, 2017 Media
Networks
Radio Corporate Consolidated Net income attributable to Univision Communications Inc.
and subsidiaries
$104,000 Net loss attributable to noncontrolling interest (3,100) Net income 100,900
Provision for income taxes 55,500 Income before income taxes 156,400 Other expense (income):
Interest expense 107,200 Interest income
(3,000)
Amortization of deferred financing costs 2,400 Loss on extinguishment of debt 700 Loss on equity method investments13 5,300 Other14 800
Operating income (loss) $293,400 $16,200 $(39,800) $269,800 Less expenses included in operating income (loss) but excluded
from Adjusted OIBDA:
Depreciation and amortization 41,200 2,000 6,900 50,100 Impairment loss15 2,900 — — 2,900 Restructuring, severance and related charges 2,100 500 4,800 7,400 Loss on sale of assets, net16 — 500 — 500 Share-based compensation 3,600 200 4,400 8,200 Other adjustments to operating income (loss) 17 (200) 200 900 900
Adjusted OIBDA $343,000 $19,600 $(22,800) $339,800
(Unaudited, in thousands) Three Months Ended September 30, 2017
Media
Networks Radio Corporate Consolidated Adjusted OIBDA $343,000 $19,600 $(22,800) $339,800 Major soccer18 4,500 — — 4,500 Political/advocacy19 (6,200) (3,700) — (9,900) Content licensing20 (12,400) — — (12,400) Other revenue21 — — — — Adjusted Core OIBDA $328,900 $15,900 $(22,800) $322,000
13 Loss on equity method investments relates primarily to El Rey. 14 For the three and nine months ended September 30, 2017, the Company incurred charges related to proposed capital raising transactions, acquisition costs, and accounts receivable facility costs, partially offset by dividends from unconsolidated investments. For the three and nine months ended September 30, 2016, the Company recorded a bargain purchase gain associated with acquiring all of UCI’s former joint venture partner’s interest in Fusion, a gain on an investment disposition, and dividends from unconsolidated investments, partially offset by acquisition costs related to its acquisition of a controlling interest in the Onion, UCI’s former joint venture partner’s interest in Fusion and the assets of Gawker Media relating to the digital media business, and accounts receivable facility costs. 15 During the three and nine months ended September 30, 2017, the Company recorded a non-cash impairment loss of $2.9 million and $3.3 million, respectively, in the Media Networks segment related to the write-down of program rights and the write-down of property held for sale. During the three and nine months ended September 30, 2016, the Company recorded a non-cash impairment loss of $199.5 million and $201.0 million, respectively, in the Radio segment related to the write-down of broadcast licenses and the write-down of a trade name and in the Media Networks segment related to the write-down of program rights and the write-down of property held for sale. 16 During the three months ended September 30, 2017, the Company recorded a loss on sale of assets, net primarily related to the sale of radio broadcast licenses. During the nine months ended September 30, 2017, the Company recorded a gain on sale of assets, net primarily related to a gain on the resolution of contingent consideration associated with a broadcast television station sale in 2014, partially offset by loss from the sale of radio broadcast licenses. 17 During the three and nine months ended September 30, 2017, the Company recorded other adjustments to operating income (loss) primarily related to costs associated with the renewal of certain contracts. During the three and nine months ended September 30, 2016, the Company recorded other adjustments to operating income (loss) primarily related to gains and losses on asset dispositions and letter of credit fees. 18 2017 includes the estimated incremental impact of Gold Cup soccer tournament on OIBDA. 2016 includes the estimated incremental impact of the Copa America Centenario soccer tournament on OIBDA. Major soccer tournaments, including Gold Cup and Copa America Centenario, generate estimated incremental revenue in the periods in which the programming airs from advertisers who purchase both major soccer and other advertising, and result in such advertisers shifting the timing within a year for their purchase of other advertising from periods in which the major soccer programming does not air. The estimated incremental impacts from the major soccer tournaments have been excluded to allow for comparability between both periods. 19 The OIBDA effect of Political/Advocacy revenue is subject to political cycles and the timing of advocacy campaigns. These items have been excluded to allow for comparability between both periods. 20 The OIBDA effect of Content licensing revenue is subject to the timing of revenue recognition of certain content licensing agreements as content is delivered. These items have been excluded to allow for comparability between both periods. 21 The OIBDA effect of Deferred revenue recognized due to the termination of a pre existing contractual relationship associated with support services provided to Fusion prior to the Fusion acquisition. This item has been excluded to allow for comparability between both periods.
PRESS RELEASE UNIVISION COMMUNICATIONS INC. Page 13 of 18
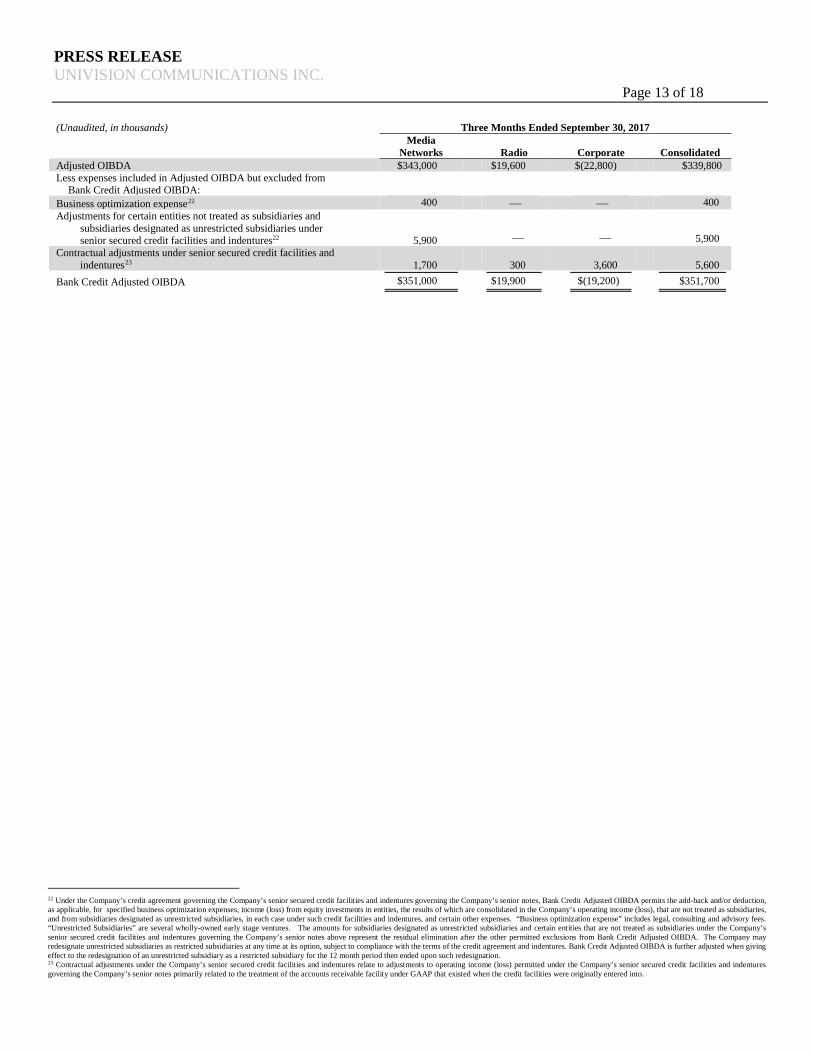
(Unaudited, in thousands) Three Months Ended September 30, 2017
Media
Networks Radio Corporate Consolidated Adjusted OIBDA $343,000 $19,600 $(22,800) $339,800 Less expenses included in Adjusted OIBDA but excluded from
Bank Credit Adjusted OIBDA:
Business optimization expense22 400 — — 400 Adjustments for certain entities not treated as subsidiaries and
subsidiaries designated as unrestricted subsidiaries under senior secured credit facilities and indentures22 5,900 — — 5,900
Contractual adjustments under senior secured credit facilities and indentures23 1,700 300 3,600 5,600
Bank Credit Adjusted OIBDA $351,000 $19,900 $(19,200) $351,700
22 Under the Company’s credit agreement governing the Company’s senior secured credit facilities and indentures governing the Company’s senior notes, Bank Credit Adjusted OIBDA permits the add-back and/or deduction, as applicable, for specified business optimization expenses, income (loss) from equity investments in entities, the results of which are consolidated in the Company’s operating income (loss), that are not treated as subsidiaries, and from subsidiaries designated as unrestricted subsidiaries, in each case under such credit facilities and indentures, and certain other expenses. “Business optimization expense” includes legal, consulting and advisory fees. “Unrestricted Subsidiaries” are several wholly-owned early stage ventures. The amounts for subsidiaries designated as unrestricted subsidiaries and certain entities that are not treated as subsidiaries under the Company’s senior secured credit facilities and indentures governing the Company’s senior notes above represent the residual elimination after the other permitted exclusions from Bank Credit Adjusted OIBDA. The Company may redesignate unrestricted subsidiaries as restricted subsidiaries at any time at its option, subject to compliance with the terms of the credit agreement and indentures. Bank Credit Adjusted OIBDA is further adjusted when giving effect to the redesignation of an unrestricted subsidiary as a restricted subsidiary for the 12 month period then ended upon such redesignation. 23 Contractual adjustments under the Company’s senior secured credit facilities and indentures relate to adjustments to operating income (loss) permitted under the Company’s senior secured credit facilities and indentures governing the Company’s senior notes primarily related to the treatment of the accounts receivable facility under GAAP that existed when the credit facilities were originally entered into.
PRESS RELEASE UNIVISION COMMUNICATIONS INC. Page 14 of 18
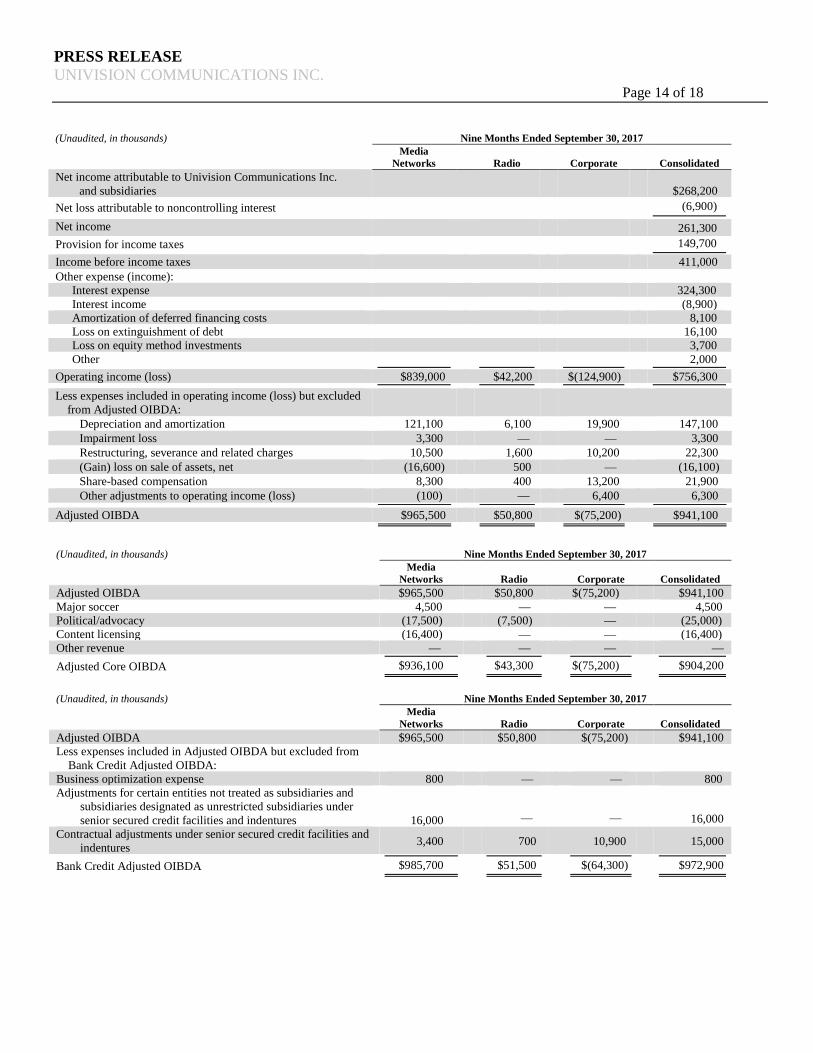
(Unaudited, in thousands) Nine Months Ended September 30, 2017
Media Networks
Radio Corporate Consolidated
Net income attributable to Univision Communications Inc. and subsidiaries
$268,200
Net loss attributable to noncontrolling interest (6,900) Net income 261,300 Provision for income taxes 149,700 Income before income taxes 411,000 Other expense (income):
Interest expense 324,300 Interest income
(8,900)
Amortization of deferred financing costs 8,100 Loss on extinguishment of debt 16,100 Loss on equity method investments 3,700 Other 2,000
Operating income (loss) $839,000 $42,200 $(124,900) $756,300 Less expenses included in operating income (loss) but excluded
from Adjusted OIBDA:
Depreciation and amortization 121,100 6,100 19,900 147,100 Impairment loss 3,300 — — 3,300 Restructuring, severance and related charges 10,500 1,600 10,200 22,300 (Gain) loss on sale of assets, net (16,600) 500 — (16,100) Share-based compensation 8,300 400 13,200 21,900 Other adjustments to operating income (loss) (100) — 6,400 6,300
Adjusted OIBDA $965,500 $50,800 $(75,200) $941,100
(Unaudited, in thousands) Nine Months Ended September 30, 2017
Media
Networks Radio Corporate Consolidated Adjusted OIBDA $965,500 $50,800 $(75,200) $941,100 Major soccer 4,500 — — 4,500 Political/advocacy (17,500) (7,500) — (25,000) Content licensing (16,400) — — (16,400) Other revenue — — — — Adjusted Core OIBDA $936,100 $43,300 $(75,200) $904,200
(Unaudited, in thousands) Nine Months Ended September 30, 2017
Media
Networks Radio Corporate Consolidated Adjusted OIBDA $965,500 $50,800 $(75,200) $941,100 Less expenses included in Adjusted OIBDA but excluded from
Bank Credit Adjusted OIBDA:
Business optimization expense 800 — — 800 Adjustments for certain entities not treated as subsidiaries and
subsidiaries designated as unrestricted subsidiaries under senior secured credit facilities and indentures 16,000 — — 16,000
Contractual adjustments under senior secured credit facilities and indentures 3,400 700 10,900 15,000
Bank Credit Adjusted OIBDA $985,700 $51,500 $(64,300) $972,900
PRESS RELEASE UNIVISION COMMUNICATIONS INC. Page 15 of 18
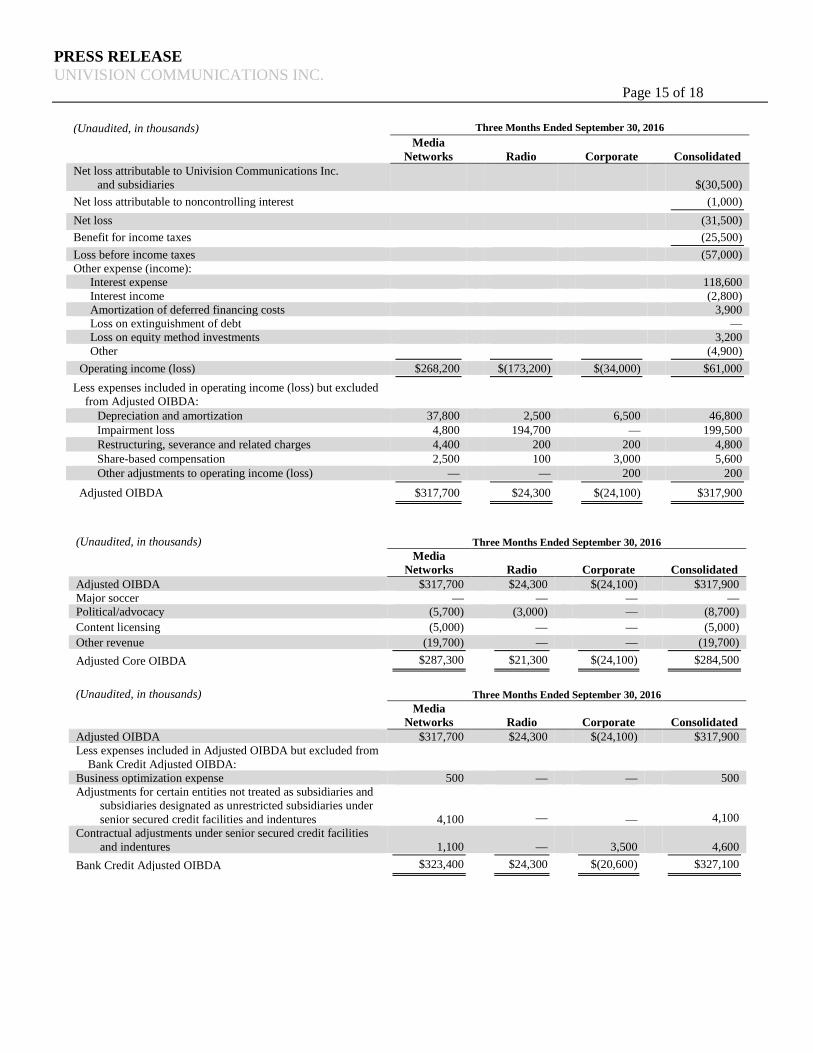
(Unaudited, in thousands) Three Months Ended September 30, 2016 Media
Networks
Radio Corporate Consolidated Net loss attributable to Univision Communications Inc.
and subsidiaries
$(30,500) Net loss attributable to noncontrolling interest (1,000) Net loss (31,500) Benefit for income taxes (25,500) Loss before income taxes (57,000) Other expense (income):
Interest expense 118,600 Interest income
(2,800)
Amortization of deferred financing costs 3,900 Loss on extinguishment of debt — Loss on equity method investments 3,200 Other (4,900)
Operating income (loss) $268,200 $(173,200) $(34,000) $61,000 Less expenses included in operating income (loss) but excluded
from Adjusted OIBDA:
Depreciation and amortization 37,800 2,500 6,500 46,800 Impairment loss 4,800 194,700 — 199,500 Restructuring, severance and related charges 4,400 200 200 4,800 Share-based compensation 2,500 100 3,000 5,600 Other adjustments to operating income (loss) — — 200 200 Adjusted OIBDA $317,700 $24,300 $(24,100) $317,900
(Unaudited, in thousands) Three Months Ended September 30, 2016
Media
Networks Radio Corporate Consolidated Adjusted OIBDA $317,700 $24,300 $(24,100) $317,900 Major soccer — — — — Political/advocacy (5,700) (3,000) — (8,700) Content licensing (5,000) — — (5,000) Other revenue (19,700) — — (19,700) Adjusted Core OIBDA $287,300 $21,300 $(24,100) $284,500
(Unaudited, in thousands) Three Months Ended September 30, 2016
Media
Networks Radio Corporate Consolidated Adjusted OIBDA $317,700 $24,300 $(24,100) $317,900 Less expenses included in Adjusted OIBDA but excluded from
Bank Credit Adjusted OIBDA:
Business optimization expense 500 — — 500 Adjustments for certain entities not treated as subsidiaries and
subsidiaries designated as unrestricted subsidiaries under senior secured credit facilities and indentures 4,100 — — 4,100
Contractual adjustments under senior secured credit facilities and indentures 1,100 — 3,500 4,600
Bank Credit Adjusted OIBDA $323,400 $24,300 $(20,600) $327,100
PRESS RELEASE UNIVISION COMMUNICATIONS INC. Page 16 of 18
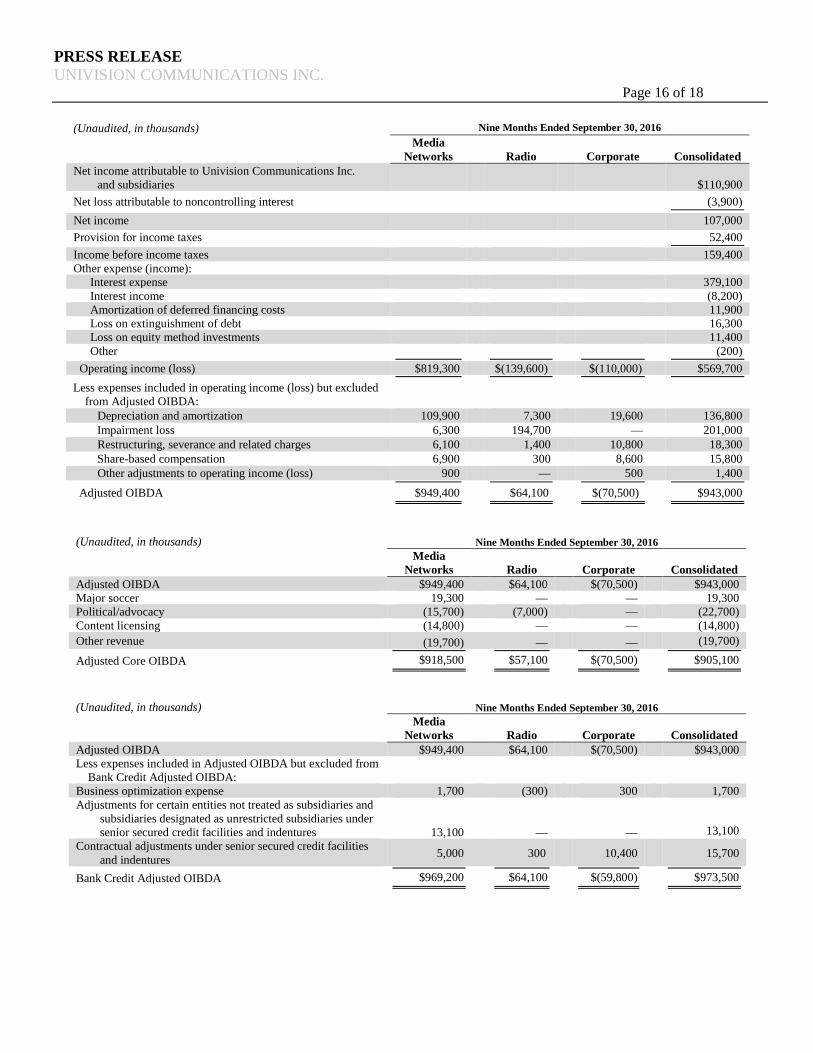
(Unaudited, in thousands) Nine Months Ended September 30, 2016 Media
Networks
Radio Corporate Consolidated Net income attributable to Univision Communications Inc.
and subsidiaries
$110,900 Net loss attributable to noncontrolling interest (3,900) Net income 107,000 Provision for income taxes 52,400 Income before income taxes 159,400 Other expense (income):
Interest expense 379,100 Interest income
(8,200)
Amortization of deferred financing costs 11,900 Loss on extinguishment of debt 16,300 Loss on equity method investments 11,400 Other (200)
Operating income (loss) $819,300 $(139,600) $(110,000) $569,700 Less expenses included in operating income (loss) but excluded
from Adjusted OIBDA:
Depreciation and amortization 109,900 7,300 19,600 136,800 Impairment loss 6,300 194,700 — 201,000 Restructuring, severance and related charges 6,100 1,400 10,800 18,300 Share-based compensation 6,900 300 8,600 15,800 Other adjustments to operating income (loss) 900 — 500 1,400 Adjusted OIBDA $949,400 $64,100 $(70,500) $943,000
(Unaudited, in thousands) Nine Months Ended September 30, 2016
Media
Networks Radio Corporate Consolidated Adjusted OIBDA $949,400 $64,100 $(70,500) $943,000 Major soccer 19,300 — — 19,300 Political/advocacy (15,700) (7,000) — (22,700) Content licensing (14,800) — — (14,800) Other revenue (19,700) — — (19,700) Adjusted Core OIBDA $918,500 $57,100 $(70,500) $905,100
(Unaudited, in thousands) Nine Months Ended September 30, 2016
Media
Networks Radio Corporate Consolidated Adjusted OIBDA $949,400 $64,100 $(70,500) $943,000 Less expenses included in Adjusted OIBDA but excluded from
Bank Credit Adjusted OIBDA:
Business optimization expense 1,700 (300) 300 1,700 Adjustments for certain entities not treated as subsidiaries and
subsidiaries designated as unrestricted subsidiaries under senior secured credit facilities and indentures 13,100 — — 13,100
Contractual adjustments under senior secured credit facilities and indentures 5,000 300 10,400 15,700
Bank Credit Adjusted OIBDA $969,200 $64,100 $(59,800) $973,500
PRESS RELEASE UNIVISION COMMUNICATIONS INC. Page 17 of 18
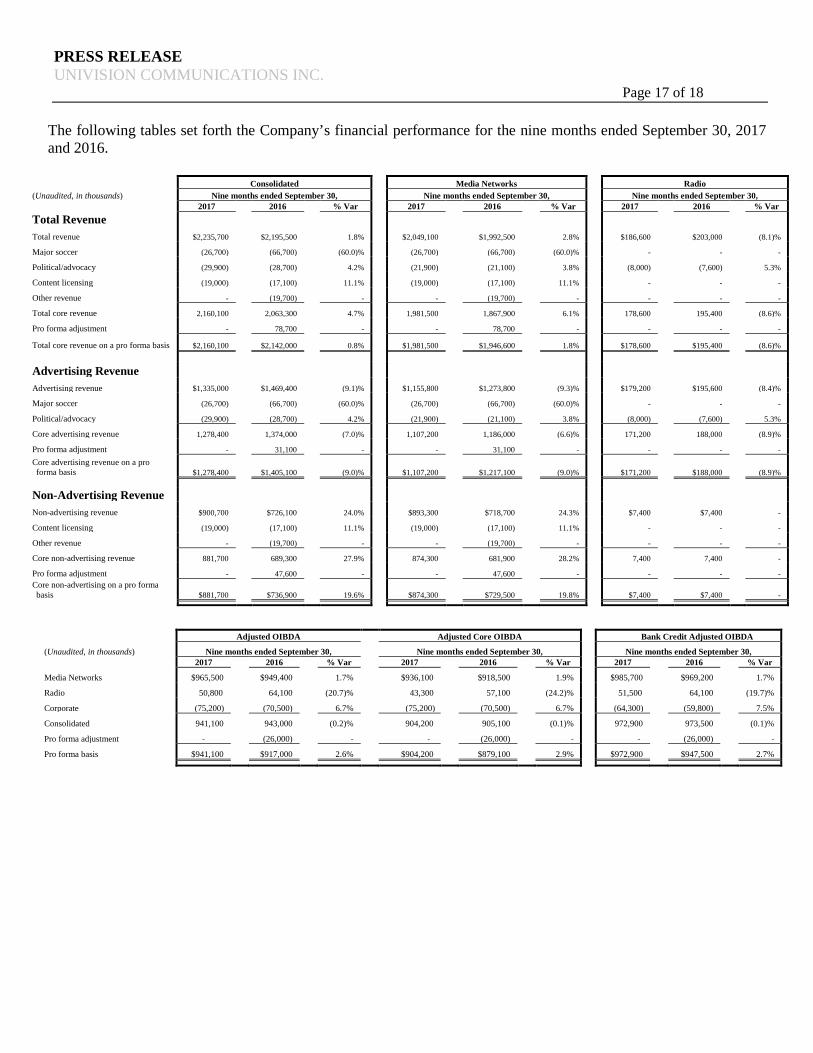
The following tables set forth the Company’s financial performance for the nine months ended September 30, 2017 and 2016.
Consolidated Media Networks Radio (Unaudited, in thousands) Nine months ended September 30, Nine months ended September 30, Nine months ended September 30,
2017 2016 % Var 2017 2016 % Var 2017 2016 % Var Total Revenue
Total revenue $2,235,700 $2,195,500 1.8% $2,049,100 $1,992,500 2.8% $186,600 $203,000 (8.1)%
Major soccer (26,700) (66,700) (60.0)% (26,700) (66,700) (60.0)% - - -
Political/advocacy (29,900) (28,700) 4.2% (21,900) (21,100) 3.8% (8,000) (7,600) 5.3%
Content licensing (19,000) (17,100) 11.1% (19,000) (17,100) 11.1% - - -
Other revenue - (19,700) - - (19,700) - - - -
Total core revenue 2,160,100 2,063,300 4.7% 1,981,500 1,867,900 6.1% 178,600 195,400 (8.6)%
Pro forma adjustment - 78,700 - - 78,700 - - - -
Total core revenue on a pro forma basis $2,160,100 $2,142,000 0.8% $1,981,500 $1,946,600 1.8% $178,600 $195,400 (8.6)%
Advertising Revenue
Advertising revenue $1,335,000 $1,469,400 (9.1)% $1,155,800 $1,273,800 (9.3)% $179,200 $195,600 (8.4)%
Major soccer (26,700) (66,700) (60.0)% (26,700) (66,700) (60.0)% - - -
Political/advocacy (29,900) (28,700) 4.2% (21,900) (21,100) 3.8% (8,000) (7,600) 5.3%
Core advertising revenue 1,278,400 1,374,000 (7.0)% 1,107,200 1,186,000 (6.6)% 171,200 188,000 (8.9)%
Pro forma adjustment - 31,100 - - 31,100 - - - - Core advertising revenue on a pro forma basis $1,278,400 $1,405,100 (9.0)% $1,107,200 $1,217,100 (9.0)% $171,200 $188,000 (8.9)%
Non-Advertising Revenue
Non-advertising revenue $900,700 $726,100 24.0% $893,300 $718,700 24.3% $7,400 $7,400 -
Content licensing (19,000) (17,100) 11.1% (19,000) (17,100) 11.1% - - -
Other revenue - (19,700) - - (19,700) - - - -
Core non-advertising revenue 881,700 689,300 27.9% 874,300 681,900 28.2% 7,400 7,400 -
Pro forma adjustment - 47,600 - - 47,600 - - - - Core non-advertising on a pro forma basis $881,700 $736,900 19.6% $874,300 $729,500 19.8% $7,400 $7,400 -
Adjusted OIBDA Adjusted Core OIBDA Bank Credit Adjusted OIBDA
(Unaudited, in thousands) Nine months ended September 30, Nine months ended September 30, Nine months ended September 30, 2017 2016 % Var 2017 2016 % Var 2017 2016 % Var
Media Networks $965,500 $949,400 1.7% $936,100 $918,500 1.9% $985,700 $969,200 1.7%
Radio 50,800 64,100 (20.7)% 43,300 57,100 (24.2)% 51,500 64,100 (19.7)%
Corporate (75,200) (70,500) 6.7% (75,200) (70,500) 6.7% (64,300) (59,800) 7.5%
Consolidated 941,100 943,000 (0.2)% 904,200 905,100 (0.1)% 972,900 973,500 (0.1)%
Pro forma adjustment - (26,000) - - (26,000) - - (26,000) -
Pro forma basis $941,100 $917,000 2.6% $904,200 $879,100 2.9% $972,900 $947,500 2.7%
PRESS RELEASE UNIVISION COMMUNICATIONS INC. Page 18 of 18
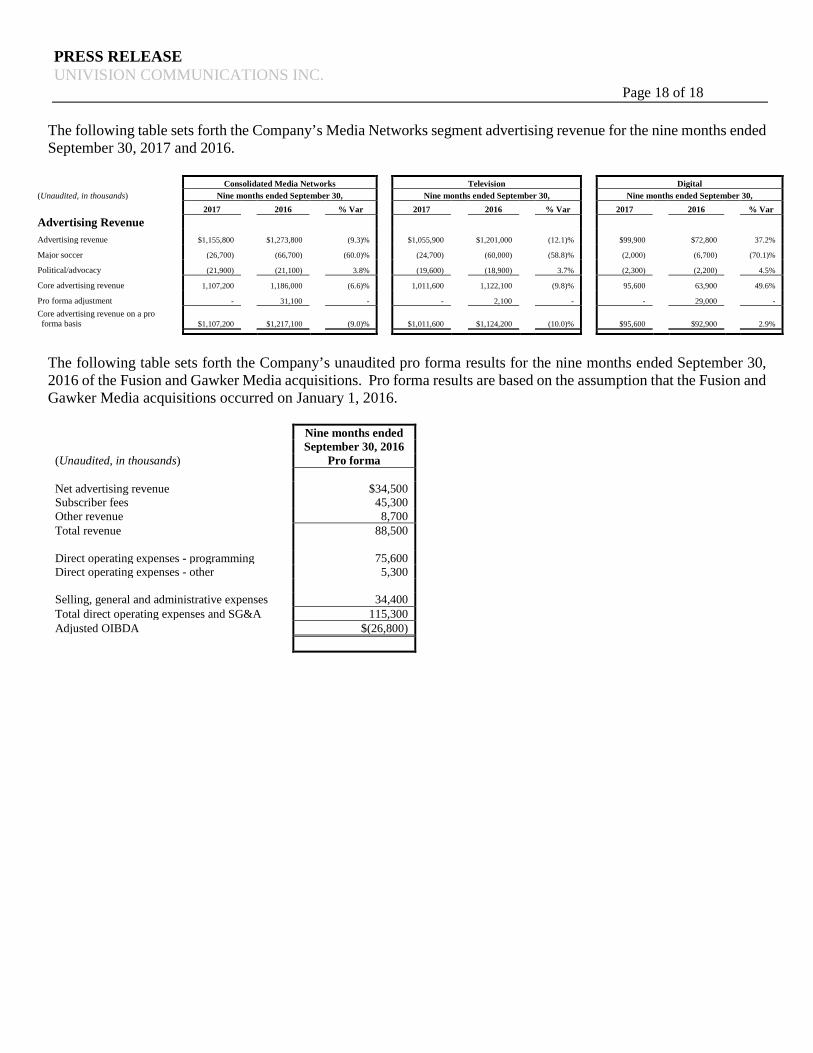
The following table sets forth the Company’s Media Networks segment advertising revenue for the nine months ended September 30, 2017 and 2016.
The following table sets forth the Company’s unaudited pro forma results for the nine months ended September 30, 2016 of the Fusion and Gawker Media acquisitions. Pro forma results are based on the assumption that the Fusion and Gawker Media acquisitions occurred on January 1, 2016. Nine months ended September 30, 2016 (Unaudited, in thousands) Pro forma Net advertising revenue $34,500 Subscriber fees 45,300 Other revenue 8,700 Total revenue 88,500 Direct operating expenses - programming 75,600 Direct operating expenses - other 5,300 Selling, general and administrative expenses 34,400 Total direct operating expenses and SG&A 115,300 Adjusted OIBDA $(26,800)
Consolidated Media Networks Television Digital (Unaudited, in thousands) Nine months ended September 30, Nine months ended September 30, Nine months ended September 30,
2017 2016 % Var 2017 2016 % Var 2017 2016 % Var Advertising Revenue
Advertising revenue $1,155,800 $1,273,800 (9.3)% $1,055,900 $1,201,000 (12.1)% $99,900 $72,800 37.2%
Major soccer (26,700) (66,700) (60.0)% (24,700) (60,000) (58.8)% (2,000) (6,700) (70.1)%
Political/advocacy (21,900) (21,100) 3.8% (19,600) (18,900) 3.7% (2,300) (2,200) 4.5%
Core advertising revenue 1,107,200 1,186,000 (6.6)% 1,011,600 1,122,100 (9.8)% 95,600 63,900 49.6%
Pro forma adjustment - 31,100 - - 2,100 - - 29,000 - Core advertising revenue on a pro forma basis $1,107,200 $1,217,100 (9.0)% $1,011,600 $1,124,200 (10.0)% $95,600 $92,900 2.9%