Embed Size (px)
Citation preview
PRESS RELEASE
Brussels, 6 May 2015 – 1 / 15
The enclosed information constitutes regulated information as defined in the Belgian Royal Decree of 14 November 2007 regarding the duties of issuers of financial instruments which have been admitted for trading on a regulated market.
Anheuser-Busch InBev reports First Quarter 2015 Results
Highlights Except where otherwise stated, the comments below are based on organic figures and refer to 1Q15 versus the same period of last year. For important notes and disclaimers please refer to page 12.
Revenue growth: Revenue grew by 6.2% in the quarter, with revenue per hl growth of
7.5% on both a reported and constant geographic mix basis, driven by our revenue
management and premiumization initiatives
Volume performance: Total volumes declined by 1.2%, with our own beer volumes down
by 1.0%. The decline in own beer volumes was driven mainly by a decline of 6.0% in sales
to wholesalers (STWs) in the US which, as expected, faced a difficult comparable following
the build-up of wholesaler inventories in 1Q14 ahead of union negotiations. Selling day
adjusted sales–to-retailers (STRs) in the US decreased by 1.5%
Focus Brands: Volumes of our Focus Brands declined by 0.3% in the quarter, being
impacted by the difficult STW comparable in the US. Volumes of our global brands grew by
4.6%, with Budweiser up 6.2%, Corona up 2.7% and Stella Artois up 1.2%
Cost of Sales (CoS): CoS increased by 4.8% in 1Q15 and by 6.1% on a per hl basis. On a
constant geographic basis, CoS per hl increased by 6.4%
EBITDA grew by 11.1% to 3 967 million USD with a margin expansion of 170 bps, driven
mainly by strong top line growth
Net finance results: Net finance income (excluding non-recurring net finance results) was
91 million USD in 1Q15 compared to net finance costs of 866 million USD in 1Q14. This
variance of 957 million USD was driven primarily by a positive 757 million USD mark-to-
market adjustment in 1Q15 linked to the hedging of our share-based payment programs,
compared to a loss of 52 million USD in 1Q14
Income taxes: Income tax in 1Q15 was 593 million USD with a normalized effective tax
rate (ETR) of 18.0%, compared to an income tax expense of 419 million USD in 1Q14 and a
normalized ETR of 18.8%. The normalized ETR was favorably impacted by the 757 million
USD gain linked to the hedging of our share-based payment programs
Profit: Normalized profit attributable to equity holders of AB InBev was 2 294 million USD in
1Q15 compared to 1 416 million USD in 1Q14, driven by strong top line growth and
favorable net finance results
Earnings per share: Normalized earnings per share (EPS) increased to 1.40 USD in 1Q15
from 0.87 USD in 1Q14
Share Buyback Program: As reported in our FY14 results release, the Board has approved
a share buyback program for an amount of one billion USD. It remains our intention to use
the shares acquired to fulfil our various share delivery commitments under the stock
ownership plan. The buyback program began on 18 March 2015 and as of 1 May 2015, the
company had acquired approximately 3.8 million shares for a total consideration of
approximately 467 million USD
PRESS RELEASE
Brussels, 6 May 2015 – 2 / 15
MANAGEMENT COMMENTS
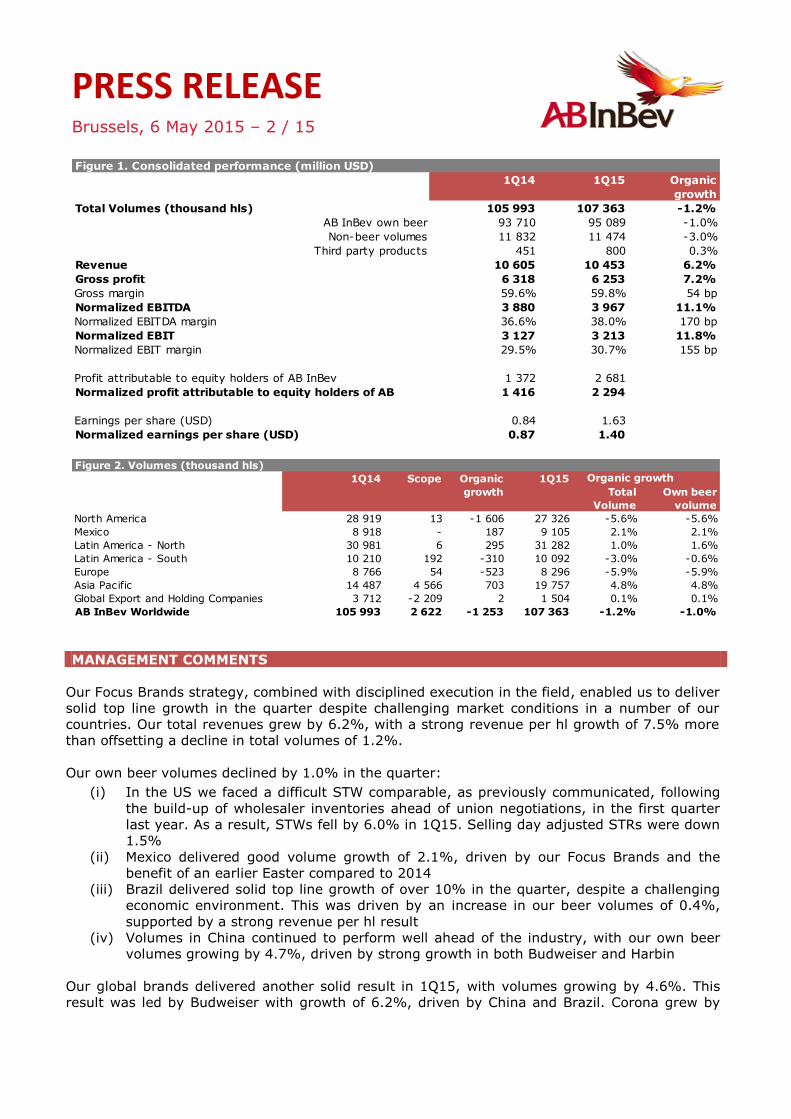
Our Focus Brands strategy, combined with disciplined execution in the field, enabled us to deliver
solid top line growth in the quarter despite challenging market conditions in a number of our
countries. Our total revenues grew by 6.2%, with a strong revenue per hl growth of 7.5% more
than offsetting a decline in total volumes of 1.2%.
Our own beer volumes declined by 1.0% in the quarter:
(i) In the US we faced a difficult STW comparable, as previously communicated, following
the build-up of wholesaler inventories ahead of union negotiations, in the first quarter
last year. As a result, STWs fell by 6.0% in 1Q15. Selling day adjusted STRs were down
1.5%
(ii) Mexico delivered good volume growth of 2.1%, driven by our Focus Brands and the
benefit of an earlier Easter compared to 2014
(iii) Brazil delivered solid top line growth of over 10% in the quarter, despite a challenging
economic environment. This was driven by an increase in our beer volumes of 0.4%,
supported by a strong revenue per hl result
(iv) Volumes in China continued to perform well ahead of the industry, with our own beer
volumes growing by 4.7%, driven by strong growth in both Budweiser and Harbin
Our global brands delivered another solid result in 1Q15, with volumes growing by 4.6%. This
result was led by Budweiser with growth of 6.2%, driven by China and Brazil. Corona grew by
Figure 1. Consolidated performance (million USD)
1Q14 1Q15 Organic
growth
Total Volumes (thousand hls) 105 993 107 363 -1.2%
AB InBev own beer 93 710 95 089 -1.0%
Non-beer volumes 11 832 11 474 -3.0%
Third party products 451 800 0.3%
Revenue 10 605 10 453 6.2%
Gross profit 6 318 6 253 7.2%
Gross margin 59.6% 59.8% 54 bp
Normalized EBITDA 3 880 3 967 11.1%
Normalized EBITDA margin 36.6% 38.0% 170 bp
Normalized EBIT 3 127 3 213 11.8%
Normalized EBIT margin 29.5% 30.7% 155 bp
Profit attributable to equity holders of AB InBev 1 372 2 681
Normalized profit attributable to equity holders of AB 1 416 2 294
Earnings per share (USD) 0.84 1.63
Normalized earnings per share (USD) 0.87 1.40
Figure 2. Volumes (thousand hls)
1Q14 Scope Organic 1Q15
growth Total
Volume
Own beer
volume
North America 28 919 13 -1 606 27 326 -5.6% -5.6%
Mexico 8 918 - 187 9 105 2.1% 2.1%
Latin America - North 30 981 6 295 31 282 1.0% 1.6%
Latin America - South 10 210 192 -310 10 092 -3.0% -0.6%
Europe 8 766 54 -523 8 296 -5.9% -5.9%
Asia Pacific 14 487 4 566 703 19 757 4.8% 4.8%
Global Export and Holding Companies 3 712 -2 209 2 1 504 0.1% 0.1%
AB InBev Worldwide 105 993 2 622 -1 253 107 363 -1.2% -1.0%
Organic growth
PRESS RELEASE
Brussels, 6 May 2015 – 3 / 15
2.7%, with strong results in Australia, Italy and Canada, while Stella Artois grew by 1.2%, led by
the US.
Consolidated EBITDA grew by 11.1% in the quarter, with margin expansion of 170 bps, driven
mainly by the strong revenue performance.
Our sales and marketing investments in the quarter grew by 1.3%. This compares to a growth of
16.7% in 1Q14 which reflected the start of our FIFA World Cup activations. We are committed to
investing in opportunities to grow our brands and global platforms for the long term, and
continue to expect sales and marketing investments to grow by mid to high single digits in FY15.
Normalized earnings per share (EPS) increased to 1.40 USD in 1Q15 from 0.87 USD in the same
period last year. This was driven by strong top line growth and the positive impact of a 757
million USD mark-to-market adjustment linked to the hedging of our share-based payment
programs.
The one billion USD share buyback program announced on 26 February is progressing well and
as of 1 May was approximately 47% complete.
2015 OUTLOOK
(i) Volume and Revenue:
In the US: We expect industry volumes to improve in FY15 compared to FY14. We
expect STWs and STRs to converge on a full year basis
In Mexico: We expect beer industry volumes to continue to grow in FY15, driven by the
economy and our own commercial initiatives
In Brazil: We expect our net revenues to grow by mid to high single digits, helped by
continuing growth in premium
In China: We expect beer industry volumes to return to growth in FY15. We expect our
revenue per hl to continue to be driven by favorable brand mix
Total AB InBev: We expect revenue per hl to grow organically in line with inflation, on
a constant geographic basis, as a result of our revenue management initiatives and
continued improvements in mix
(ii) Cost of Sales per hl: We expect CoS per hl to increase organically by low single digits, on
a constant geographic basis, driven by mix and unfavorable foreign exchange transactional
impact (primarily BRL/USD), partly offset by favorable global commodity prices,
procurement savings and efficiency gains
(iii) Distribution expenses per hl: We expect distribution expenses per hl to increase
organically by mid-single digits, driven by higher distribution expenses in Brazil, the US
and Mexico
(iv) Sales and Marketing investments: We expect sales and marketing investments to grow
by mid to high single digits as we continue to invest behind our brands and global
platforms for the long term
(v) Net Finance Costs: We expect the average coupon on net debt to be in the range of
3.5% to 4.0% in FY15. Net pension interest expense and accretion expenses are expected
to be approximately 35 and 80 million USD per quarter, respectively. Other financial
results will continue to be impacted by any gains and losses related to the hedging of our
share-based payment programs
(vi) Effective Tax Rate: We expect the normalized ETR in FY15 to be between 22% and 24%.
We expect the normalized ETR to be in the range of 22% to 25% in the period 2016-2018,
and in the range of 25% to 27% thereafter. Our normalized ETR guidance continues to

PRESS RELEASE
Brussels, 6 May 2015 – 4 / 15
exclude the impact of any future gains and losses related to the hedging of our share-
based payment programs
(vii) Net Capital Expenditure: We expect net capital expenditure of approximately 4.3 billion
USD in FY15, driven by investments in our consumer and commercial initiatives, and
capacity expansion
(viii) Debt: Our optimal capital structure remains a net debt to EBITDA ratio of around 2x.
Approximately one third of AB InBev’s gross debt is denominated in currencies other than
the US dollar, principally the Euro
BUSINESS REVIEW
United States
Key performance indicators
In the United States, our STWs declined by 6.0%. This decline was due mainly to a difficult
comparable resulting from an increase in wholesaler inventory levels in 1Q14 as part of
contingency planning ahead of labor negotiations. We estimate that industry selling-day
adjusted STRs declined by 0.5% in the quarter, with our own selling-day adjusted STRs
declining by 1.5%. This resulted in an estimated loss in total market share of approximately 45
bps. We continue to expect our STRs and STWs to converge on a full year basis.
Bud Light continues to gain share of the premium light segment, according to our estimates,
with the brand benefiting from a strong Super Bowl campaign. STRs declined by approximately
2% in the quarter, with the brand losing approximately 20 bps of total market share, based on
our estimates.
Budweiser delivered one of its best performances for several quarters, driven by a strong
campaign focused on the brand’s quality and heritage credentials. Budweiser STRs declined by
low single digits in the quarter, with market share down approximately 20 bps, by our
estimates.
Our portfolio of Above Premium brands performed well, gaining approximately 20 bps of total
market share in the quarter, based on our estimates, with the strongest performances coming
from Ultra, Stella Artois and Goose Island.
We continue to invest in the on trade, especially behind our high end brands. Our share in this
channel is growing, based on our estimates, with strong momentum since mid-2014.
US beer-only revenue per hl grew by 1.3% in the quarter. This result was adversely impacted
by approximately 40 bps since price promotion accruals are based on STR volumes and not STW
volumes.
US EBITDA declined by 6.5% to 1 288 million USD in 1Q15, driven by the difficult STW
comparable. EBITDA margin contracted by 70 bps, to 39.6%.
Figure 3. United States (million USD)
1Q14 1Q15 Organic
growth
Total volumes (thousand hls) 27 138 25 504 -6.0%
Revenue 3 420 3 256 -4.8%
Normalized EBITDA 1 377 1 288 -6.5%
Normalized EBITDA margin 40.3% 39.6% -70 bp

PRESS RELEASE
Brussels, 6 May 2015 – 5 / 15
Mexico Key performance indicators
Mexico delivered solid results in terms of volume, revenue and EBITDA.
Our own volumes increased by 2.1% in the quarter, driven by a strong performance by our
Focus Brands which grew by 4.4%, and an earlier Easter. The strongest performances came
from Bud Light and Victoria. Corona volumes also grew in the quarter despite a very challenging
comparable resulting from the FIFA World Cup promotion in 1Q14.
Beer revenue per hl grew by 5.9% in 1Q15 driven by our revenue management initiatives and
Bud Light brand mix.
Cost synergies realized during the first quarter amounted to approximately 10 million USD,
bringing the total cost savings to date to approximately 740 million USD. As previously
communicated, the delivery of cost synergies in 2015 will be weighted towards the second half
of the year. We remain committed to delivering our target of 1 billion USD of savings by the end
of 2016, with the vast majority expected to come by the end of 2015.
Mexico EBITDA grew by 15.8% to 417 million USD in 1Q15, with an EBITDA margin
enhancement of 313 bps to 46.8%. The increase in EBITDA was driven by strong top line
growth, partly offset by additional bottle costs related to higher than expected demand for
Corona globally.
Brazil
Key performance indicators
Our total volumes were marginally down in the quarter, with our beer volumes growing by
0.4%, driven by solid execution and growth in our premium brands. We estimate that our beer
market share was flat during the quarter, at an average of 67.5%. Our soft drinks volumes
were down 2.2% due to industry weakness, partly offset by share gains.
Brazil beer revenue per hl performance was strong, increasing by 11.0% in the quarter,
reflecting our revenue management initiatives, increased own distribution volumes and
premium brand mix.
Figure 4. Mexico (million USD)
1Q14 1Q15 Organic
growth
Total volumes (thousand hls) 8 918 9 105 2.1%
Revenue 1 042 893 8.1%
Normalized EBITDA 431 417 15.8%
Normalized EBITDA margin 41.3% 46.8% 313 bp
Figure 5. Brazil (million USD)
1Q14 1Q15 Organic
growth
Total volumes (thousand hls) 29 360 29 295 -0.2%
Beer volumes 21 984 22 079 0.4%
Non-beer volumes 7 376 7 215 -2.2%
Revenue 2 485 2 271 10.7%
Normalized EBITDA 1 219 1 189 18.1%
Normalized EBITDA margin 49.1% 52.3% 328 bp
PRESS RELEASE
Brussels, 6 May 2015 – 6 / 15
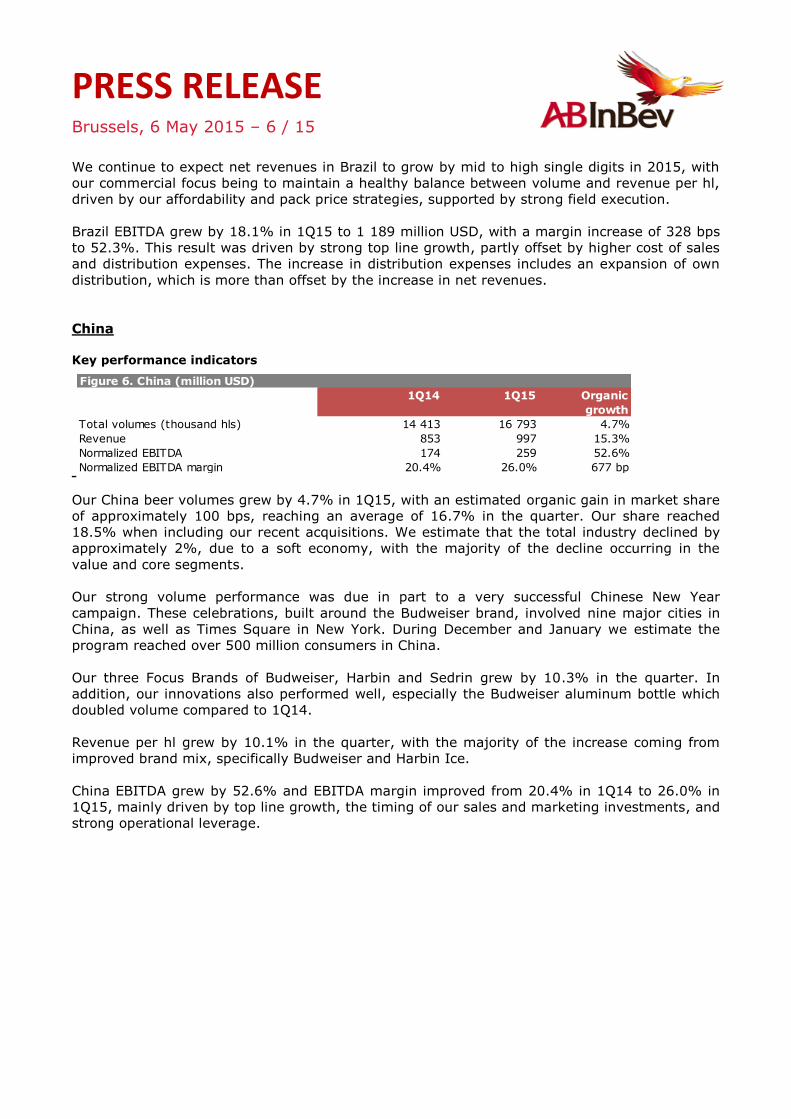
We continue to expect net revenues in Brazil to grow by mid to high single digits in 2015, with
our commercial focus being to maintain a healthy balance between volume and revenue per hl,
driven by our affordability and pack price strategies, supported by strong field execution.
Brazil EBITDA grew by 18.1% in 1Q15 to 1 189 million USD, with a margin increase of 328 bps
to 52.3%. This result was driven by strong top line growth, partly offset by higher cost of sales
and distribution expenses. The increase in distribution expenses includes an expansion of own
distribution, which is more than offset by the increase in net revenues.
China
Key performance indicators
Our China beer volumes grew by 4.7% in 1Q15, with an estimated organic gain in market share
of approximately 100 bps, reaching an average of 16.7% in the quarter. Our share reached
18.5% when including our recent acquisitions. We estimate that the total industry declined by
approximately 2%, due to a soft economy, with the majority of the decline occurring in the
value and core segments.
Our strong volume performance was due in part to a very successful Chinese New Year
campaign. These celebrations, built around the Budweiser brand, involved nine major cities in
China, as well as Times Square in New York. During December and January we estimate the
program reached over 500 million consumers in China.
Our three Focus Brands of Budweiser, Harbin and Sedrin grew by 10.3% in the quarter. In
addition, our innovations also performed well, especially the Budweiser aluminum bottle which
doubled volume compared to 1Q14.
Revenue per hl grew by 10.1% in the quarter, with the majority of the increase coming from
improved brand mix, specifically Budweiser and Harbin Ice.
China EBITDA grew by 52.6% and EBITDA margin improved from 20.4% in 1Q14 to 26.0% in
1Q15, mainly driven by top line growth, the timing of our sales and marketing investments, and
strong operational leverage.
Figure 6. China (million USD)
1Q14 1Q15 Organic
growth
Total volumes (thousand hls) 14 413 16 793 4.7%
Revenue 853 997 15.3%
Normalized EBITDA 174 259 52.6%
Normalized EBITDA margin 20.4% 26.0% 677 bp

PRESS RELEASE
Brussels, 6 May 2015 – 7 / 15
Highlights from our other markets
Our beer volumes in Argentina declined by low single digits as a result of the weak consumer
environment and some share loss due to competitive pressure. Quilmes MixxTail Mojito, which
we launched in 4Q14 in the near-beer category, continues to perform ahead of expectations.
Own beer volumes in Belgium declined by low single digits in 1Q15 driven by industry decline,
partly offset by share gains, based on our estimates.
In Canada, our beer volumes increased by low single digits in the quarter, on the back of a
good industry performance. We estimate that we maintained market share.
In Germany, own beer volumes were marginally down, mainly driven by the timing of our first
quarter price increase. We have recently launched a number of innovations for our Focus
Brands, including a trio of new liquids for Beck’s under the banner of “Taste the World” and two
new non-alcohol products for Franziskaner.
In South Korea, beer volumes were down approximately 4% in 1Q15, mainly due to some
estimated share loss against a difficult comparable.
In the United Kingdom, our own products declined by approximately 7% as a result of a weak
industry environment, and a difficult market share comparable.
CONSOLIDATED INCOME STATEMENT
Revenue
Consolidated revenue grew by 6.2% in 1Q15, with revenue per hl growth of 7.5% on both a
reported and constant geographic mix basis. This result was driven by our revenue
management initiatives and brand mix, as we continue to implement our premiumization
strategies.
Figure 7. Consolidated income statement (million USD)
1Q14 1Q15 Organic
growth
Revenue 10 605 10 453 6.2%
Cost of sales -4 287 -4 200 -4.8%
Gross profit 6 318 6 253 7.2%
Distribution expenses -1 044 -1 059 -11.0%
Sales and marketing expenses -1 661 -1 586 -1.3%
Administrative expenses -689 -645 -6.3%
Other operating income/(expenses) 203 250 46.8%
Normalized profit from operations
(normalized EBIT) 3 127 3 213 11.8%
Non-recurring items above EBIT -20 -9
Net finance income/(cost) -866 91
Non-recurring net finance income/(cost) -31 395
Share of results of associates 8 1
Income tax expense -419 -593
Profit 1 799 3 098
Profit attributable to non-controlling interest 427 417
Profit attributable to equity holders of AB InBev 1 372 2 681
Normalized EBITDA 3 880 3 967 11.1%
Normalized profit attributable to equity
holders of AB InBev 1 416 2 294

PRESS RELEASE
Brussels, 6 May 2015 – 8 / 15
Cost of Sales (CoS)
Total CoS increased by 4.8%, and by 6.1% on a per hl basis. This increase was driven primarily
by unfavorable foreign exchange transactional impacts, especially in Brazil and Argentina, and
higher depreciation from recent investments in Brazil. On a constant geographic basis, CoS per
hl increased by 6.4%.
Distribution expenses
Distribution expenses grew by 11.0% and by 12.3% on a per hl basis. This increase was driven
mainly by increased own distribution in Brazil, which is more than offset by the increase in net
revenues, the growth of our premium brands, and increased expenses in Mexico. In Latin
America South, distribution expenses increased due to higher fuel costs and wage increases for
unionized workers.
Sales and marketing investments
Sales and marketing investments increased by 1.3% in 1Q15. This compares to a growth of
16.7% in 1Q14, which included the start of our FIFA World Cup activations.
Administrative expenses
Administrative expenses increased by 6.3% mainly due to geographic expansion in China and
the timing of certain expenses in Europe.
Other operating income
Other operating income was 250 million USD in 1Q15 compared to 203 million USD in 1Q14.
This increase was mainly driven by recurring investment incentives.
Non-recurring items above EBIT
Normalized profit from operations excludes negative non-recurring items of 9 million USD,
primarily due to restructuring costs.
Net finance income/(cost)
Net finance results (excluding non-recurring net finance results) were 91 million USD in 1Q15
compared to -866 million USD in 1Q14. This improvement was driven primarily by other
financial results which includes a positive mark-to-market adjustment of 757 million USD in
1Q15, linked to the hedging of our share-based payment programs, compared to a loss of 52
million USD in 1Q14. Other financial results in 1Q15 also include positive currency results and
other hedging costs.
Figure 8. Non-recurring items above EBIT (million USD)
1Q14 1Q15
Restructuring (including impairment losses) -24 -18
Acquisition costs related to business combinations -12 -
Business and asset disposal (including impairment losses) 16 9
Impact on profit from operations -20 -9
Figure 9. Net finance income/(cost) (million USD)
1Q14 1Q15
Net interest expense -441 -408
Net interest on net defined benefit liabilities -30 -30
Accretion expenses -75 -76
Other financial results -320 605
Net finance income/(cost) -866 91

PRESS RELEASE
Brussels, 6 May 2015 – 9 / 15
The number of shares covered by the hedging of our share-based payment programs, and the
opening and closing share prices, are shown in figure 10 below.
Non-recurring net finance income/(cost)
Non-recurring net finance results were 395 million USD in 1Q15 and -31 million USD in
1Q14 resulting from the mark-to-market impact of derivative instruments entered into to hedge
the deferred share instrument issued in a transaction related to the combination with Grupo
Modelo. The deferred share instrument was hedged at an average price of approximately 68
Euro per share. The number of shares covered by the hedging of the deferred share instrument,
and the opening and closing share prices, are shown in figure 12.
Income tax expense
Income tax expense in 1Q15 was 593 million USD with a normalized effective tax rate (ETR)
of 18.0%, compared to an income tax expense of 419 million USD in 1Q14 and a normalized
ETR of 18.8%. The normalized ETR in 1Q15 was favorably impacted by the 757 million USD
gain linked to the hedging of our share-based payment programs.
Profit attributable to non-controlling interest
Profit attributable to non-controlling interest decreased from 427 million USD in 1Q14 to
417 million USD in 1Q15, with a strong operating performance in Ambev being offset by
currency translation effects.
Normalized Profit and Profit
Figure 10. Share-based payment hedge
1Q14 1Q15
Share price at the start of the period (Euro) 77.26 93.86
Share price at the end of the period (Euro) 76.10 113.80
Number of equity instruments (millions) 28.3 35.4
Figure 11. Non-recurring net finance income/(cost) (million USD)
1Q14 1Q15
Mark-to-market adjustment -31 395
Other - -
Non-recurring net finance income/(cost) -31 395
Figure 12. Deferred share instrument hedge
1Q14 1Q15
Share price at the start of the period (Euro) 77.26 93.86
Share price at the end of the period (Euro) 76.10 113.80
Number of deferred share instruments (millions) 23.1 23.1
Figure 13. Income tax expense (million USD)
1Q14 1Q15
Tax expense 419 593
Effective tax rate 19.0% 16.1%
Normalized effective tax rate 18.8% 18.0%
Figure 14. Normalized Profit attribution to equity holders of AB InBev (million USD)
1Q14 1Q15
Profit attributable to equity holders of AB InBev 1 372 2 681
Non-recurring items, after taxes, attributable to equity holders of AB InBev 13 8
Non-recurring finance (income)/cost, after taxes, attributable to equity holders
of AB InBev31 -395
Normalized profit attributable to equity holders of
AB InBev1 416 2 294

PRESS RELEASE
Brussels, 6 May 2015 – 10 / 15
Normalized profit attributable to equity holders of AB InBev increased to 2 294 million USD in
1Q15 from 1 416 million USD in 1Q14, driven by strong top line growth and favorable net
finance results.
Profit attributable to equity holders of AB InBev reached 2 681 million USD in 1Q15, compared
to 1 372 million USD in 1Q14.
Normalized EPS
Normalized earnings per share (EPS) increased to 1.40 USD in 1Q15 from 0.87 USD in 1Q14,
and includes a mark-to-market adjustment of 757 million USD in 1Q15, linked to the hedging of
our share-based payment programs, compared to a loss of 52 million USD in 1Q14.
Reconciliation between profit attributable to equity holders and normalized EBITDA
Normalized EBITDA and normalized EBIT are measures utilized by AB InBev to demonstrate the
company’s underlying performance.
Normalized EBITDA is calculated excluding the following effects from profit attributable to equity
holders of AB InBev: (i) non-controlling interest; (ii) income tax expense; (iii) share of results
of associates; (iv) net finance cost; (v) non-recurring net finance cost; (vi) non-recurring items
above EBIT (including non-recurring impairment); and (vii) depreciation, amortization and
impairment.
Normalized EBITDA and normalized EBIT are not accounting measures under IFRS accounting
and should not be considered as an alternative to profit attributable to equity holders as a
measure of operational performance, or an alternative to cash flow as a measure of liquidity.
Normalized EBITDA and normalized EBIT do not have a standard calculation method and
AB InBev’s definition of normalized EBITDA and normalized EBIT may not be comparable to that
of other companies.
Figure 15. Earnings per share (million USD)
1Q14 1Q15
Basic earnings per share 0.84 1.63
Non-recurring items, after taxes, attributable to equity holder of
AB InBev, per share 0.01 -
Non-recurring finance (income)/cost, after taxes, attributable to
equity holders of AB InBev, per share 0.02 -0.23
Normalized earnings per share 0.87 1.40
1Q14 1Q15
Profit attributable to equity holders of AB InBev 1 372 2 681
Non-controlling interests 427 417
Profit 1 799 3 098
Income tax expense 419 593
Share of result of associates -8 -1
Net finance (income)/cost 866 -91
Non-recurring net finance (income)/cost 31 -395
Non-recurring items above EBIT (incl. non-recurring impairment) 20 9
Normalized EBIT 3 127 3 213
Depreciation, amortization and impairment 753 754
Normalized EBITDA 3 880 3 967
Figure 16. Reconciliation of normalized EBITDA to profit attributable to equity holders of AB
InBev (million USD)

PRESS RELEASE
Brussels, 6 May 2015 – 11 / 15
Bond issuance
On 13 April 2015 Anheuser-Busch InBev SA/NV (Euronext: ABI) (NYSE: BUD) announced that it
had completed the pricing of 750 million euro aggregate principal amount of floating rate Notes
due 19 October 2018; 1.0 billion euro aggregate principal amount of fixed rate Notes due 20
April 2023; and 1.25 billion euro aggregate principal amount of fixed rate Notes due 18 April
2030, (together, the “Notes”). The Notes were issued on 20 April 2015. The fixed rate notes will
bear interest at an annual rate of 0.8000% for the 2023 notes and 1.5000% for the 2030 notes.
The 2018 floating rate notes will bear interest at an annual rate of 25 basis points above
three-month EURIBOR.
RECENT EVENTS

PRESS RELEASE
Brussels, 6 May 2015 – 12 / 15
AB InBev’s 1Q15 and 1Q14 reported numbers are based on unaudited interim consolidated financial statements
prepared in accordance with IFRS. Unless otherwise indicated, amounts are presented in million USD. To facilitate the understanding of AB InBev’s underlying performance, the analyses of growth, including all comments in this press release, unless otherwise indicated, are based on organic growth and normalized numbers. In other words, financials are analyzed eliminating the impact of changes in currencies on translation of foreign operations, and scope changes. Scope changes represent the impact of acquisitions and divestitures, the start or termination of activities or the transfer of activities between segments, curtailment gains and losses and year over year changes in accounting estimates and other assumptions that management does not consider as part of the underlying performance of the business. All references per hectoliter (per hl) exclude US non-beer activities. To eliminate the effect of geography mix, i.e. the impact of stronger volume growth coming from countries with lower revenue per hl, and lower Cost of Sales per hl, we are also presenting, where specified, organic growth per hectoliter figures on a constant geographic basis. When we make estimations on a constant geographic basis, we assume each country in which we operate accounts for the same percentage of our global volume as in the same period of the previous year. Whenever presented in this document, all performance measures (EBITDA, EBIT, profit, tax rate, EPS) are presented on a “normalized” basis, which means they are presented before non-recurring items. Non-recurring items are either income or expenses which do not occur regularly as part of the normal activities of the Company. They are presented separately because they are important for the understanding of the underlying sustainable performance of the Company due to their size or nature. Normalized measures are additional measures used by management, and should not replace the measures determined in accordance with IFRS as an indicator of the Company’s performance. Values in the figures and annexes may not add up, due to rounding. Effective 1 April 2014, AB InBev discontinued the reporting of volumes sold to Constellation Brands under the temporary supply agreement (TSA), since these volumes do not form part of the underlying performance of our business. The 1Q14 volumes related to the TSA have therefore been treated as a negative scope. 1Q15 EPS is based upon a weighted average of 1 642 million shares compared to 1 631 million shares for 1Q14.
Legal Disclaimer This release contains certain forward-looking statements reflecting the current views of the management of Anheuser-Busch InBev with respect to, among other things, Anheuser-Busch InBev’s strategic objectives. These statements involve risks and uncertainties. The ability of Anheuser-Busch InBev to achieve these objectives is dependent on many factors some of which may be outside of management’s control. By their nature, forward-looking statements involve risk and uncertainty because they reflect Anheuser-Busch InBev’s current expectations and assumptions as to future events and circumstances that may not prove accurate. The actual results could differ materially from those anticipated in the forward-looking statements for many reasons including the risks described under Item 3.D of Anheuser-Busch InBev’s Annual Report on Form 20-F filed with the US Securities and Exchange Commission on 24 March 2015. Anheuser-Busch InBev cannot assure you that the future results, level of activity, performance or achievements of Anheuser-Busch InBev will meet the expectations reflected in the forward-looking statements. Anheuser-Busch InBev disclaims any obligation to update any of these statements after the date of this release.
The first quarter 2015 (1Q15) financial data set out in Figure 1 (except for the volume information), Figures 7 to 9, 11, 13 to 16 of this press release have been extracted from the group’s unaudited condensed consolidated interim financial statements as of and for the three months ended 31 March 2015, which have been reviewed by our statutory auditors PricewaterhouseCoopers Bedrijfsrevisoren BCVBA in accordance with the standards of the Public Company Accounting Oversight Board (United States). The auditors concluded that, based on their review, nothing had come to their attention that caused them to believe that those interim financial statements were not presented fairly, in all material respects, in accordance with IAS 34 “Interim Financial Reporting”, as issued by the IASB and as adopted by the European Union. Financial data included in Figures 3 to 6, 10 and 12 have been extracted from the underlying
accounting records as of and for the three months ended 31 March 2015 (except for the volume information)
NOTES

PRESS RELEASE
Brussels, 6 May 2015 – 13 / 15
CONFERENCE CALL AND WEBCAST
Investor Conference call and Webcast on Wednesday, 6 May 2015:
3.00pm Brussels / 2.00pm London / 9.00am New York
Registration details
Webcast (listen-only mode)
http://event.on24.com/r.htm?e=933888&s=1&k=A666A5BE94299E9FE1783D65F84621BB
Conference call (with interactive Q&A)
http://www.directeventreg.com/registration/event/77038650
ANHEUSER-BUSCH INBEV CONTACTS
Media
Investors
Marianne Amssoms
Tel: +1-212-573-9281
E-mail: [email protected]
Graham Staley
Tel: +1-212-573-4365
E-mail: [email protected]
Karen Couck
Tel: +1-212-573-9283
E-mail: [email protected]
Kathleen Van Boxelaer
Tel: +32-16-27-68-23
E-mail: [email protected]
Christina Caspersen
Tel: +1-212-573-4376
E-mail: [email protected]
Heiko Vulsieck
Tel: +32-16-27-68-88
E-mail: [email protected]
About Anheuser-Busch InBev Anheuser-Busch InBev is a publicly traded company (Euronext: ABI) based in Leuven, Belgium, with American Depositary Receipts on the New York Stock Exchange (NYSE: BUD). It is the leading global brewer and one of the world’s top five consumer products companies. Beer, the original social network, has been bringing people together for thousands of years and our portfolio of well over 200 beer brands continues to forge strong connections with consumers. This includes global brands Budweiser®, Corona® and Stella Artois®; international brands Beck’s®, Leffe®, and Hoegaarden®; and local champions Bud Light®, Skol®, Brahma®, Antarctica®, Quilmes®, Victoria®, Modelo Especial®, Michelob Ultra®, Harbin®, Sedrin®, Klinskoye®, Sibirskaya Korona®, Chernigivske®, Cass®, and Jupiler®. Anheuser-Busch InBev’s dedication to heritage and quality originates from the Den Hoorn brewery in Leuven, Belgium dating back to 1366 and the pioneering spirit of the Anheuser & Co brewery, with origins in St. Louis, USA since 1852. Geographically diversified with a balanced exposure to developed and developing markets, Anheuser-Busch InBev leverages the collective strengths of its approximately 155 000 employees based in 25 countries worldwide. In
2014, AB InBev realized 47.1 billion USD revenue. The company strives to be the Best Beer Company Bringing People Together For a Better World. Learn more at ab-inbev.com, at facebook.com/ABInBev or on Twitter through @ABInBevNews.
PRESS RELEASE
Brussels, 6 May 2015 – 14 / 15
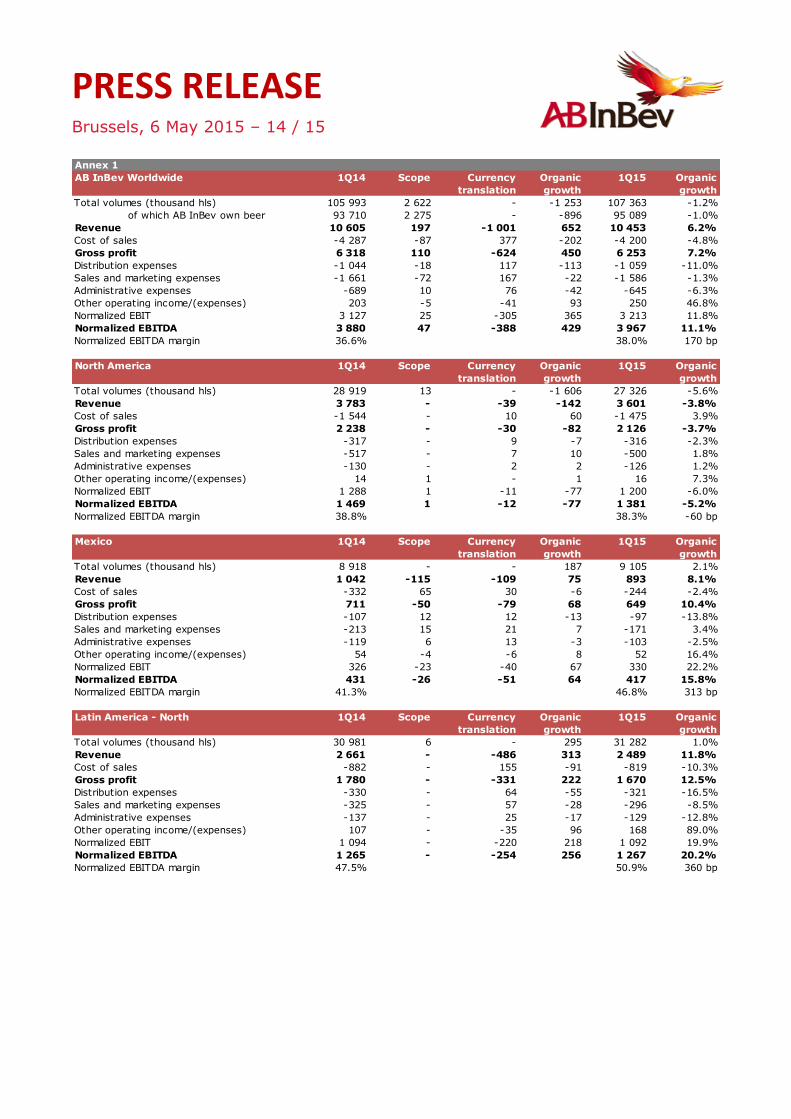
Annex 1
AB InBev Worldwide 1Q14 Scope Currency
translation
Organic
growth
1Q15 Organic
growth
Total volumes (thousand hls) 105 993 2 622 - -1 253 107 363 -1.2%
of which AB InBev own beer 93 710 2 275 - -896 95 089 -1.0%
Revenue 10 605 197 -1 001 652 10 453 6.2%
Cost of sales -4 287 -87 377 -202 -4 200 -4.8%
Gross profit 6 318 110 -624 450 6 253 7.2%
Distribution expenses -1 044 -18 117 -113 -1 059 -11.0%
Sales and marketing expenses -1 661 -72 167 -22 -1 586 -1.3%
Administrative expenses -689 10 76 -42 -645 -6.3%
Other operating income/(expenses) 203 -5 -41 93 250 46.8%
Normalized EBIT 3 127 25 -305 365 3 213 11.8%
Normalized EBITDA 3 880 47 -388 429 3 967 11.1%
Normalized EBITDA margin 36.6% 38.0% 170 bp
North America 1Q14 Scope Currency
translation
Organic
growth
1Q15 Organic
growth
Total volumes (thousand hls) 28 919 13 - -1 606 27 326 -5.6%
Revenue 3 783 - -39 -142 3 601 -3.8%
Cost of sales -1 544 - 10 60 -1 475 3.9%
Gross profit 2 238 - -30 -82 2 126 -3.7%
Distribution expenses -317 - 9 -7 -316 -2.3%
Sales and marketing expenses -517 - 7 10 -500 1.8%
Administrative expenses -130 - 2 2 -126 1.2%
Other operating income/(expenses) 14 1 - 1 16 7.3%
Normalized EBIT 1 288 1 -11 -77 1 200 -6.0%
Normalized EBITDA 1 469 1 -12 -77 1 381 -5.2%
Normalized EBITDA margin 38.8% 38.3% -60 bp
Mexico 1Q14 Scope Currency
translation
Organic
growth
1Q15 Organic
growth
Total volumes (thousand hls) 8 918 - - 187 9 105 2.1%
Revenue 1 042 -115 -109 75 893 8.1%
Cost of sales -332 65 30 -6 -244 -2.4%
Gross profit 711 -50 -79 68 649 10.4%
Distribution expenses -107 12 12 -13 -97 -13.8%
Sales and marketing expenses -213 15 21 7 -171 3.4%
Administrative expenses -119 6 13 -3 -103 -2.5%
Other operating income/(expenses) 54 -4 -6 8 52 16.4%
Normalized EBIT 326 -23 -40 67 330 22.2%
Normalized EBITDA 431 -26 -51 64 417 15.8%
Normalized EBITDA margin 41.3% 46.8% 313 bp
Latin America - North 1Q14 Scope Currency
translation
Organic
growth
1Q15 Organic
growth
Total volumes (thousand hls) 30 981 6 - 295 31 282 1.0%
Revenue 2 661 - -486 313 2 489 11.8%
Cost of sales -882 - 155 -91 -819 -10.3%
Gross profit 1 780 - -331 222 1 670 12.5%
Distribution expenses -330 - 64 -55 -321 -16.5%
Sales and marketing expenses -325 - 57 -28 -296 -8.5%
Administrative expenses -137 - 25 -17 -129 -12.8%
Other operating income/(expenses) 107 - -35 96 168 89.0%
Normalized EBIT 1 094 - -220 218 1 092 19.9%
Normalized EBITDA 1 265 - -254 256 1 267 20.2%
Normalized EBITDA margin 47.5% 50.9% 360 bp

PRESS RELEASE
Brussels, 6 May 2015 – 15 / 15
Annex 1
Latin America - South 1Q14 Scope Currency
translation
Organic
growth
1Q15 Organic
growth
Total volumes (thousand hls) 10 210 192 - -310 10 092 -3.0%
Revenue 791 16 -95 206 918 25.5%
Cost of sales -269 -8 36 -90 -331 -32.3%
Gross profit 522 7 -59 116 587 21.9%
Distribution expenses -76 -1 10 -16 -83 -21.1%
Sales and marketing expenses -86 - 10 -19 -95 -22.0%
Administrative expenses -28 - 3 -7 -32 -25.1%
Other operating income/(expenses) -6 1 1 -1 -5 -13.8%
Normalized EBIT 326 7 -34 73 372 21.9%
Normalized EBITDA 366 7 -39 82 417 22.0%
Normalized EBITDA margin 46.3% 45.4% -128 bp
Europe 1Q14 Scope Currency
translation
Organic
growth
1Q15 Organic
growth
Total volumes (thousand hls) 8 766 54 - -523 8 296 -5.9%
of which AB InBev own beer 8 413 54 - -500 7 967 -5.9%
Revenue 985 4 -215 1 775 0.1%
Cost of sales -458 -4 108 12 -342 2.6%
Gross profit 527 1 -108 13 433 2.5%
Distribution expenses -109 -1 24 -1 -86 -1.1%
Sales and marketing expenses -247 - 58 -5 -193 -1.9%
Administrative expenses -89 - 23 -14 -80 -16.0%
Other operating income/(expenses) 1 - 1 -1 1 -
Normalized EBIT 84 -1 -1 -8 75 -9.8%
Normalized EBITDA 193 - -27 -11 154 -5.9%
Normalized EBITDA margin 19.6% 19.9% -118 bp
Asia Pacific 1Q14 Scope Currency
translation
Organic
growth
1Q15 Organic
growth
Total volumes (thousand hls) 14 487 4 566 - 703 19 757 4.8%
Revenue 858 328 -24 131 1 294 15.5%
Cost of sales -468 -157 12 -37 -650 -7.8%
Gross profit 390 171 -12 95 644 25.1%
Distribution expenses -68 -30 2 -11 -107 -16.3%
Sales and marketing expenses -203 -87 5 5 -280 2.6%
Administrative expenses -76 5 2 -7 -77 -11.9%
Other operating income/(expenses) 23 - - -11 11 -49.7%
Normalized EBIT 66 58 -3 70 191 -
Normalized EBITDA 173 84 -6 90 340 51.7%
Normalized EBITDA margin 20.1% 26.3% 645 bp
Global Export and Holding
Companies
1Q14 Scope Currency
translation
Organic
growth
1Q15 Organic
growth
Total volumes (thousand hls) 3 712 -2 209 - 2 1 504 0.1%
Revenue 484 -36 -33 68 483 15.2%
Cost of sales -334 18 27 -50 -339 -15.8%
Gross profit 150 -19 -6 18 144 13.8%
Distribution expenses -38 2 -4 -10 -50 -27.2%
Sales and marketing expenses -68 1 8 8 -51 11.6%
Administrative expenses -111 - 8 5 -97 4.6%
Other operating income/(expenses) 10 -2 -1 1 8 19.0%
Normalized EBIT -56 -18 5 23 -46 30.6%
Normalized EBITDA -18 -18 1 24 -10 68.9%