Embed Size (px)
Citation preview
PRESS RELEASE
Brussels, 30 October 2015 – 1 / 20
The enclosed information constitutes regulated information as defined in the Belgian Royal Decree of 14 November 2007 regarding the duties of issuers of financial instruments which have been admitted for trading on a regulated market.
Anheuser-Busch InBev reports Third Quarter and
Nine Months 2015 Results
Highlights
Except where otherwise stated, the comments below are based on organic figures and refer to 3Q15 and 9M15 versus the same period of last year. For important notes and disclaimers please refer to page 15.
Revenue: Revenue grew by 7.9% in 3Q15, with solid revenue per hl growth of 6.3%, driven by our revenue management and premiumization initiatives. On a constant geographic basis, revenue per hl grew by 7.8%. In 9M15, revenue grew by 6.1% with revenue per hl growth of 6.7%. On a constant geographic basis revenue per hl grew by 7.3%
Volume: Total volumes grew by 1.5% in 3Q15, with own beer volumes up 2.3%, and non-beer volumes down 6.1%. The growth in beer volumes was driven mainly by strong performances in Mexico and Latin America North, as well as an easier comparable in the US. In 9M15, total volumes declined by 0.6%, with own beer volumes down 0.2% and non-beer volumes down 4.0%
Focus Brands: Volumes of our Focus Brands grew by 2.9% in 3Q15, driven by strong performances in Mexico, Canada, China and the UK, and by 0.3% in 9M15. Volumes of our three global brands grew by
11.5% in the quarter, with Budweiser up 11.5%, Corona up 11.1% and Stella Artois up 12.9%. Volumes of our global brands grew by 7.6% in 9M15. Global brand revenues grew by 15.9% in 3Q15 and by 12.5% in 9M15
Cost of Sales (CoS): CoS increased by 3.2% in 3Q15 and by 1.7% on a per hl basis. On a constant geographic basis, CoS per hl increased by 3.1% in the quarter. In 9M15 CoS grew 4.2% and by 4.9%
on a per hl basis. On a constant geographic basis, CoS per hl increased by 5.3% in 9M15 EBITDA grew by 9.6% in 3Q15 to 4 403 million USD with a margin expansion of 58 bps, driven
mainly by the strong top line result and a good cost of sales performance. In 9M15, EBITDA grew by 8.3% with EBITDA margin expansion of 78 bps
Net finance results: Net finance costs (excluding non-recurring net finance results) were 810 million USD in 3Q15 compared to 366 million USD in 3Q14. This increase was driven primarily by other financial results which includes a negative mark-to-market adjustment of 585 million USD, linked to the hedging of our share-based payment programs, compared to a gain of 144 million USD in 3Q14, partially offset by positive currency results and lower interest expenses. Net finance costs were
1 273 million USD in 9M15 compared to 1 614 million USD in 9M14 Income taxes: Income tax in 3Q15 was 795 million USD with a normalized effective tax rate (ETR) of
26.8%, compared to an income tax expense of 684 million USD in 3Q14 and a normalized ETR of 19.7%. This increase was driven by the negative impact of the mark-to-market adjustment linked to the hedging of our share-based payment programs. The normalized ETR was 20.5% in 9M15
compared to 18.9% in 9M14
Profit: Normalized profit attributable to equity holders of AB InBev was 1 673 million USD in 3Q15 compared to 2 315 million USD in 3Q14, with organic EBITDA growth being more than offset by unfavorable currency translation, and higher net finance results. Normalized profit attributable to equity holders of AB InBev was 5 952 million USD in 9M15, compared to 6 345 million USD in 9M14
Earnings per share: Normalized earnings per share (EPS) decreased to 1.02 USD in 3Q15 from 1.42 USD in 3Q14, and decreased to 3.63 USD in 9M15 from 3.89 USD in 9M14
Interim Dividend: The AB InBev board has approved an interim dividend of 1.60 EUR per share for the fiscal year 2015. The shares will trade ex-coupon as of 12 November 2015, and dividends will be payable as from 16 November 2015. The record date will be 13 November 2015
Proposed combination with SABMiller: On 13 October 2015, the boards of AB InBev and SABMiller announced that they had reached an agreement in principle on the key terms of a possible recommended offer to be made by AB InBev for the entire issued and to be issued share capital of SABMiller
PRESS RELEASE
Brussels, 30 October 2015 – 2 / 20
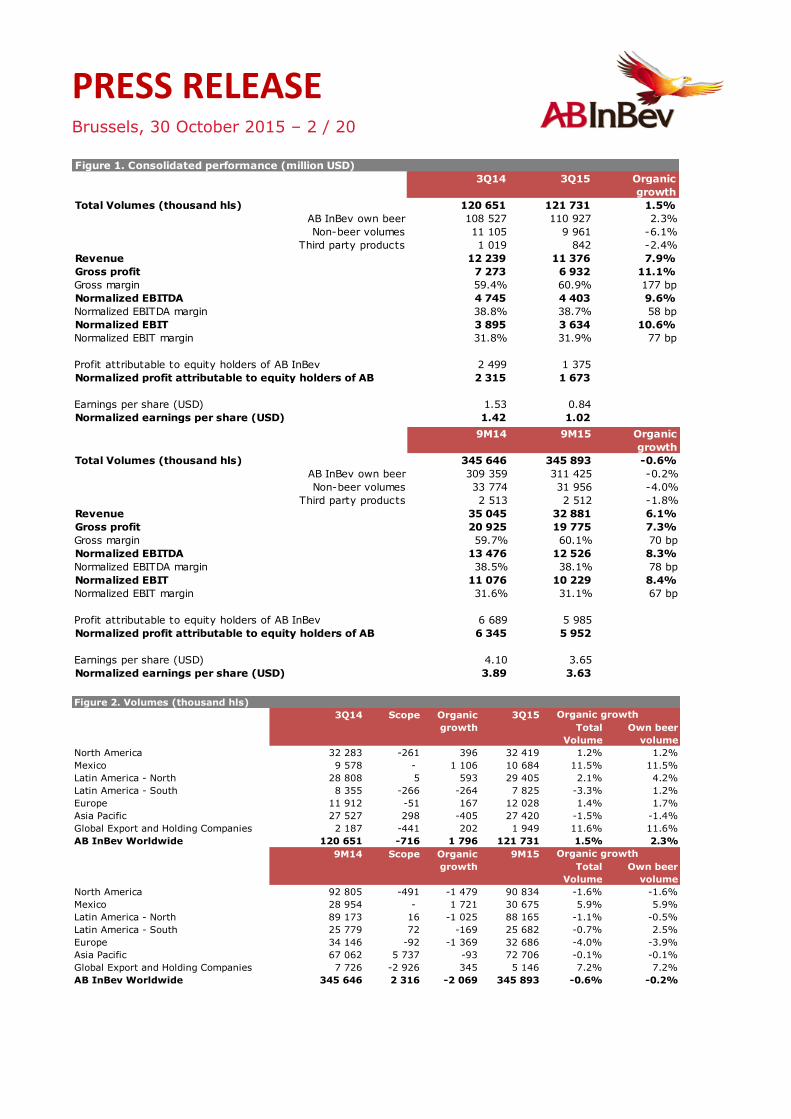
Figure 1. Consolidated performance (million USD)
3Q14 3Q15 Organic
growth
Total Volumes (thousand hls) 120 651 121 731 1.5%
AB InBev own beer 108 527 110 927 2.3%
Non-beer volumes 11 105 9 961 -6.1%
Third party products 1 019 842 -2.4%
Revenue 12 239 11 376 7.9%
Gross profit 7 273 6 932 11.1%
Gross margin 59.4% 60.9% 177 bp
Normalized EBITDA 4 745 4 403 9.6%
Normalized EBITDA margin 38.8% 38.7% 58 bp
Normalized EBIT 3 895 3 634 10.6%
Normalized EBIT margin 31.8% 31.9% 77 bp
Profit attributable to equity holders of AB InBev 2 499 1 375
Normalized profit attributable to equity holders of AB 2 315 1 673
Earnings per share (USD) 1.53 0.84
Normalized earnings per share (USD) 1.42 1.02
9M14 9M15 Organic
growth
Total Volumes (thousand hls) 345 646 345 893 -0.6%
AB InBev own beer 309 359 311 425 -0.2%
Non-beer volumes 33 774 31 956 -4.0%
Third party products 2 513 2 512 -1.8%
Revenue 35 045 32 881 6.1%
Gross profit 20 925 19 775 7.3%
Gross margin 59.7% 60.1% 70 bp
Normalized EBITDA 13 476 12 526 8.3%
Normalized EBITDA margin 38.5% 38.1% 78 bp
Normalized EBIT 11 076 10 229 8.4%
Normalized EBIT margin 31.6% 31.1% 67 bp
Profit attributable to equity holders of AB InBev 6 689 5 985
Normalized profit attributable to equity holders of AB 6 345 5 952
Earnings per share (USD) 4.10 3.65
Normalized earnings per share (USD) 3.89 3.63
Figure 2. Volumes (thousand hls)
3Q14 Scope Organic 3Q15
growth Total
Volume
Own beer
volume
North America 32 283 -261 396 32 419 1.2% 1.2%
Mexico 9 578 - 1 106 10 684 11.5% 11.5%
Latin America - North 28 808 5 593 29 405 2.1% 4.2%
Latin America - South 8 355 -266 -264 7 825 -3.3% 1.2%
Europe 11 912 -51 167 12 028 1.4% 1.7%
Asia Pacific 27 527 298 -405 27 420 -1.5% -1.4%
Global Export and Holding Companies 2 187 -441 202 1 949 11.6% 11.6%
AB InBev Worldwide 120 651 -716 1 796 121 731 1.5% 2.3%
Organic growth
9M14 Scope Organic 9M15
growth Total
Volume
Own beer
volume
North America 92 805 -491 -1 479 90 834 -1.6% -1.6%
Mexico 28 954 - 1 721 30 675 5.9% 5.9%
Latin America - North 89 173 16 -1 025 88 165 -1.1% -0.5%
Latin America - South 25 779 72 -169 25 682 -0.7% 2.5%
Europe 34 146 -92 -1 369 32 686 -4.0% -3.9%
Asia Pacific 67 062 5 737 -93 72 706 -0.1% -0.1%
Global Export and Holding Companies 7 726 -2 926 345 5 146 7.2% 7.2%
AB InBev Worldwide 345 646 2 316 -2 069 345 893 -0.6% -0.2%
Organic growth
PRESS RELEASE
Brussels, 30 October 2015 – 3 / 20
MANAGEMENT COMMENTS
We delivered solid EBITDA growth of 9.6% in the third quarter, with EBITDA margin up 58 bps to 38.7%. This result was driven by a robust top line performance, as well as the benefit of a favorable comparable
following a very challenging 3Q14 when our results were affected by several one-off events in the US, Brazil and Mexico. Strong topline growth of 7.9% during the quarter was driven by revenue per hl growth of 6.3%, and good volume growth in the US, Mexico and Latin America North. We are particularly pleased with the performance of our Global Brands which delivered double digit volume and revenue growth.
Highlights of the quarter include:
(i) Our three global brands delivered very strong results, with volumes increasing by 11.5%, and revenue growth of 15.9%. Stella Artois volumes grew by 12.9%, driven by good performances in the UK, the US, Canada and Argentina. Budweiser volumes grew by 11.5%, with particularly strong growth in China, Russia, the US and the UK, while Corona volumes grew by 11.1%, driven by growth in Mexico and most of our export markets.
(ii) In the US, sales-to-wholesalers (STWs) grew by 1.2%, while sales-to-retailers (STRs) were down
by 2.1%. Increased investments behind Stella Artois, Budweiser, Michelob Ultra and Goose Island are delivering good results, while volumes of Bud Light, the Rita’s family and our value brands remain under pressure. Revenue per hectoliter growth of 1.5% was driven by favorable brand mix.
(iii) Mexico delivered a very strong quarter with volumes up 11.5%, and revenue up 14.2%, led by Corona, Bud Light and Victoria. The beer category in Mexico remains very healthy.
(iv) Our beer volumes in Brazil grew by 3.5%, despite an unfavorable macroeconomic environment,
with total top line growth of 10.5%. (v) In China, top line growth was 6.6%, despite a 1.3% decline in volumes driven by challenging
economic headwinds and poor weather, which led to a late start to the summer. Nevertheless, we estimate that we gained 104 bps of share during the quarter, primarily driven by Budweiser.
(vi) Our own beer volumes in Europe were up 1.7% and in Western Europe up 7.7%. We estimate that two-thirds of this growth was driven by organic growth from our Focus Brands, especially in France, Italy, the Netherlands, Belgium and the UK, with the remainder due to an easier
comparable related to inventory adjustments following the 2014 FIFA World Cup.
As previously communicated, we expect an acceleration in the growth of our sales and marketing investments in the second half of the year, with an increase of 13.7% during the third quarter. We remain committed to investing in building our brands and global platforms in line with our strategy to accelerate
top line growth, and continue to expect an increase in sales and marketing investments in FY15 of mid to high single digits. On 13 October 2015, the boards of AB InBev and SABMiller announced that they had reached an agreement in principle on the key terms of a possible recommended offer to be made by AB InBev for the entire issued and to be issued share capital of SABMiller (the “Possible Offer”). Under the terms of the Possible Offer, SABMiller shareholders would be entitled to receive GBP 44.00 per share in cash, with a partial share
alternative available for approximately 41% of the SABMiller shares.
PRESS RELEASE
Brussels, 30 October 2015 – 4 / 20
2015 OUTLOOK
(i) Volume and Revenue:
In the US: We expect industry volumes to improve in FY15 compared to FY14. We expect our
own STWs and STRs to converge on a full year basis In Mexico: We expect beer industry volumes to continue to grow in FY15, driven by the economy
and our own commercial initiatives In Brazil: We expect our net revenues to grow by mid to high single digits, helped by continuing
growth in premium In China: Given economic headwinds and poor summer weather, we no longer expect industry
volumes to return to growth in the second half of the year. However, we expect that our own
brand portfolio, which is focused on the core plus, premium and super premium segments of the industry, which are growing, will continue to perform better than the industry in FY15. We expect our revenue per hl to continue to be driven by favorable brand mix
Total AB InBev: We are amending our guidance. Our previous guidance was for revenue per hl to grow organically in line with inflation, on a constant geographic basis, as a result of our revenue management initiatives and continued improvements in mix. We now expect revenue per hl will grow ahead of inflation due to higher than expected premium brand volumes
(ii) Cost of Sales per hl: We are amending our guidance. Our previous guidance was for CoS per hl to increase by low single digits on a constant geographic basis. We now expect CoS per hl to grow by low to mid-single digits due to higher than expected premium brand volumes. We expect this increase to be more than offset by increased revenue per hl
(iii) Distribution expenses per hl: We expect distribution expenses per hl to increase organically by mid-single digits
(iv) Sales and Marketing investments: We expect sales and marketing investments to grow by mid to high single digits as we continue to invest behind our brands and global platforms for the long term
(v) Net Finance Costs: We expect the average coupon on net debt to be in the range of 3.5% to 4.0% in FY15. Net pension interest expense and accretion expenses are expected to be approximately 35 and 80 million USD per quarter, respectively. Other financial results will continue to be impacted by any gains and losses related to the hedging of our share-based payment programs
(vi) Effective Tax Rate: We expect the normalized ETR in FY15 to be in the range of 20% to 22%. We expect the normalized ETR to be in the range of 22% to 25% in the period 2016-2018, and in the range of 25% to 27% thereafter. Our normalized ETR guidance continues to exclude the impact of any future gains and losses related to the hedging of our share-based payment programs
(vii) Net Capital Expenditure: We expect net capital expenditure of approximately 4.3 billion USD in FY15, driven by investments in our consumer and commercial initiatives, and capacity expansion
(viii) Debt: Our optimal capital structure remains a net debt to EBITDA ratio of around 2x. Approximately
one third of AB InBev’s gross debt is denominated in currencies other than the US dollar, principally
the Euro
PRESS RELEASE
Brussels, 30 October 2015 – 5 / 20
BUSINESS REVIEW
United States
Key performance indicators
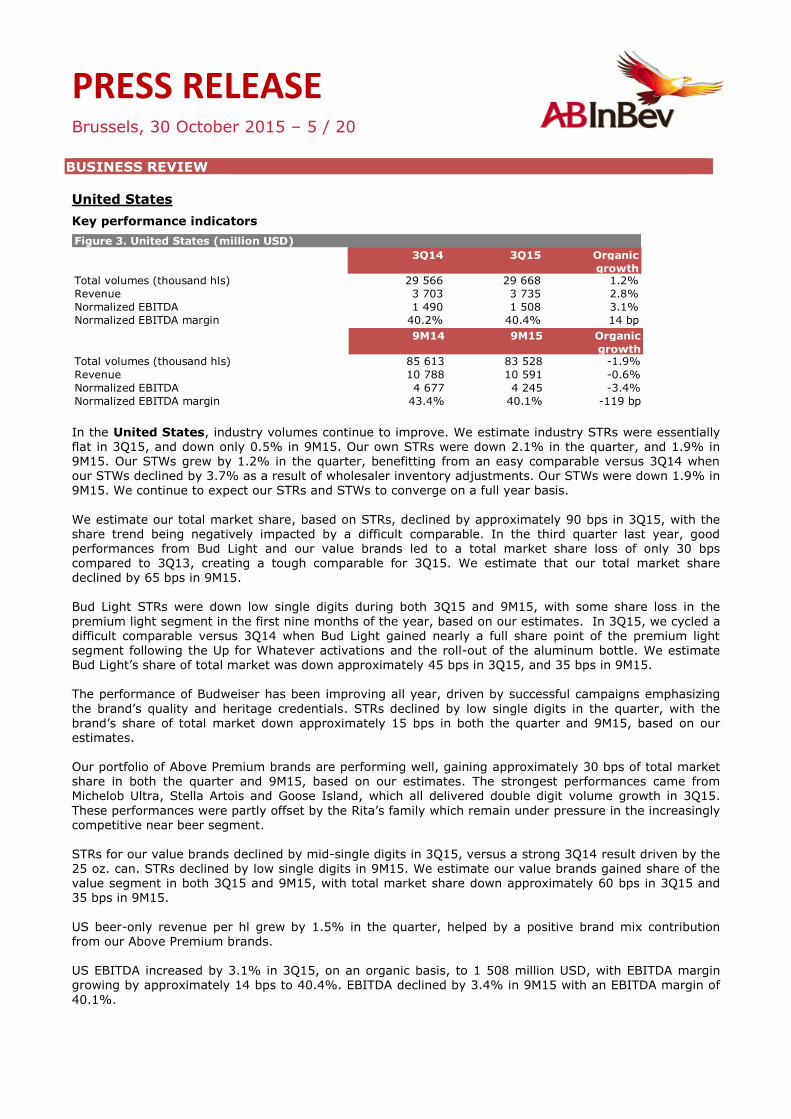
In the United States, industry volumes continue to improve. We estimate industry STRs were essentially flat in 3Q15, and down only 0.5% in 9M15. Our own STRs were down 2.1% in the quarter, and 1.9% in 9M15. Our STWs grew by 1.2% in the quarter, benefitting from an easy comparable versus 3Q14 when our STWs declined by 3.7% as a result of wholesaler inventory adjustments. Our STWs were down 1.9% in 9M15. We continue to expect our STRs and STWs to converge on a full year basis.
We estimate our total market share, based on STRs, declined by approximately 90 bps in 3Q15, with the share trend being negatively impacted by a difficult comparable. In the third quarter last year, good performances from Bud Light and our value brands led to a total market share loss of only 30 bps compared to 3Q13, creating a tough comparable for 3Q15. We estimate that our total market share declined by 65 bps in 9M15. Bud Light STRs were down low single digits during both 3Q15 and 9M15, with some share loss in the
premium light segment in the first nine months of the year, based on our estimates. In 3Q15, we cycled a difficult comparable versus 3Q14 when Bud Light gained nearly a full share point of the premium light segment following the Up for Whatever activations and the roll-out of the aluminum bottle. We estimate Bud Light’s share of total market was down approximately 45 bps in 3Q15, and 35 bps in 9M15. The performance of Budweiser has been improving all year, driven by successful campaigns emphasizing
the brand’s quality and heritage credentials. STRs declined by low single digits in the quarter, with the
brand’s share of total market down approximately 15 bps in both the quarter and 9M15, based on our estimates. Our portfolio of Above Premium brands are performing well, gaining approximately 30 bps of total market share in both the quarter and 9M15, based on our estimates. The strongest performances came from Michelob Ultra, Stella Artois and Goose Island, which all delivered double digit volume growth in 3Q15.
These performances were partly offset by the Rita’s family which remain under pressure in the increasingly competitive near beer segment. STRs for our value brands declined by mid-single digits in 3Q15, versus a strong 3Q14 result driven by the 25 oz. can. STRs declined by low single digits in 9M15. We estimate our value brands gained share of the value segment in both 3Q15 and 9M15, with total market share down approximately 60 bps in 3Q15 and 35 bps in 9M15.
US beer-only revenue per hl grew by 1.5% in the quarter, helped by a positive brand mix contribution
from our Above Premium brands. US EBITDA increased by 3.1% in 3Q15, on an organic basis, to 1 508 million USD, with EBITDA margin growing by approximately 14 bps to 40.4%. EBITDA declined by 3.4% in 9M15 with an EBITDA margin of
40.1%.
Figure 3. United States (million USD)
3Q14 3Q15 Organic
growthTotal volumes (thousand hls) 29 566 29 668 1.2%
Revenue 3 703 3 735 2.8%
Normalized EBITDA 1 490 1 508 3.1%
Normalized EBITDA margin 40.2% 40.4% 14 bp
9M14 9M15 Organic
growthTotal volumes (thousand hls) 85 613 83 528 -1.9%
Revenue 10 788 10 591 -0.6%
Normalized EBITDA 4 677 4 245 -3.4%
Normalized EBITDA margin 43.4% 40.1% -119 bp
PRESS RELEASE
Brussels, 30 October 2015 – 6 / 20
Mexico
Key performance indicators
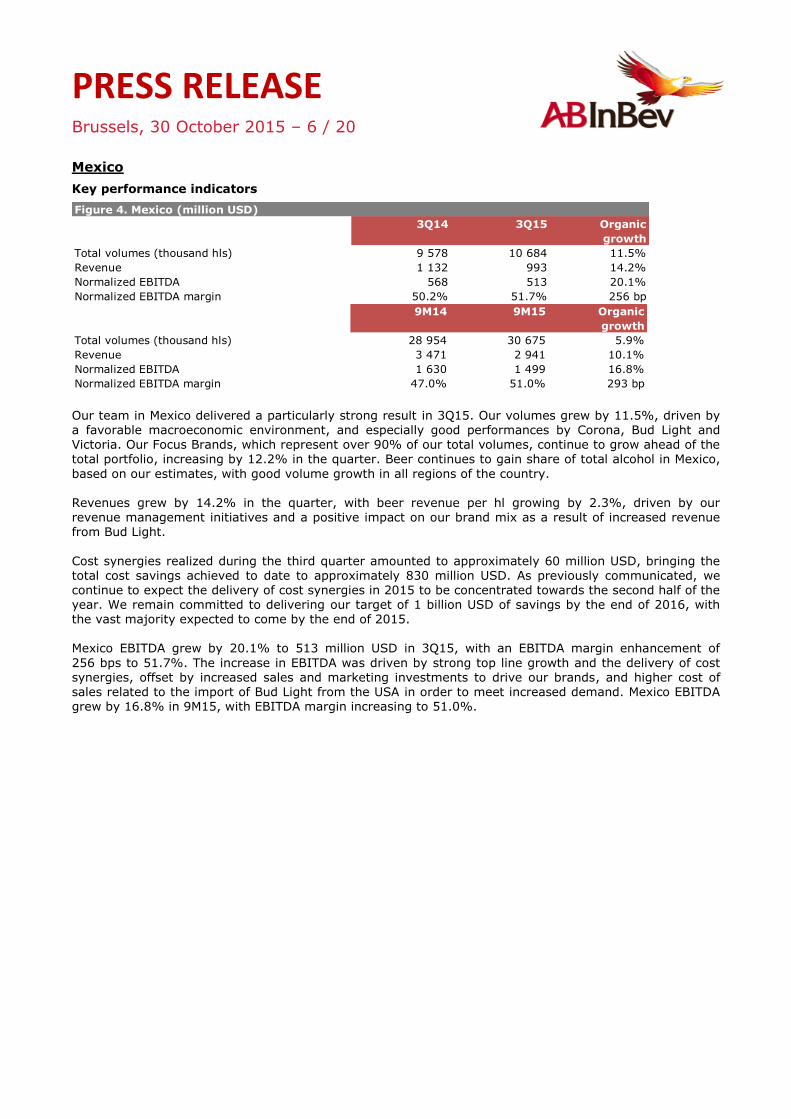
Our team in Mexico delivered a particularly strong result in 3Q15. Our volumes grew by 11.5%, driven by a favorable macroeconomic environment, and especially good performances by Corona, Bud Light and Victoria. Our Focus Brands, which represent over 90% of our total volumes, continue to grow ahead of the total portfolio, increasing by 12.2% in the quarter. Beer continues to gain share of total alcohol in Mexico,
based on our estimates, with good volume growth in all regions of the country. Revenues grew by 14.2% in the quarter, with beer revenue per hl growing by 2.3%, driven by our
revenue management initiatives and a positive impact on our brand mix as a result of increased revenue from Bud Light.
Cost synergies realized during the third quarter amounted to approximately 60 million USD, bringing the total cost savings achieved to date to approximately 830 million USD. As previously communicated, we continue to expect the delivery of cost synergies in 2015 to be concentrated towards the second half of the year. We remain committed to delivering our target of 1 billion USD of savings by the end of 2016, with the vast majority expected to come by the end of 2015. Mexico EBITDA grew by 20.1% to 513 million USD in 3Q15, with an EBITDA margin enhancement of
256 bps to 51.7%. The increase in EBITDA was driven by strong top line growth and the delivery of cost synergies, offset by increased sales and marketing investments to drive our brands, and higher cost of sales related to the import of Bud Light from the USA in order to meet increased demand. Mexico EBITDA grew by 16.8% in 9M15, with EBITDA margin increasing to 51.0%.
Figure 4. Mexico (million USD)
3Q14 3Q15 Organic
growth
Total volumes (thousand hls) 9 578 10 684 11.5%
Revenue 1 132 993 14.2%
Normalized EBITDA 568 513 20.1%
Normalized EBITDA margin 50.2% 51.7% 256 bp
9M14 9M15 Organic
growth
Total volumes (thousand hls) 28 954 30 675 5.9%
Revenue 3 471 2 941 10.1%
Normalized EBITDA 1 630 1 499 16.8%
Normalized EBITDA margin 47.0% 51.0% 293 bp
PRESS RELEASE
Brussels, 30 October 2015 – 7 / 20
Brazil
Key performance indicators
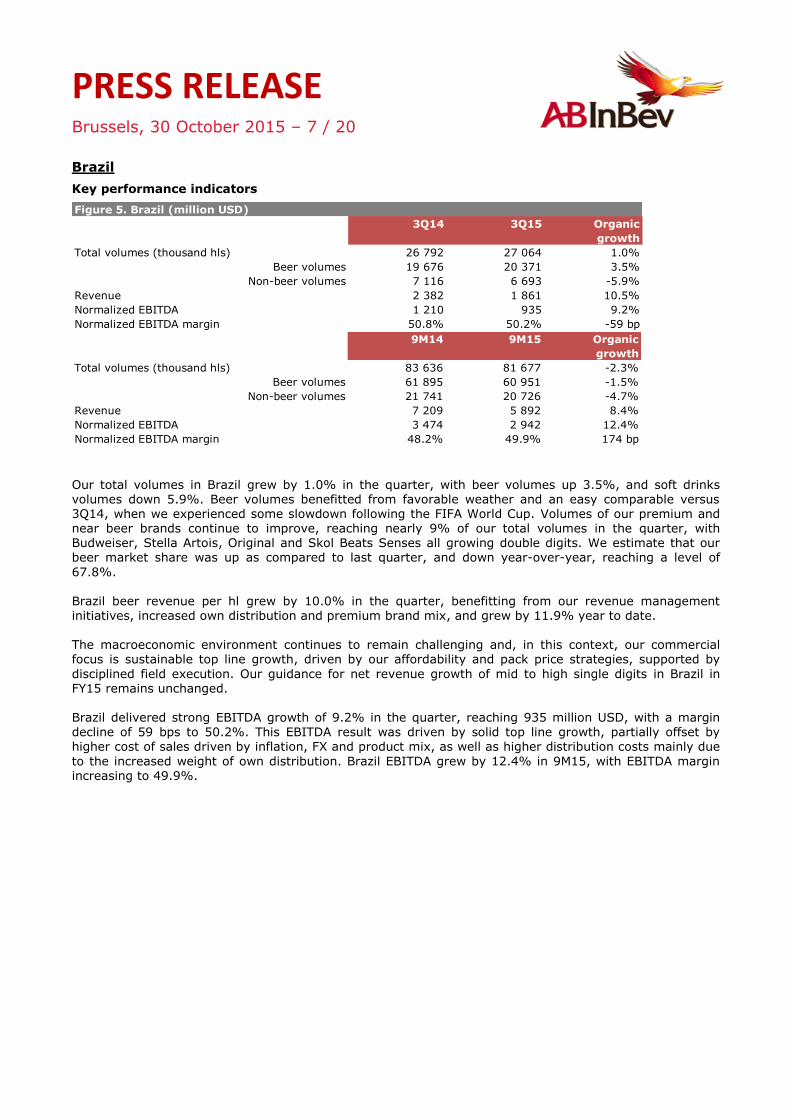
Our total volumes in Brazil grew by 1.0% in the quarter, with beer volumes up 3.5%, and soft drinks volumes down 5.9%. Beer volumes benefitted from favorable weather and an easy comparable versus 3Q14, when we experienced some slowdown following the FIFA World Cup. Volumes of our premium and
near beer brands continue to improve, reaching nearly 9% of our total volumes in the quarter, with Budweiser, Stella Artois, Original and Skol Beats Senses all growing double digits. We estimate that our beer market share was up as compared to last quarter, and down year-over-year, reaching a level of
67.8%. Brazil beer revenue per hl grew by 10.0% in the quarter, benefitting from our revenue management initiatives, increased own distribution and premium brand mix, and grew by 11.9% year to date. The macroeconomic environment continues to remain challenging and, in this context, our commercial focus is sustainable top line growth, driven by our affordability and pack price strategies, supported by
disciplined field execution. Our guidance for net revenue growth of mid to high single digits in Brazil in FY15 remains unchanged. Brazil delivered strong EBITDA growth of 9.2% in the quarter, reaching 935 million USD, with a margin
decline of 59 bps to 50.2%. This EBITDA result was driven by solid top line growth, partially offset by higher cost of sales driven by inflation, FX and product mix, as well as higher distribution costs mainly due
to the increased weight of own distribution. Brazil EBITDA grew by 12.4% in 9M15, with EBITDA margin increasing to 49.9%.
Figure 5. Brazil (million USD)
3Q14 3Q15 Organic
growth
Total volumes (thousand hls) 26 792 27 064 1.0%
Beer volumes 19 676 20 371 3.5%
Non-beer volumes 7 116 6 693 -5.9%
Revenue 2 382 1 861 10.5%
Normalized EBITDA 1 210 935 9.2%
Normalized EBITDA margin 50.8% 50.2% -59 bp
9M14 9M15 Organic
growth
Total volumes (thousand hls) 83 636 81 677 -2.3%
Beer volumes 61 895 60 951 -1.5%
Non-beer volumes 21 741 20 726 -4.7%
Revenue 7 209 5 892 8.4%
Normalized EBITDA 3 474 2 942 12.4%
Normalized EBITDA margin 48.2% 49.9% 174 bp
PRESS RELEASE
Brussels, 30 October 2015 – 8 / 20
China
Key performance indicators
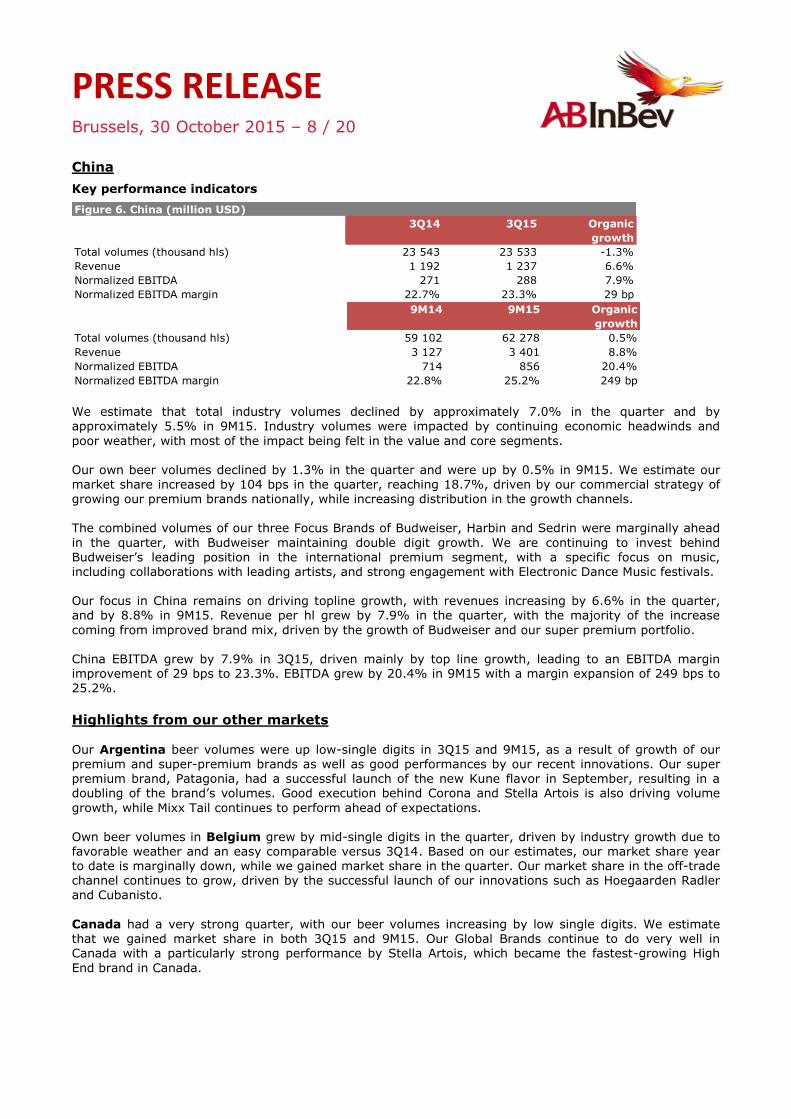
We estimate that total industry volumes declined by approximately 7.0% in the quarter and by approximately 5.5% in 9M15. Industry volumes were impacted by continuing economic headwinds and
poor weather, with most of the impact being felt in the value and core segments. Our own beer volumes declined by 1.3% in the quarter and were up by 0.5% in 9M15. We estimate our market share increased by 104 bps in the quarter, reaching 18.7%, driven by our commercial strategy of growing our premium brands nationally, while increasing distribution in the growth channels.
The combined volumes of our three Focus Brands of Budweiser, Harbin and Sedrin were marginally ahead
in the quarter, with Budweiser maintaining double digit growth. We are continuing to invest behind Budweiser’s leading position in the international premium segment, with a specific focus on music, including collaborations with leading artists, and strong engagement with Electronic Dance Music festivals. Our focus in China remains on driving topline growth, with revenues increasing by 6.6% in the quarter, and by 8.8% in 9M15. Revenue per hl grew by 7.9% in the quarter, with the majority of the increase
coming from improved brand mix, driven by the growth of Budweiser and our super premium portfolio. China EBITDA grew by 7.9% in 3Q15, driven mainly by top line growth, leading to an EBITDA margin improvement of 29 bps to 23.3%. EBITDA grew by 20.4% in 9M15 with a margin expansion of 249 bps to 25.2%.
Highlights from our other markets Our Argentina beer volumes were up low-single digits in 3Q15 and 9M15, as a result of growth of our premium and super-premium brands as well as good performances by our recent innovations. Our super premium brand, Patagonia, had a successful launch of the new Kune flavor in September, resulting in a doubling of the brand’s volumes. Good execution behind Corona and Stella Artois is also driving volume
growth, while Mixx Tail continues to perform ahead of expectations. Own beer volumes in Belgium grew by mid-single digits in the quarter, driven by industry growth due to favorable weather and an easy comparable versus 3Q14. Based on our estimates, our market share year to date is marginally down, while we gained market share in the quarter. Our market share in the off-trade channel continues to grow, driven by the successful launch of our innovations such as Hoegaarden Radler and Cubanisto.
Canada had a very strong quarter, with our beer volumes increasing by low single digits. We estimate
that we gained market share in both 3Q15 and 9M15. Our Global Brands continue to do very well in Canada with a particularly strong performance by Stella Artois, which became the fastest-growing High
End brand in Canada.
Figure 6. China (million USD)
3Q14 3Q15 Organic
growth
Total volumes (thousand hls) 23 543 23 533 -1.3%
Revenue 1 192 1 237 6.6%
Normalized EBITDA 271 288 7.9%
Normalized EBITDA margin 22.7% 23.3% 29 bp
9M14 9M15 Organic
growth
Total volumes (thousand hls) 59 102 62 278 0.5%
Revenue 3 127 3 401 8.8%
Normalized EBITDA 714 856 20.4%
Normalized EBITDA margin 22.8% 25.2% 249 bp

PRESS RELEASE
Brussels, 30 October 2015 – 9 / 20
In Germany, own beer volumes grew by low-single digits in the quarter, due to a growing industry driven by favorable weather, and an easy comparable versus 3Q14. We estimate our market share year to date, for which data is available, is essentially flat, supported by our Beck’s and Franziskaner innovations. In South Korea, beer volumes were down low-single digits in the quarter, due to an estimated market
share loss in a very competitive environment. As part of our summer campaign we activated Cass through events such as the Electronic Dance Music festival in Seoul. In the United Kingdom, our own products grew double digits in 3Q15, driven by a strong performance in the off-trade channel. We estimate that we gained share in the quarter and year to date, driven by our
Stella Artois and Corona activations.
PRESS RELEASE
Brussels, 30 October 2015 – 10 / 20
CONSOLIDATED INCOME STATEMENT
Figure 7. Consolidated income statement (million USD)
3Q14 3Q15 Organic
growth
Revenue 12 239 11 376 7.9%
Cost of sales -4 966 -4 444 -3.2%
Gross profit 7 273 6 932 11.1%
Distribution expenses -1 199 -1 089 -7.3%
Sales and marketing expenses -1 809 -1 823 -13.7%
Administrative expenses -651 -615 -14.9%
Other operating income/(expenses) 281 229 11.6%
Normalized profit from operations
(normalized EBIT) 3 895 3 634 10.6%
Non-recurring items above EBIT 66 66
Net finance income/(cost) -366 -810
Non-recurring net finance income/(cost) 103 -327
Share of results of associates 2 4
Income tax expense -684 -795
Profit 3 016 1 772
Profit attributable to non-controlling
interest 517 397
Profit attributable to equity holders of AB
InBev 2 499 1 375
Normalized EBITDA 4 745 4 403 9.6%
Normalized profit attributable to equity
holders of AB InBev 2 315 1 673
9M14 9M15 Organic
growth
Revenue 35 045 32 881 6.1%
Cost of sales -14 120 -13 106 -4.2%
Gross profit 20 925 19 775 7.3%
Distribution expenses -3 424 -3 214 -7.7%
Sales and marketing expenses -5 415 -5 166 -5.4%
Administrative expenses -2 010 -1 878 -10.5%
Other operating income/(expenses) 1 000 712 19.0%
Normalized profit from operations
(normalized EBIT) 11 076 10 229 8.4%
Non-recurring items above EBIT -40 77
Net finance income/(cost) -1 614 -1 273
Non-recurring net finance income/(cost) 341 8
Share of results of associates 13 12
Income tax expense -1 750 -1 920
Profit 8 026 7 133
Profit attributable to non-controlling
interest 1 337 1 148
Profit attributable to equity holders of AB
InBev 6 689 5 985
Normalized EBITDA 13 476 12 526 8.3%
Normalized profit attributable to equity
holders of AB InBev 6 345 5 952
PRESS RELEASE
Brussels, 30 October 2015 – 11 / 20
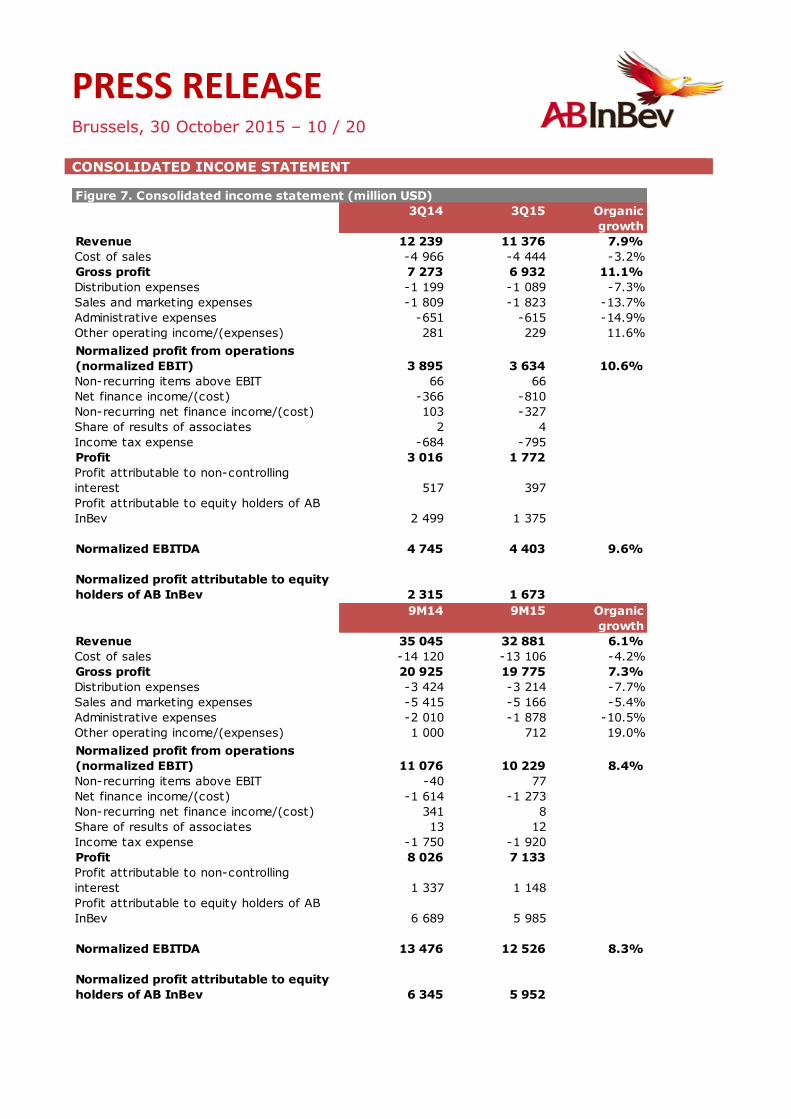
Revenue Consolidated revenue grew by 7.9% in 3Q15, with revenue per hl growth of 6.3%. This result was driven by our revenue management initiatives and brand mix, as we continue to implement our premiumization strategies. On a constant geographic basis, revenue per hl grew by 7.8%. In 9M15, revenue grew by 6.1% with revenue per hl growth of 6.7%. On a constant geographic basis revenue per hl grew by 7.3%.
Cost of Sales (CoS) Total CoS increased by 3.2% in 3Q15, and by 1.7% on a per hl basis. This increase was driven primarily by unfavorable foreign exchange transactional impacts, higher depreciation from recent investments, and product mix, mainly driven by the increased weight of premium products in Brazil. These increases were
partly offset by procurement savings and the benefit of an easy comparable due to incremental packaging costs in Mexico in 3Q14. On a constant geographic basis, CoS per hl increased by 3.1%. In 9M15, CoS increased by 4.2%, with a CoS per hl increase of 4.9%, and 5.3% on a constant geographic basis.
Distribution expenses Distribution expenses grew by 7.3% and by 5.7% on a per hl basis in 3Q15. This increase was driven mainly by increased own distribution in Brazil, which is more than offset by the increase in net revenues, the growth of our premium and near beer brands in Brazil, and inflationary increases in Latin America South. Distribution expenses increased by 7.7% in 9M15 and by 8.4% on a per hl basis.
Sales and marketing investments Sales and marketing investments increased by 13.7% in 3Q15 with increased support for our brands, innovations and sales activations in most Zones. The increased investments included further support for the growth of our Global Brands and our premiumization initiatives. Sales and Marketing investments increased by 5.4% in 9M15.
Administrative expenses Administrative expenses increased by 14.9% in 3Q15 due mainly to the timing of variable compensation accruals. In 9M15, administrative expenses increased by 10.5%. Other operating income Other operating income grew by 11.6% in 3Q15, on an organic basis, to 229 million USD in 3Q15. Other operating income increased by 19% in 9M15, on an organic basis.
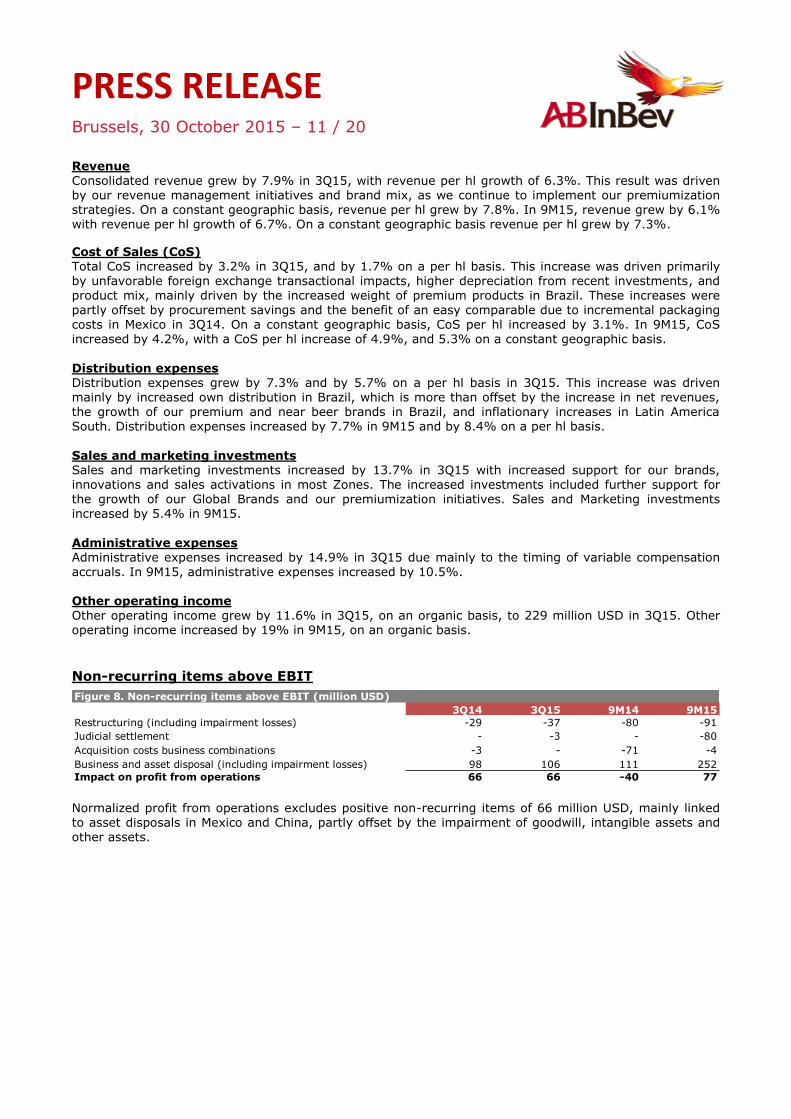
Non-recurring items above EBIT
Normalized profit from operations excludes positive non-recurring items of 66 million USD, mainly linked to asset disposals in Mexico and China, partly offset by the impairment of goodwill, intangible assets and other assets.
Figure 8. Non-recurring items above EBIT (million USD)
3Q14 3Q15 9M14 9M15
Restructuring (including impairment losses) -29 -37 -80 -91
Judicial settlement - -3 - -80
Acquisition costs business combinations -3 - -71 -4
Business and asset disposal (including impairment losses) 98 106 111 252
Impact on profit from operations 66 66 -40 77
PRESS RELEASE
Brussels, 30 October 2015 – 12 / 20
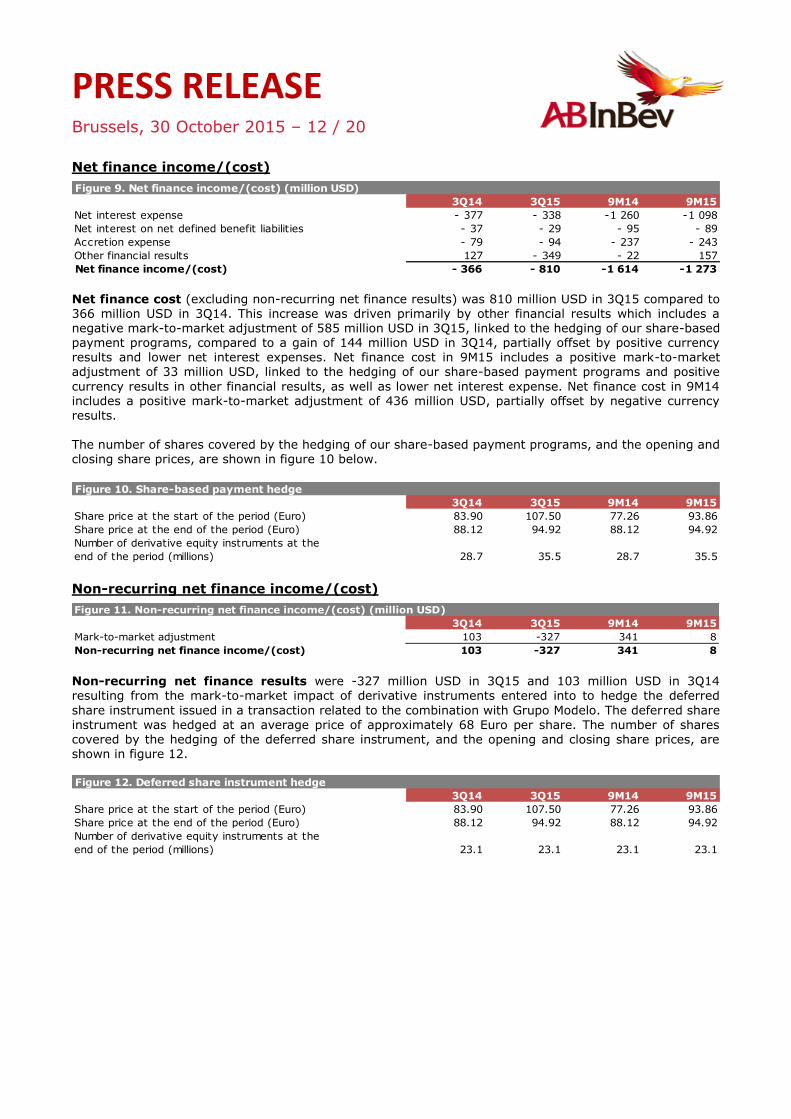
Net finance income/(cost)
Net finance cost (excluding non-recurring net finance results) was 810 million USD in 3Q15 compared to
366 million USD in 3Q14. This increase was driven primarily by other financial results which includes a negative mark-to-market adjustment of 585 million USD in 3Q15, linked to the hedging of our share-based payment programs, compared to a gain of 144 million USD in 3Q14, partially offset by positive currency results and lower net interest expenses. Net finance cost in 9M15 includes a positive mark-to-market adjustment of 33 million USD, linked to the hedging of our share-based payment programs and positive
currency results in other financial results, as well as lower net interest expense. Net finance cost in 9M14 includes a positive mark-to-market adjustment of 436 million USD, partially offset by negative currency results. The number of shares covered by the hedging of our share-based payment programs, and the opening and closing share prices, are shown in figure 10 below.
Non-recurring net finance income/(cost)
Non-recurring net finance results were -327 million USD in 3Q15 and 103 million USD in 3Q14 resulting from the mark-to-market impact of derivative instruments entered into to hedge the deferred
share instrument issued in a transaction related to the combination with Grupo Modelo. The deferred share
instrument was hedged at an average price of approximately 68 Euro per share. The number of shares covered by the hedging of the deferred share instrument, and the opening and closing share prices, are shown in figure 12.
Figure 9. Net finance income/(cost) (million USD)
3Q14 3Q15 9M14 9M15
Net interest expense - 377 - 338 -1 260 -1 098
Net interest on net defined benefit liabilities - 37 - 29 - 95 - 89
Accretion expense - 79 - 94 - 237 - 243
Other financial results 127 - 349 - 22 157
Net finance income/(cost) - 366 - 810 -1 614 -1 273
Figure 10. Share-based payment hedge
3Q14 3Q15 9M14 9M15
Share price at the start of the period (Euro) 83.90 107.50 77.26 93.86
Share price at the end of the period (Euro) 88.12 94.92 88.12 94.92
Number of derivative equity instruments at the
end of the period (millions) 28.7 35.5 28.7 35.5
Figure 11. Non-recurring net finance income/(cost) (million USD)
3Q14 3Q15 9M14 9M15
Mark-to-market adjustment 103 -327 341 8
Non-recurring net finance income/(cost) 103 -327 341 8
Figure 12. Deferred share instrument hedge
3Q14 3Q15 9M14 9M15
Share price at the start of the period (Euro) 83.90 107.50 77.26 93.86
Share price at the end of the period (Euro) 88.12 94.92 88.12 94.92
Number of derivative equity instruments at the
end of the period (millions) 23.1 23.1 23.1 23.1
PRESS RELEASE
Brussels, 30 October 2015 – 13 / 20
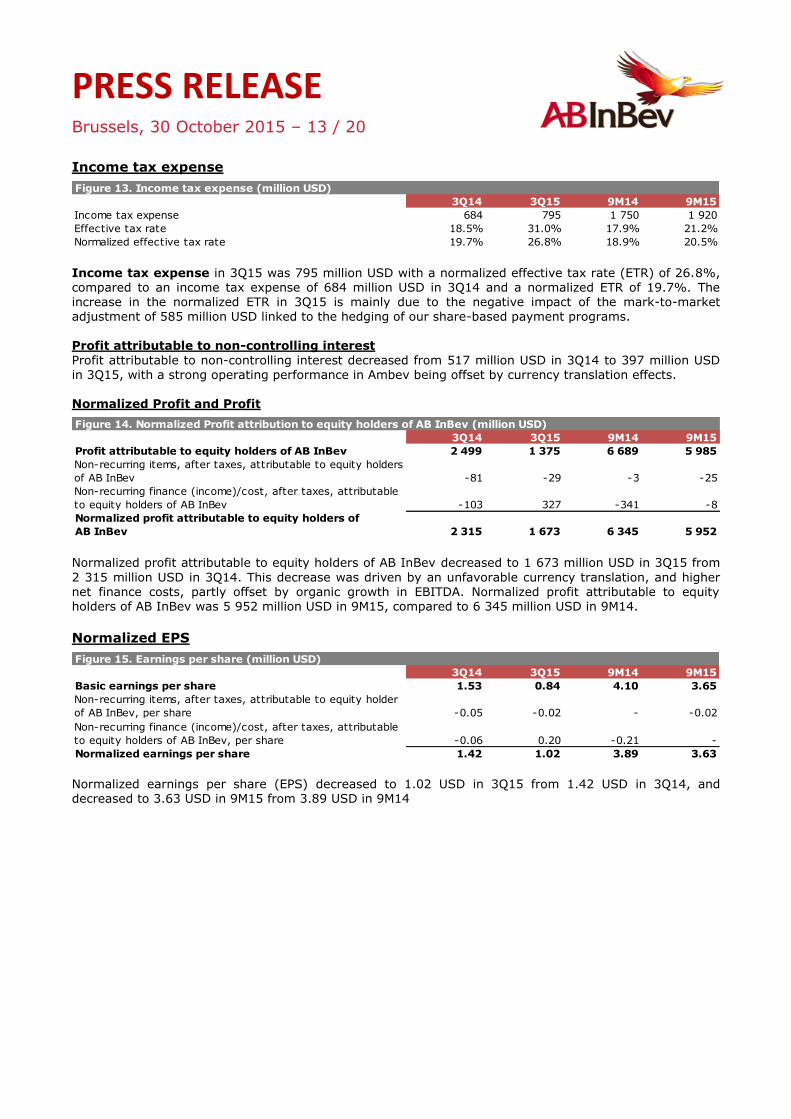
Income tax expense
Income tax expense in 3Q15 was 795 million USD with a normalized effective tax rate (ETR) of 26.8%, compared to an income tax expense of 684 million USD in 3Q14 and a normalized ETR of 19.7%. The increase in the normalized ETR in 3Q15 is mainly due to the negative impact of the mark-to-market
adjustment of 585 million USD linked to the hedging of our share-based payment programs. Profit attributable to non-controlling interest
Profit attributable to non-controlling interest decreased from 517 million USD in 3Q14 to 397 million USD in 3Q15, with a strong operating performance in Ambev being offset by currency translation effects. Normalized Profit and Profit
Normalized profit attributable to equity holders of AB InBev decreased to 1 673 million USD in 3Q15 from
2 315 million USD in 3Q14. This decrease was driven by an unfavorable currency translation, and higher net finance costs, partly offset by organic growth in EBITDA. Normalized profit attributable to equity holders of AB InBev was 5 952 million USD in 9M15, compared to 6 345 million USD in 9M14.
Normalized EPS
Normalized earnings per share (EPS) decreased to 1.02 USD in 3Q15 from 1.42 USD in 3Q14, and decreased to 3.63 USD in 9M15 from 3.89 USD in 9M14
Figure 13. Income tax expense (million USD)
3Q14 3Q15 9M14 9M15
Income tax expense 684 795 1 750 1 920
Effective tax rate 18.5% 31.0% 17.9% 21.2%
Normalized effective tax rate 19.7% 26.8% 18.9% 20.5%
Figure 14. Normalized Profit attribution to equity holders of AB InBev (million USD)
3Q14 3Q15 9M14 9M15
Profit attributable to equity holders of AB InBev 2 499 1 375 6 689 5 985
Non-recurring items, after taxes, attributable to equity holders
of AB InBev -81 -29 -3 -25
Non-recurring finance (income)/cost, after taxes, attributable
to equity holders of AB InBev -103 327 -341 -8
Normalized profit attributable to equity holders of
AB InBev 2 315 1 673 6 345 5 952
Figure 15. Earnings per share (million USD)
3Q14 3Q15 9M14 9M15
Basic earnings per share 1.53 0.84 4.10 3.65
Non-recurring items, after taxes, attributable to equity holder
of AB InBev, per share -0.05 -0.02 - -0.02
Non-recurring finance (income)/cost, after taxes, attributable
to equity holders of AB InBev, per share -0.06 0.20 -0.21 -
Normalized earnings per share 1.42 1.02 3.89 3.63
PRESS RELEASE
Brussels, 30 October 2015 – 14 / 20
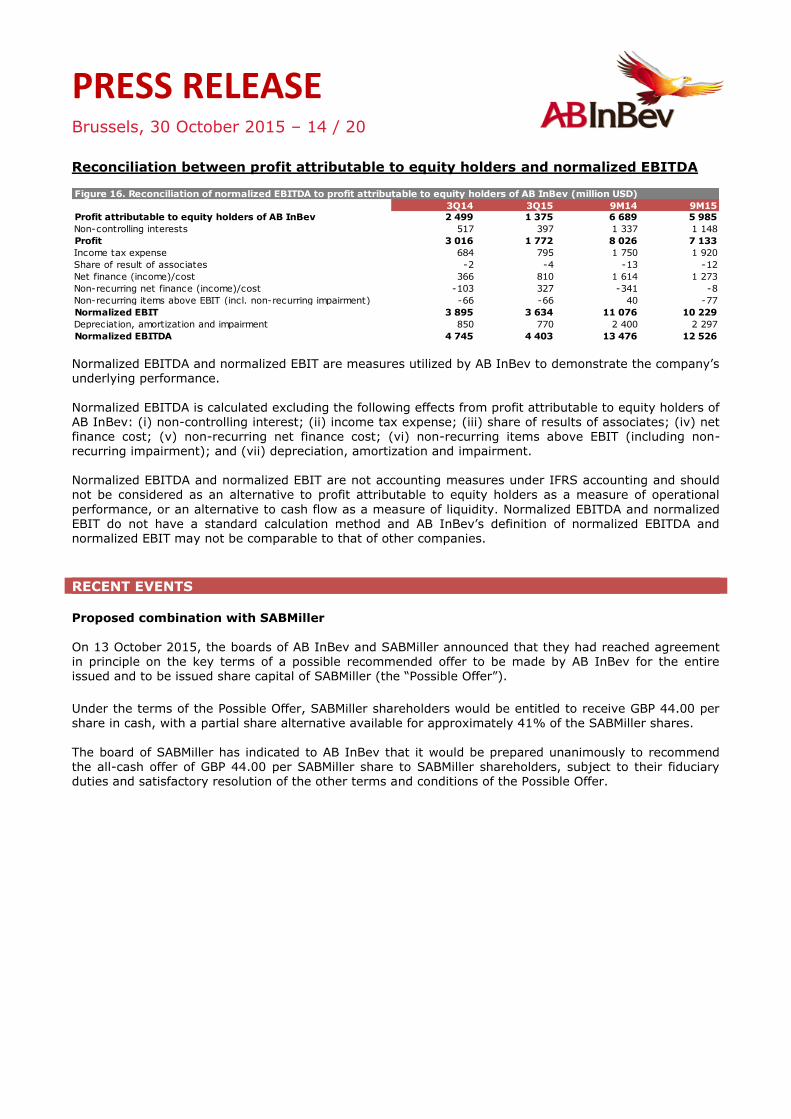
Reconciliation between profit attributable to equity holders and normalized EBITDA
Normalized EBITDA and normalized EBIT are measures utilized by AB InBev to demonstrate the company’s underlying performance.
Normalized EBITDA is calculated excluding the following effects from profit attributable to equity holders of AB InBev: (i) non-controlling interest; (ii) income tax expense; (iii) share of results of associates; (iv) net finance cost; (v) non-recurring net finance cost; (vi) non-recurring items above EBIT (including non-recurring impairment); and (vii) depreciation, amortization and impairment. Normalized EBITDA and normalized EBIT are not accounting measures under IFRS accounting and should not be considered as an alternative to profit attributable to equity holders as a measure of operational
performance, or an alternative to cash flow as a measure of liquidity. Normalized EBITDA and normalized
EBIT do not have a standard calculation method and AB InBev’s definition of normalized EBITDA and normalized EBIT may not be comparable to that of other companies.
Proposed combination with SABMiller
On 13 October 2015, the boards of AB InBev and SABMiller announced that they had reached agreement in principle on the key terms of a possible recommended offer to be made by AB InBev for the entire issued and to be issued share capital of SABMiller (the “Possible Offer”). Under the terms of the Possible Offer, SABMiller shareholders would be entitled to receive GBP 44.00 per
share in cash, with a partial share alternative available for approximately 41% of the SABMiller shares.
The board of SABMiller has indicated to AB InBev that it would be prepared unanimously to recommend the all-cash offer of GBP 44.00 per SABMiller share to SABMiller shareholders, subject to their fiduciary duties and satisfactory resolution of the other terms and conditions of the Possible Offer.
3Q14 3Q15 9M14 9M15
Profit attributable to equity holders of AB InBev 2 499 1 375 6 689 5 985
Non-controlling interests 517 397 1 337 1 148
Profit 3 016 1 772 8 026 7 133
Income tax expense 684 795 1 750 1 920
Share of result of associates -2 -4 -13 -12
Net finance (income)/cost 366 810 1 614 1 273
Non-recurring net finance (income)/cost -103 327 -341 -8
Non-recurring items above EBIT (incl. non-recurring impairment) -66 -66 40 -77
Normalized EBIT 3 895 3 634 11 076 10 229
Depreciation, amortization and impairment 850 770 2 400 2 297
Normalized EBITDA 4 745 4 403 13 476 12 526
Figure 16. Reconciliation of normalized EBITDA to profit attributable to equity holders of AB InBev (million USD)
RECENT EVENTS
PRESS RELEASE
Brussels, 30 October 2015 – 15 / 20
AB InBev’s 3Q15 and 3Q14 and 9M15 and 9M14 reported numbers are based on unaudited interim consolidated
financial statements prepared in accordance with IFRS. Unless otherwise indicated, amounts are presented in million USD. To facilitate the understanding of AB InBev’s underlying performance, the analyses of growth, including all comments in this press release, unless otherwise indicated, are based on organic growth and normalized numbers. In other words, financials are analyzed eliminating the impact of changes in currencies on translation of foreign operations, and scope changes. Scope changes represent the impact of acquisitions and divestitures, the start or termination of activities or the transfer of activities between segments, curtailment gains and losses and year over year changes in accounting estimates and other assumptions that management does not consider as part of the underlying performance of the business. All references per hectoliter (per hl) exclude US non-beer activities. To eliminate the effect of geography mix, i.e. the impact of stronger volume growth coming from countries with lower revenue per hl, and lower Cost of Sales per hl, we are also presenting, where specified, organic growth per hectoliter figures on a constant geographic basis. When we make estimations on a constant geographic basis, we assume each country in which we operate accounts for the same percentage of our global volume as in the same period of the previous year. Whenever presented in this document, all performance measures (EBITDA, EBIT, profit, tax rate, EPS) are presented on a “normalized” basis, which means they are presented before non-recurring items. Non-recurring items are either income or expenses which do not occur regularly as part of the normal activities of the Company. They are presented separately because they are important for the understanding of the underlying sustainable performance of the Company due to their size or nature. Normalized measures are additional measures used by management, and should not replace the measures determined in accordance with IFRS as an indicator of the Company’s performance. Values in the figures and annexes may not add up, due to rounding. Effective 1 April 2014, AB InBev discontinued the reporting of volumes sold to Constellation Brands under the temporary supply agreement (TSA), since these volumes do not form part of the underlying performance of our business. The 1Q14 volumes related to the TSA have therefore been treated as a negative scope.
3Q15 and 9M15 EPS is based upon a weighted average of 1 639 million shares compared to 1 633 million shares for 3Q14 and 9M14.
Legal Disclaimer This release contains certain forward-looking statements reflecting the current views of the management of Anheuser-Busch InBev with respect to, among other things, statements relating to Anheuser-Busch InBev’s proposal to the board of SABMiller and Anheuser-Busch InBev’s strategic objectives. These statements involve risks and uncertainties. The ability of Anheuser-Busch InBev to achieve these objectives is dependent on many factors some of which may be outside of management’s control, are subject to numerous risks and uncertainties about Anheuser-Busch InBev and SABMiller and are dependent on many factors, some of which are outside of Anheuser-Busch InBev’s control. By their nature, forward-looking statements involve risk and uncertainty because they reflect Anheuser-Busch InBev’s current expectations and assumptions as to future events and circumstances that may not prove accurate. The actual results could differ materially from those anticipated in the forward-looking statements for many reasons including the risks described under Item 3.D of Anheuser-Busch InBev’s Annual Report on Form 20-F filed with the US Securities and Exchange Commission on 24 March 2015, and, in respect of the proposal to the board of SABMiller, that there can be no certainty that the approach in respect of the proposed transaction described herein will result in an offer or agreement, or as to the terms of any such agreement. Anheuser-Busch InBev cannot assure you that the future results, level of activity, performance or achievements of Anheuser-Busch InBev will meet the expectations reflected in the forward-looking statements. Anheuser-Busch InBev disclaims any obligation to update any of these statements after the date of this release. Future SEC Filings and This Filing: Important Information In the event that AB InBev and SABMiller enter into a transaction, we may be required to file relevant materials with the SEC. Such documents, however, are not currently available. INVESTORS ARE URGED TO READ ANY DOCUMENTS REGARDING THE POTENTIAL TRANSACTION IF AND WHEN THEY BECOME AVAILABLE, BECAUSE THEY WILL CONTAIN IMPORTANT INFORMATION. Investors will be able to obtain a free copy of such filings without charge, at the SEC’s website (http://www.sec.gov) once such documents are filed with the SEC. Copies of such documents may also be obtained from us, without charge, once they are filed with the SEC.
NOTES
PRESS RELEASE
Brussels, 30 October 2015 – 16 / 20
The Third Quarter 2015 (3Q15) financial data set out in Figure 1 (except for the volume information), Figures 7 to 9, 11, 13 to 16 of this press release have been extracted from the group’s unaudited condensed consolidated interim financial statements as of and for the nine months ended 30 September 2015, which have been reviewed by our statutory auditors PricewaterhouseCoopers Bedrijfsrevisoren BCVBA in accordance with International Standard on Review Engagements 2410, “Review of Interim Financial Information Performed by the Independent Auditor of the Entity” and the standards of the Public Company Accounting Oversight Board (United States). The auditors concluded that, based on their review, nothing had come to their attention that caused them to believe that those interim financial statements were not presented fairly, in all material respects, in accordance with IAS 34 “Interim Financial Reporting”, as issued by the IASB and as adopted by the European Union. Financial data included in Figures 3 to 6, 10 and 12 have been extracted from the underlying accounting records as of and for the nine months ended 30 September 2015
(except for the volume information)
CONFERENCE CALL AND WEBCAST
Investor Conference call and Webcast on Friday, 30 October 2015:
2.00pm Brussels / 1.00pm London / 9.00am New York
Registration details
Webcast (listen-only mode) http://event.on24.com/r.htm?e=933899&s=1&k=2DE5FBBF8C916E7A5AFEA21A297ED27E
Conference call (with interactive Q&A) http://www.directeventreg.com/registration/event/77061548
ANHEUSER-BUSCH INBEV CONTACTS
Media
Investors
Marianne Amssoms
Tel: +1-212-573-9281
E-mail: [email protected]
Graham Staley
Tel: +1-212-573-4365
E-mail: [email protected]
Karen Couck
Tel: +1-212-573-9283
E-mail: [email protected]
Kathleen Van Boxelaer
Tel: +32-16-27-68-23
E-mail: [email protected]
Christina Caspersen
Tel: +1-212-573-4376
E-mail: [email protected]
Heiko Vulsieck
Tel: +32-16-27-68-88
E-mail: [email protected]
About Anheuser-Busch InBev
Anheuser-Busch InBev is a publicly traded company (Euronext: ABI) based in Leuven, Belgium, with American Depositary Receipts on the New York Stock Exchange (NYSE: BUD). It is the leading global brewer and one of the world’s top five consumer products companies. Beer, the original social network, has been bringing people together for thousands of years and our portfolio of well over 200 beer brands continues to forge strong connections with consumers. This includes global brands Budweiser®, Corona® and Stella Artois®; international brands Beck’s®, Leffe®, and Hoegaarden®; and local champions Bud Light®, Skol®, Brahma®, Antarctica®, Quilmes®, Victoria®, Modelo Especial®, Michelob Ultra®, Harbin®, Sedrin®, Klinskoye®, Sibirskaya Korona®, Chernigivske®, Cass®, and Jupiler®. Anheuser-Busch InBev’s dedication to heritage and quality originates from the Den Hoorn brewery in Leuven, Belgium dating back to 1366 and the pioneering spirit of the Anheuser & Co brewery, with origins in St. Louis, USA since 1852. Geographically diversified with a balanced exposure to developed and developing markets, Anheuser-Busch InBev leverages the collective strengths of its approximately 155 000 employees based in 25 countries worldwide. In 2014, AB InBev realized 47.1 billion USD revenue. The company strives to be the Best Beer Company Bringing People Together For a Better World. Learn more at ab-inbev.com, at facebook.com/ABInBev or on Twitter through @ABInBevNews.
PRESS RELEASE
Brussels, 30 October 2015 – 17 / 20
Annex 1
AB InBev Worldwide 3Q14 Scope Currency
translation
Organic
growth
3Q15 Organic
growth
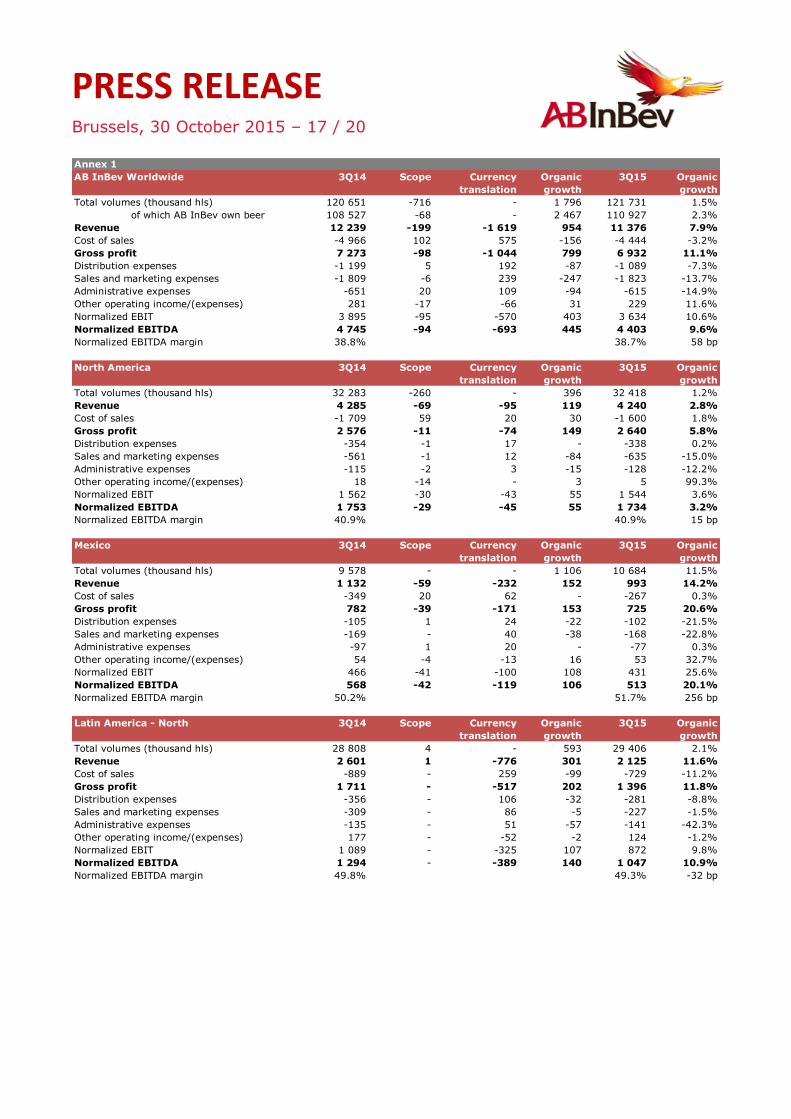
Total volumes (thousand hls) 120 651 -716 - 1 796 121 731 1.5%
of which AB InBev own beer 108 527 -68 - 2 467 110 927 2.3%
Revenue 12 239 -199 -1 619 954 11 376 7.9%
Cost of sales -4 966 102 575 -156 -4 444 -3.2%
Gross profit 7 273 -98 -1 044 799 6 932 11.1%
Distribution expenses -1 199 5 192 -87 -1 089 -7.3%
Sales and marketing expenses -1 809 -6 239 -247 -1 823 -13.7%
Administrative expenses -651 20 109 -94 -615 -14.9%
Other operating income/(expenses) 281 -17 -66 31 229 11.6%
Normalized EBIT 3 895 -95 -570 403 3 634 10.6%
Normalized EBITDA 4 745 -94 -693 445 4 403 9.6%
Normalized EBITDA margin 38.8% 38.7% 58 bp
North America 3Q14 Scope Currency
translation
Organic
growth
3Q15 Organic
growth
Total volumes (thousand hls) 32 283 -260 - 396 32 418 1.2%
Revenue 4 285 -69 -95 119 4 240 2.8%
Cost of sales -1 709 59 20 30 -1 600 1.8%
Gross profit 2 576 -11 -74 149 2 640 5.8%
Distribution expenses -354 -1 17 - -338 0.2%
Sales and marketing expenses -561 -1 12 -84 -635 -15.0%
Administrative expenses -115 -2 3 -15 -128 -12.2%
Other operating income/(expenses) 18 -14 - 3 5 99.3%
Normalized EBIT 1 562 -30 -43 55 1 544 3.6%
Normalized EBITDA 1 753 -29 -45 55 1 734 3.2%
Normalized EBITDA margin 40.9% 40.9% 15 bp
Mexico 3Q14 Scope Currency
translation
Organic
growth
3Q15 Organic
growth
Total volumes (thousand hls) 9 578 - - 1 106 10 684 11.5%
Revenue 1 132 -59 -232 152 993 14.2%
Cost of sales -349 20 62 - -267 0.3%
Gross profit 782 -39 -171 153 725 20.6%
Distribution expenses -105 1 24 -22 -102 -21.5%
Sales and marketing expenses -169 - 40 -38 -168 -22.8%
Administrative expenses -97 1 20 - -77 0.3%
Other operating income/(expenses) 54 -4 -13 16 53 32.7%
Normalized EBIT 466 -41 -100 108 431 25.6%
Normalized EBITDA 568 -42 -119 106 513 20.1%
Normalized EBITDA margin 50.2% 51.7% 256 bp
Latin America - North 3Q14 Scope Currency
translation
Organic
growth
3Q15 Organic
growth
Total volumes (thousand hls) 28 808 4 - 593 29 406 2.1%
Revenue 2 601 1 -776 301 2 125 11.6%
Cost of sales -889 - 259 -99 -729 -11.2%
Gross profit 1 711 - -517 202 1 396 11.8%
Distribution expenses -356 - 106 -32 -281 -8.8%
Sales and marketing expenses -309 - 86 -5 -227 -1.5%
Administrative expenses -135 - 51 -57 -141 -42.3%
Other operating income/(expenses) 177 - -52 -2 124 -1.2%
Normalized EBIT 1 089 - -325 107 872 9.8%
Normalized EBITDA 1 294 - -389 140 1 047 10.9%
Normalized EBITDA margin 49.8% 49.3% -32 bp
PRESS RELEASE
Brussels, 30 October 2015 – 18 / 20
Annex 1
Latin America - South 3Q14 Scope Currency
translation
Organic
growth
3Q15 Organic
growth
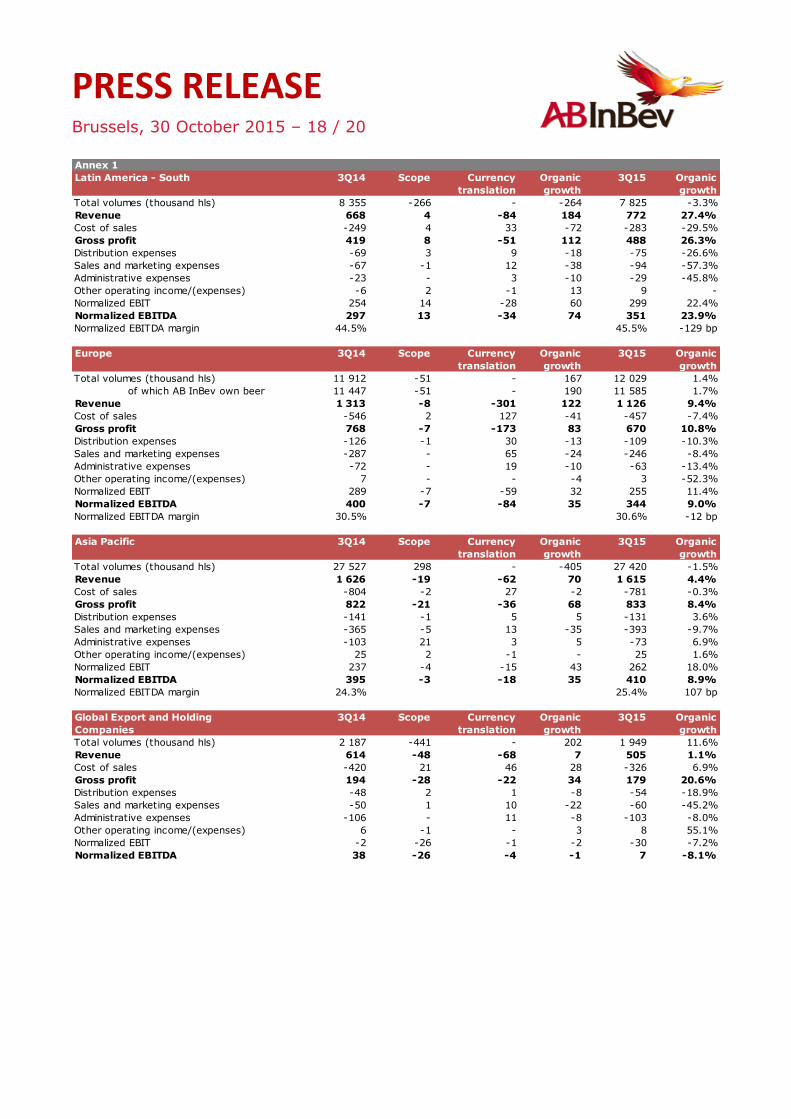
Total volumes (thousand hls) 8 355 -266 - -264 7 825 -3.3%
Revenue 668 4 -84 184 772 27.4%
Cost of sales -249 4 33 -72 -283 -29.5%
Gross profit 419 8 -51 112 488 26.3%
Distribution expenses -69 3 9 -18 -75 -26.6%
Sales and marketing expenses -67 -1 12 -38 -94 -57.3%
Administrative expenses -23 - 3 -10 -29 -45.8%
Other operating income/(expenses) -6 2 -1 13 9 -
Normalized EBIT 254 14 -28 60 299 22.4%
Normalized EBITDA 297 13 -34 74 351 23.9%
Normalized EBITDA margin 44.5% 45.5% -129 bp
Europe 3Q14 Scope Currency
translation
Organic
growth
3Q15 Organic
growth
Total volumes (thousand hls) 11 912 -51 - 167 12 029 1.4%
of which AB InBev own beer 11 447 -51 - 190 11 585 1.7%
Revenue 1 313 -8 -301 122 1 126 9.4%
Cost of sales -546 2 127 -41 -457 -7.4%
Gross profit 768 -7 -173 83 670 10.8%
Distribution expenses -126 -1 30 -13 -109 -10.3%
Sales and marketing expenses -287 - 65 -24 -246 -8.4%
Administrative expenses -72 - 19 -10 -63 -13.4%
Other operating income/(expenses) 7 - - -4 3 -52.3%
Normalized EBIT 289 -7 -59 32 255 11.4%
Normalized EBITDA 400 -7 -84 35 344 9.0%
Normalized EBITDA margin 30.5% 30.6% -12 bp
Asia Pacific 3Q14 Scope Currency
translation
Organic
growth
3Q15 Organic
growth
Total volumes (thousand hls) 27 527 298 - -405 27 420 -1.5%
Revenue 1 626 -19 -62 70 1 615 4.4%
Cost of sales -804 -2 27 -2 -781 -0.3%
Gross profit 822 -21 -36 68 833 8.4%
Distribution expenses -141 -1 5 5 -131 3.6%
Sales and marketing expenses -365 -5 13 -35 -393 -9.7%
Administrative expenses -103 21 3 5 -73 6.9%
Other operating income/(expenses) 25 2 -1 - 25 1.6%
Normalized EBIT 237 -4 -15 43 262 18.0%
Normalized EBITDA 395 -3 -18 35 410 8.9%
Normalized EBITDA margin 24.3% 25.4% 107 bp
Global Export and Holding
Companies
3Q14 Scope Currency
translation
Organic
growth
3Q15 Organic
growth
Total volumes (thousand hls) 2 187 -441 - 202 1 949 11.6%
Revenue 614 -48 -68 7 505 1.1%
Cost of sales -420 21 46 28 -326 6.9%
Gross profit 194 -28 -22 34 179 20.6%
Distribution expenses -48 2 1 -8 -54 -18.9%
Sales and marketing expenses -50 1 10 -22 -60 -45.2%
Administrative expenses -106 - 11 -8 -103 -8.0%
Other operating income/(expenses) 6 -1 - 3 8 55.1%
Normalized EBIT -2 -26 -1 -2 -30 -7.2%
Normalized EBITDA 38 -26 -4 -1 7 -8.1%
PRESS RELEASE
Brussels, 30 October 2015 – 19 / 20
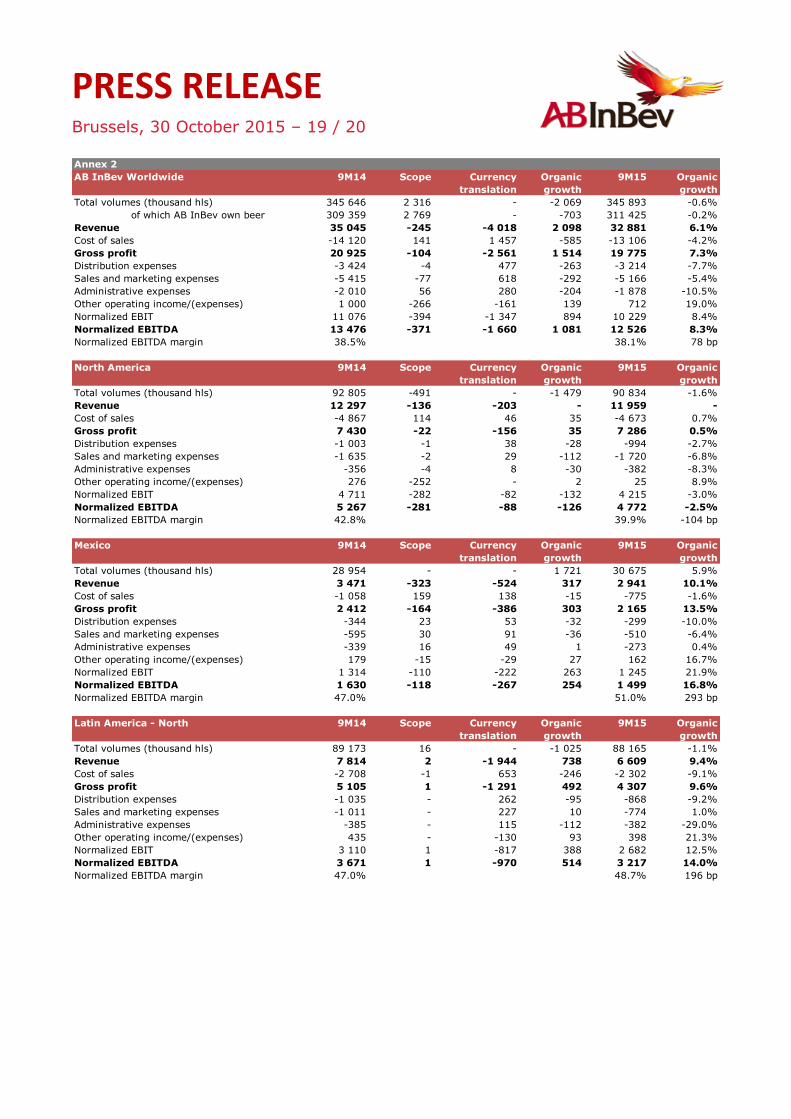
Annex 2
AB InBev Worldwide 9M14 Scope Currency
translation
Organic
growth
9M15 Organic
growth
Total volumes (thousand hls) 345 646 2 316 - -2 069 345 893 -0.6%
of which AB InBev own beer 309 359 2 769 - -703 311 425 -0.2%
Revenue 35 045 -245 -4 018 2 098 32 881 6.1%
Cost of sales -14 120 141 1 457 -585 -13 106 -4.2%
Gross profit 20 925 -104 -2 561 1 514 19 775 7.3%
Distribution expenses -3 424 -4 477 -263 -3 214 -7.7%
Sales and marketing expenses -5 415 -77 618 -292 -5 166 -5.4%
Administrative expenses -2 010 56 280 -204 -1 878 -10.5%
Other operating income/(expenses) 1 000 -266 -161 139 712 19.0%
Normalized EBIT 11 076 -394 -1 347 894 10 229 8.4%
Normalized EBITDA 13 476 -371 -1 660 1 081 12 526 8.3%
Normalized EBITDA margin 38.5% 38.1% 78 bp
North America 9M14 Scope Currency
translation
Organic
growth
9M15 Organic
growth
Total volumes (thousand hls) 92 805 -491 - -1 479 90 834 -1.6%
Revenue 12 297 -136 -203 - 11 959 -
Cost of sales -4 867 114 46 35 -4 673 0.7%
Gross profit 7 430 -22 -156 35 7 286 0.5%
Distribution expenses -1 003 -1 38 -28 -994 -2.7%
Sales and marketing expenses -1 635 -2 29 -112 -1 720 -6.8%
Administrative expenses -356 -4 8 -30 -382 -8.3%
Other operating income/(expenses) 276 -252 - 2 25 8.9%
Normalized EBIT 4 711 -282 -82 -132 4 215 -3.0%
Normalized EBITDA 5 267 -281 -88 -126 4 772 -2.5%
Normalized EBITDA margin 42.8% 39.9% -104 bp
Mexico 9M14 Scope Currency
translation
Organic
growth
9M15 Organic
growth
Total volumes (thousand hls) 28 954 - - 1 721 30 675 5.9%
Revenue 3 471 -323 -524 317 2 941 10.1%
Cost of sales -1 058 159 138 -15 -775 -1.6%
Gross profit 2 412 -164 -386 303 2 165 13.5%
Distribution expenses -344 23 53 -32 -299 -10.0%
Sales and marketing expenses -595 30 91 -36 -510 -6.4%
Administrative expenses -339 16 49 1 -273 0.4%
Other operating income/(expenses) 179 -15 -29 27 162 16.7%
Normalized EBIT 1 314 -110 -222 263 1 245 21.9%
Normalized EBITDA 1 630 -118 -267 254 1 499 16.8%
Normalized EBITDA margin 47.0% 51.0% 293 bp
Latin America - North 9M14 Scope Currency
translation
Organic
growth
9M15 Organic
growth
Total volumes (thousand hls) 89 173 16 - -1 025 88 165 -1.1%
Revenue 7 814 2 -1 944 738 6 609 9.4%
Cost of sales -2 708 -1 653 -246 -2 302 -9.1%
Gross profit 5 105 1 -1 291 492 4 307 9.6%
Distribution expenses -1 035 - 262 -95 -868 -9.2%
Sales and marketing expenses -1 011 - 227 10 -774 1.0%
Administrative expenses -385 - 115 -112 -382 -29.0%
Other operating income/(expenses) 435 - -130 93 398 21.3%
Normalized EBIT 3 110 1 -817 388 2 682 12.5%
Normalized EBITDA 3 671 1 -970 514 3 217 14.0%
Normalized EBITDA margin 47.0% 48.7% 196 bp
PRESS RELEASE
Brussels, 30 October 2015 – 20 / 20
Annex 2
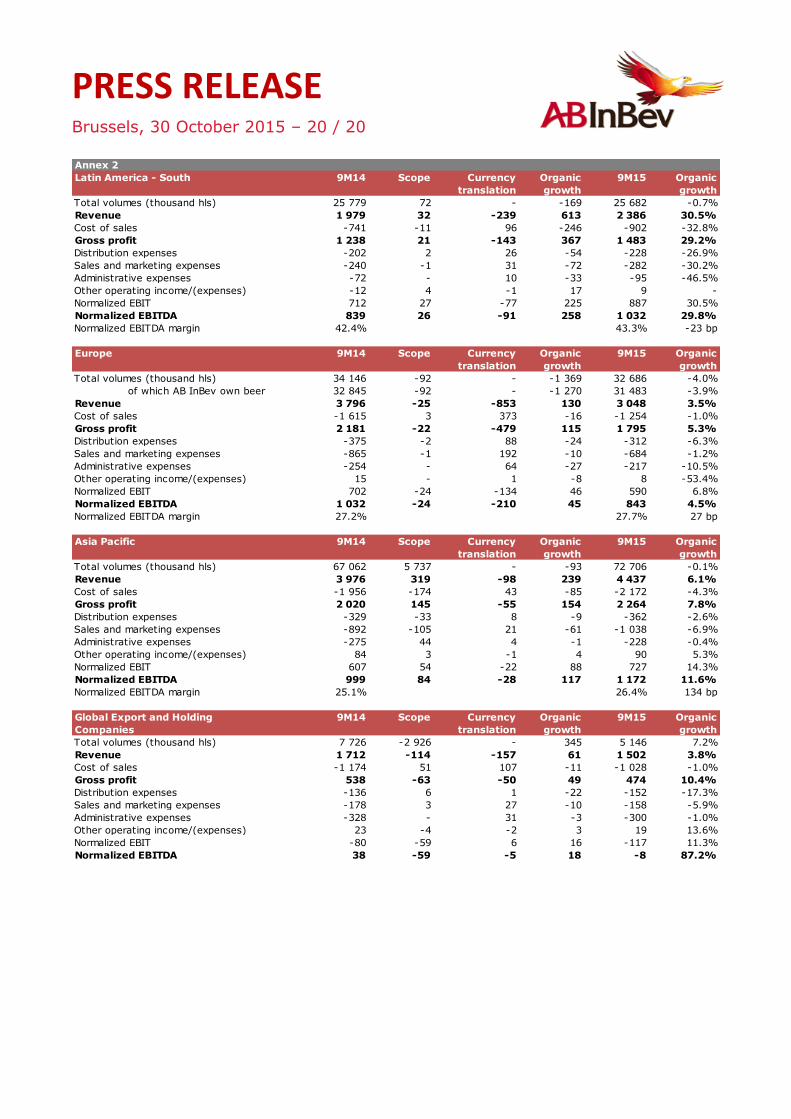
Latin America - South 9M14 Scope Currency
translation
Organic
growth
9M15 Organic
growth
Total volumes (thousand hls) 25 779 72 - -169 25 682 -0.7%
Revenue 1 979 32 -239 613 2 386 30.5%
Cost of sales -741 -11 96 -246 -902 -32.8%
Gross profit 1 238 21 -143 367 1 483 29.2%
Distribution expenses -202 2 26 -54 -228 -26.9%
Sales and marketing expenses -240 -1 31 -72 -282 -30.2%
Administrative expenses -72 - 10 -33 -95 -46.5%
Other operating income/(expenses) -12 4 -1 17 9 -
Normalized EBIT 712 27 -77 225 887 30.5%
Normalized EBITDA 839 26 -91 258 1 032 29.8%
Normalized EBITDA margin 42.4% 43.3% -23 bp
Europe 9M14 Scope Currency
translation
Organic
growth
9M15 Organic
growth
Total volumes (thousand hls) 34 146 -92 - -1 369 32 686 -4.0%
of which AB InBev own beer 32 845 -92 - -1 270 31 483 -3.9%
Revenue 3 796 -25 -853 130 3 048 3.5%
Cost of sales -1 615 3 373 -16 -1 254 -1.0%
Gross profit 2 181 -22 -479 115 1 795 5.3%
Distribution expenses -375 -2 88 -24 -312 -6.3%
Sales and marketing expenses -865 -1 192 -10 -684 -1.2%
Administrative expenses -254 - 64 -27 -217 -10.5%
Other operating income/(expenses) 15 - 1 -8 8 -53.4%
Normalized EBIT 702 -24 -134 46 590 6.8%
Normalized EBITDA 1 032 -24 -210 45 843 4.5%
Normalized EBITDA margin 27.2% 27.7% 27 bp
Asia Pacific 9M14 Scope Currency
translation
Organic
growth
9M15 Organic
growth
Total volumes (thousand hls) 67 062 5 737 - -93 72 706 -0.1%
Revenue 3 976 319 -98 239 4 437 6.1%
Cost of sales -1 956 -174 43 -85 -2 172 -4.3%
Gross profit 2 020 145 -55 154 2 264 7.8%
Distribution expenses -329 -33 8 -9 -362 -2.6%
Sales and marketing expenses -892 -105 21 -61 -1 038 -6.9%
Administrative expenses -275 44 4 -1 -228 -0.4%
Other operating income/(expenses) 84 3 -1 4 90 5.3%
Normalized EBIT 607 54 -22 88 727 14.3%
Normalized EBITDA 999 84 -28 117 1 172 11.6%
Normalized EBITDA margin 25.1% 26.4% 134 bp
Global Export and Holding
Companies
9M14 Scope Currency
translation
Organic
growth
9M15 Organic
growth
Total volumes (thousand hls) 7 726 -2 926 - 345 5 146 7.2%
Revenue 1 712 -114 -157 61 1 502 3.8%
Cost of sales -1 174 51 107 -11 -1 028 -1.0%
Gross profit 538 -63 -50 49 474 10.4%
Distribution expenses -136 6 1 -22 -152 -17.3%
Sales and marketing expenses -178 3 27 -10 -158 -5.9%
Administrative expenses -328 - 31 -3 -300 -1.0%
Other operating income/(expenses) 23 -4 -2 3 19 13.6%
Normalized EBIT -80 -59 6 16 -117 11.3%
Normalized EBITDA 38 -59 -5 18 -8 87.2%