Embed Size (px)
Citation preview
Presidential Popularity and Negative Voting: An Alternative Explanation of the MidtermCongressional Decline of the President's PartyAuthor(s): Samuel KernellSource: The American Political Science Review, Vol. 71, No. 1 (Mar., 1977), pp. 44-66Published by: American Political Science AssociationStable URL: http://www.jstor.org/stable/1956953 .
Accessed: 16/08/2013 12:05
Your use of the JSTOR archive indicates your acceptance of the Terms & Conditions of Use, available at .http://www.jstor.org/page/info/about/policies/terms.jsp
.JSTOR is a not-for-profit service that helps scholars, researchers, and students discover, use, and build upon a wide range ofcontent in a trusted digital archive. We use information technology and tools to increase productivity and facilitate new formsof scholarship. For more information about JSTOR, please contact [email protected].
.
American Political Science Association is collaborating with JSTOR to digitize, preserve and extend access toThe American Political Science Review.
http://www.jstor.org
This content downloaded from 137.110.37.11 on Fri, 16 Aug 2013 12:05:55 PMAll use subject to JSTOR Terms and Conditions
Presidential Popularity and Negative Voting: An Alternative Explanation of the Midterm Congressional Decline of the President's Party*
SAMUEL KERNELL University of Minnesota
There exist two distinct bodies of knowledge on the subject of midterm voting. The first, developed by political scientists, emphasizes the stability and continuity of midterm voting from one election to another; while the second, nurtured by politicians, understandably focuses on short-run forces which stir national electoral shifts. The differences between the two reflect more than the normal problem of the scholars informing the politicians; they represent diver- gent professional goals. Since the research reported here draws upon and has implications for both perspectives, it is appropriate at the outset to review and compare political scien- tists' knowledge with politicians' wisdom.
Most of what we know about the voting habits of the American electorate has come from intensive research on presidential elec- tions. The effects of party identification, candi- date appeal, and issue orientation have been thoroughly elaborated for each of the last five presidential elections.1 During these elections voting for congressional seats has been viewed as reflecting the presidential vote largely through the effect of presidential coattails.2
*1 would like to thank Terence Ball, W. Phillips Shively, Aaron Wildavsky, and Gerald Wright for their helpful comments on an earlier draft of this article.
1There is little need to repeat here the long and well known list of election-year studies. Several are particularly important, however, for providing the theoretical grounding for many of our ideas on midterm voting. Principally important, of course, is Angus Campbell, Philip E. Converse, Warren E. Miller, and Donald E. Stokes, The American Voter (New York: Wiley, 1960). Also valuable is the collection of essays contained in their subsequent work, Elections and the Political Order (New York: Wiley, 1966). For an excellent summary of this body of conventional wisdom see Fred I. Greenstein, The American Party System and the American People, 2nd edition (Engle- wood Cliffs: Prentice-Hall, 1970), chapter 3.
2This literature, on the other hand, is somewhat less prestigious and conclusive in its findings. Im- portant among the research examining coattails with individual level data is Warren E. Miller, "Presidential Coattails: A Study in Political Myth and Method- ology," Public Opinion Quarterly, 19 (1955-56), 353-368& Also, William N. McPhee and William A. Glaser, Public Opinion and Congressional Elections (New York: Free Press, 1962).
The study of midterm congressional elections by contrast has been scanty, probably because the findings which have been reported comport so well with existing knowledge and theory about voting behavior.
The "Surge and Decline" Thesis
Compared to presidential elections, midterm congressional contests are portrayed by the literature as rather unexciting and routine events both for the voter and for the political system. Without highly visible presidential can- didates barnstorming the country and advertis- ing national political issues, midterm congres- sional campaigns generate lower media cover- age, lower voter attention, and consequently lower election-day turnout-usually by about 15 percentage points.3 The short-run forces of personalities and stylized issues which arouse voter interest during presidential elections are also responsible for much of the vote volatility which assures the Republican nominee a chance to overcome his initial partisan deficit. The absence of these forces during midterm elec- tions means that voting will even more greatly rest on the voter's party identification. Accord- ing to survey findings of the mid and late 1 950s, defections from party represent only about 10 per cent of the votes cast, and inde- pendents make up a smaller proportion of the midterm electorate.4 Thus, while each presiden- tial campaign will be marked by its unique configuration of competing personalities and issues, and often high levels of defection at the polls, a midterm congressional election is char- acterized by lower interest, reduced turnout, and party voting.
This scenario of midterm voting portends several political consequences. First, it means
3Angus Campbell, "Surge and Decline: A Study of Electoral Change," in Elections and the Political Order, pp. 41-43. Also, Robert B. Arseneau and Raymond E. Wolfinger, "Voting Behavior in Congres- sional Elections" (paper delivered at the APSA con- vention, 1973, Figure 1).
4Campbell et al., Elections and the Political Order, Table lI-1, p. 197.
44
This content downloaded from 137.110.37.11 on Fri, 16 Aug 2013 12:05:55 PMAll use subject to JSTOR Terms and Conditions
1977 Presidential Popularity and Negative Voting 45
that as long as Democrats remain the majority party, they should win most of the congres- sional seats during midterm contests. Indeed, only once since the New Deal realignments have the Republicans managed to win control of Congress during a midterm election. More importantly, low voter interest and party voting mean that major gains in congressional seats produced by the coattail of the victorious presidential candidate will be short-lived. Every four years since 1938 marginal voters who were stimulated by the winning candidate fail to show up at the polls, and defectors, who apparently went disproportionately to the win- ner, return home. As a result, the President's party loses congressional seats; the magnitude of these losses directly reflects the magnitude of the gains produced by the winner's coat- tails.5 Thus, midterm congressional elections serve to restore party competition and equity by repairing the damage done to the losing party by the presidential election two years earlier.
Two Problems With Surge and Decline. At first glance "surge and decline" presents us with a tight structure underpinned by the foundations of modern voting theory. The voter's marginal interest in politics, the dominant role of party identification in electoral decisions, and the sources of stimulation for both voting participa- tion and defection serve as basic ingredients of the surge and decline thesis. Employing these features, surge and decline pulls off the neat trick of explaining the apparent anomaly that every two years there is a substantial, nation- wide shift in the electorate's political prefer- ences. Low stimulation and disinterest-not highly motivated policy voting-account for the systematic alternation of success and failure at the polls.
Despite this virtue, two distinct issues lead one to question the adequacy of surge and decline in explaining midterm voting. The first criticizes its failure to predict and explain-or even to address-important electoral outcomes. This criticism argues that surge and decline is incomplete; its sins are those of omission. The second issue is potentially even more destruc- tive; rather than being merely incomplete, the surge and decline conclusions based on the
5Ruth C. Silva, "A Look Into a Crystal Election Ball," New York Times Magazine, 10 October 1954; p. 13. V. 0. Key, Jr., Politics, Parties and Pressure Groups, 5th edition (New York: Thomas Y. Crowell, 1964), pp. 567-574; and Barbara Hinckley, "Interpret- ing House Midterm Elections: Toward a Measurement of the In-Party's 'Expected' Loss of Seats," American Political Science Review, 61 (September, 1967), 694-700.
1958 election are inaccurate when applied to other midterm elections.
The few midterm defections which do occur are conventionally viewed as reflecting peculiar features of the local campaign or individual voter qualities, rather than as representing a widespread effort to reward or punish a given political party. Two frequently cited sources of defection are "friends-and-neighbors" voting and name familiarity of the candidate.6 For the purpose of identifying or explaining a national electoral movement during the midterm elec- tion away from one party and toward another, neither variable is very helpful. Although these variables may be important for explaining variance among individual voters and thereby informing us that in many instances voter defection is politically idiosyncratic, they are silent about the systematic influences which may be politically decisive in determining party control of the national legislature. The preoccu- pation of the existing research with the politi- cally more sterile aspects of defections can be seen from the following passages both of which draw their conclusions from the 1958 SRC survey. Donald Stokes and Warren Miller ac- knowledge as an afterthought: ". . . there is some variation, and these moderate swings must be attributed to forces that have their focus at the national level.... Our main point is rather that ... the proportion of deviating votes that can be attributed to national politics is likely to be a small part of the total votes cast by persons deviating from party in a mid-term year."7 In his important article, "Surge and Decline: A Study of Electoral Change," Angus Campbell reveals his focus with the following understate- ment: ". . . the partisan movement in 1958 cannot be entirely attributed to a normal
6Donald E. Stokes and Warren E. Miller, "Party Government and the Salience of Congress," in Elec- tions and the Political Order, pp. 204-209.
71bid., pp. 202-203. Elsewhere Stokes estimates that the proportion of variance in congressional district voting which is explained by national forces is 32 per cent as compared to 49 per cent for district forces. See "A Variance Components Model of Politi- cal Effects," in Mathematical Applications in Political Science, ed. John M. Claunch (Dallas: Southern Methodist University Press, 1965), pp. 61-85. Richard S. Katz persuasively argues that Stokes's estimate for the influence of national-level forces is too low; Katz in his correlation analysis revises the estimate upward to 54.6 per cent. See Katz "The Attribution of Variance in Electoral Returns: An Alternative Mea- surement Technique," American Political Science Re- view, 67 (September, 1973), 817-828. This estimate has been statistically corrected to 45 per cent. See communication by Christopher Achen, American Poli- tical Science Review, 68 (March, 1974), 1272-1273. It should be remembered that these estimates of the sources of the congressional vote include presidential election years.
This content downloaded from 137.110.37.11 on Fri, 16 Aug 2013 12:05:55 PMAll use subject to JSTOR Terms and Conditions
46 The American Political Science Review Vol. 71
decline toward standing party loyalties after the displacement of the vote in a surge year."8
The genuinely curious thing about these conclusions is that they are based on the election which produced the largest midterm landslide since the 1920s. More than 56 per cent of the total vote went to the Democratic party and, as a result, the Democrats picked up 48 congressional seats from Republicans who had not benefited greatly from President Eisen- hower's victory two years earlier. If ever there were an ideal election for discerning what V. 0. Key described as a "national party battle," the 1958 election was it.9 Yet most conclusions founded on the 1958 election fail to recognize this.
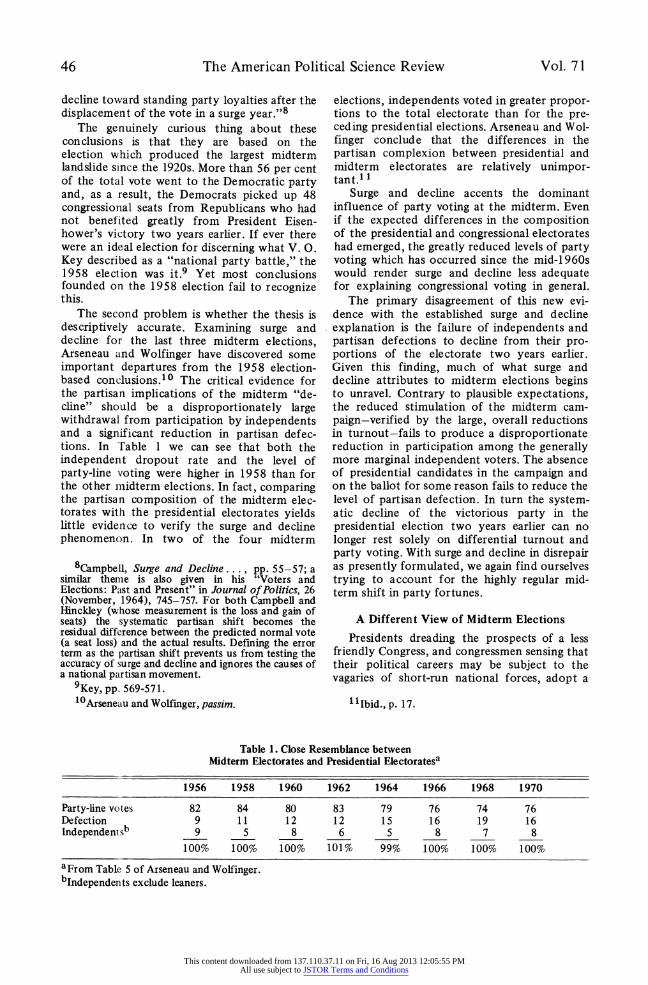
The second problem is whether the thesis is descriptively accurate. Examining surge and decline for the last three midterm elections, Arseneau and Wolfinger have discovered some important departures from the 1958 election- based conclusions.10 The critical evidence for the partisan implications of the midterm "de- cline" should be a disproportionately large withdrawal from participation by independents and a significant reduction in partisan defec- tions. In Table 1 we can see that both the independent dropout rate and the level of party-line voting were higher in 1958 than for the other midterm elections. In fact, comparing the partisan composition of the midterm elec- torates with the presidential electorates yields little evidence to verify the surge and decline phenomenon. In two of the four midterm
8Campbell, Surge and Decline .., pp. 55-57; a similar theme is also given in his "Voters and Elections: Past and Present" in Journal of Politics, 26 (November, 1964), 745-757. For both Campbell and Hinckley (whose measurement is the loss and gain of seats) the systematic partisan shift becomes the residual difference between the predicted normal vote (a seat loss) and the actual results. Defining the error term as the partisan shift prevents us from testing the accuracy of surge and decline and ignores the causes of a national partisan movement.
9Key, pp. 569-571. t0Arseneau and Wolfinger, passim.
elections, independents voted in greater propor- tions to the total electorate than for the pre- ceding presidential elections. Arseneau and Wol- finger conclude that the differences in the partisan complexion between presidential and midterm electorates are relatively unimpor- tant.' 1
Surge and decline accents the dominant influence of party voting at the midterm. Even if the expected differences in the composition of the presidential and congressional electorates had emerged, the greatly reduced levels of party voting which has occurred since the mid-l 960s would render surge and decline less adequate for explaining congressional voting in general.
The primary disagreement of this new evi- dence with the established surge and decline explanation is the failure of independents and partisan defections to decline from their pro- portions of the electorate two years earlier. Given this finding, much of what surge and decline attributes to midterm elections begins to unravel. Contrary to plausible expectations, the reduced stimulation of the midterm cam- paign-verified by the large, overall reductions in turnout-fails to produce a disproportionate reduction in participation among the generally more marginal independent voters. The absence of presidential candidates in the campaign and on the ballot for some reason fails to reduce the level of partisan defection. In turn the system- atic decline of the victorious party in the presidential election two years earlier can no longer rest solely on differential turnout and party voting. With surge and decline in disrepair as presently formulated, we again find ourselves trying to account for the highly regular mid- term shift in party fortunes.
A Different View of Midterm Elections
Presidents dreading the prospects of a less friendly Congress, and congressmen sensing that their political careers may be subject to the vagaries of short-run national forces, adopt a
"tIbid.,p. 17.
Table 1. Close Resemblance between Midterm Electorates and Presidential Electoratesa
1956 1958 1960 1962 1964 1966 1968 1970
Party-line votes 82 84 80 83 79 76 74 76 Defection 9 11 12 12 15 16 19 16 Independentsb 9 5 8 6 5 8 7 8
100% 100% 100% 101% 99% 100% 100% 100%
aFrom Table 5 of Arseneau and Wolfinger. bIndependents exclude leaners.
This content downloaded from 137.110.37.11 on Fri, 16 Aug 2013 12:05:55 PMAll use subject to JSTOR Terms and Conditions
1977 Presidential Popularity and Negative Voting 47
perspective for understanding elections far dif- ferent from that described above. For them understanding the election requires that they attempt to gauge national shifts in the elec- torate's opinions and evaluations. Believing that the public is much more politically aware and issue oriented than scholarly research has proved it to be, candidates for office attempt to discover shifts in national sentiment and react accordingly.
Of course the truism that "one sees what one wants to see" is probably especially true for politicians. Many politicians and pundits have shown themselves highly imaginative in predicting and explaining victory and defeat. One columnist for a national news magazine decorated his attack on urban political ma- chines with the proclamation that the recently past Republican congressional victory of 1950 revealed the public's disgust with big city bossism.1 2 Another, writing in Newsweek, read into the Democratic landslide of 1958 the public's displeasure with the failure of President Eisenhower to balance the budget and more diligently combat communism abroad, as if congressional Democrats favored these poli- cies.13 But after perusing popular analyses of midterm elections in the press and reviewing biographical accounts of the participants over the last 25 years, one is impressed by the general continuity of the assumptions and beliefs that careful observers and participants have employed to predict and explain elections. Long before behavioral political science had identified and specified the effects of presiden- tial coattails, politicians already had developed through experience a rather accurate conven- tional wisdom about which party's congres- sional candidates benefited during the presiden- tial victory, which suffered two years later, and why. Another equally pervasive theme has, however, received no systematic inspection- much less verification; this is that the Presi- dent's public standing is a major component of those national shifts of public opinion which shape voting during midterm elections. Before testing this belief empirically, perhaps it will prove useful to describe briefly its effects on politicians' behavior and campaign strategies.
The unprecedented "in" party midterm vic- tory of 1934 was widely hailed as an affirma- tion of the public's enchantment with Franklin Roosevelt; according to his biographers, the President agreed with this interpretation pri-
12"The Election," Time Magazine, 13 November 1950, p. 19.
13Raymond Moley, "What Happened," Newsweek, 10 November 1958, p. 61.
vately as well as publicly.'4 And twenty-eight years later we learn from Arthur Schlesinger Jr. that President Kennedy was concerned with the potential damage the Cuban missile crisis might have on his public prestige and as a result on the fall's congressional elections. 1 5
Occasionally the President's popularity drops to a point where the opposition can comfortably make the President's record a campaign issue. President Truman, whose sharp fluctuations in popularity did indeed make him appear to be riding a tiger, had to face the unpleasantness of political assault both in 1946 and 1950. During the 1946 congressional cam- paigns the potential vulnerability of an unpopu- lar president to partisan attack was fully realized. President Truman became the primary issue as Republican candidates universally attempted to associate him with their Demo- cratic opponents. Just as zealously Democrats resisted. Democratic leaders asked Truman not to campaign on their behalf, and, desperately, many Democrats played recordings of the late President Roosevelt hoping to conjure up a more favorable image.16 Columnist Raymond Moley provides a typical description of the campaign:
Organization Democrats far and near acted as if they were ashamed of their own President. His name was barely mentioned in speeches and campaign literature. With an eye to the Gallup polls, which indicated a drop in Mr. Truman's popularity from a honeymoon percentage of 87 percent to an October brown of 32 percent, they decided that he was to be written off as a loss. Republicans made the most of him as an issue. He was surrounded by Communists and bunglers, they said. He was weak and wobbly. Congress must seize the reins from his faltering hands.1 7
By comparison, the, congressional elections of 1950 were less dramatic. President Truman occasionally even tried campaigning for favored Democratic candidates. But again his popularity
14James MacGregor Burns, Roosevelt: The Lion and the Fox (New York: Harcourt, Brace and World, 1956), pp. 198-203;and William E. Leuchtenburg, Franklin D. Roosevelt and the New Deal (New York: Harper and Row, 1963), pp. 822-823.
15 Arthur M. Schlesinger, Jr., A Thousand Days (Boston: Houghton Mifflin, 1965), pp. 822-823. Robert F. Kennedy also mentions this consideration in his account of the crisis, Thirteen Days (New York: Norton, 1969). Also see Graham Allison, "Conceptual Models of the Cuban Missile Crisis," The American Political Science Review, 63 (September, 1969), 712-714.
16James D. Barber, Presidential Character (Engle- wood Cliffs: Prentice-Hall, 1973), pp. 278-280.
17Raymond Moley, "The Presidency," Newsweek, 11 November 1946, p. 116.
This content downloaded from 137.110.37.11 on Fri, 16 Aug 2013 12:05:55 PMAll use subject to JSTOR Terms and Conditions
48 The American Political Science Review Vol. 71
was low, Democrats preferred to run alone, and the President became a target of Republican attack. A pre-election survey of Washington newsmen that year found agreement in the belief that "administration incompetence" would be a decisive issue in the election.1 8
The midterm elections of 1954 and 1962 presented the voters with popular presidents and thus apparently an opposite set of decisions by the political actors. At the beginning of the 1954 midterm campaign in September, 65 per cent of the public approved President Eisen- hower's job performance, and in early Septem- ber of 1962, President Kennedy's popularity was at a comparable level of 67 per cent. Instead of abandoning their President as the Democrats had done during the 1946 and 1950 campaigns, the congressional candidates from the President's party were anxious to find a coattail, and both Presidents were constantly importuned to campaign on behalf of the numerous candidacies. Unlike Truman's re- quested campaign silence, both Eisenhower and Kennedy, sensing an opportunity to increase their party's congressional majority, were ex- tremely active in behalf of favored party candidates.1 9 Given a popular incumbent, con-
18"Correspondents' Election Preview," Newsweek, 6 November 1950, p. 25. Also, Key, pp. 563-568.
19Whatever misfortune or shortcomings Eisen- hower may have displayed in his dealings with Congress or his own cabinet, it is difficult to gainsay the General's adroitness as a campaigner, and the 1954 congressional elections are no exception. The fol- lowing passage reveals that he recognized that his public prestige was important to others, and he intended to exchange it for his own profit. Joseph Meek, the Republican senatorial candidate running against the incumbent Illinois Democrat Paul Douglas, had publicly opposed certain features of Eisenhower's foreign aid program during the campaign. Eisenhower describes the affair in his memoirs:
In April, I had told him I would not back him until he announced that he would support my program. Consequently, I remained silent on his candidacy until he gave public assurance that "you can count on my loyalties and my support as the junior senator from Illinois." On August 12 I was photographed with seventeen candidates, not yet members of the Congress, who because they promised to support my program had won the approval of the Citizens for Eisenhower, who were again readying them- selves for action in the campaign. I wanted and needed a Republican Congress; but I could see no sense in working for office-seekers who were ready to object to every proposal I made. Dwight D. Eisenhower, Mandate for Change (Garden City, N.Y.: Doubleday, 1963), p. 433.
To the degree that politicians believe the first premise that the President's popularity is important to their own success, the incumbent President possesses a "bargaining advantage" which, as we see here, can be used to purchase future congressional loyalty.
gressional candidates from the opposition party refrained from vituperative attacks.
Even during periods of divided government, politicians view the public as continuing to hold the President's party responsible for govern- mental performance. During both the 1958 and 1970 congressional elections, with a Republican in the White House, economic prosperity be- came a major issue as Democratic candidates disputed the administration's economic poli- cies. In both instances the President cam- paigned actively against the Democratically controlled Congress, but in each he appeared unsuccessful as his own party sustained losses in its congressional strength. In late 1958, when a worsening economic recession (which improved in early 1959) coincided with the congressional election, the Republican defeat was particularly severe.20 After the election, Vice President Richard Nixon, who would face a similar situation twelve years later as president, inter- preted the Republican defeat:
The power of the "pocketbook" issue was shown more clearly perhaps in 1958 than in any off-year election in history. On the inter- national front, the Administration had had one of its best years .. . Yet, the economic dip in October was obviously uppermost in the people's minds when they went to the polls. They completely rejected the President's appeal for the election of Republicans to the House and Senate.21
What this review of modern midterm con- gressional elections suggests is that political actors do believe that the President's popularity is causally related to their party's electoral success.22 Consequently, the several key sets of
20James L. Sundquist provides an interesting analy- sis and persuasive discussion on this point in Politics and Policy: The Eisenhower, Kennedy and Johnson Years (Washington, D.C.: Brookings Institution, 1968), pp. 452-466. During the campaign Republican senatorial and congressional candidates publicly disa- vowed allegiance to President Eisenhower's economic programs. On this point see Key, pp. 569-570.
2tRichard M. Nixon, Six Crises (New York: Doubleday, 1962), p. 310. Campbell et al. in The American Voter find that 40 per cent of the families felt a direct impact of the recession and that their responses to the economy correlated with evaluations of the Eisenhower administration and 1958 congres- sional vote intentions (pp. 386-391).
22The only systematic investigation of the effects of the strategies of congressional candidates seeking to dissociate themselves from their party's national lead- ership was performed by Robert A. Schoenberger for the 1964 presidential election. Republican candidates who severed any connection with the Goldwater candidacy received on the whole a larger share of the congressional vote than did those congressional candi- dates who maintained party loyalty. "Campaign Strat- egy and Party Loyalty: The Electoral Relevance of Candidate Decision-Making in the 1964 Congressional
This content downloaded from 137.110.37.11 on Fri, 16 Aug 2013 12:05:55 PMAll use subject to JSTOR Terms and Conditions
1977 Presidential Popularity and Negative Voting 49
political participants-the President, candidates from his own party, and candidates from the opposition party-all adapt their own campaign roles and strategies to the President's level of public approbation.2 3 The role of the President as a campaigner, the campaign posture of his party's candidates toward him, and his status as a political issue to opponents are primarily determined by his public prestige.
The political science literature acknowledges pervasive national trends in voter defections but fails to identify their sources. The conventional wisdom of politicians and pundits, on the other hand, locates a national source, one which thoroughly complements the image of the typical voter developed by modern survey research. The issue positions of candidates may be ambiguous and confusing, but the electorate perceives clearly (or at least thinks it does) the policies and actions of the incumbent president. The party control of Congress may be unclear, but everyone knows the President's party and views him as its leader. Given the public's low levels of interest in and knowledge about politics, what better criterion exists for voting one's satisfaction or dissatisfaction with current government programs and performance than by voting for or against the President's party? To the extent that the President's policies reflect those of his party's congressional candidates- and they generally do-voting according to one's evaluation of the President becomes a viable and rational procedure for expressing one's own policy preferences and establishing the parameters of future government policy. Given this reasoning, the discovery of the relationship between presidential popularity
Elections," American Political Science Review, 63 (June, 1969), 515-520. For a more general analysis of politicians' beliefs about the importance of campaign strategies see John W. Kingdon, Candidates for Office: Beliefs and Strategies (New York: Random House, 1969).
23The author is currently investigating the degree to which career decisions of politicians are based on the President's public standing. Entry onto a number of rungs in the career ladder may be affected. The number of candidates seeking each party's congres- sional nomination, the percentage of congressmen from each party trying to become a senator or governor, and the percentage who decide to retire from the House are currently being examined. If presidential popularity is an important consideration in career movement we should find an inverse correla- tion between the Democratic and Republican percent- ages on the above measures. If a low presidential popularity is found to discourage viable candidates from the President's party from attempting to get on or move up the office ladder, while at the same time encouraging candidacies from the opposition, the overall congressional vote could, in part, reflect systematic party differences in the quality of the candidacies.
and congressional midterm voting may inform us about more than simply short-term national shifts in congressional voting. If such a rela- tionship does exist we may have identified an important-albeit imperfect-ingredient of rep- resentative government in the United States. There is good evidence that this view of democratic politics in America has been ap- preciated for over a century. James Bryce, describing American political institutions at the turn of the century, wrote:
Members [of the House of Representatives] are elected for two years, and the election always takes place in the even years, 1908, 1910, and so forth. Thus the election of every second Congress coincides with that of President; and admirers of the Constitution find in this arrangement another of their favourite "checks," because while it gives the incoming President a Congress presumably, though by no means necessarily, of the same political com- plexion as his own, it enables the people within two years to express their approval or disap- proval of his conduct by sending up another House of Representatives which may support or oppose the policy he hasfollowed24 (emphasis added).
The important question arises: Do voters take their evaluation of the President into account when voting in midterm congressional elec- tions?
A Highly Suggestive Midterm Election Trend
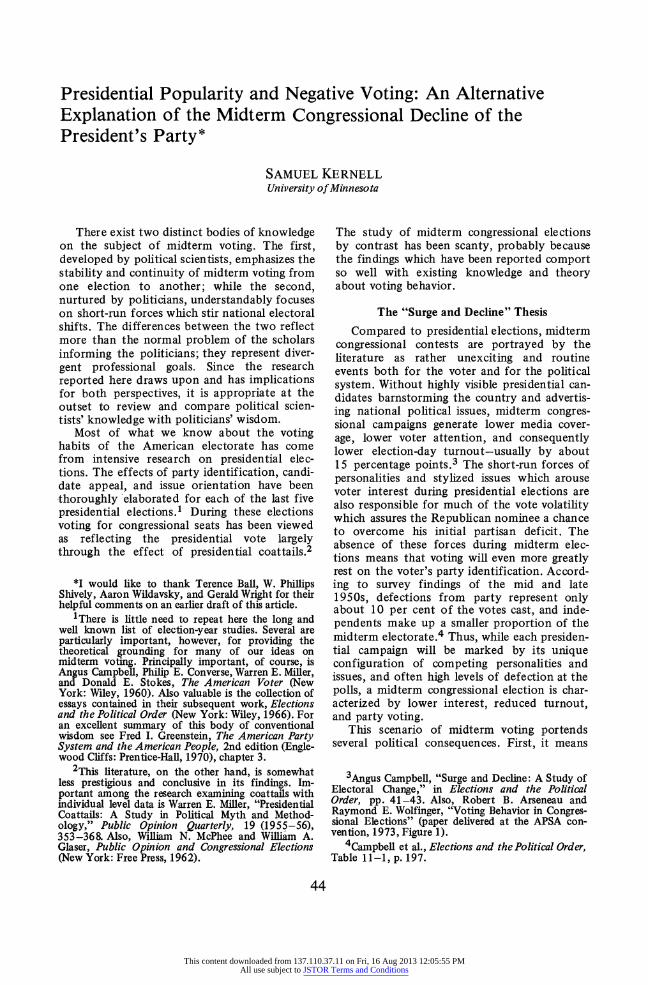
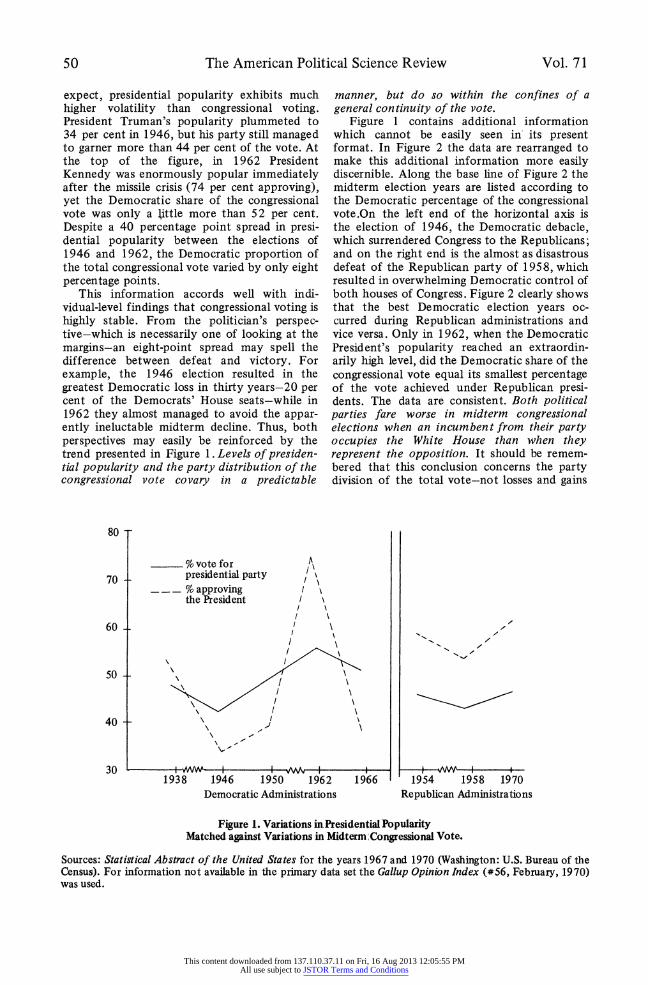
The date (1913) of Bryce's observation suggests that political actors have subscribed to these beliefs for some time. Traditionally mid- term election campaigns have revolved around attacks upon, and defense of, the President's policies, presumably with the view that if the President's party could be discredited, so would his party's congressional candidates. Only dur- ing the last thirty-five years, however, has the relationship between the congressional vote and the incumbent President's popularity been di- rectly observable. Figure 1 displays a rough parallelism of trends in presidential popularity and the congressional vote-a finding which supports the politician's pragmatic view. During both Democratic and Republican administra- tions, increases and decreases in the President's popularity are matched by a similar change in his party's congressional success. As one would
24James Bryce, The American Commonwealth (Norwood, Mass.: Macmillan and Company, 1913), p. 128. This "parliamentary" perspective of British ob- servers continues today. See Nelson W. Polsby, "Re- view Article: The British Science of American Poli- tics," British Journal of Political Science, 2 (Oct., 1972), 492.
This content downloaded from 137.110.37.11 on Fri, 16 Aug 2013 12:05:55 PMAll use subject to JSTOR Terms and Conditions
50 The American Political Science Review Vol. 71
expect, presidential popularity exhibits much higher volatility than congressional voting. President Truman's popularity plummeted to 34 per cent in 1946, but his party still managed to garner more than 44 per cent of the vote. At the top of the figure, in 1962 President Kennedy was enormously popular immediately after the missile crisis (74 per cent approving), yet the Democratic share of the congressional vote was only a Jittle more than 52 per cent. Despite a 40 percentage point spread in presi- dential popularity between the elections of 1946 and 1962, the Democratic proportion of the total congressional vote varied by only eight percentage points.
This information accords well with indi- vidual-level findings that congressional voting is highly stable. From the politician's perspec- tive-which is necessarily one of looking at the margins-an eight-point spread may spell the difference between defeat and victory. For example, the 1946 election resulted in the greatest Democratic loss in thirty years-20 per cent of the Democrats' House seats-while in 1962 they almost managed to avoid the appar- ently ineluctable midterm decline. Thus, both perspectives may easily be reinforced by the trend presented in Figure 1. Levels of presiden- tial popularity and the party distribution of the congressional vote covary in a predictable
manner, but do so within the confines of a general continuity of the vote.
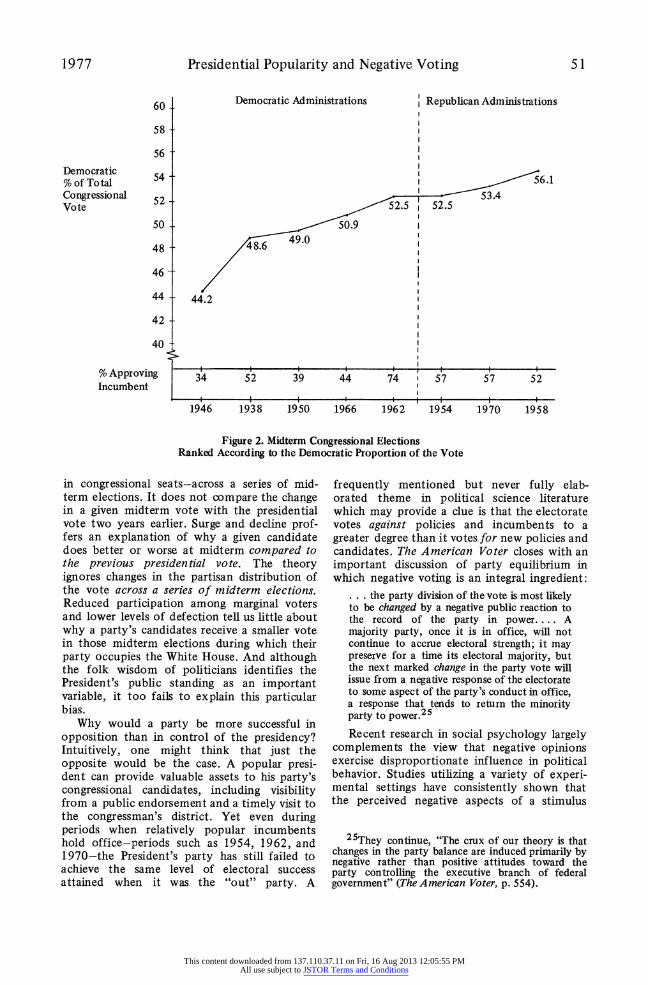
Figure 1 contains additional information which cannot be easily seen in its present format. In Figure 2 the data are rearranged to make this additional information more easily discernible. Along the base line of Figure 2 the midterm election years are listed according to the Democratic percentage of the congressional vote.On the left end of the horizontal axis is the election of 1946, the Democratic debacle, which surrendered Congress to the Republicans; and on the right end is the almost as disastrous defeat of the Republican party of 1958, which resulted in overwhelming Democratic control of both houses of Congress. Figure 2 clearly shows that the best Democratic election years oc- curred during Republican administrations and vice versa. Only in 1962, when the Democratic President's popularity reached an extraordin- arily high level, did the Democratic share of the congressional vote equal its smallest percentage of the vote achieved under Republican presi- dents. The data are consistent. Both political parties fare worse in midterm congressional elections when an incumbent from their party occu pies the White House than when they represent the opposition. It should be remem- bered that this conclusion concerns the party division of the total vote-not losses and gains
80
% vote for
70 - presidential party / _ _ %%approving X
the President / I \
60 /
50
40 ijI
30 -I--W W I I I I 1938 1946 1950 1962 1966 1954 1958 1970
Democratic Administrations Republican Administrations
Figure 1. Variations in Presidential Popularity Matched against Variations in Midterm Congressional Vote.
Sources: Statistical Abstract of the United States for the years 1967 and 1970 (Washington: U.S. Bureau of the Census). For information not available in the primary data set the Gallup Opinion Index (#56, February, 1970) was used.
This content downloaded from 137.110.37.11 on Fri, 16 Aug 2013 12:05:55 PMAll use subject to JSTOR Terms and Conditions
1977 Presidential Popularity and Negative Voting 51
60 Democratic Administrations Republican Administrations
58
56
Democratic 5 % of Total Congressional 52 5 533 ' Vote
50 50.9
48- ~ ~ ~~~~~~ .0
46 /
44- 44.2
42
40
% Approving | 34 52 39 44 74 57 57 52 Incumbent
l I l | I I I -I 1946 1938 1950 1966 1962 1954 1970 1958
Figure 2. Midterm Congressional Elections Ranked According to the Democratic Proportion of the Vote
in congressional seats-across a series of mid- term elections. It does not compare the change in a given midterm vote with the presidential vote two years earlier. Surge and decline prof- fers an explanation of why a given candidate does better or worse at midterm compared to the previous presidential vote. The theory ignores changes in the partisan distribution of the vote across a series of midterm elections. Reduced participation among marginal voters and lower levels of defection tell us little about why a party's candidates receive a smaller vote in those midterm elections during which their party occupies the White House. And although the folk wisdom of politicians identifies the President's public standing as an important variable, it too fails to explain this particular bias.
Why would a party be more successful in opposition than in control of the presidency? Intuitively, one might think that just the opposite would be the case. A popular presi- dent can provide valuable assets to his party's congressional candidates, including visibility from a public endorsement and a timely visit to the congressman's district. Yet even during periods when relatively popular incumbents hold office-periods such as 1954, 1962, and 1970-the President's party has still failed to achieve the same level of electoral success attained when it was the "out" party. A
frequently mentioned but never fully elab- orated theme in political science literature which may provide a clue is that the electorate votes against policies and incumbents to a greater degree than it votes for new policies and candidates. The American Voter closes with an important discussion of party equilibrium in which negative voting is an integral ingredient:
... the party division of the vote is most likely to be changed by a negative public reaction to the record of the party in power.... A majority party, once it is in office, will not continue to accrue electoral strength; it may preserve for a time its electoral majority, but the next marked change in the party vote will issue from a negative response of the electorate to some aspect of the party's conduct in office, a response that tends to return the minority party to power.25
Recent research in social psychology largely complements the view that negative opinions exercise disproportionate influence in political behavior. Studies utilizing a variety of experi- mental settings have consistently shown that the perceived negative aspects of a stimulus
25They continue, "The crux of our theory is that changes in the party balance are induced primarily by negative rather than positive attitudes toward the party controlling the executive branch of federal government" (The American Voter, p. 554).
This content downloaded from 137.110.37.11 on Fri, 16 Aug 2013 12:05:55 PMAll use subject to JSTOR Terms and Conditions
52 The American Political Science Review Vol. 71
object are more determinative of the overall evaluation of the object than its positive as- pects.26 When this asymmetry of evaluations is applied to voting behavior, the proposition that negative stimuli are more instrumental to the vote choice than positive would appear to be reflected in two ways. First, failures of incum- bents are more important than their achieve- ments, and despite a long list of accomplish- ments, a conspicuous failure may threaten re-election.27 Second, the greater strength of negative.evaluations suggests that voters upset with an incumbent's performance will be more activated to vote against the individual than are satisfied voters likely to support him. Thus, even a popular president is not immune from negative voting; he still must work to overcome the disproportionately greater turnout and de- fection among those voters who are displeased for one reason or another with his perfor- mance.28
Tailoring this thesis to the question of the influence of presidential popularity on congres- sional voting, a negative voting model hypothe- sizes that citizens displeased with a president's performance are more likely to vote against his
26David E. Kanouse and L. Reid Hanson, Jr., Negativity in Evaluations (Morristown, N.J.: General Learning Press, 1972). The authors summarize the experimental research: "It seems that negativity biases occur against a backdrop of perceived bliss-indeed perhaps because of it. Given that most people perceive the world as a predominantly positive place, there are a number of reasons why one might expect them to weigh positive information rather more lightly than negative. First, there is the well-known judgmental anchoring, or contrast, effect. In a world of ointment the fly seems bad indeed. Second, if most choices and behavior-relevant evaluations are made from a range of general positive alternatives, it is simpler and less effortful to sort the alternatives on the basis of their few negative aspects rather than the many positive ones," p. 10. Another review of a negativity bias is Nehemiah Jordan's, "The 'Asymmetry' of 'Liking' and 'Disliking': A Phenomenon Meriting Further Reflec- tion and Research," Public Opinion Quarterly, 29 (Summer, 1965), 315-322.
27Perhaps no better recent illustration of this phenomenon exists than the case of Hubert Humphrey in 1968. Throughout the 1950s and mrid-1960s Sena- tor Humphrey, co-founder of the Americans for Democratic Action, was the chief originator and advocate of liberal social policies in the Senate, yet because of his association with President Johnson's Vietnam war policies, Humphrey suffered a severe drop in popularity within the liberal community during his 1968 bid for the presidency.
28Although negative evaluations may be more instrumental, positive evaluations are generally pre- ferred and more pervasive. Thus, incumbents may be able to overcome negative voting largely as a result of their generally positive evaluation by the citizenry. See David 0. Sears and Richard E. Whitney, Political Persuasion (Morristown, N.J.: General Learning Cor- poration, 1973), pp. 10-17.
party's congressional candidates than are satis- fied voters likely to vote for them. The Presi- dent's party label becomes a target for retribu- tion.29 The relationship depicted in Figure 2 suggests that the benefits of negative voting accruing to the party out of the White House will probably exceed any salutary electoral effects of having a popular president from one's own party. High presidential popularity reduces the deleterious consequences largely to the degree that it limits the number of voters who are dissatisfied (or at least attribute blame) and are thus likely to engage in negative voting.
The negative voting model is interesting in several respects. First, it parsimoniously incor- porates both variables presented in Figures 1 and 2; presidential popularity operates within the context of the overriding qualitative vari- able, the President's party. Low popularity, according to this model, indicates that a large proportion of the electorate may be disposed toward negative voting. The Republicans won 56 per cent of the vote on such an occasion in 1946. The Democrats until 1974 had not been in such an auspicious position; the 1954, 1958, and 1970 elections featured relatively popular Republican incumbents. At the beginning of August it appeared that the 1974 congressional elections would present a critical extension and test of the model, but the resignation of President Nixon, the assumption of office by Gerald Ford, and his initially strong public approval made the effect of Ford's popularity on the election less certain. The evidence available leaves little doubt that former Presi- dent Nixon's low public support contributed greatly to the Democratic landslide that year. In March of 1974, when Nixon's popularity in the wake of Watergate had fallen sharply to only 26 per cent approval, a cross-section of the public was asked which party it would like to see win the next congressional elections (using a test instrument of proven value in accurately predicting the actual nationwide congressional vote).30 Among respondents giving an opinion,
29Howard S. Bloom and H. Douglas Price in a time-series study of the effects of short-run economic change on congressional voting find a negativity bias operating. "Political Parties are 'punished' by the voters for economic downturns but are not 'rewarded' accordingly for prosperity." American Political Sci- ence Review, 69 (December, 1975), 1240-1253. Other studies use the party of the administration as the benchmark for testing the effects of economy on short-run political change. See Gerald H. Kramer, "Short-term Fluctuations in U.S. Voting Behavior, 1896-1964,"American Political Science Review, 65 (March, 1971), 131-143.
30The survey question asks which party the respon- dent would like to see "win his state in the next congressional election." Responses to this item corre- late at .80 (Pearson r) with reported actual vote.
This content downloaded from 137.110.37.11 on Fri, 16 Aug 2013 12:05:55 PMAll use subject to JSTOR Terms and Conditions
1977 Presidential Popularity and Negative Voting 53
66 per cent preferred the Democrats, a propor- tion that would represent the largest Democratic landslide of the twentieth century! Although a fuller examination of the relation- ship between Nixon's decline in public esteem and preferences for the 1974 congressional elections will follow, it should be noted here that this finding is fully consistent with the pattern plotted in Figure 2.
Second, the negative voter model sustains another popular belief that presidential efforts to influence the midterm congressional vote generally do more harm than good. Despite this long-standing dictum and little historical evi- dence to the contrary, recent presidents have done more midterm campaigning than their predecessors.3 When the President increases the public association between himself and a congressional candidate, he unwittingly facili- tates the transference of negative affect as well as positive.32 This is undoubtedly why the more perspicacious party leaders asked Presi- dent Truman to stay at home during the 1946 campaigns. To the degree that negative evalua- tions are more determinative than positive ones, even a popular president may prove to be a net liability to his party's congressional candidates. Negative voting offers a more plausible alterna- tive explanation to the usual surmise that presidents are not successful because voters dislike presidential meddling in local affairs.
Third, the negative voting model offers an important alteration of the surge and decline thesis. in Table 1 we saw that the composition of midterm electorates with respect to party defections and the proportion of independent voters is similar to that of presidential elec- torates. Although each midterm election has remained consistent with the pattern of lower overall turnout, it appears that the reduction in turnout is not so uneven as to affect greatly the partisan complexion of the electorate. Since the negative voting model posits the evaluation of the President as a pivotal motivational cue, we may find that there will be in fact differential withdrawal from the electorate but that it will not necessarily show up in the turnout levels among the categories of voters identified by the surge and decline thesis-party voters, defec-
31Nixon's 1970 congressional election campaigning has been described by Evans and Novak as a "white heat." See Rowland Evans Jr. and Robert D. Novak, Nixon in the White House: The Frustration of Power (New York: Random House, 1971).
32At the presidential level, Richard W. Boyd in his analysis of the 1968 presidential election found such a transference from President Johnson to his party's nominee, Hubert Humphrey. See Boyd, "Popular Control of Public Policy: A Normal Vote Analysis of the 1968 Election," American Political Science Re- view, 66 (June, 1972), 440.
tors, and independents. Each group's relative level of participation may remain more or less stable, yet within each the net partisan prefer- ences of those who do vote may systematically become less favorable to the President's party from the presidential to the midterm election. For example, independents who disapprove the President may be more activated to vote. Whatever the overall changes in their propor- tion of the electorate, internally they may be stacked during the midterm with greater pro- portions of disapproving voters. Thus, unless the President's popularity remains very high, his party's overall percentage of the congressional vote declines. Differential turnout remains cen- tral to the outcome, but different categories of voters, disapprovers and approvers, are identi- fied as respectively staying in and dropping out.
The negative voting model possesses the desirable quality of being both simple and capacious. It fits neatly with the conventional wisdom of politicians, who hold that the presidency is an important ingredient in the success of congressional candidates even during off-year elections. It explains routine nation- wide trends of decline in the appeal of the president's party just two years after victory. To the extent that negative voting does not require a highly informed or politically involved citizenry, it accepts and incorporates much of what we know and believe about the average voter's decision-making processes. Indeed, the model appears tailored to facilitate policy voting among the poorly informed and inatten- tive public in that the criterion for the voting choice becomes the most visible participant in the American political system. And finally, the model presented here appears capable of ex- plaining and predicting national shifts in party fortunes even at their extremes.
The question which remains then is, Is it valid? To avoid committing an error akin to the ecological fallacy by accepting too readily a model of individual voting behavior built exclu- sively of aggregate percentages and relation- ships, a thorough analysis of individual-level data is required.
The Schema for Testing the Negative Voting Model
The negative voting model contains two components. First, it posits an association between presidential popularity and midterm voting, and second, it argues that the effects of presidential approval and disapproval are un- equal, with negative opinion being more deter- minative of voting behavior. These two aspects of negative voting point to two alternative models which must be shown to be less adequate explanations of the findings. First,
This content downloaded from 137.110.37.11 on Fri, 16 Aug 2013 12:05:55 PMAll use subject to JSTOR Terms and Conditions
54 The American Political Science Review Vol. 71
there is the null hypothesis that no relationship exists between voting and presidential populari- ty. If the virtual absence of study on the subject indicates anything, it may be that the null hypothesis represents the favored view of political scientists (although not as we have seen, of politicians). Voting for aspiring office- holders to an institution clearly separate from the presidency and with little if any connection between the candidates and the incumbent President who is absent from the ballot, so the argument might go, should naturally divorce opinions about the President from congres- sional preferences.
The only published research found which empirically investigates the relationship be- tween midterm voting and presidential approv- al, is a now obscure article by John Harding in the American Political Science Review in 1944.33 Conducted under the constrictions of a wartime setting, Harding's investigation was hampered by a small national sample of 230 respondents. Largely as a consequence, Harding failed to find a statistically significant relation- ship between evaluation of President Roose- velt's job performance and the respondents' reported vote in the 1942 congressional elec- tions. Failing to disconfirm the null hypothesis, Harding moved on to other, more promising, explanatory variables. For three decades this conclusion has gone unquestioned.
The second alternative set of hypotheses may be called the "consistency" model. Like negative voting it posits a direct relationship between presidential popularity and congres- sional voting choices. Voters whose evaluations of the President are congruent with their party identification (for example, a Republican ap- proving a Republican president) should show up at the polls in higher proportions and vote overwhelmingly according to the party line. Because party identification is a primary deter- minant of presidential approval, we should expect to find that most voters do hold congruent and reinforcing attitudes and as a result vote for their own party's candidate. By contrast, the smaller group of voters whose evaluations of the President are in conflict with their party identification, should show some- what lower levels of participation and greater levels of defection than the consistent group. The size of the defection to or from the presidential party's candidate would reflect the relative independent strength of party identifi- cation and presidential popularity. We may predict that party identification should more
33John Harding, "The 1942 Congressional Elec- tions," American Political Science Review, 38 (Febru- ary, 1944), 41-58.
often be the more powerful variable. What distinguishes the consistency model from nega- tive voting is that, ceteris paribus, defection to the President's party by approvers should be as great as defection away from it by his detrac- tors. It is this feature-the implicit assumption that approval and disapproval of the President have an equal motivational impact on the vote-that separates the consistency voting pre- dictions from those of negative voting. The predictions for both models, and for the null hypothesis are delineated in Table 2.
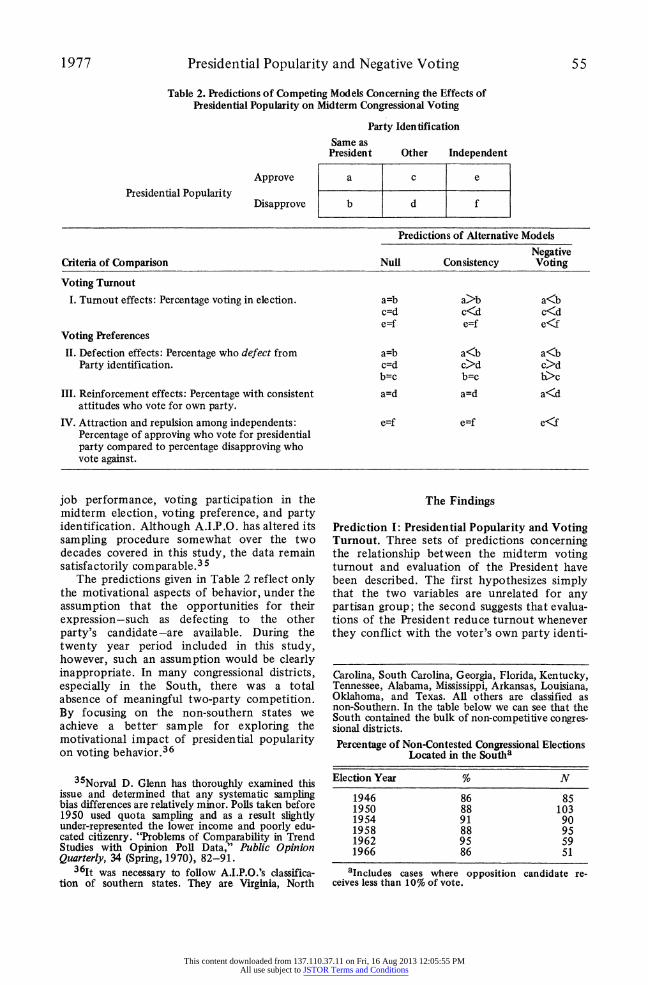
The crucial predictions for the null hypothe- sis concern turnout and defection, predictions I and II respectively. Approvers and disapprovers should resemble each other both in their levels of voting participation and their degree of party voting; the predictions for III and IV are derivative of the first two. The turnout predic- tion of the consistency model that "a>b" (i.e., approvers from the President's party are more participant than disapprovers) borrows from cross-pressure research which has found with- drawal from conflictual settings a common method of tension reduction. It is this predic- tion that most differentiates the consistency and negative voting models. Negative voting predicts the opposite ranking, with disapprovers within the president's party more likely to vote than his party's approvers (i.e., "a<b").l More- over, the negative voting model predicts that independents who disapprove of the President vote at a higher rate than independents who approve, that is, "e<f." The same theme governs predictions II and IV (partisan defec- tion and independent attraction-repulsion) where the basic difference between the consis- tency model and negative voting is the hypothe- sis that negative evaluations will be more determinative of the vote choice. Prediction III also incorporates basically the same idea: if negative evaluations of the president are more important, they should reinforce party loyalties to a greater degree than positive evaluations. With these predictions we have a succinct and convenient method of exploring the data and providing a thorough assessment of negative voting against simpler and more conventional expectations.
The primary data set consists of six national surveys taken immediately after each midterm election from 1946 through 1966 by the American Institute of Public Opinion.34 For- tunately, each postelection survey during this period solicited the vital information necessary for this inquiry: evaluation of the president's
34Each poll was taken within one month of the election. Unfortunately, in 1970 AJ.P.O. failed to ask the presidential popularity item in its postelection surey.
This content downloaded from 137.110.37.11 on Fri, 16 Aug 2013 12:05:55 PMAll use subject to JSTOR Terms and Conditions
1977 Presidential Popularity and Negative Voting 55
Table 2. Predictions of Competing Models Concerning the Effects of Presidential Popularity on Midterm Congressional Voting
Party Identification
Same as President Other Independent
Approve a c e
Presidential Popularity Disapprove b d f
Predictions of Alternative Models
Negative Criteria of Comparison Null Consistency Voting
Voting Turnout
I. Turnout effects: Percentage voting in election. a=b a>b a<b c=d c<d c<d e --f e=f e<f
Voting Preferences
II. Defection effects: Percentage who defect from a=b a<b a<b Party identification. c=d c>d c>d
b=c b=c h>c
III. Reinforcement effects: Percentage with consistent a=d a=d a<d attitudes who vote for own party.
IV. Attraction and repulsion among independents: e=f e=f e<f Percentage of approving who vote for presidential party compared to percentage disapproving who vote against.
job performance, voting participation in the midterm election, voting preference, and party identification. Although A.I.P.O. has altered its sampling procedure somewhat over the two decades covered in this study, the data remain satisfactorily comparable.35
The predictions given in Table 2 reflect only the motivational aspects of behavior, under the assumption that the opportunities for their expression-such as defecting to the other party's candidate-are available. During the twenty year period included in this study, however, such an assumption would be clearly inappropriate. In many congressional districts, especially in the South, there was a total absence of meaningful two-party competition. By focusing on the non-southern states we achieve a better sample for exploring the motivational impact of presidential popularity on voting behavior.36
35Norval D. Glenn has thoroughly examined this issue and determined that any systematic sampling bias differences are relatively minor. Polls taken before 1950 used quota sampling and as a result slightly under-represented the lower income and poorly edu- cated citizenry. "Problems of Comparability in Trend Studies with Opinion Poll Data," Public Opinion Quarterly, 34 (Spring, 1970), 82-91.
361t was necessary to follow A.I.P.O.'s classifica- tion of southern states. They are Virginia, North
The Findings
Prediction I: Presidential Popularity and Voting Turnout. Three sets of predictions concerning the relationship between the midterm voting turnout and evaluation of the President have been described. The first hypothesizes simply that the two variables are unrelated for any partisan group; the second suggests that evalua- tions of the President reduce turnout whenever they conflict with the voter's own party identi-
Carolina, South Carolina, Georgia, Florida, Kentucky, Tennessee, Alabama, Mississippi, Arkansas, Louisiana, Oklahoma, and Texas. All others are classified as non-Southern. In the table below we can see that the South contained the bulk of non-competitive congres- sional districts.
Percentage of Non-Contested Congressional Elections Located in the Southa
Election Year % N
1946 86 85 1950 88 103 1954 91 90 1958 88 95 1962 95 59 1966 86 51
aIncludes cases where opposition candidate re- ceives less than 10% of vote.
This content downloaded from 137.110.37.11 on Fri, 16 Aug 2013 12:05:55 PMAll use subject to JSTOR Terms and Conditions
56 The American Political Science Review Vol. 71
Table 3. Prediction I: The Relationship Between Presidential Approval and Midterm Election Turnout (Percent Voting, Non-South Only)
Party Presidential 1946 1950 1954 1958 1962 1966 Identification Popularity % N % N % N % N % N % N
Same as Approve 65 (434) 74 (220) 80 (280) 80 (274) 69 (1381) 64 (754) President's Disapprove 66 (332) 70 (131) 50 ( 16) 61 ( 39) 72 ( 18) 77 (160)
Difference -1 +4 +30 +19* -3 -13*
Other Approve 67 (245) 66 ( 61) 56 (163) 74 (161) 74 (501) 66 (238) Disapprove 83 (727) 85 (277) 70 (180) 70 (197) 85 (280) 78 (446) Difference -16* -19* -14* +4 -11* -12*
Independent Approve 54 (188) 54 ( 96) 56 (117) 58 (136) 56 (517) 55 (289) Disapprove 70 (381) 75 (138) 70 ( 44) 66 ( 65) 78 ( 64) 56 (229) Difference -16* -21* -14 -8 -22* -1
*Percentage point differences statistically significant at .05 or better. Negative sign confirms prediction of Negative Voting Model.
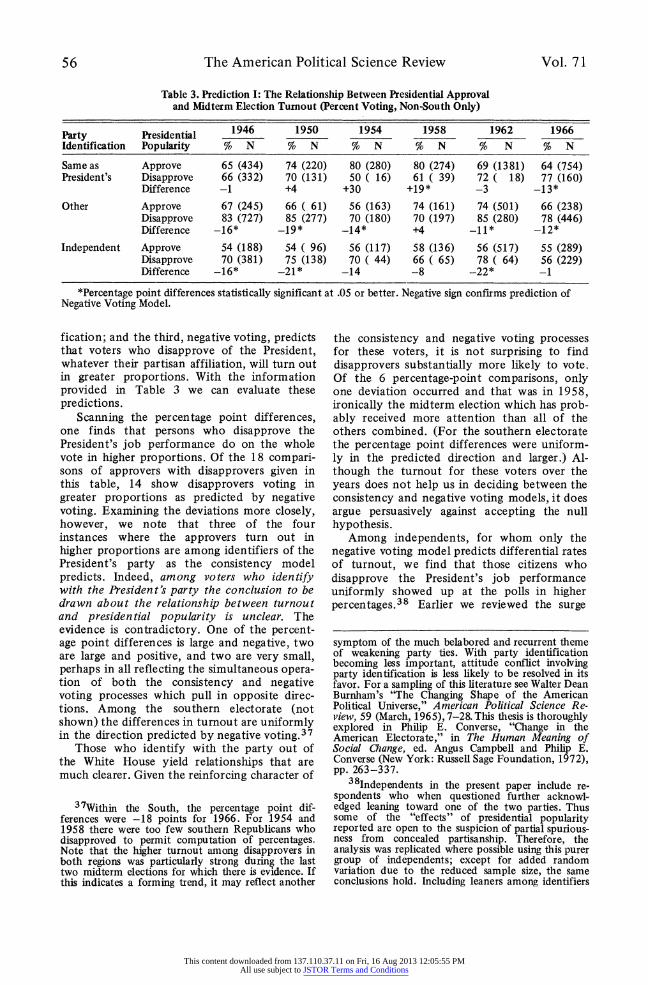
fication; and the third, negative voting, predicts that voters who disapprove of the President, whatever their partisan affiliation, will turn out in greater proportions. With the information provided in Table 3 we can evaluate these predictions.
Scanning the percentage point differences, one finds that persons who disapprove the President's job performance do on the whole vote in higher proportions. Of the 18 compari- sons of approvers with disapprovers given in this table, 14 show disapprovers voting in greater proportions as predicted by negative voting. Examining the deviations more closely, however, we note that three of the four instances where the approvers turn out in higher proportions are among identifiers of the President's party as the consistency model predicts. Indeed, among voters who identify with the President's party the conclusion to be drawn about the relationship between turnout and presidential popularity is unclear. The evidence is contradictory. One of the percent- age point differences is large and negative, two are large and positive, and two are very small, perhaps in all reflecting the simultaneous opera- tion of both the consistency and negative voting processes which pull in opposite direc- tions. Among the southern electorate (not shown) the differences in turnout are uniformly in the direction predicted by negative voting.37
Those who identify with the party out of the White House yield relationships that are much clearer. Given the reinforcing character of
37Within the South, the percentage point dif- ferences were -18 points for 1966. For 1954 and 1958 there were too few southern Republicans who disapproved to permit computation of percentages. Note that the higher turnout among disapprovers in both regions was particularly strong during the last two midterm elections for which there is evidence. If this indicates a forming trend, it may reflect another
the consistency and negative voting processes for these voters, it is not surprising to find disapprovers substantially more likely to vote. Of the 6 percentage-point comparisons, only one deviation occurred and that was in 1958, ironically the midterm election which has prob- ably received more attention than all of the others combined. (For the southern electorate the percentage point differences were uniform- ly in the predicted direction and larger.) Al- though the turnout for these voters over the years does not help us in deciding between the consistency and negative voting models, it does argue persuasively against accepting the null hypothesis.
Among independents, for whom only the negative voting model predicts differential rates of turnout, we find that those citizens who disapprove the President's job performance uniformly showed up at the polls in higher percentages.38 Earlier we reviewed the surge
symptom of the much belabored and recurrent theme of weakening party ties. With party identification becoming less important, attitude conflict involving party identification is less likely to be resolved in its favor. For a sampling of this literature see Walter Dean Burnham's "The Changing Shape of the American Political Universe," American Political Science Re- view, 59 (March, 1965), 7-28. This thesis is thoroughly explored in Philip E. Converse, "Change in the American Electorate," in The Human Meaning of Social Change, ed. Angus Campbell and Philip E. Converse (New York: Russell Sage Foundation, 1972), pp. 263-337.
38Independents in the present paper include re- spondents who when questioned further acknowl- edged leaning toward one of the two parties. Thus some of the "effects" of presidential popularity reported are open to the suspicion of partial spurious- ness from concealed partisanship. Therefore, the analysis was replicated where possible using this purer group of independents; except for added random variation due to the reduced sample size, the same conclusions hold. Including leaners among identifiers
This content downloaded from 137.110.37.11 on Fri, 16 Aug 2013 12:05:55 PMAll use subject to JSTOR Terms and Conditions
1977 Presidential Popularity and Negative Voting 57
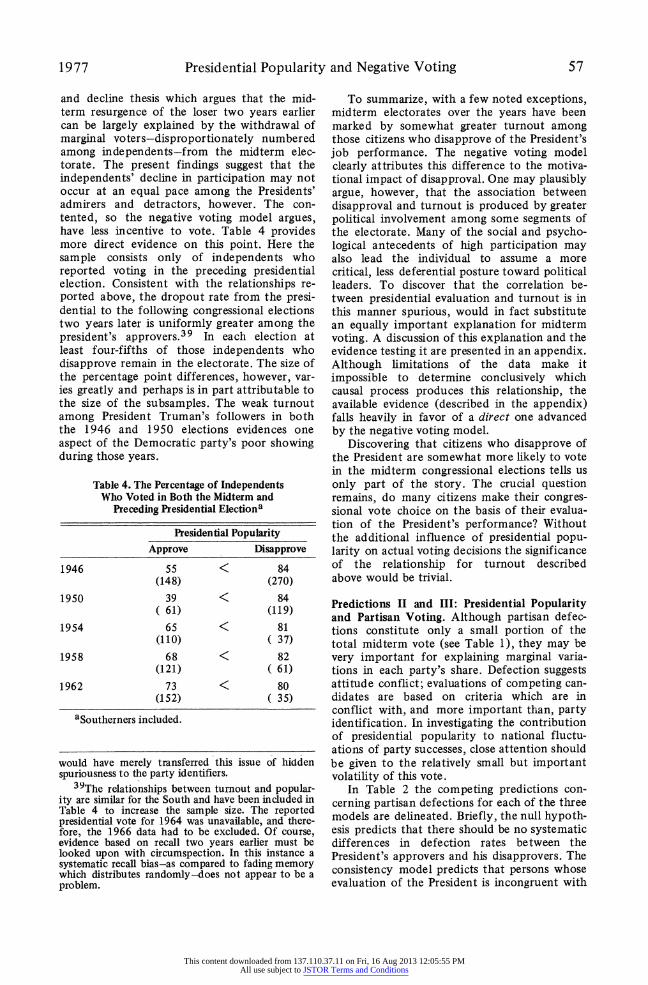
and decline thesis which argues that the mid- term resurgence of the loser two years earlier can be largely explained by the withdrawal of marginal voters-disproportionately numbered among independents-from the midterm elec- torate. The present findings suggest that the independents' decline in participation may not occur at an equal pace among the Presidents' admirers and detractors, however. The con- tented, so the negative voting model argues, have less incentive to vote. Table 4 provides more direct evidence on this point. Here the sample consists only of independents who reported voting in the preceding presidential election. Consistent with the relationships re- ported above, the dropout rate from the presi- dential to the following congressional elections two years later is uniformly greater among the president's approvers.39 In each election at least four-fifths of those independents who disapprove remain in the electorate. The size of the percentage point differences, however, var- ies greatly and perhaps is in part attributable to the size of the subsamples. The weak turnout among President Truman's followers in both the 1946 and 1950 elections evidences one aspect of the Democratic party's poor showing during those years.
Table 4. The Percentage of Independents Who Voted in Both the Midterm and
Preceding Presidential Electiona
Presidential Popularity
Approve Disapprove
1946 55 < 84 (148) (270)
1950 39 < 84 61) (119)
1954 65 < 81 (110) ( 37)
1958 68 < 82 (121) ( 61)
1962 73 < 80 (152) ( 35)
aSoutherners included.
would have merely transferred this issue of hidden spuriousness to the party identifiers.
39The relationships between turnout and popular- ity are similar for the South and have been included in Table 4 to increase the sample size. The reported presidential vote for 1964 was unavailable, and there- fore, the 1966 data had to be excluded. Of course, evidence based on recall two years earlier must be looked upon with circumspection. In this instance a systematic recall bias-as compared to fading memory which distributes randomly-does not appear to be a problem.
To summarize, with a few noted exceptions, midterm electorates over the years have been marked by somewhat greater turnout among those citizens who disapprove of the President's job performance. The negative voting model clearly attributes this difference to the motiva- tional impact of disapproval. One may plausibly argue, however, that the association between disapproval and turnout is produced by greater political involvement among some segments of the electorate. Many of the social and psycho- logical antecedents of high participation may also lead the individual to assume a more critical, less deferential posture toward political leaders. To discover that the correlation be- tween presidential evaluation and turnout is in this manner spurious, would in fact substitute an equally important explanation for midterm voting. A discussion of this explanation and the evidence testing it are presented in an appendix. Although limitations of the data make it impossible to determine conclusively which causal process produces this relationship, the available evidence (described in the appendix) falls heavily in favor of a direct one advanced by the negative voting model.
Discovering that citizens who disapprove of the President are somewhat more likely to vote in the midterm congressional elections tells us only part of the story. The crucial question remains, do many citizens make their congres- sional vote choice on the basis of their evalua- tion of the President's performance? Without the additional influence of presidential popu- larity on actual voting decisions the significance of the relationship for turnout described above would be trivial.
Predictions II and III: Presidential Popularity and Partisan Voting. Although partisan defec- tions constitute only a small portion of the total midterm vote (see Table 1), they may be very important for explaining marginal varia- tions in each party's share. Defection suggests attitude conflict; evaluations of competing can- didates are based on criteria which are in conflict with, and more important than, party identification. In investigating the contribution of presidential popularity to national fluctu- ations of party successes, close attention should be given to the relatively small but important volatility of this vote.
In Table 2 the competing predictions con- cerning partisan defections for each of the three models are delineated. Briefly, the null hypoth- esis predicts that there should be no systematic differences in defection rates between the President's approvers and his disapprovers. The consistency model predicts that persons whose evaluation of the President is incongruent with
This content downloaded from 137.110.37.11 on Fri, 16 Aug 2013 12:05:55 PMAll use subject to JSTOR Terms and Conditions
58 The American Political Science Review Vol. 71
their own party identification should defect in larger proportions than voters whose presi- dential evaluation is consistent with party identification. The negative voting model in- cludes this prediction and goes further to suggest that presidential disapproval, when in conflict with party identification, will produce greater strain toward defection than will ap- proval in a similar context. Consequently, in any given midterm election, the rates of defec- tion among identifiers of the President's party who disapprove of their incumbent should be higher than among identifiers of the other party who approve of his job performance, or accord- ing to the schema given in Table 2, "b>c." Similarly, disapproval should more strongly reinforce existing party affiliation when congru- ent. Here again, members of the "out" party should be more inclined to vote the party line (or a<d in Prediction III) according to negative voting. If these hypotheses are verified, we shall have gone some distance in explaining why the political parties seem to perform more poorly in midterm elections when they occupy the White House.
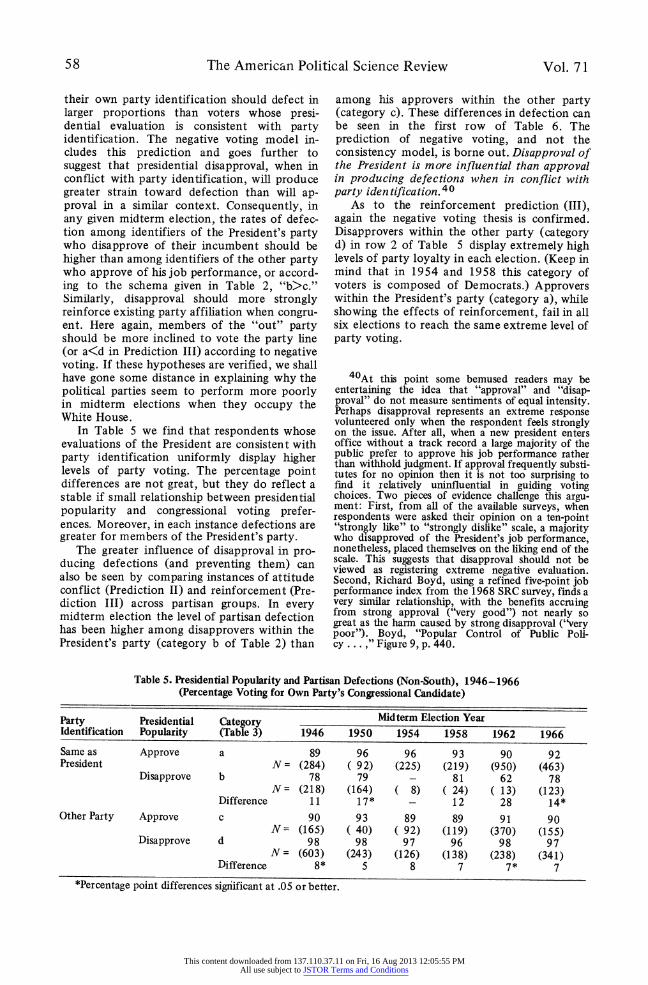
In Table 5 we find that respondents whose evaluations of the President are consistent with party identification uniformly display higher levels of party voting. The percentage point differences are not great, but they do reflect a stable if small relationship between presidential popularity and congressional voting prefer- ences. Moreover, in each instance defections are greater for members of the President's party.
The greater influence of disapproval in pro- ducing defections (and preventing them) can also be seen by comparing instances of attitude conflict (Prediction II) and reinforcement (Pre- diction III) across partisan groups. In every midterm election the level of partisan defection has been higher among disapprovers within the President's party (category b of Table 2) than
among his approvers within the other party (category c). These differences in defection can be seen in the first row of Table 6. The prediction of negative voting, and not the consistency model, is borne out. Disapproval of the President is more influential than approval in producing defections when in conflict with party identification.40
As to the reinforcement prediction (III), again the negative voting thesis is confirmed. Disapprovers within the other party (category d) in row 2 of Table 5 display extremely high levels of party loyalty in each election. (Keep in mind that in 1954 and 1958 this category of voters is composed of Democrats.) Approvers within the President's party (category a), while showing the effects of reinforcement, fail in all six elections to reach the same extreme level of party voting.
40At this point some bemused readers may be entertaining the idea that "approval" and "disap- proval" do not measure sentiments of equal intensity. Perhaps disapproval represents an extreme response volunteered only when the respondent feels strongly on the issue. After all, when a new president enters office without a track record a large majority of the public prefer to approve his job performance rather than withhold judgment. If approval frequently substi- tutes for no opinion then it is not too surprising to find it relatively uninfluential in guiding voting choices. Two pieces of evidence challenge this argu- ment: First, from all of the available surveys, when respondents were asked their opinion on a ten-point "strongly like" to "strongly dislike" scale, a majority who disapproved of the President's job performance, nonetheless, placed themselves on the liking end of the scale. This suggests that disapproval should not be viewed as registering extreme negative evaluation. Second, Richard Boyd, using a refined five-point job performance index from the 1968 SRC survey, finds a very similar relationship, with the benefits accruing from strong approval ("very good") not nearly so great as the harm caused by strong disapproval ("very poor"). Boyd, "Popular Control of Public Poli- cy . . . ," Figure 9, p. 440.
Table 5. Presidential Popularity and Partisan Defections (Non-South), 1946-1966 (Percentage Voting for Own Party's Congressional Candidate)
Party Presidential Category Midterm Election Year Identification Popularity (Table 3) 1946 1950 1954 1958 1962 1966
Same as Approve a 89 96 96 93 90 92 President N = (284) ( 92) (225) (219) (950) (463)
Disapprove b 78 79 - 81 62 78 N = (218) (164) ( 8) ( 24) (13) (123)
Difference 11 17* - 12 28 14* Other Party Approve c 90 93 89 89 91 90
N= (165) ( 40) ( 92) (119) (370) (155) Disapprove d 98 98 97 96 98 97
N= (603) (243) (126) (138) (238) (341) Difference 8* 5 8 7 7* 7
*Percentage point differences significant at .05 or better.
This content downloaded from 137.110.37.11 on Fri, 16 Aug 2013 12:05:55 PMAll use subject to JSTOR Terms and Conditions
1977 Presidential Popularity and Negative Voting 59
Table 6. Disapproval of the President as More Powerful in Producing Defections and Reinforcing Party Identification (Percentages drawn from Table 5)
1946 1950 1954 1958 1962 1966
Attitude Conflict (Percentage Defecting)
Prediction I. b > c +12a +14 - +8 +29 +12
Reinforcement (Percentage Voting Party-Line)
Prediction III. a < d +9 + 2 +1 +3 + 8 + 5
aPercentage point differences between identified categories. Positive differences are in the predicted direction.
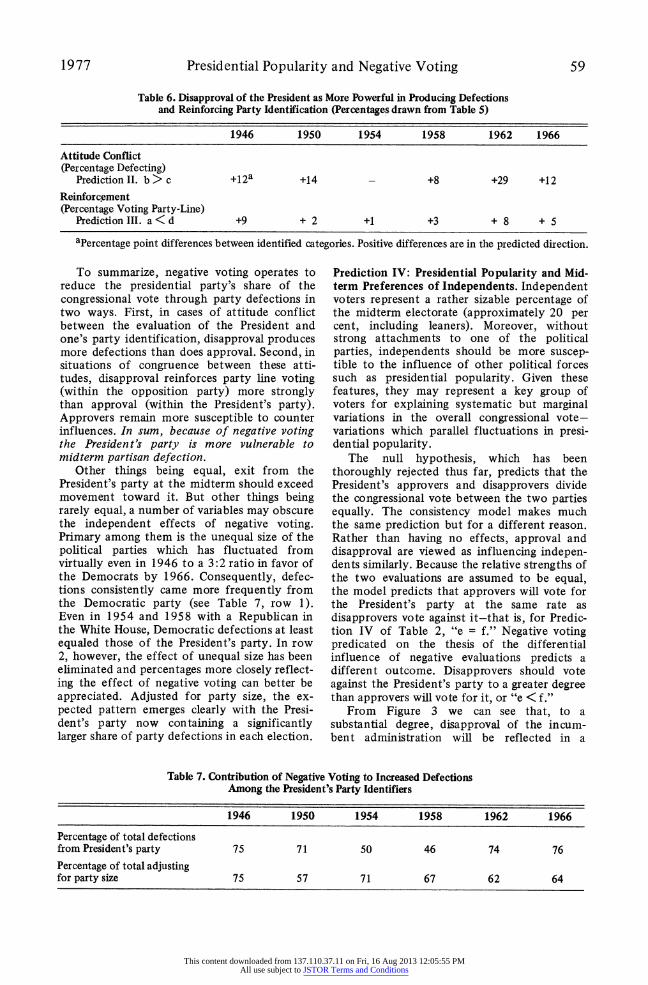
To summarize, negative voting operates to reduce the presidential party's share of the congressional vote through party defections in two ways. First, in cases of attitude conflict between the evaluation of the President and one's party identification, disapproval produces more defections than does approval. Second, in situations of congruence between these atti- tudes, disapproval reinforces party line voting (within the opposition party) more strongly than approval (within the President's party). Approvers remain more susceptible to counter influences. In sum, because of negative voting the President's party is more vulnerable to midterm partisan defection.
Other things being equal, exit from the President's party at the midterm should exceed movement toward it. But other things being rarely equal, a number of variables may obscure the independent effects of negative voting. Primary among them is the unequal size of the political parties which has fluctuated from virtually even in 1946 to a 3:2 ratio in favor of the Democrats by 1966. Consequently, defec- tions consistently came more frequently from the Democratic party (see Table 7, row 1). Even in 1954 and 1958 with a Republican in the White House, Democratic defections at least equaled those of the President's party. In row 2, however, the effect of unequal size has been eliminated and percentages more closely reflect- ing the effect of negative voting can better be appreciated. Adjusted for party size, the ex- pected pattern emerges clearly with the Presi- dent's party now containing a significantly larger share of party defections in each election.
Prediction IV: Presidential Popularity and Mid- term Preferences of Independents. Independent voters represent a rather sizable percentage of the midterm electorate (approximately 20 per cent, including leaners). Moreover, without strong attachments to one of the political parties, independents should be more suscep- tible to the influence of other political forces such as presidential popularity. Given these features, they may represent a key group of voters for explaining systematic but marginal variations in the overall congressional vote- variations which parallel fluctuations in presi- dential popularity.
The null hypothesis, which has been thoroughly rejected thus far, predicts that the President's approvers and disapprovers divide the congressional vote between the two parties equally. The consistency model makes much the same prediction but for a different reason. Rather than having no effects, approval and disapproval are viewed as influencing indepen- dents similarly. Because the relative strengths of the two evaluations are assumed to be equal, the model predicts that approvers will vote for the President's party at the same rate as disapprovers vote against it-that is, for Predic- tion IV of Table 2, "e = f." Negative voting predicated on the thesis of the differential influence of negative evaluations predicts a different outcome. Disapprovers should vote against the President's party to a greater degree than approvers will vote for it, or "e < f."
From Figure 3 we can see that, to a substantial degree, disapproval of the incum- bent administration will be reflected in a
Table 7. Contribution of Negative Voting to Increased Defections Among the President's Party Identifiers
1946 1950 1954 1958 1962 1966
Percentage of total defections from President's party 75 71 50 46 74 76 Percentage of total adjusting for party size 75 57 71 67 62 64
This content downloaded from 137.110.37.11 on Fri, 16 Aug 2013 12:05:55 PMAll use subject to JSTOR Terms and Conditions
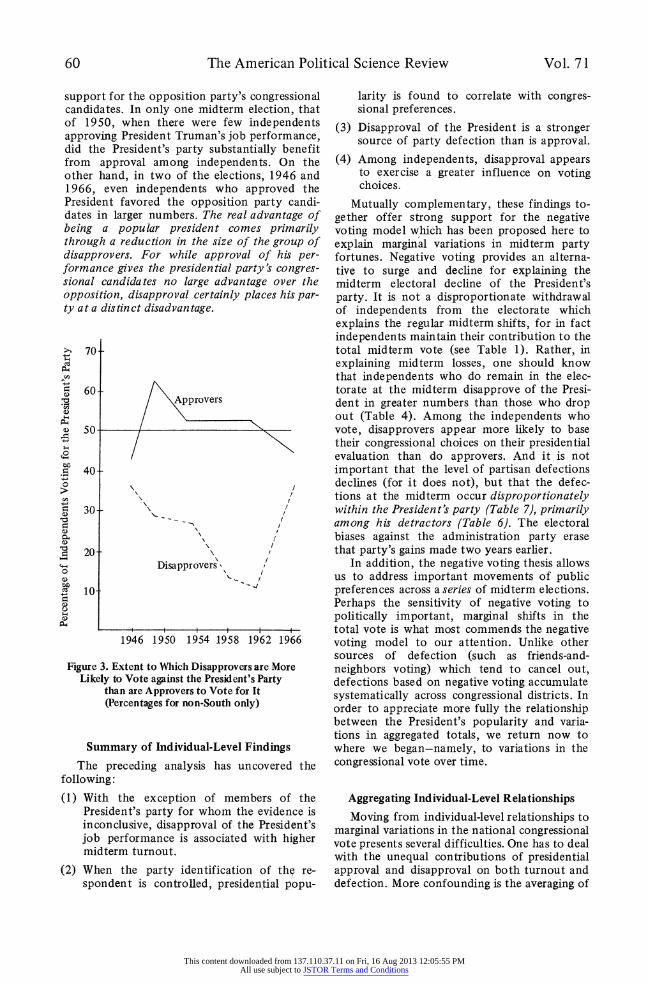
60 The American Political Science Review Vol. 71
support for the opposition party's congressional candidates. In only one midterm election, that of 1950, when there were few independents approving President Truman's job performance, did the President's party substantially benefit from approval among independents. On the other hand, in two of the elections, 1946 and 1966, even independents who approved the President favored the opposition party candi- dates in larger numbers. The real advantage of being a popular president comes primarily through a reduction in the size of the group of disapprovers. For while approval of his per- formance gives the presidential party's congres- sional candidates no large advantage over the opposition, disapproval certainly places his par- ty at a distinct disadvantage.
, 70-
a 60 , H Approvers
50-
.0
. 40-
0
196 90305 95 16 16
3 20- ' 'I
<v ~~~Disapprovers
/ 10- -
a)
1946 1950 1954 1958 1962 1966
Figure 3. Extent to Which Disapprovers are More Likely to Vote against the President's Party
than are Approvers to Vote for It (Percentages for non-South only)
Summary of Individual-Level Findings
The preceding analysis has uncovered the following:
(1) With the exception of members of the President's party for whom the evidence is inconclusive, disapproval of the President's job performance is associated with higher midterm turnout.
(2) When the party identification of thy re- spondent is controlled, presidential popu-
larity is found to correlate with congres- sional preferences.
(3) Disapproval of the President is a stronger source of party defection than is approval.
(4) Among independents, disapproval appears to exercise a greater influence on voting choices.
Mutually complementary, these findings to- gether offer strong support for the negative voting model which has been proposed here to explain marginal variations in midterm party fortunes. Negative voting provides an alterna- tive to surge and decline for explaining the midterm electoral decline of the President's party. It is not a disproportionate withdrawal of independents from the electorate which explains the regular midterm shifts, for in fact independents maintain their contribution to the total midterm vote (see Table 1). Rather, in explaining midterm losses, one should know that independents who do remain in the elec- torate at the midterm disapprove of the Presi- dent in greater numbers than those who drop out (Table 4). Among the independents who vote, disapprovers appear more likely to base their congressional choices on their presidential evaluation than do approvers. And it is not important that the level of partisan defections declines (for it does not), but that the defec- tions at the midterm occur disproportionately within the President's party (Table 7), primarily among his detractors (Table 6). The electoral biases against the administration party erase that party's gains made two years earlier.
In addition, the negative voting thesis allows us to address important movements of public preferences across a series of midterm elections. Perhaps the sensitivity of negative voting to politically important, marginal shifts in the total vote is what most commends the negative voting model to our attention. Unlike other sources of defection (such as friends-and- neighbors voting) which tend to cancel out, defections based on negative voting accumulate systematically across congressional districts. In order to appreciate more fully the relationship between the President's popularity and varia- tions in aggregated totals, we return now to where we began-namely, to variations in the congressional vote over time.
Aggregating Individual-Level Relationships
Moving from individual-level relationships to marginal variations in the national congressional vote presents several difficulties. One has to deal with the unequal contributions of presidential approval and disapproval on both turnout and defection. More confounding is the averaging of
This content downloaded from 137.110.37.11 on Fri, 16 Aug 2013 12:05:55 PMAll use subject to JSTOR Terms and Conditions
1977 Presidential Popularity and Negative Voting 61
rates of turnout and defection, which vary in strength from year to year. Add to this the assumption that presidents become more or less popular among all partisan groups at roughly the same rate.41 Finally, include in the esti- mate the uneven distribution of party loyalties in the electorate, which because of the greater influence of negative evaluations means that the larger the President's party the greater the electoral costs of becoming less popular. Given these problems, any estimation of the aggregate effects of popularity must be taken as tentative. With these caveats in mind the calculations were made, however, and they indicate that for every nine-point change in the percentage ap- proving of the President, his party's congres- sional vote will change 1.4 percentage points.42
Of course, an easier way of reaching the same results is to work directly from aggregate percentages such as those displayed in Figures 1 and 2. Edward Tufte has performed a regression analysis of these data and concluded that "a change in presidential popularity of 10 percent- age points in the Gallup Poll is associated with a national change of 1.3 percentage points in the national midterm vote for congressional candi- dates of the President's party."43 It is grati- fying to find that by using negative voting, estimates based on survey research are indepen- dently confirmed by the actual congressional vote.
Richard Nixon and the 1974 Congressional Elections
Earlier it was suggested that President Nixon's public standing at the time of his resignation may have produced the Republican disaster in the 1974 congressional elections. Although the extraordinary nature of events made the election less suitable for testing the negative voting thesis, we can, nonetheless, trace the erosion of public support for Republi- can candidates into late summer.
The most visible indications of Republican trouble were the consecutive Democratic vic- tories in congressional by-elections for tradi- tionally safe Republican seats. But politicians who must augur the political future far in advance had been aware of Republican vulnera- bility because of Watergate since the beginning of the year. In mid-January when the Republi-
4IJohn E. Mueller, War, Presidents and Public Opinion (New York: John Wiley and Sons, 1973), chapter 10.
42During Republican administrations this figure is slightly lower at 1.3 percentage points.
43Edward Tufte, "Determinants of the Outcome of Midterm Congressional Elections," American Politi- cal Science Review, 69 (September, 1975), 812-826.
can governors convened in Memphis, it was no coincidence that the featured speaker was George Gallup. By early April, twenty-two House and Senate Republicans had already announced their retirement. Throughout the Spring, Senator Goldwater had been advising his colleagues that any Republican incumbent who had received less than sixty per cent of the vote in the previous election was in jeopardy in November.44 Were Republican forebodings well-founded? The negative voting thesis would suggest that they were.
In Figure 4, responses to the presidential job performance and congressional preference items are plotted for all of the available Gallup polls during President Nixon's tenure. Even the most casual perusal of the trends reveals a close relationship between these variables. Statis- tically, President Nixon's job performance rat- ing explains more than three-quarters of the variance in the percentage who prefer a Repub- lican victory in their districts' next con- gressional election. In Figure 4 the x's which shadow the congressional preferences are the estimates of per cent Republican "predicted" from the President's popularity.45 They offer impressive visual evidence of the explanatory power of presidential popularity at the aggre- gate level. Clearly many Republicans' ambiva- lence about being too closely associated with their president was well founded. President Nixon was pulling the Republican party down with him.46
Discussion: Negative Voting and Other Electoral Settings
At first glance, midterm congressional elec- tions would appear to be unlikely forums for negative voting. The central figure-the Presi-
44Christopher Lydon, "The Awful Arithmetic," New York Times, April 21, 1974; R. W. Apple, Jr., "Election Problem of G.O.P. Essayed," New York Times, February 9, 1974.
45Regression analysis further reveals that a ten-per- centage point decline in President Nixon's popularity reduced preference for his party's candidates by 2.67 percentage points. Because the percentages in Figure 4 refer to the preferences for the entire public-with nonvoters included-they may not in fact reflect the potential vote. Probably inclusion of nonvoters who disproportionately favor the Democratic party sig- nificantly underestimates Republican strength, despite the fact the negative evaluations are more stimulating. None of the estimates appear to be contaminated by serial correlation according to the Durbin-Watson test.
46To see if the Watergate affair has had any special influence on Republican preferences other than through Nixon's popularity, the analysis was repeated with the data since the election of 1972 excluded. The projection of the slope for the pre-Watergate data estimates closely the proportion favoring a Republican victory given the reduced support for President Nixon.
This content downloaded from 137.110.37.11 on Fri, 16 Aug 2013 12:05:55 PMAll use subject to JSTOR Terms and Conditions
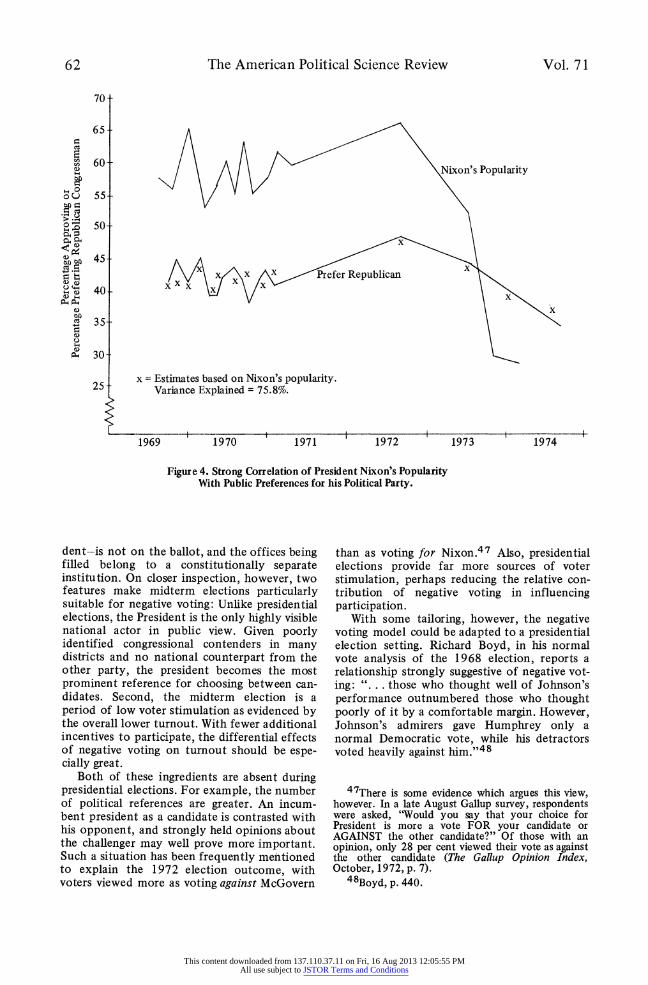
62 The American Political Science Review Vol. 71
70
65
60ixon'sPopularity
eQ 55
, 50 \
45a 4 x X X Pefer Republican
h 40|
35--
30- v 30
x = Estimates based on Nixon's popularity. 25 Variance Explained = 75.8%.
1969 1970 1971 1972 1973 1974
Figure 4. Strong Correlation of President Nixon's Popularity With Public Preferences for his Political Party.
dent-is not on the ballot, and the offices being filled belong to a constitutionally separate institution. On closer inspection, however, two features make midterm elections particularly suitable for negative voting: Unlike presidential elections, the President is the only highly visible national actor in public view. Given poorly identified congressional contenders in many districts and no national counterpart from the other party, the president becomes the most prominent reference for choosing between can- didates. Second, the midterm election is a period of low voter stimulation as evidenced by the overall lower turnout. With fewer additional incentives to participate, the differential effects of negative voting on turnout should be espe- cially great.
Both of these ingredients are absent during presidential elections. For example, the number of political references are greater. An incum- bent president as a candidate is contrasted with his opponent, and strongly held opinions about the challenger may well prove more important. Such a situation has been frequently mentioned to explain the 1972 election outcome, with voters viewed more as voting against McGovern
than as voting for Nixon.47 Also, presidential elections provide far more sources of voter stimulation, perhaps reducing the relative con- tribution of negative voting in influencing participation.
With some tailoring, however, the negative voting model could be adapted to a presidential election setting. Richard Boyd, in his normal vote analysis of the 1968 election, reports a relationship strongly suggestive of negative vot- ing: ". . . those who thought well of Johnson's performance outnumbered those who thought poorly of it by a comfortable margin. However, Johnson's admirers gave Humphrey only a normal Democratic vote, while his detractors voted heavily against him."48
47There is some evidence which argues this view, however. In a late August Gallup survey, respondents were asked, "Would you say that your choice for President is more a vote FOR your candidate or AGAINST the other candidate?" Of those with an opinion, only 28 per cent viewed their vote as against the other candidate (The Gallup Opinion Index, October, 1972, p. 7).
48Boyd, p. 440.
This content downloaded from 137.110.37.11 on Fri, 16 Aug 2013 12:05:55 PMAll use subject to JSTOR Terms and Conditions
1977 Presidential Popularity and Negative Voting 63
Elections in parliamentary systems pose some interesting issues for the negative voting thesis. Unlike midterm congressional elections, parliamentary elections are attended by nation- al candidates from each party barnstorming the country with evaluations of the "chief execu- tive" (i.e., prime minister, chancellor, premier, etc.) rarely the only available cues. And in countries which have mandatory voting, the differential motivational impact of negative evaluations on turnout will be eliminated. Other features of parliamentary systems, how- ever, could conceivably lead to higher levels of negative voting. The usual constitutional attach- ment and partisan congruence of the chief executive with the legislature may promote a close association between evaluations of the chief executive and voting for his party's legislative candidates.49 Also, to the degree that legislative representatives are less well known to their constituency, there will be fewer "local" references competing with evalua- tions of the chief executive.50 By investigating the importance of approval and disapproval of the administration on voting choices for a variety of political settings, we should arrive at a better appreciation of the effects of structural features of political systems on short-term political change.
Appendix. Examination of Alternative Explanation of Turnout
There is some reason to suspect that general political involvement may produce both higher levels of disapproval of the President and greater voting turnout. Fred Greenstein has described the President as a "cognitive aid" for the less sophisticated public.51 One may specu- late that the President should receive a more positive evaluation from those citizens who are dependent on him for understanding and evalu- ating the political environment. On a similar theme Kernell, Sperlich, and Wildavsky have found that adherence to norms that the Presi- dent should be supported comes disproportion-
49There is some evidence of a close association between voting preferences and evaluations of the chief executive. For Great Britain, see C. A. E. Goodhart and R. J. Bhansali, "Political Economy," in Political Studies, 18 (March, 1970), 43-106. For France, which is more presidential than parliamentary, see Jean Charlot, Les Franqais et De Gaulle (Paris: Plon, 1971), pp. 215-238, 245.
50Susan E. Howell compares legislator visibility for five systems in "System Effects on Legislator Visibili- ty in Five Democratic Countries" (paper presented at the 1974 APSA meetings).
5"Fred I. Greenstein, "Popular Images of the President," in The Presidency, ed. Aaron Wildavsky (Boston: Little, Brown, and Co., 1969), pp. 287-295.
ately from the less politically aware and less participant segments of the population.52 Greater levels of education, psychological flexi- bility, and political sophistication are all associ- ated with a tendency to disavow blanket support for the President. If we translate low support for norms into actual support for the incumbent President, we may find persons who are more likely to vote in low-stimulus elections are also as a group less generous with the President, whoever he might be.
In order to test this argument we first need to determine whether high levels of political sophistication and involvement are in fact related to a more critical posture toward the President. In examining this question, we must avoid a conceptual snag. If, as the negative voting model hypothesizes, disapproval acti- vates electoral participation it should con- comitantly foster political interest in the cam- paign and election outcome. Implicit in nega- tive voting then is the claim that political interest-that is, interest about the upcoming election-may directly reflect disaffection with the incumbent administration. Short-run inter- est measured by such variables as campaign participation, perceived importance of elec- tions, attention to the campaigns, and the desire to vote should, according to both the negative voting thesis and the alternative ex- planation, be associated with presidential ap- proval. Most measures of political interest and involvement employed in election-year surveys focus on these short-run qualities and are therefore for our purposes less helpful in comparing the competing explanations.
What is needed to test for spuriousness are measures soliciting information about more general and durable forms of political in- volvement and sophistication. Variables repre- senting a continuing interest in politics and reflecting in large part the cognitive and expres- sive skills of the individual should be most relevant to a "critical" evaluation of a presi- dent's job performance. Operational measures of such variables are not nearly so abundant in public opinion surveys as those tapping transi- tory campaign interest. In fact, the conceptual variable which I shall call general political involvement is rarely distinguished from and generally combined with campaign interest to measure a more encompassing and poorly speci- fied quality of political interest. Given this deficiency it is difficult to determine conclu- sively whether general political involvement leads to higher rates of disapproval. On those
52Samuel Kernell, Peter W. Sperlich, and Aaron Wildavsky, "Public Support for Presidents" in The Presidency, 2nd ed. (Boston: Little, Brown and Co., 1975), pp. 148-181.
This content downloaded from 137.110.37.11 on Fri, 16 Aug 2013 12:05:55 PMAll use subject to JSTOR Terms and Conditions
64 The American Political Science Review Vol. 71
occasions where the Gallup poll administers an item which may be interpreted as tapping general involvement, the item is usually asked just prior to the election in order to filter out potential nonvoters. Given this timing, such items could easily become contaminated by transient enthusiasm for the upcoming election; the SRC surveys have a similar "problem" of timing.
Given these limitations of the data, perhaps one of the more revealing measures for general political involvement is the respondent's educa- tion. Repeatedly education has been shown to be closely associated with such variables as political sophistication, a sense of political efficacy, and various forms of political partici- pation, and is commonly viewed as one of their. primary antecedents. According to the alterna- tive explanation, education should correlate inversely with presidential approval; that is, more highly educated respondents should be less likely to approve the incumbent's job performance. To test this I ran correlations between presidential popularity and educa- tional achievement for each partisan group for fifty-eight different Gallup surveys spanning a twenty-year period. Of the 174 different cor- relation coefficients (Pearson r), none reached even .25, either positively or negatively. With the exception of the Truman presidency, where small but persistent inverse correlations (near -.10) were found, correlations were weak and just as likely to be positive as negative. Given this substantial evidence, there can be little doubt that increased education fails to produce systematic negative assessments of presidents. Citizens who on the whole should be more knowledgeable and attentive to day-to-day poli- tical occurrences are apparently no more likely to disapprove than are those citizens who are unsophisticated and disinterested in politics.53
Occasionally questions soliciting information about general and long-standing political involvement were asked in the Gallup survey. Note in Table A-l that on most occasions the items were asked during the middle of an
53Collapsing categories of education and checking for curvilinearity failed to uncover any systematic relationships hidden by the statistics.
election campaign. Despite their manifest con- tent of general involvement, it remains uncer- tain whether such items actually elicit basic, enduring dispositions or instead reflect current political interest stimulated by disapproval as well as the election campaigns. For the most part these questions yield only slight inverse relationships with presidential popularity, cer- tainly not of a magnitude to suggest that the relationship between presidential approval and voting turnout displayed in Table 3 could be spurious.
One last set of data will be examined to test the alternative model. The SRC presidential election surveys have over the years been noted for their breadth of coverage of political beliefs and attitudes. These surveys represent the best source available for evaluating various forms of political interest and sophistication. Un- fortunately, only in 1972 was Gallup's presi- dential popularity item administered to SRC's nationwide sample04 Thus, in evaluating the relationship between presidential popularity and different types of political interest, one must remember that the setting is a presi- dential-not a midterm-campaign occurring six years after the last midterm election analyzed in this paper. To the degree that the percentage point differences shown in Table A-2 support any thesis, they buttress the negative voting model. Presidential popularity is inversely re- lated to interest and participation in the current campaigns just as negative voting suggests, but as we move to the more general statements of political involvement, these inverse relation- ships disappear which is the opposite of what one would expect if the alternative explanation were accurate. For each of the items eliciting general political in terest, the President's approv- ers-not his disapprovers-were the more politi- cally involved.55
54I wish to thank Professor Richard Brody for allowing analysis of restricted data.
55Controlling for party-Strong Democrat, Weak Democrat, Independent, Republican (the strong and weak categories had to be combined because of a small N)-the relationships reported in Table A-2 remain essentially unchanged.
This content downloaded from 137.110.37.11 on Fri, 16 Aug 2013 12:05:55 PMAll use subject to JSTOR Terms and Conditions
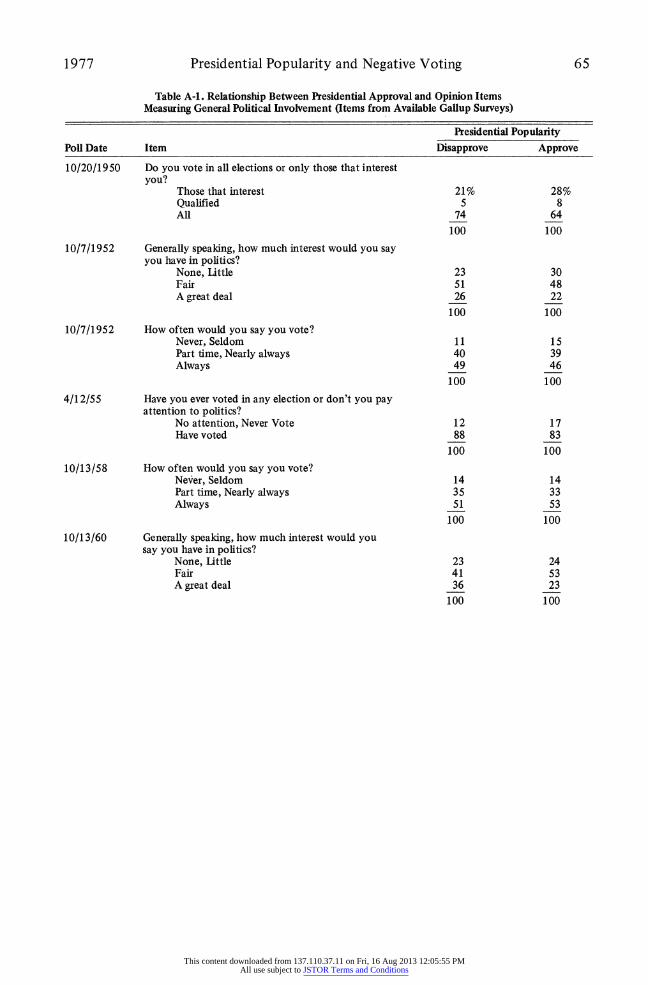
1977 Presidential Popularity and Negative Voting 65
Table A-1. Relationship Between Presidential Approval and Opinion Items Measuring General Political Involvement (Items from Available Gallup Surveys)
Presidential Popularity
Poll Date Item Disapprove Approve
10/20/1950 Do you vote in all elections or only those that interest you?
Those that interest 21% 28% Qualified 5 8 All 74 64
100 100
10/7/1952 Generally speaking, how much interest would you say you have in politics?
None, Little 23 30 Fair 51 48 A great deal 26 22
100 100
10/7/1952 How often would you say you vote? Never, Seldom 11 15 Part time, Nearly always 40 39 Always 49 46
100 100
4/12/55 Have you ever voted in any election or don't you pay attention to politics?
No attention, Never Vote 12 17 Have voted 88 83
100 100
10/13/58 How often would you say you vote? Never, Seldom 14 14 Part time, Nearly always 35 33 Always 51 53
100 100
10/13/60 Generally speaking, how much interest would you say you have in politics?
None, Little 23 24 Fair 41 53 A great deal 36 23
100 100
This content downloaded from 137.110.37.11 on Fri, 16 Aug 2013 12:05:55 PMAll use subject to JSTOR Terms and Conditions
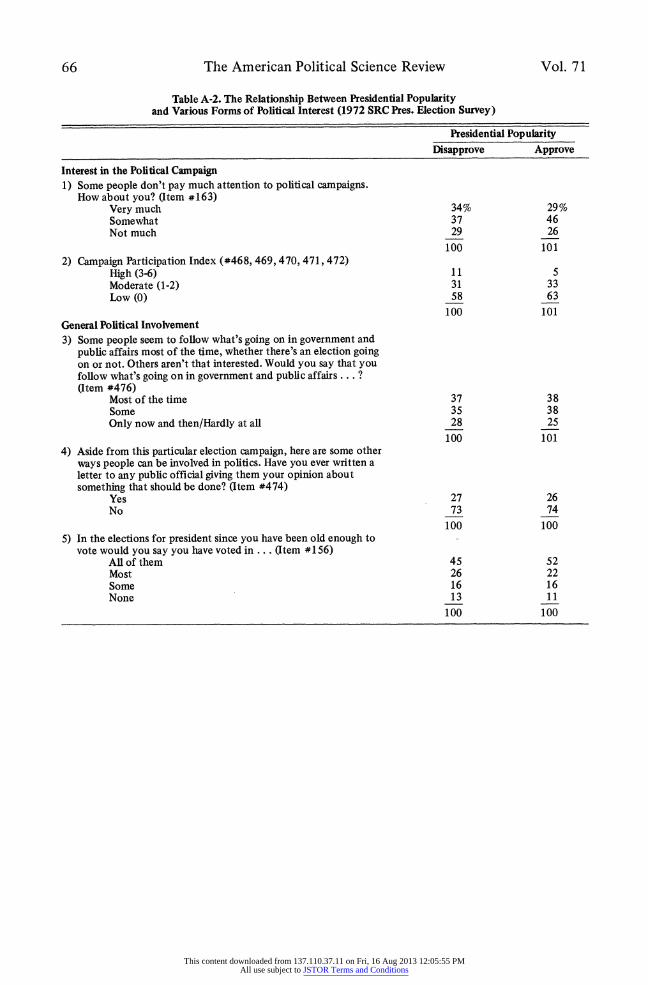
66 The American Political Science Review Vol. 71
Table A-2. The Relationship Between Presidential Popularity and Various Forms of Political Interest (1972 SRC Pres. Election Survey)
Presidential Popularity
Disapprove Approve
Interest in the Political Campaign 1) Some people don't pay much attention to political campaigns.
How about you? (Item # 163) Very much 34% 29% Somewhat 37 46 Not much 29 26
100 101 2) Campaign Participation Index (#468, 469, 470, 471, 472)
High (3-6) 11 5 Moderate (1-2) 31 33 Low (0) 58 63
100 101 General Political Involvement 3) Some people seem to follow what's going on in government and
public affairs most of the time, whether there's an election going on or not. Others aren't that interested. Would you say that you follow what's going on in government and public affairs ... ? (Item #476)
Most of the time 37 38 Some 35 38 Only now and then/Hardly at all 28 25
100 101 4) Aside from this particular election campaign, here are some other
ways people can be involved in politics. Have you ever written a letter to any public official giving them your opinion about something that should be done? (Item #474)
Yes 27 26 No 73 74
100 100 5) In the elections for president since you have been old enough to
vote would you say you have voted in . . . (Item #156) All of them 45 52 Most 26 22 Some 16 16 None 1 3 1 1
100 100
This content downloaded from 137.110.37.11 on Fri, 16 Aug 2013 12:05:55 PMAll use subject to JSTOR Terms and Conditions