Embed Size (px)
Citation preview
PhUSE 2014
1
Paper CS02
Presenting SAS Data Sets on the Web Using SAS ODS, JavaScript, and jQuery
Volker Harm, Bayer Pharma AG, Berlin, Germany
ABSTRACT
Inspired by the SAS ODS tableeditor tagset we look further how JavaScript and the jQuery library can be used to dynamically present SAS data sets on the web. Emphasis will be laid in sorting, filtering and editing data.
INSPIRATION
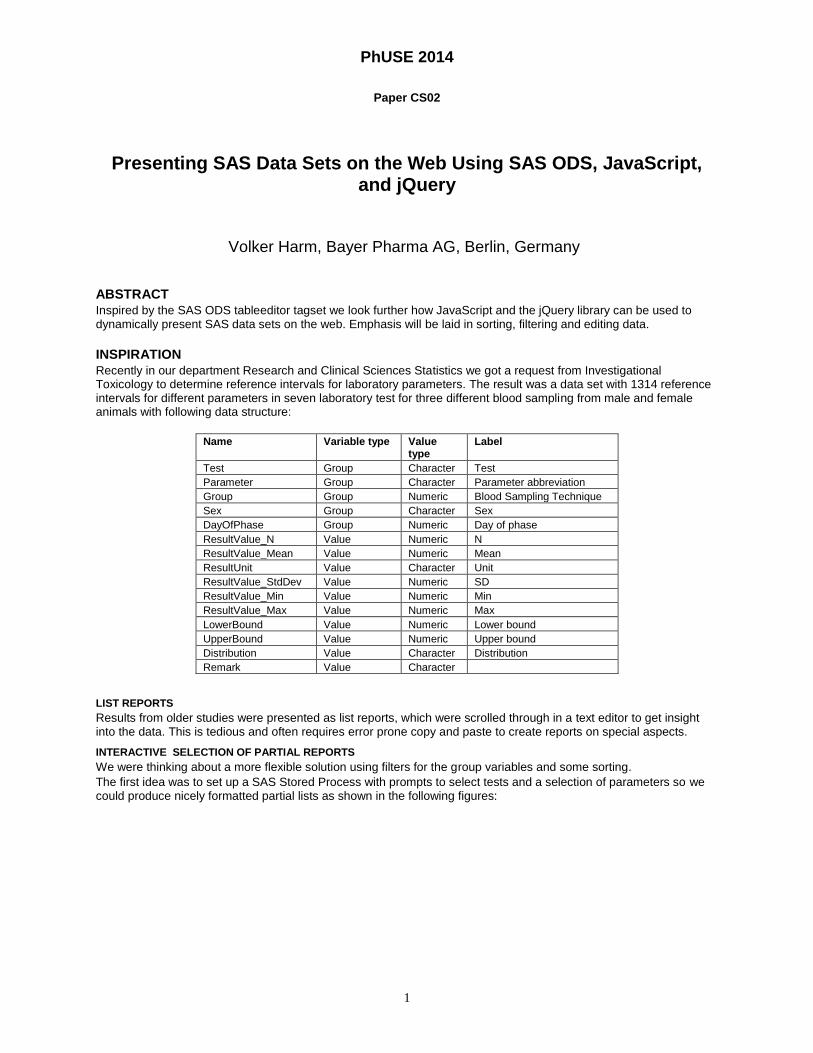
Recently in our department Research and Clinical Sciences Statistics we got a request from Investigational Toxicology to determine reference intervals for laboratory parameters. The result was a data set with 1314 reference intervals for different parameters in seven laboratory test for three different blood sampling from male and female animals with following data structure:
Name Variable type Value type
Label
Test Group Character Test
Parameter Group Character Parameter abbreviation
Group Group Numeric Blood Sampling Technique
Sex Group Character Sex
DayOfPhase Group Numeric Day of phase
ResultValue_N Value Numeric N
ResultValue_Mean Value Numeric Mean
ResultUnit Value Character Unit
ResultValue_StdDev Value Numeric SD
ResultValue_Min Value Numeric Min
ResultValue_Max Value Numeric Max
LowerBound Value Numeric Lower bound
UpperBound Value Numeric Upper bound
Distribution Value Character Distribution
Remark Value Character
LIST REPORTS
Results from older studies were presented as list reports, which were scrolled through in a text editor to get insight into the data. This is tedious and often requires error prone copy and paste to create reports on special aspects.
INTERACTIVE SELECTION OF PARTIAL REPORTS
We were thinking about a more flexible solution using filters for the group variables and some sorting.
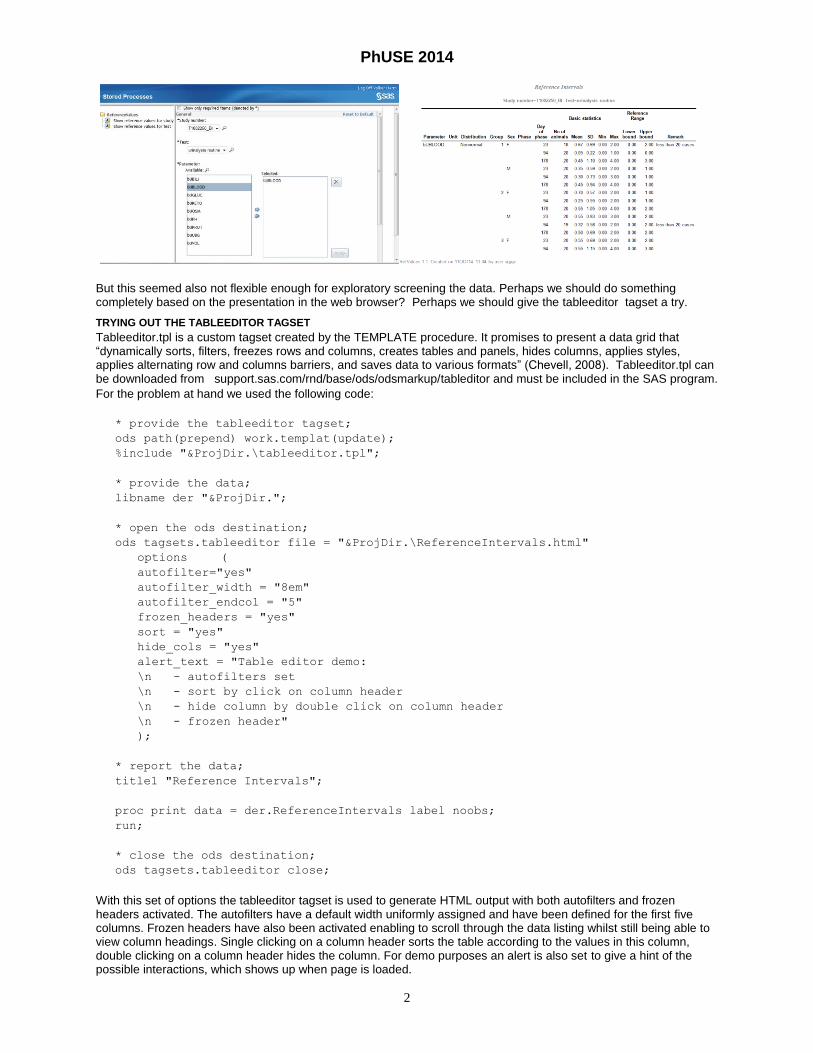
The first idea was to set up a SAS Stored Process with prompts to select tests and a selection of parameters so we could produce nicely formatted partial lists as shown in the following figures:
PhUSE 2014
2
But this seemed also not flexible enough for exploratory screening the data. Perhaps we should do something completely based on the presentation in the web browser? Perhaps we should give the tableeditor tagset a try.
TRYING OUT THE TABLEEDITOR TAGSET
Tableeditor.tpl is a custom tagset created by the TEMPLATE procedure. It promises to present a data grid that “dynamically sorts, filters, freezes rows and columns, creates tables and panels, hides columns, applies styles, applies alternating row and columns barriers, and saves data to various formats” (Chevell, 2008). Tableeditor.tpl can be downloaded from support.sas.com/rnd/base/ods/odsmarkup/tableditor and must be included in the SAS program.
For the problem at hand we used the following code:
* provide the tableeditor tagset;
ods path(prepend) work.templat(update);
%include "&ProjDir.\tableeditor.tpl";
* provide the data;
libname der "&ProjDir.";
* open the ods destination;
ods tagsets.tableeditor file = "&ProjDir.\ReferenceIntervals.html"
options (
autofilter="yes"
autofilter_width = "8em"
autofilter_endcol = "5"
frozen_headers = "yes"
sort = "yes"
hide_cols = "yes"
alert_text = "Table editor demo:
\n - autofilters set
\n - sort by click on column header
\n - hide column by double click on column header
\n - frozen header"
);
* report the data;
title1 "Reference Intervals";
proc print data = der.ReferenceIntervals label noobs;
run;
* close the ods destination;
ods tagsets.tableeditor close;
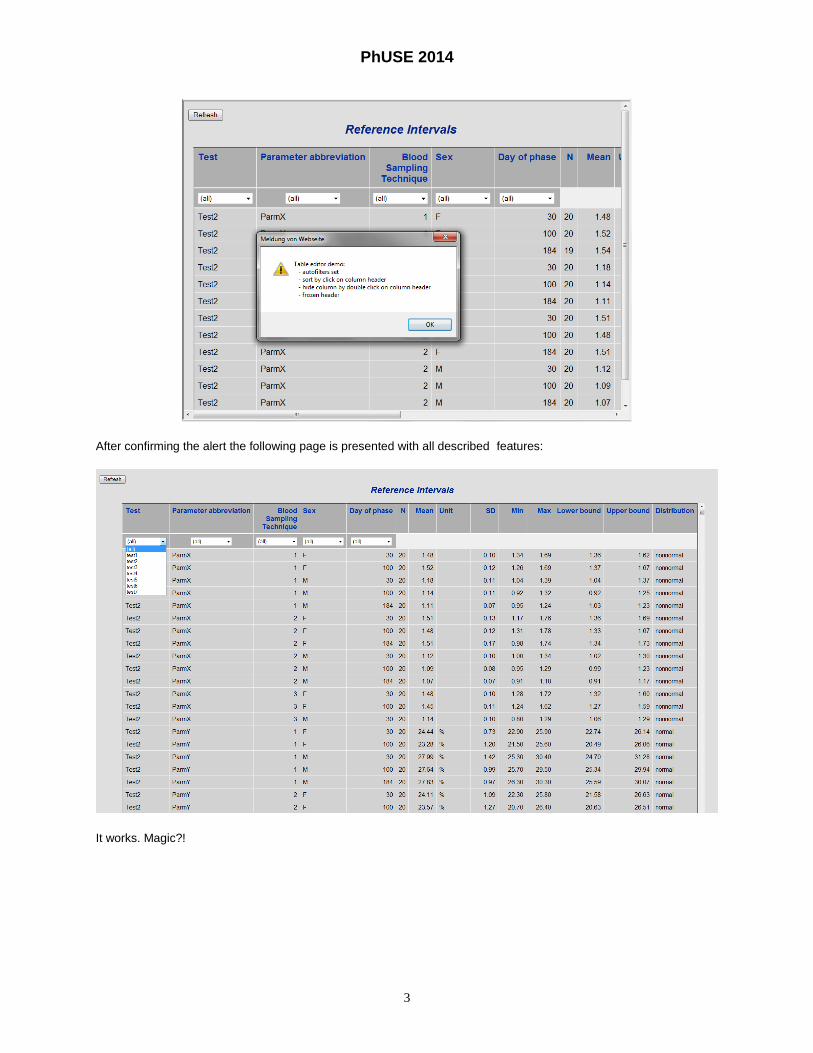
With this set of options the tableeditor tagset is used to generate HTML output with both autofilters and frozen headers activated. The autofilters have a default width uniformly assigned and have been defined for the first five columns. Frozen headers have also been activated enabling to scroll through the data listing whilst still being able to view column headings. Single clicking on a column header sorts the table according to the values in this column, double clicking on a column header hides the column. For demo purposes an alert is also set to give a hint of the possible interactions, which shows up when page is loaded.
PhUSE 2014
3
After confirming the alert the following page is presented with all described features:
It works. Magic?!
PhUSE 2014
4
HOW DOES THIS MAGIC WORK OUT?
WEB PAGE BASICS
A web page consist of three main components: structure, presentation, and behavior.
The structure is determined by a sequence of HTML elements put together in an HTML document. Most HTML elements are written with a start tag and an end tag with the content in-between. The general syntax of an HTML tag is: <name attribute = “value”> content to be modified by the tag</name>. A basic working example of a web page using HTM tags shows the typical structure:
<html>
<head>
<title>Simple Web Page</title>
</head>
<body>
<p>Sample paragraph</p>
</body>
</html>
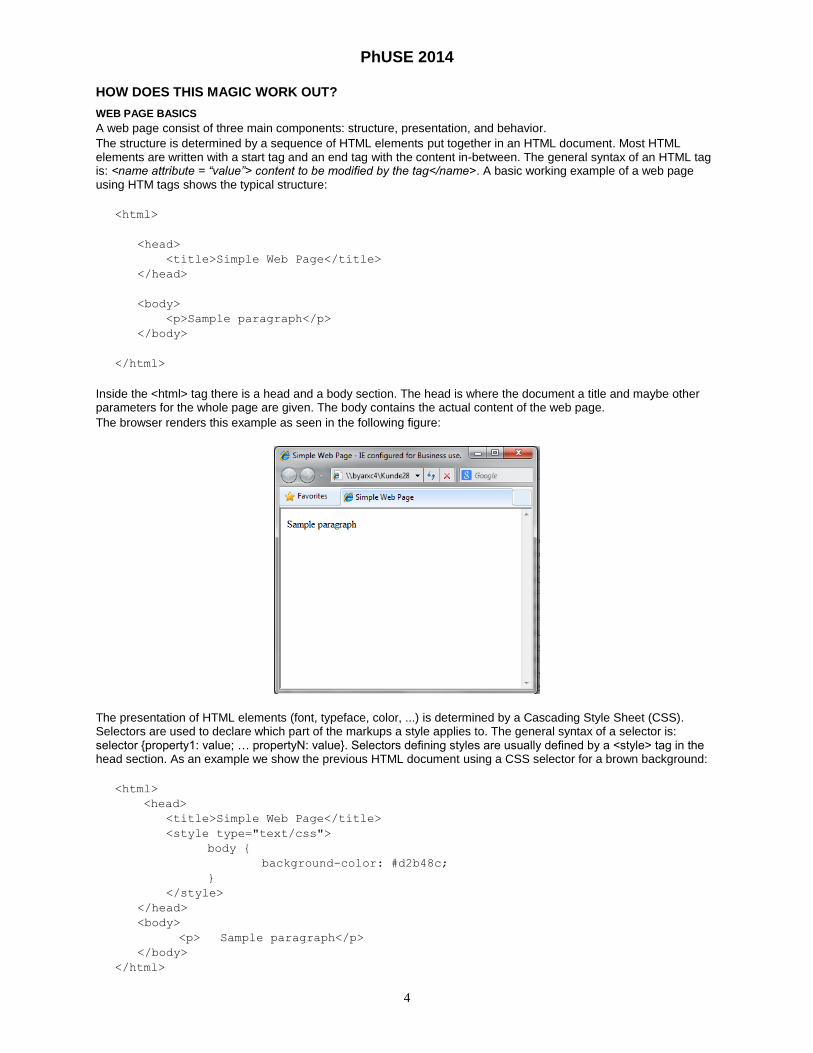
Inside the <html> tag there is a head and a body section. The head is where the document a title and maybe other parameters for the whole page are given. The body contains the actual content of the web page.
The browser renders this example as seen in the following figure:
The presentation of HTML elements (font, typeface, color, ...) is determined by a Cascading Style Sheet (CSS). Selectors are used to declare which part of the markups a style applies to. The general syntax of a selector is: selector {property1: value; … propertyN: value}. Selectors defining styles are usually defined by a <style> tag in the head section. As an example we show the previous HTML document using a CSS selector for a brown background:
<html>
<head>
<title>Simple Web Page</title>
<style type="text/css">
body {
background-color: #d2b48c;
}
</style>
</head>
<body>
<p> Sample paragraph</p>
</body>
</html>
PhUSE 2014
5
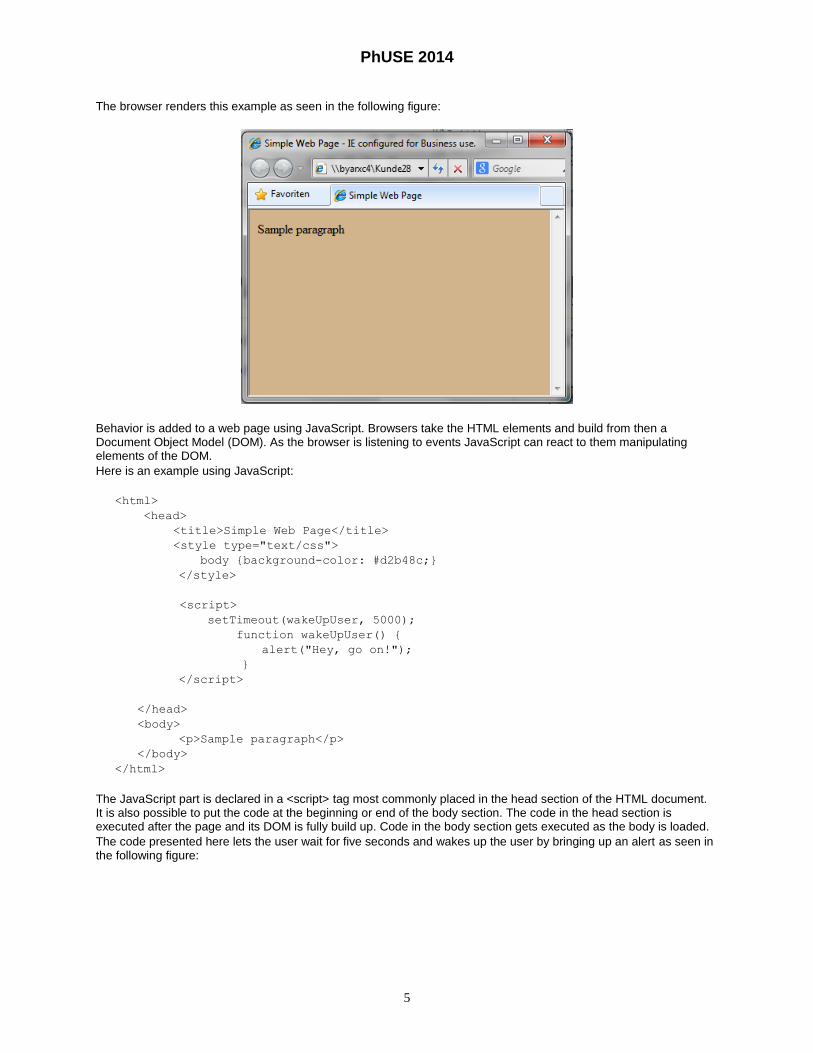
The browser renders this example as seen in the following figure:
Behavior is added to a web page using JavaScript. Browsers take the HTML elements and build from then a Document Object Model (DOM). As the browser is listening to events JavaScript can react to them manipulating elements of the DOM.
Here is an example using JavaScript:
<html>
<head>
<title>Simple Web Page</title>
<style type="text/css">
body {background-color: #d2b48c;}
</style>
<script>
setTimeout(wakeUpUser, 5000);
function wakeUpUser() {
alert("Hey, go on!");
}
</script>
</head>
<body>
<p>Sample paragraph</p>
</body>
</html>
The JavaScript part is declared in a <script> tag most commonly placed in the head section of the HTML document. It is also possible to put the code at the beginning or end of the body section. The code in the head section is executed after the page and its DOM is fully build up. Code in the body section gets executed as the body is loaded.
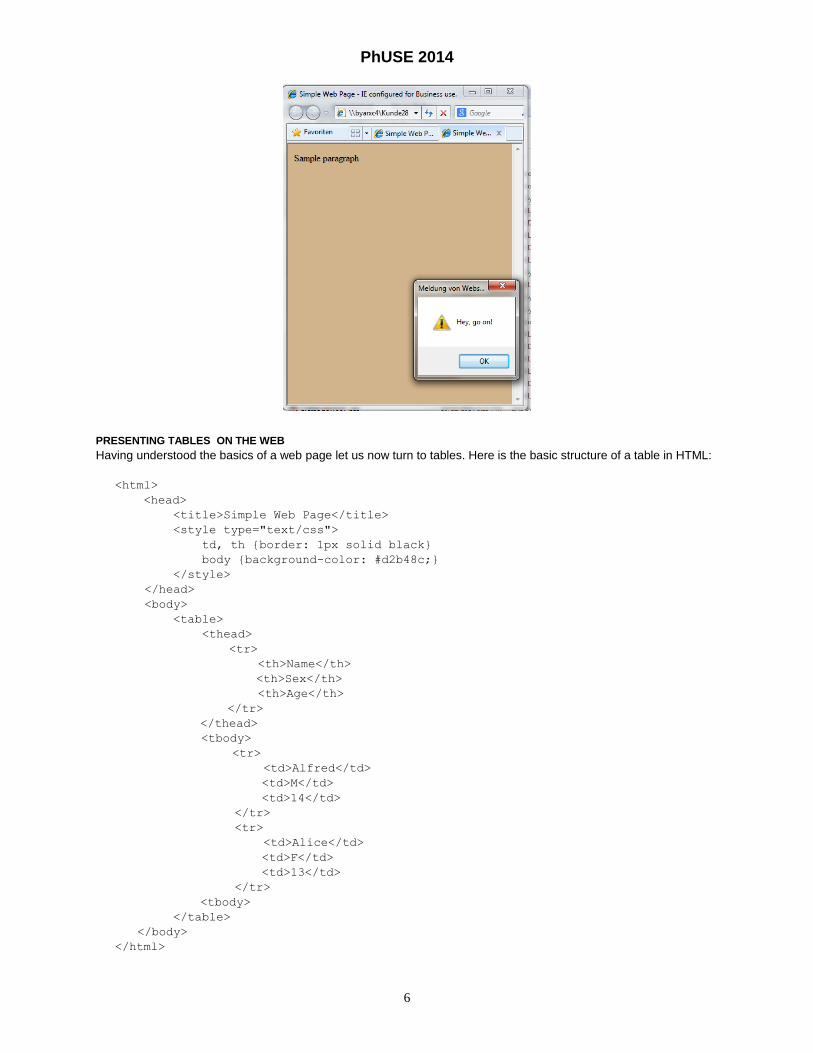
The code presented here lets the user wait for five seconds and wakes up the user by bringing up an alert as seen in the following figure:
PhUSE 2014
6
PRESENTING TABLES ON THE WEB
Having understood the basics of a web page let us now turn to tables. Here is the basic structure of a table in HTML:
<html>
<head>
<title>Simple Web Page</title>
<style type="text/css">
td, th {border: 1px solid black}
body {background-color: #d2b48c;}
</style>
</head>
<body>
<table>
<thead>
<tr>
<th>Name</th>
<th>Sex</th>
<th>Age</th>
</tr>
</thead>
<tbody>
<tr>
<td>Alfred</td>
<td>M</td>
<td>14</td>
</tr>
<tr>
<td>Alice</td>
<td>F</td>
<td>13</td>
</tr>
<tbody>
</table>
</body>
</html>
PhUSE 2014
7
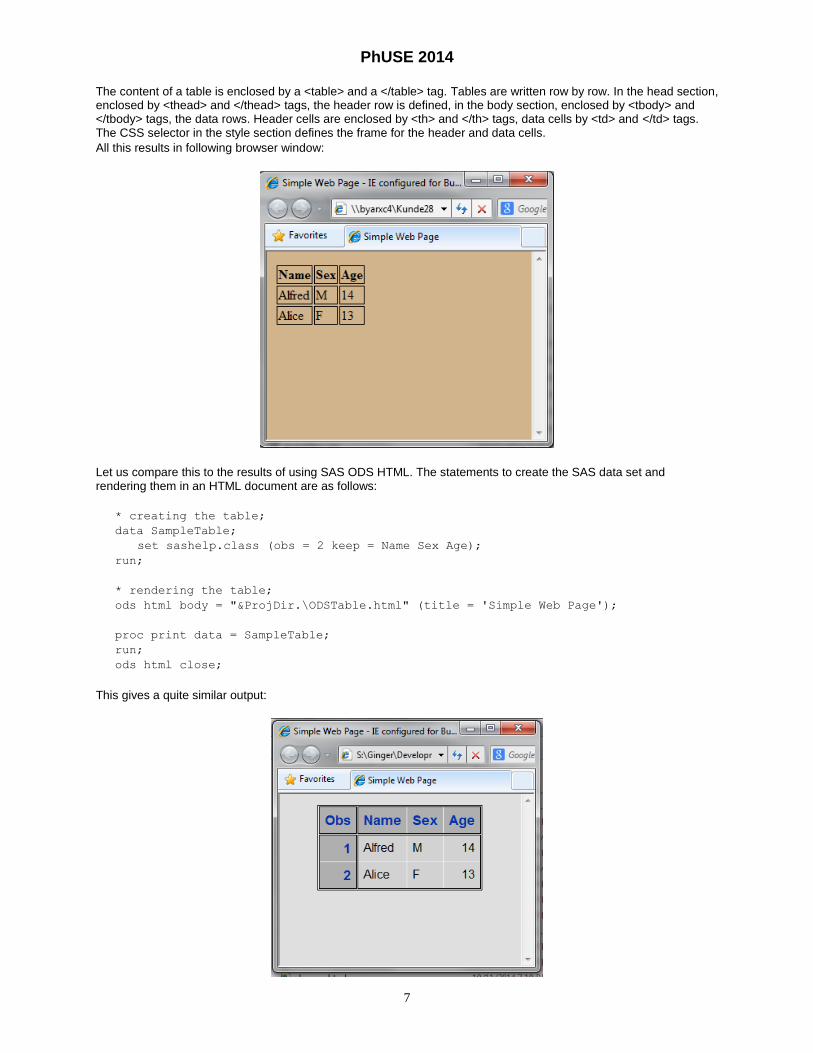
The content of a table is enclosed by a <table> and a </table> tag. Tables are written row by row. In the head section, enclosed by <thead> and </thead> tags, the header row is defined, in the body section, enclosed by <tbody> and </tbody> tags, the data rows. Header cells are enclosed by <th> and </th> tags, data cells by <td> and </td> tags. The CSS selector in the style section defines the frame for the header and data cells.
All this results in following browser window:
Let us compare this to the results of using SAS ODS HTML. The statements to create the SAS data set and rendering them in an HTML document are as follows:
* creating the table;
data SampleTable;
set sashelp.class (obs = 2 keep = Name Sex Age);
run;
* rendering the table;
ods html body = "&ProjDir.\ODSTable.html" (title = 'Simple Web Page');
proc print data = SampleTable;
run;
ods html close;
This gives a quite similar output:
PhUSE 2014
8
As style we used the SAS default style, which is the cause for the different appearance.
Here is the general structure of the HTML document that SAS ODS creates, which resembles the HTML elements discussed before:
<!DOCTYPE html PUBLIC "-//W3C//DTD HTML 4.01 Transitional//EN">
<html>
<head>
<meta name="Generator"
content="SAS Software Version 9.2, see www.sas.com">
<meta http-equiv="Content-type"
content="text/html; charset=windows-1252">
<title>SAS Output</title>
<style type="text/css">
<!--
CSS style definitions
-->
</style>
<script language="javascript" type="text/javascript">
<!--
JavaScript statements (general)
//-->
</script>
</head>
<body onload="startup()" onunload="shutdown()" class="Body">
<!--
HTML elements
//-->
<script language="javascript" type="text/javascript">
<!--
JavaScript statements (DOM)
//-->
</script>
</body>
</html>
The <!DOCTYPE> declaration in the first line is not an HTML tag; it is an instruction to the web browser about what version of HTML the page is written in. The declaration created by SAS ODS HTML works in all modern browsers.
The style definitions in this HTML document are quite lengthy. If we want to see only the part of the HTML document, which builds up the table SAS provides sub-options for the ODS HTML statement:
* getting the table definition;
ods html
body = "&ProjDir.\ODSTableDefinition.html"
(title = 'Simple Web Page'
no_top_matter
no_bottom_matter);
proc print data = SampleTable;
run;
ods html close;
Running this program shows that the table definition resembles everything that was mentioned about table before plus some structure elements:
PhUSE 2014
9
<div class="branch">
<a name="IDX"></a>
<div>
<div align="center">
<table class="Table" cellspacing="1" cellpadding="7" rules="groups"
frame="box" summary="Procedure Print: Data Set WORK.SAMPLETABLE">
<colgroup>
<col>
</colgroup>
<colgroup>
<col>
<col>
<col>
</colgroup>
<thead>
<tr>
<th class="r Header" scope="col">Obs</th>
<th class="l Header" scope="col">Name</th>
<th class="l Header" scope="col">Sex</th>
<th class="r Header" scope="col">Age</th>
</tr>
</thead>
<tbody>
<tr>
<th class="r RowHeader" scope="row">1</th>
<td class="l Data">Alfred</td>
<td class="l Data">M</td>
<td class="r Data">14</td>
</tr>
<tr>
<th class="r RowHeader" scope="row">2</th>
<td class="l Data">Alice</td>
<td class="l Data">F</td>
<td class="r Data">13</td>
</tr>
</tbody>
</table>
</div>
</div>
<br>
</div>
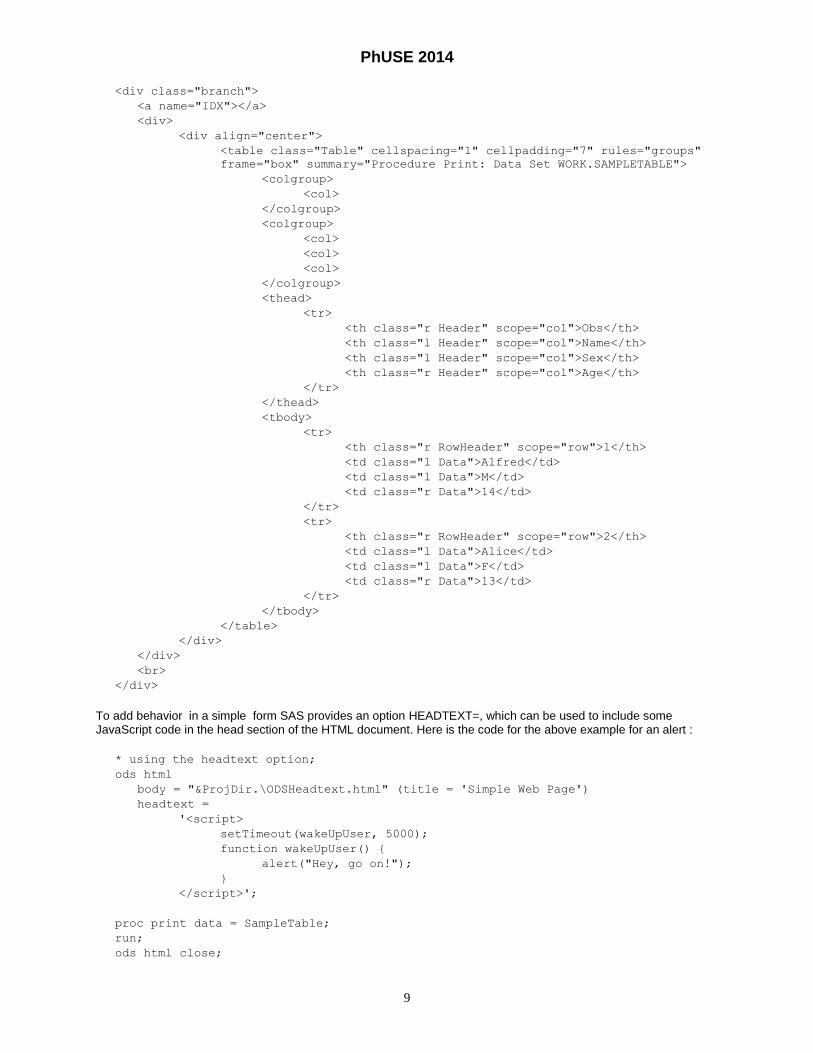
To add behavior in a simple form SAS provides an option HEADTEXT=, which can be used to include some JavaScript code in the head section of the HTML document. Here is the code for the above example for an alert :
* using the headtext option;
ods html
body = "&ProjDir.\ODSHeadtext.html" (title = 'Simple Web Page')
headtext =
'<script>
setTimeout(wakeUpUser, 5000);
function wakeUpUser() {
alert("Hey, go on!");
}
</script>';
proc print data = SampleTable;
run;
ods html close;
PhUSE 2014
10
And this is the result:
UNDERSTANDING THE MAGIC OF THE SAS ODS TABLEEDITOR TAGSET
The SAS ODS Tableeditor tagset is a custom tagset that is created by the TEMPLATE procedure. A tagset is a type of template that defines how to generate a markup language output type from SAS data. A markup language is a set of tags and format codes that are embedded in text in order to define layout and certain content. The SAS ODS Tableeditor tagset is inherited from the ODS HTML destination and enhances this by applying the above principles of HTML, CSS, and JavaScript to present SAS data sets on the web.
ADDING MORE BEHAVIOR WITH JQUERY PLUG-INS
A more incremental way than using the SAS ODS Tableeditor tagset is adding behavior to SAS ODS HTML by leveraging JavaScript libraries as jQuery and jQuery plug-ins.
STARTING WITH THE JQUERY PLUGIN TABLESORTER AND THE HEADTEXT= OPTION
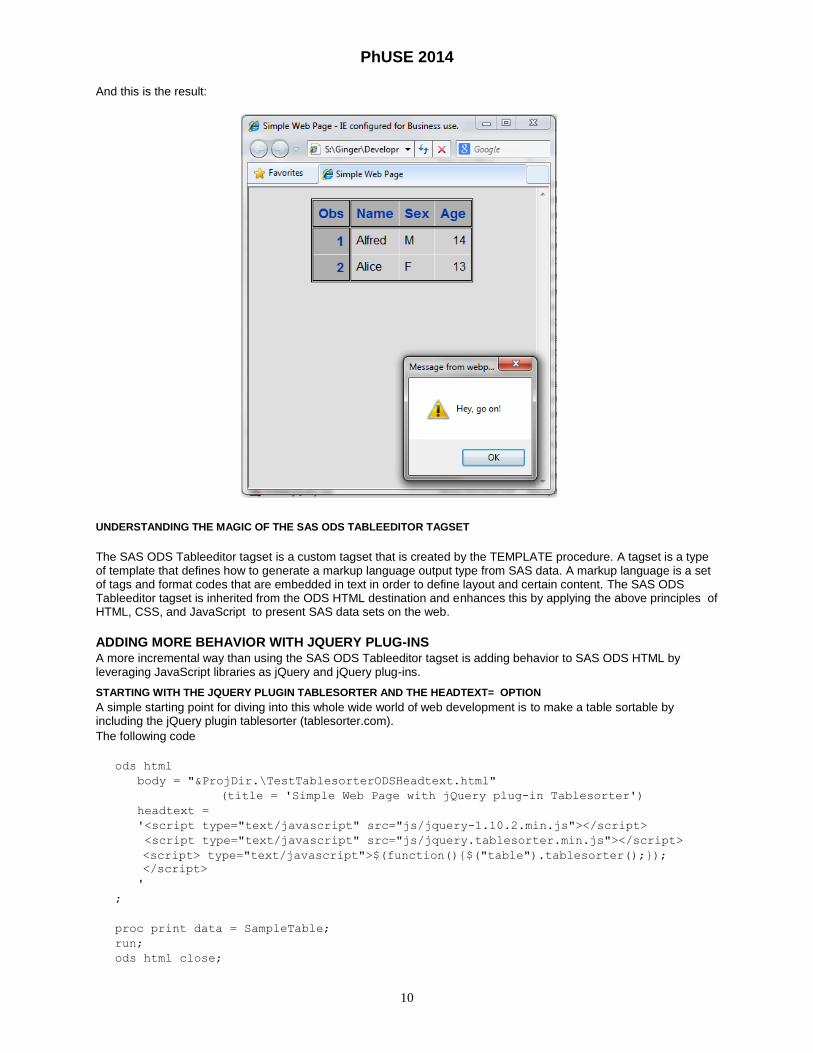
A simple starting point for diving into this whole wide world of web development is to make a table sortable by including the jQuery plugin tablesorter (tablesorter.com).
The following code
ods html
body = "&ProjDir.\TestTablesorterODSHeadtext.html"
(title = 'Simple Web Page with jQuery plug-in Tablesorter')
headtext =
'<script type="text/javascript" src="js/jquery-1.10.2.min.js"></script>
<script type="text/javascript" src="js/jquery.tablesorter.min.js"></script>
<script> type="text/javascript">$(function(){$("table").tablesorter();});
</script>
'
;
proc print data = SampleTable;
run;
ods html close;
PhUSE 2014
11
results in
Double-clicking the header of a column sorts the table. Here the “Name” column was double-clicked.
A SECOND ENTRY POINT: DATATABLES AND MODIFYING THE ODS STYLE DEFINITON
Unfortunately the values for the HEADTEXT= option are limited to 256 characters. Therefore for more complex insertions into the HTML document we have use other techniques. The most convenient is to use a modified style with changed PREHTML and POSTHTML attributes:
* modifying styles.default;
ods path (prepend) work.mystyle (update);
proc template;
define style mystyle;
parent = styles.default;
style body from body/
prehtml = "%prehtmlContent"
posthtml = "%posthtmlContent";
end;
run;
The above code snippet creates a new ODS style using two SAS macros as argument s for the PREHTML and POSTHTML option. This newly defined ODS style inserts the text the macros contain into the beginning and end of the body section of the HTML document .
The %preHTMLContent macro can be used to include CSS stylesheets and JavaScript libraries
The following example uses the jQuery, the table plug-in for jQuery Data Tables, and Data Tables extension ColVis. CSS stylesheets and JavaScript libraries can be loaded from the internet. The necessary instructions are presented in the following macro:
%macro prehtmlContent;
%* Cascading stylesheets;
<link
rel='stylesheet' type='text/css'
href='http://cdn.datatables.net/1.10.3/css/jquery.dataTables.min.css'
>
<link
rel='stylesheet' type='text/css'
href='http://cdn.datatables.net/colvis/1.1.1/css/dataTables.colVis.css'
>
%* JavaScript libraries;
<script
type='text/javascript' language='javascript'
src='http://code.jquery.com/jquery-1.11.1.min.js'></script>
PhUSE 2014
12
<script
type='text/javascript' language='javascript'
src='http://cdn.datatables.net/1.10.3/js/jquery.dataTables.min.js'>
</script>
<script
type='text/javascript' language='javascript'
src='http://cdn.datatables.net/colvis/1.1.1/js/dataTables.colVis.min.js'>
</script>
%mend;
The %postHTMLContent macro can be used to initialize jQuery objects. Here the DataTable object and the ColVis entension is initialized:
%macro posthtmlContent;
%* initializing JavaScript code;
%quote (
<script type='text/javascript' class='init'>
$(document).ready(function() {
$('.Table').DataTable( {
dom: 'C<""clear"">lfrtip'
} );
} );
</script>
)
%mend;
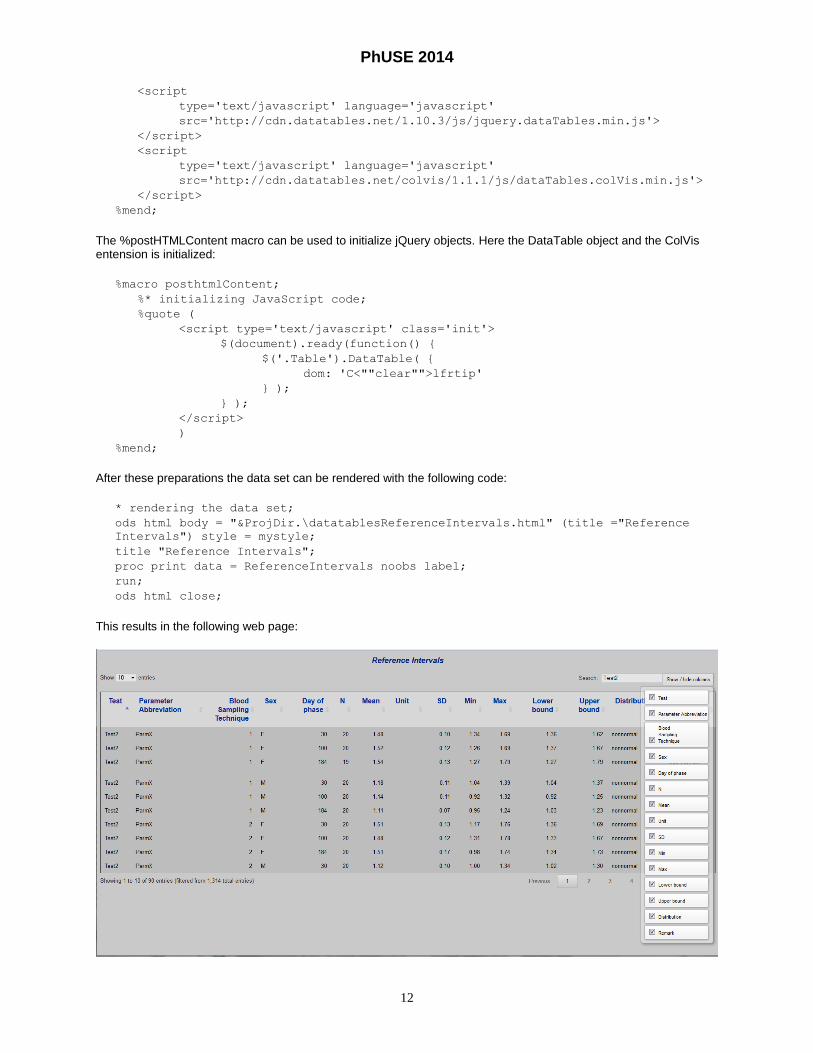
After these preparations the data set can be rendered with the following code:
* rendering the data set;
ods html body = "&ProjDir.\datatablesReferenceIntervals.html" (title ="Reference
Intervals") style = mystyle;
title "Reference Intervals";
proc print data = ReferenceIntervals noobs label;
run;
ods html close;
This results in the following web page:
PhUSE 2014
13
The boring list of reference interval has changed to an exciting web application with following features:
pagination (with length change feature)
intelligent multiple column searching and filtering
sortable columns
information about selected rows
ability to show or hide columns
Check out datables.net to see what else is possible!
CONCLUSION
In order to understand the SAS ODS tableeditor tagset we dived into the basic principles of web page design to show the use of JavaScript and the jQuery plug-ins in web pages as well as in SAS ODS HTML tables. In contrast to constructing SAS ODS tagsets, where all this knowledge is prerequisite, we showed a more incremental way of adding behavior to SAS ODS HTML tables using tools from the wide world of web design.
REFERENCES
Haworth, Lauren E., Zender, Cynthia, L., Burlew, Michele M. 2009. “Output Delivery System The Basics and Beyond”. Cary, NC: SAS Institute Inc.
Parker, Chevell. 2008. “Creating That Perfect Data Grid Using the SAS® Output Delivery System”. Cary, NC: SAS
Institute Inc. Available at support.sas.com/rnd/base/ods/odsmarkup/tableditor
Fu, Yu, Huang, Chao. 2014. Enhance the SAS® ODS HTML Output with JavaScript. SGF 2014. Available at http://support.sas.com/resources/papers/proceedings14/1673-2014.pdf
Ziem, Andrew. 2013 “Easy sortable HTML tables in SAS ODS”. Heuristic Andrew. Avaiable at http://heuristically.wordpress.com/2013/01/17/sortable-html-tables-sas-ods
.
RECOMMENDED READING
Robson, Elisabeth, Freeman Eric. 2012. “Head First HTML and CSS, 2nd Edition”. Sebastopol, CA: O´Reilly Media Inc.
Robson, Elisabeth, Freeman Eric. 2014. “Head First Java Script Programming”. Sebastopol, CA: O´Reilly Media Inc.
Benedetti, Ryan, Cranley. Ronan. 2011. “Head First jQuery”. Sebastopol, CA: O´Reilly Media Inc.
CONTACT INFORMATION
Your comments and questions are valued and encouraged. Contact the author at:
Volker Harm
Bayer Pharma AG
Müllerstraße 178
13342 Berlin
Work Phone: +49-30-468-11208
Email: [email protected]
Web: http://www.bayerhealthcare.com
Brand and product names are trademarks of their respective companies.