Embed Size (px)
Citation preview
Presenter Disclosures
(1) The following personal financial relationships with commercial interests relevant to this presentation existed during the past 12 months:
Deborah Goebert
“No relationships to disclose”
Youth Violence and Substance Use
Deborah Goebert, Dr.P.H. ([email protected])
&
Investigators & Staff, Asian/Pacific Islander Youth Violence Prevention Center & Alcohol Research Center of Hawai`i
Department of Psychiatry, University of Hawai‘i at Mānoa
May 22, 2008

Recent Headlines – May 18, 2008
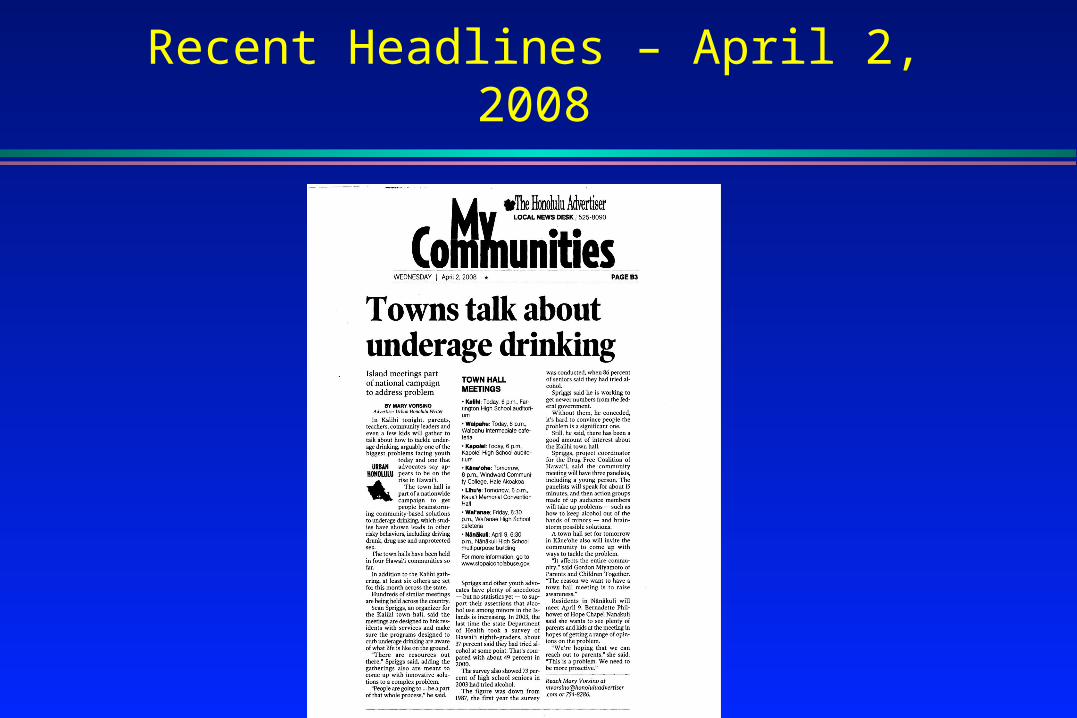
Recent Headlines – April 2, 2008
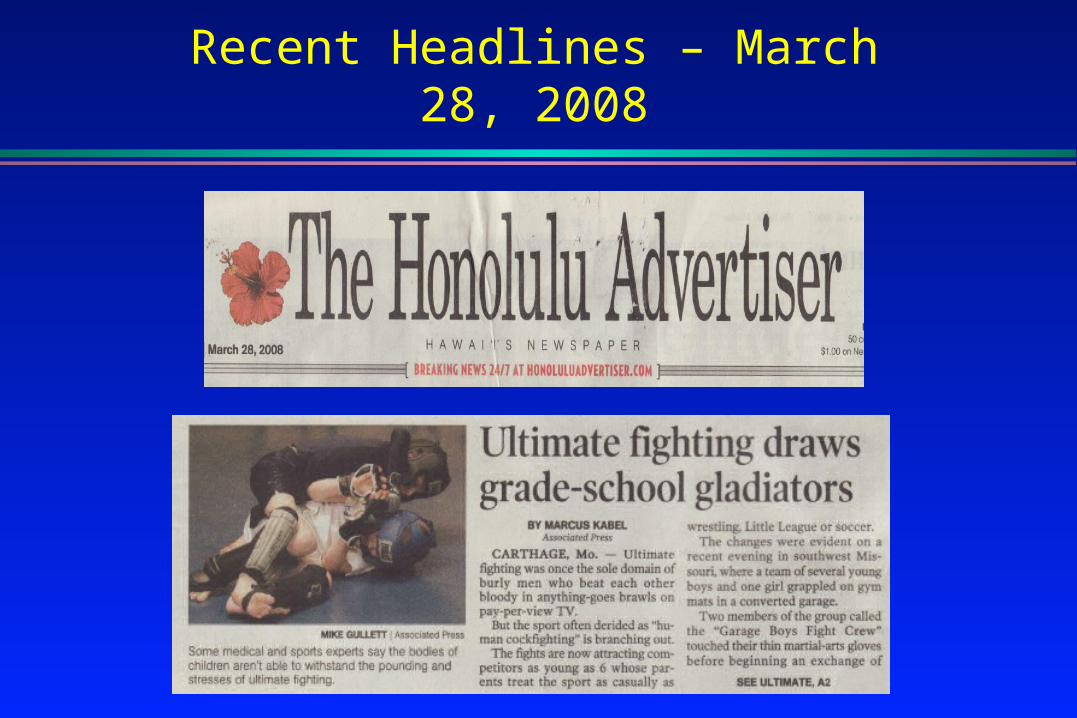
Recent Headlines – March 28, 2008

Recent Headlines – March 18, 2008
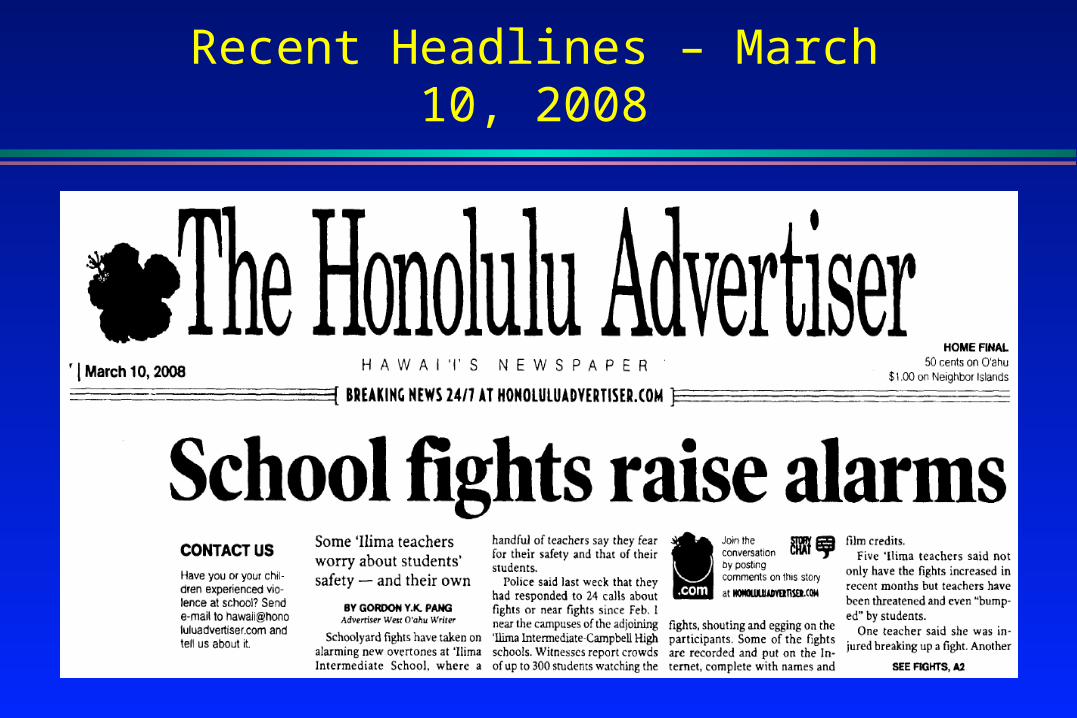
Recent Headlines – March 10, 2008
Recent Headlines – February 24, 2008

Recent Headlines – January 15, 2008

API Youth Substance Use and Violence
• >12 million API population in U.S. (Census 2000)• Minimal knowledge of API youth violence and substance use
regarding prevalence & risk-protective factors• Available knowledge typically aggregates different Asian groups
& Pacific Islander groups together• Misleading because Asians tend to have lower rates than
Pacific Islanders• Misleading because even within the Asian groups, there are
differences (e.g., Cambodian youths > Chinese youths)• Does not address the issue of those of mixed ancestry
API Youth Substance Use and Violence
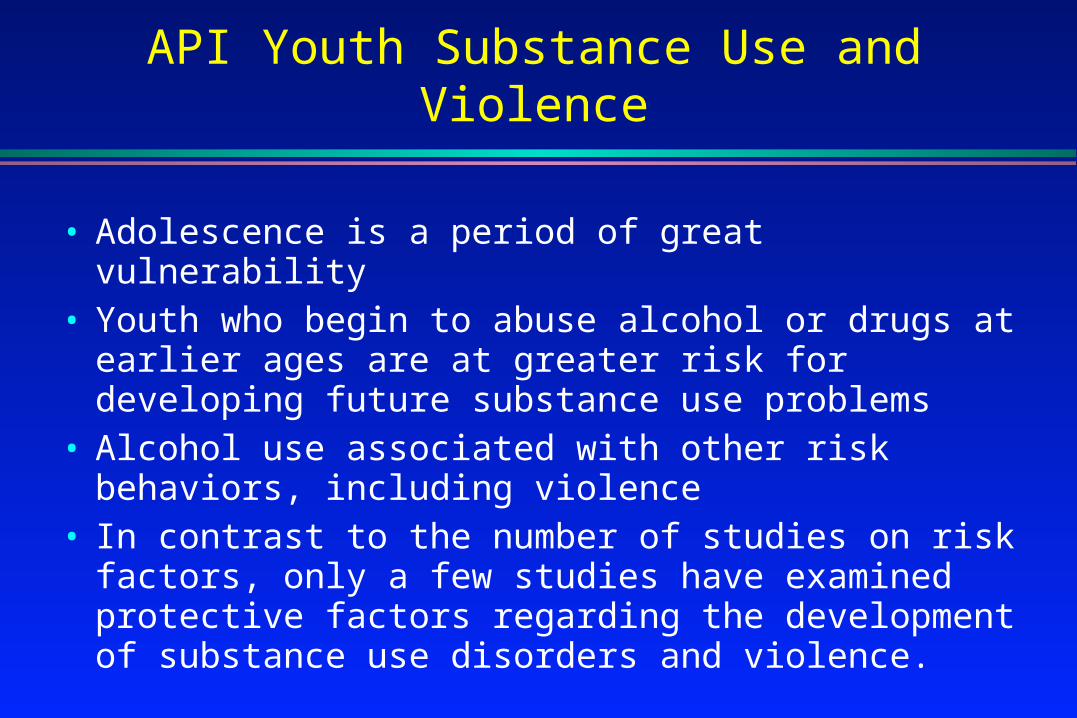
• Adolescence is a period of great vulnerability• Youth who begin to abuse alcohol or drugs at earlier
ages are at greater risk for developing future substance use problems
• Alcohol use associated with other risk behaviors, including violence
• In contrast to the number of studies on risk factors, only a few studies have examined protective factors regarding the development of substance use disorders and violence.
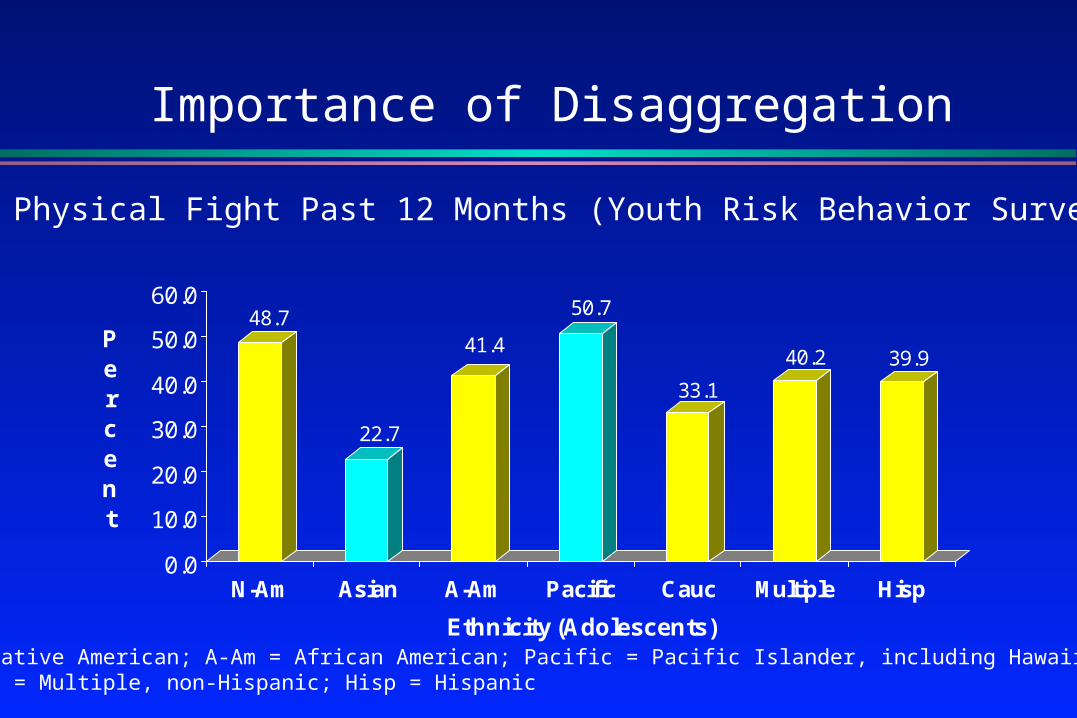
Importance of Disaggregation
48.7
22.7
41.4
50.7
33.1
40.2 39.9
0.0
10.0
20.0
30.0
40.0
50.0
60.0
Percent
N-Am Asian A-Am Pacific Cauc Multiple Hisp
Ethnicity (Adolescents)
In Physical Fight Past 12 Months (Youth Risk Behavior Survey)
N-Am = Native American; A-Am = African American; Pacific = Pacific Islander, including Hawaiian;Multiple = Multiple, non-Hispanic; Hisp = Hispanic
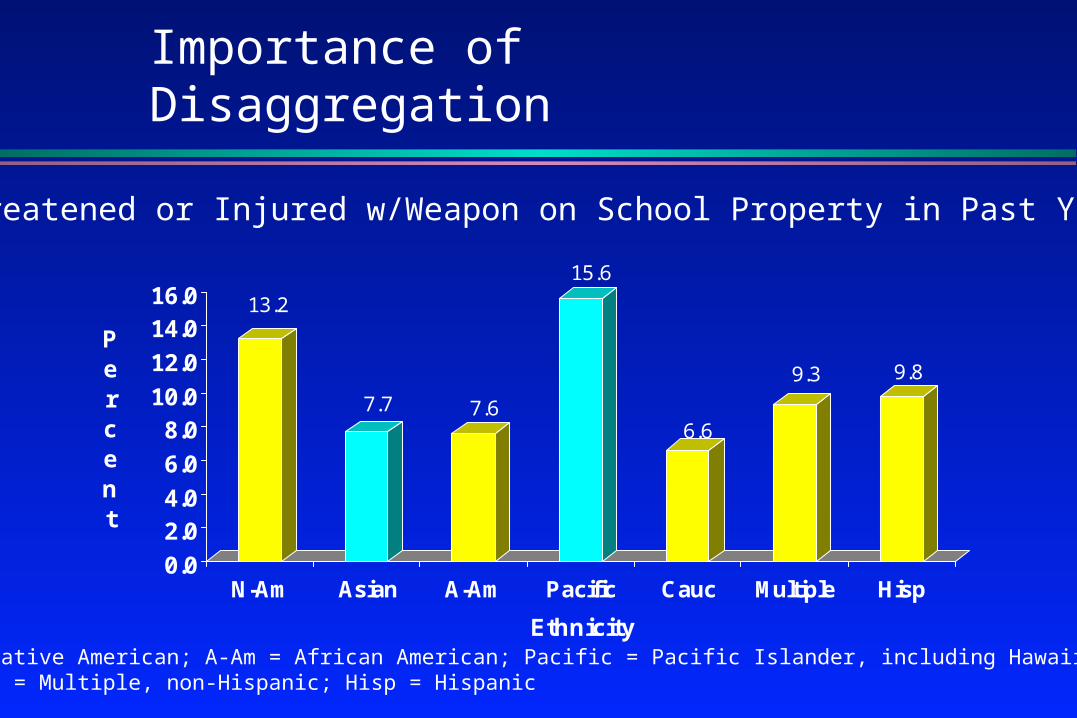
Importance of Disaggregation
13.2
7.7 7.6
15.6
6.6
9.3 9.8
0.0
2.04.0
6.0
8.010.0
12.0
14.016.0
Percent
N-Am Asian A-Am Pacific Cauc Multiple Hisp
Ethnicity
Threatened or Injured w/Weapon on School Property in Past Year
N-Am = Native American; A-Am = African American; Pacific = Pacific Islander, including Hawaiian;Multiple = Multiple, non-Hispanic; Hisp = Hispanic
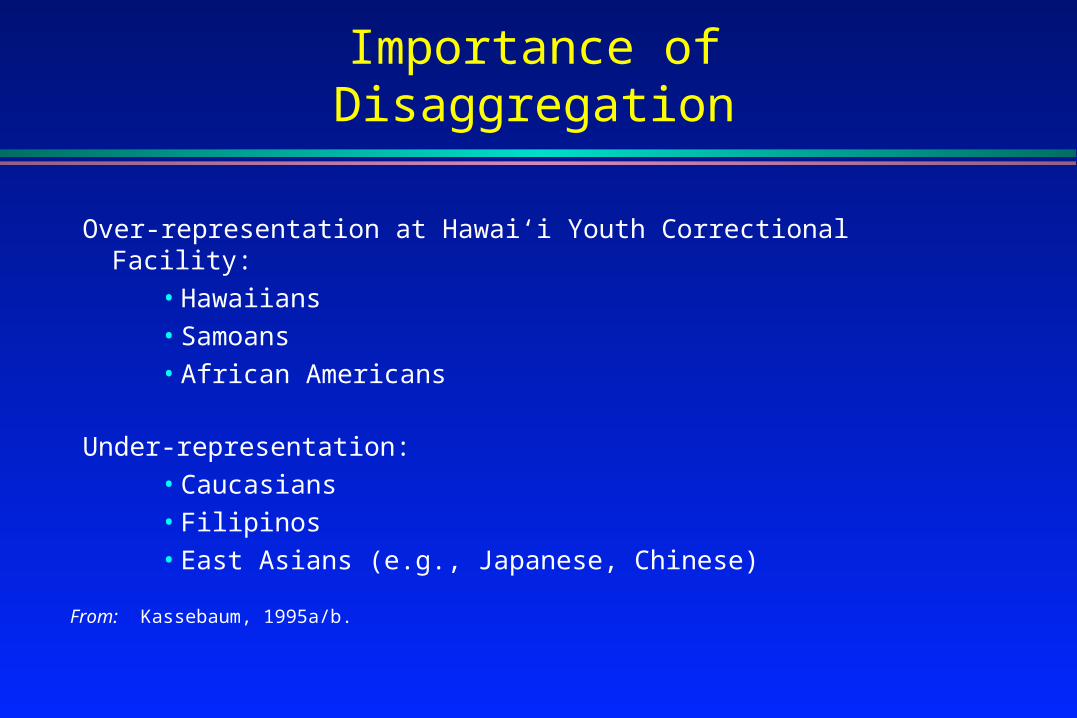
Importance of Disaggregation
Over-representation at Hawai‘i Youth Correctional Facility:• Hawaiians• Samoans• African Americans
Under-representation:• Caucasians• Filipinos• East Asians (e.g., Japanese, Chinese)
From: Kassebaum, 1995a/b.
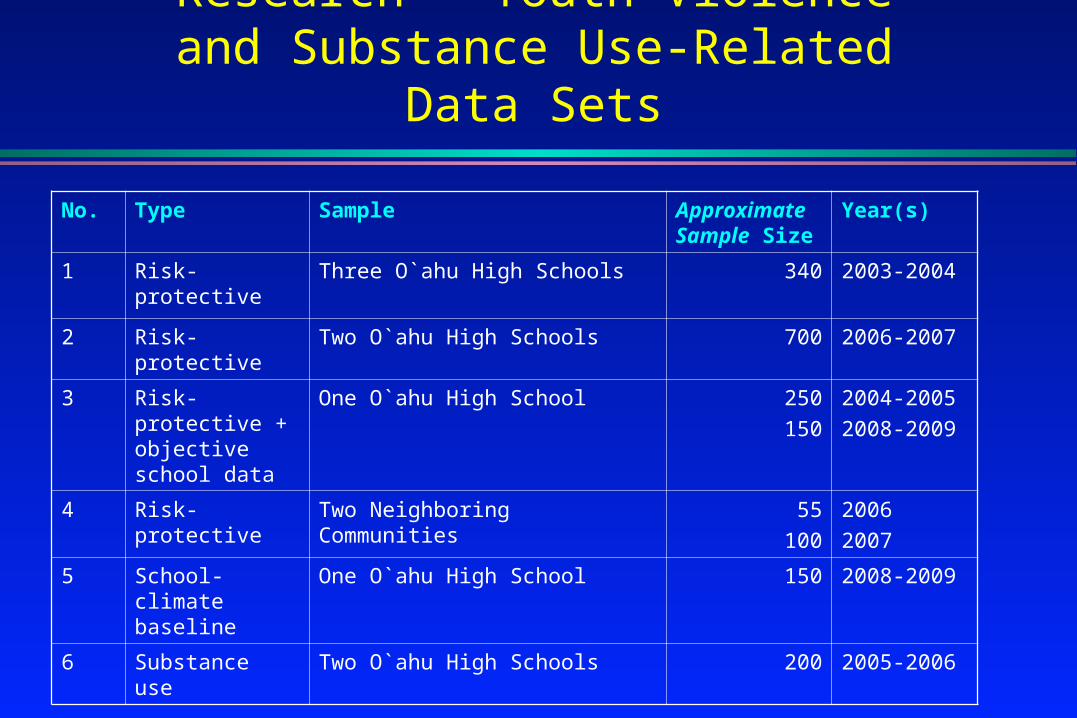
Research – Youth Violence and Substance Use-Related Data Sets
No. Type Sample Approximate Sample Size
Year(s)
1 Risk-protective Three O`ahu High Schools 340 2003-2004
2 Risk-protective Two O`ahu High Schools 700 2006-2007
3 Risk-protective + objective school data
One O`ahu High School 250
150
2004-2005
2008-2009
4 Risk-protective Two Neighboring Communities 55
100
2006
2007
5 School-climate baseline
One O`ahu High School 150 2008-2009
6 Substance use Two O`ahu High Schools 200 2005-2006
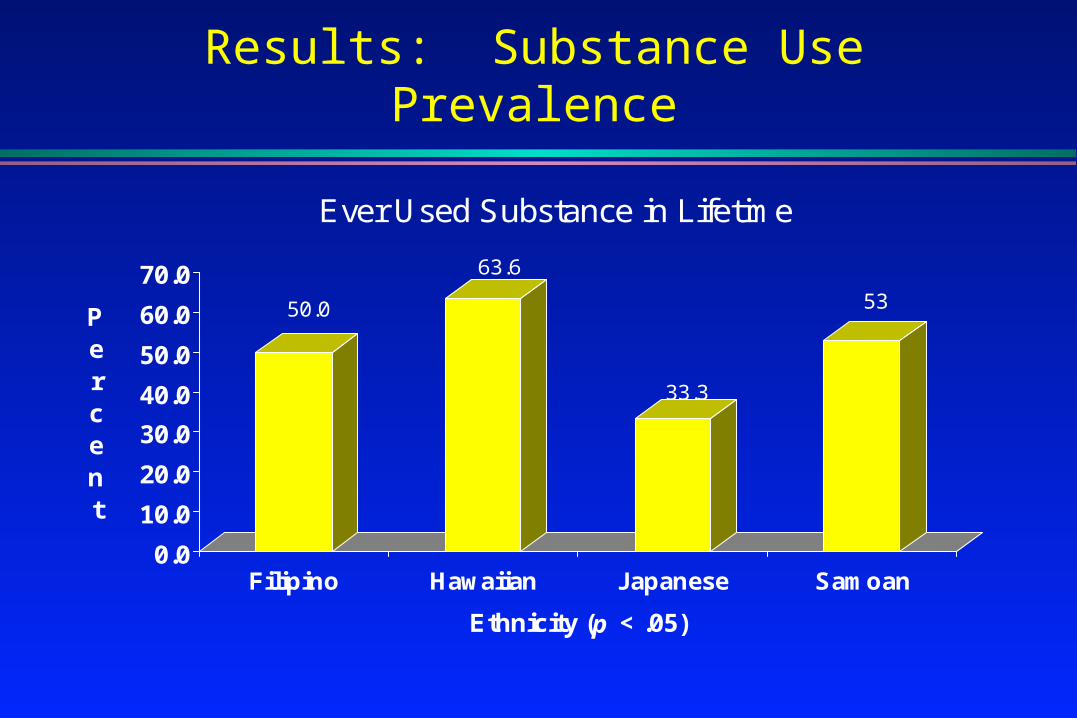
Results: Substance Use Prevalence
50.0
63.6
33.3
53
0.0
10.0
20.0
30.0
40.0
50.0
60.0
70.0
Percent
Filipino Hawaiian Japanese Samoan
Ethnicity (p < .05)
Ever Used Substance in Lifetime

Results: Substance Use Prevalence
27.0
12
41.0
20.5 16.7
6.7
34.7
15.3
0.0
10.0
20.0
30.0
40.0
50.0Percent
Filipino Hawaiian Japanese Samoan
Ethnicity (p < .05)
Drank beer
Last year Currently
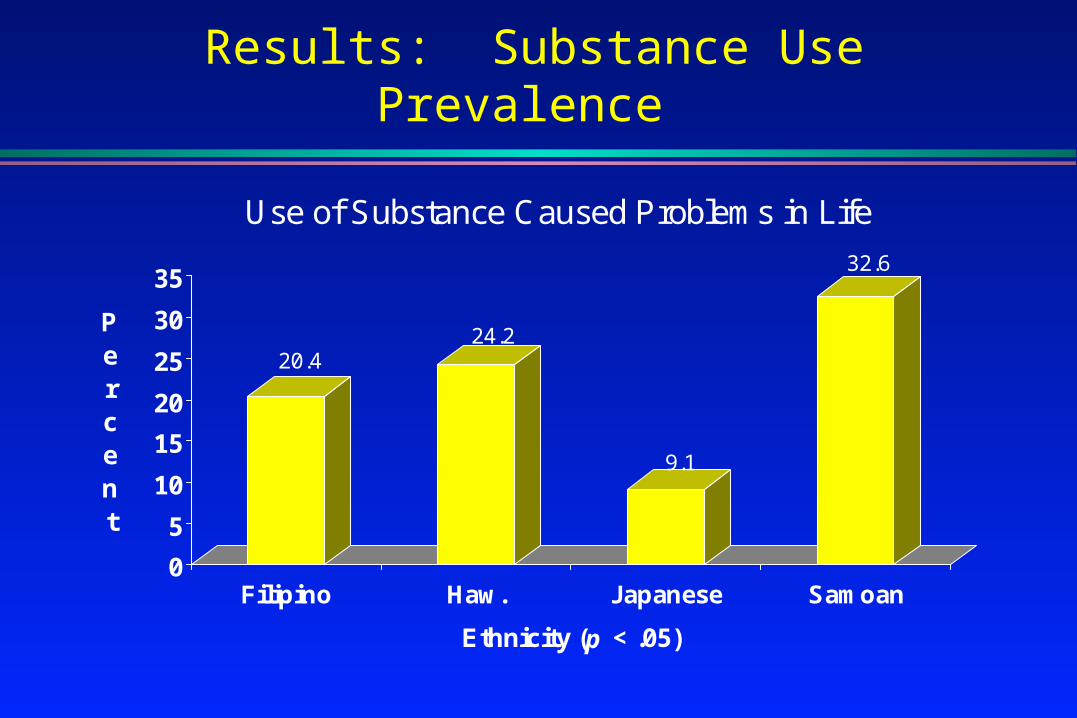
Results: Substance Use Prevalence
20.424.2
9.1
32.6
0
5
10
15
20
25
30
35
Percent
Filipino Haw. Japanese Samoan
Ethnicity (p < .05)
Use of Substance Caused Problems in Life
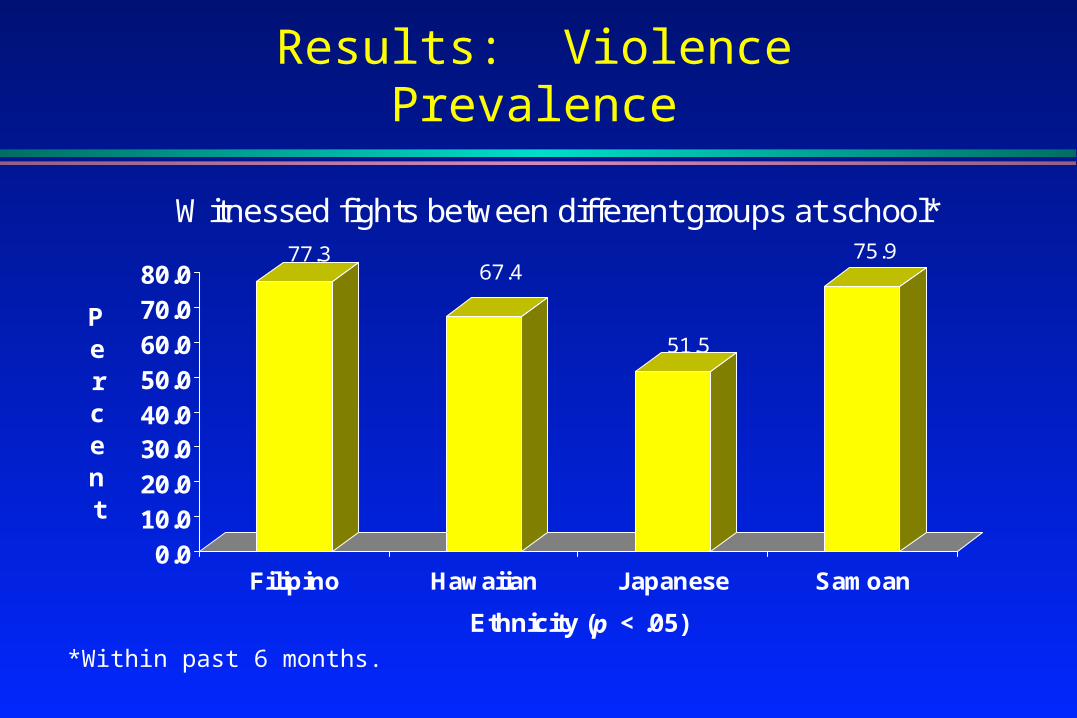
Results: Violence Prevalence
77.367.4
51.5
75.9
0.0
10.0
20.0
30.040.0
50.0
60.0
70.0
80.0
Percent
Filipino Hawaiian Japanese Samoan
Ethnicity (p < .05)
Witnessed fights between different groups at school*
*Within past 6 months.
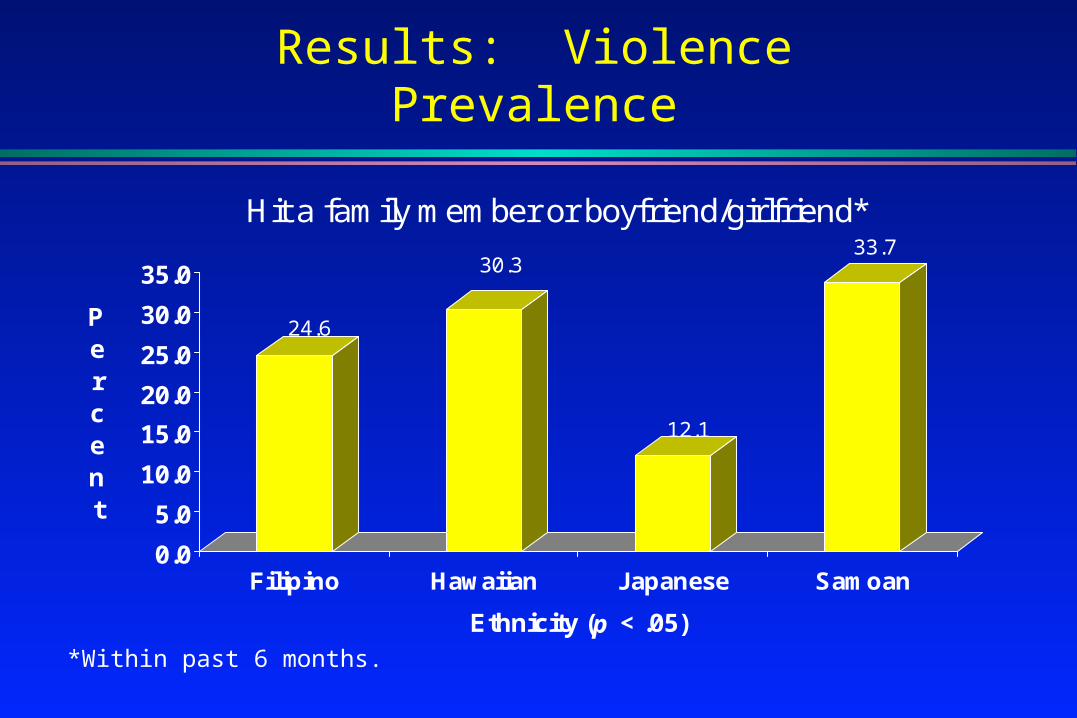
Results: Violence Prevalence
24.6
30.3
12.1
33.7
0.0
5.0
10.0
15.0
20.0
25.0
30.0
35.0
Percent
Filipino Hawaiian Japanese Samoan
Ethnicity (p < .05)
Hit a family member or boyfriend/girlfriend*
*Within past 6 months.
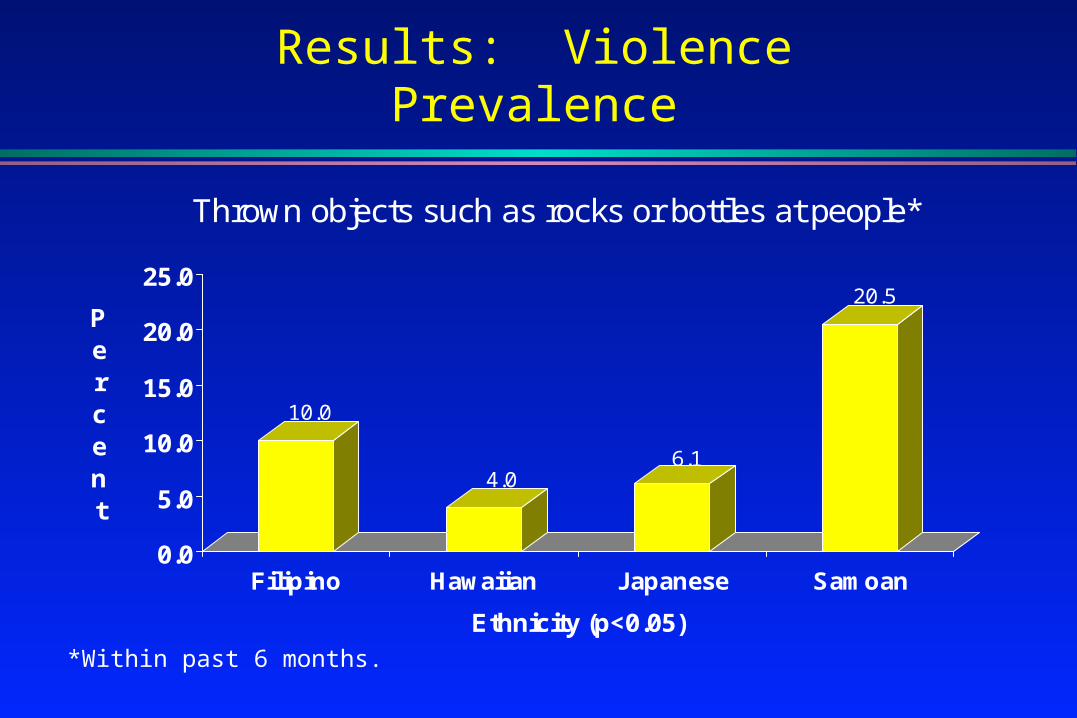
Results: Violence Prevalence
10.0
4.06.1
20.5
0.0
5.0
10.0
15.0
20.0
25.0
Percent
Filipino Hawaiian Japanese Samoan
Ethnicity (p<0.05)
Thrown objects such as rocks or bottles at people*
*Within past 6 months.
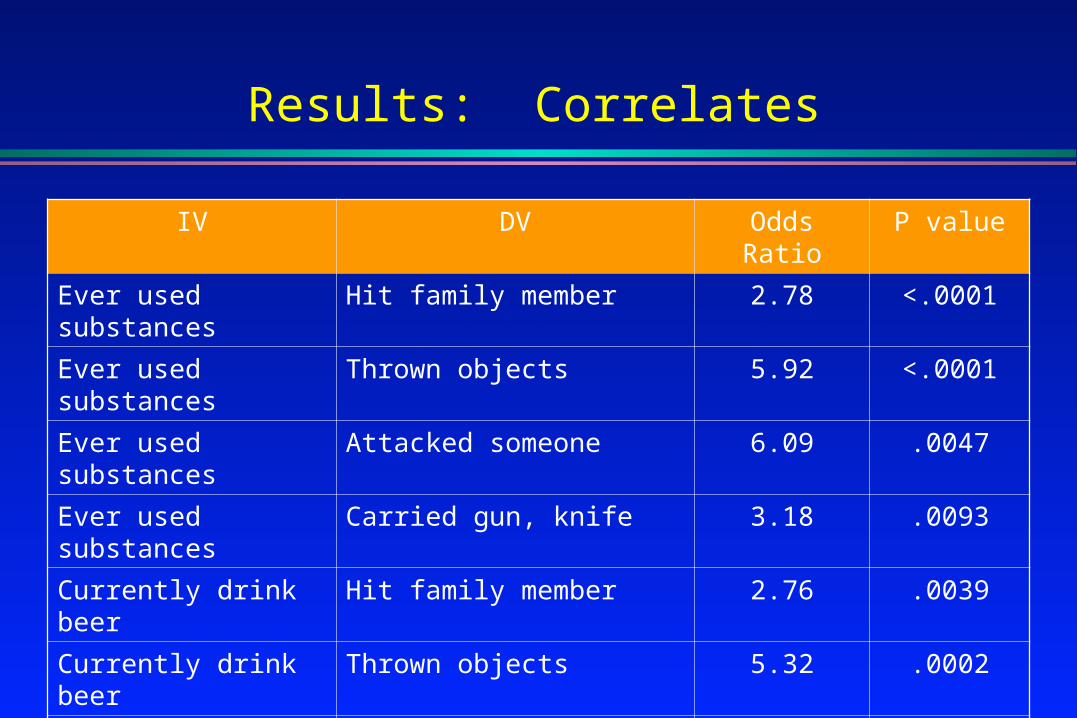
Results: Correlates
IV DV Odds Ratio P value
Ever used substances Hit family member 2.78 <.0001
Ever used substances Thrown objects 5.92 <.0001
Ever used substances Attacked someone 6.09 .0047
Ever used substances Carried gun, knife 3.18 .0093
Currently drink beer Hit family member 2.76 .0039
Currently drink beer Thrown objects 5.32 .0002
Currently drink beer Used weapon to get money 12.10 .0398
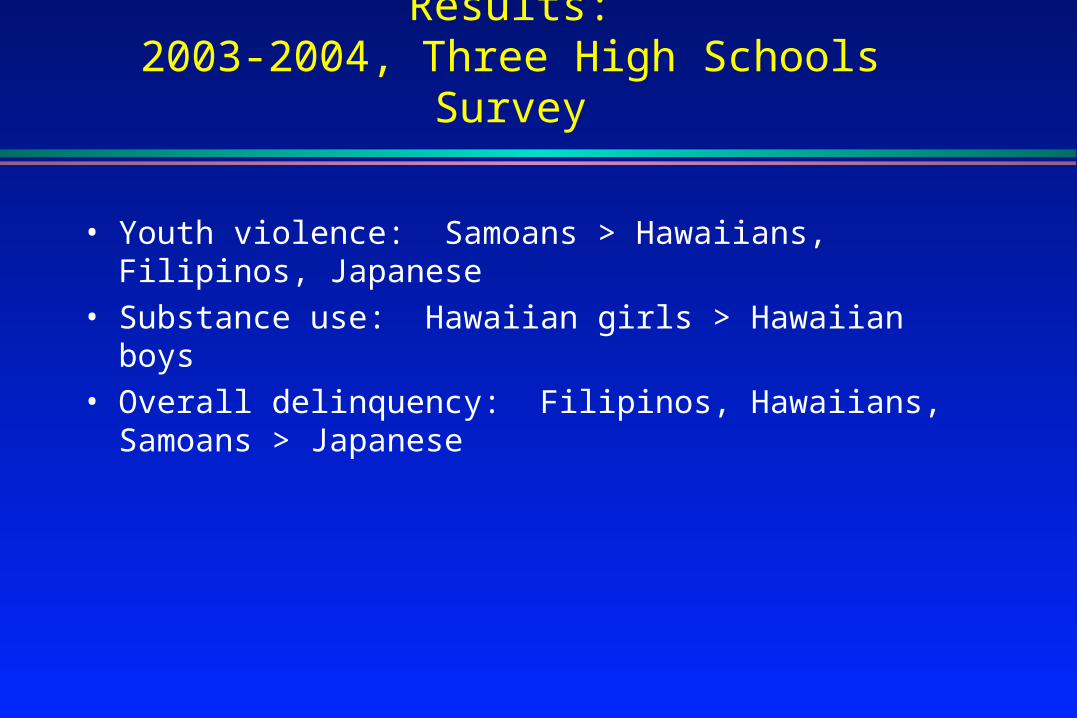
Results:2003-2004, Three High Schools Survey
• Youth violence: Samoans > Hawaiians, Filipinos, Japanese• Substance use: Hawaiian girls > Hawaiian boys• Overall delinquency: Filipinos, Hawaiians, Samoans >
Japanese
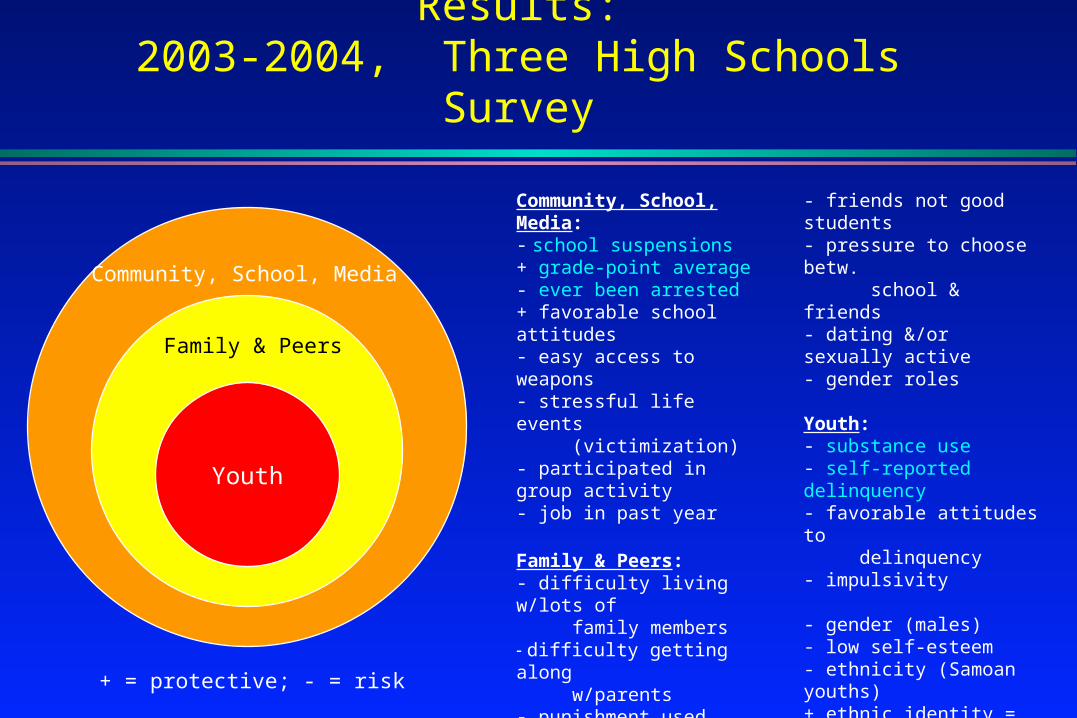
Results:2003-2004, Three High Schools Survey
Community, School, Media
Family & Peers
Youth
Community, School, Media:- school suspensions+ grade-point average- ever been arrested+ favorable school attitudes- easy access to weapons- stressful life events (victimization)- participated in group activity- job in past year
Family & Peers:- difficulty living w/lots of family members- difficulty getting along w/parents- punishment used- importance of religion/ spirituality to parents- peer delinquency (drugs, violence)- gang membership/exposure- hang out w/friends in trouble
- friends not good students- pressure to choose betw. school & friends- dating &/or sexually active- gender roles
Youth:- substance use- self-reported delinquency- favorable attitudes to delinquency- impulsivity
- gender (males)- low self-esteem- ethnicity (Samoan youths)+ ethnic identity = commit- ethnic identity = negative affect- ethnic identity = pride- poor physical health- recent counseling/MH services+ = protective; - = risk
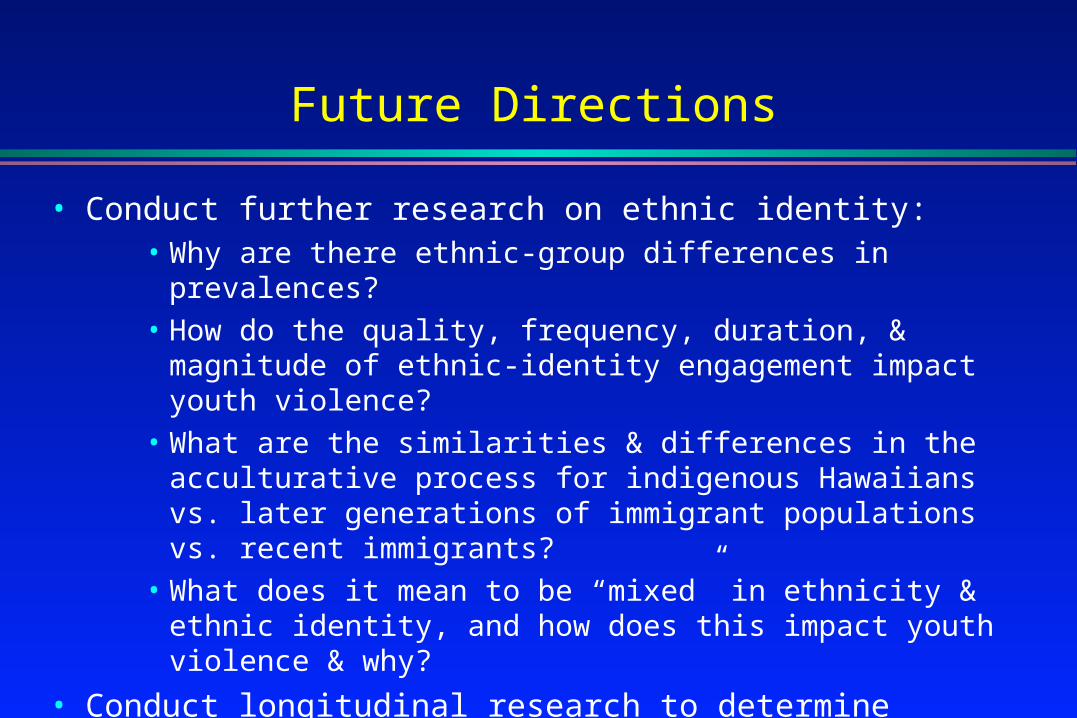
Future Directions
• Conduct further research on ethnic identity:• Why are there ethnic-group differences in prevalences?
• How do the quality, frequency, duration, & magnitude of ethnic-identity engagement impact youth violence?
• What are the similarities & differences in the acculturative process for indigenous Hawaiians vs. later generations of immigrant populations vs. recent immigrants?
• What does it mean to be “mixed” in ethnicity & ethnic identity, and how does this impact youth violence & why?
• Conduct longitudinal research to determine causation• Develop, implement, &/or evaluate prevention& treatment
programs that are responsive to the diversity of Hawai‘i’s people

State of Hawai‘i Department of HealthFigure 1. Three-year rates* of non-fatal injuries from assaults, all ages,
2003-2005
*Rates are per 1,000 residents as estimated by 2000 U.S. Census
0
10
20
30
40
50
60
70
80
0 to 4y
5 to 9
10 to 14
15 to 19
20 to 29
30 to 39
40 to 49
50 to 64
65 to 74
75 + y
0 to 4y
5 to 9
10 to 14
15 to 19
20 to 29
30 to 39
40 to 49
50 to 64
65 to 74
75 + y
Females Males
Community B
Community A
Rest of Hawaii
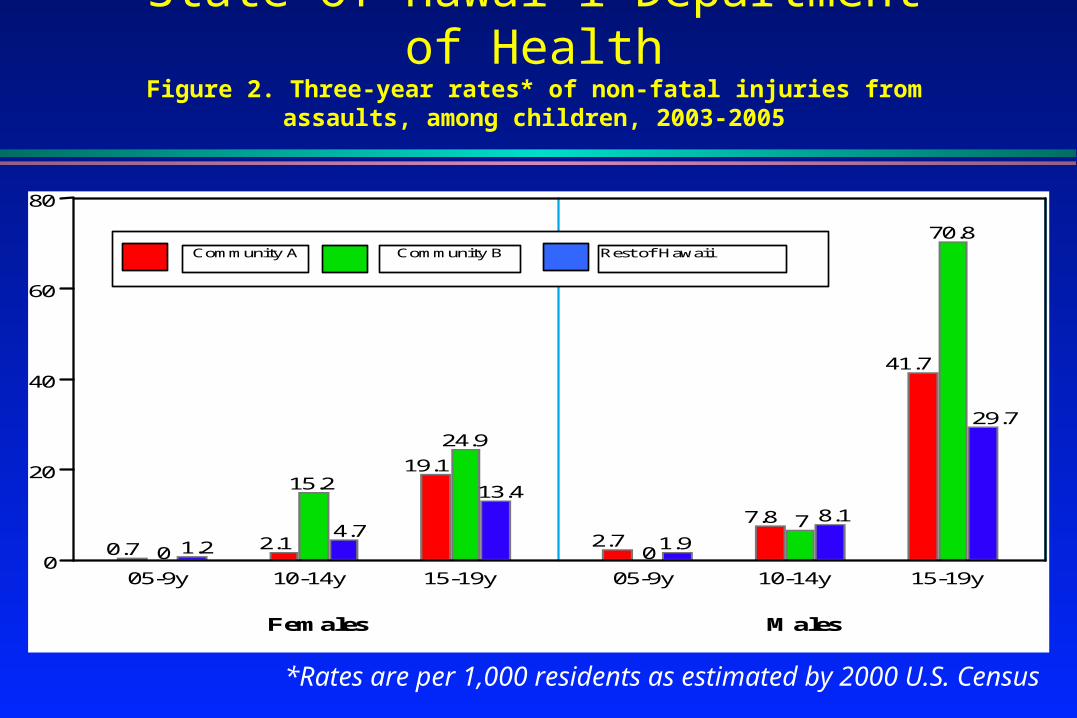
State of Hawai‘i Department of HealthFigure 2. Three-year rates* of non-fatal injuries from assaults, among
children, 2003-2005
*Rates are per 1,000 residents as estimated by 2000 U.S. Census
0
20
40
60
80
0.7 2.1
19.1
2.7 7.8
41.7
0
15.2
24.9
0
7
70.8
1.2 4.7
13.4
1.9
8.1
29.7
05-9y 10-14y 15-19y 05-9y 10-14y 15-19y
Females Males
Community B Community A Rest of Hawaii

Results: 2007, Community Outcomes(% Strongly Agree or Agree)
51
78
97
95
0 20 40 60 80 100
I feel safe walking down street in communityat night
I feel safe walking down street in communityduring day
I feel safe in community I live in
I think youth violence/delinquency is aproblem in my area

Results: 2007, Youth Outcomes(% Strongly Agree or Agree)
66
67
68
75
84
0 20 40 60 80 100
Property damage
Bullying
Being exposed to domestic violence
Robbery or burglary
Reckless driving/speeding (not DUI)
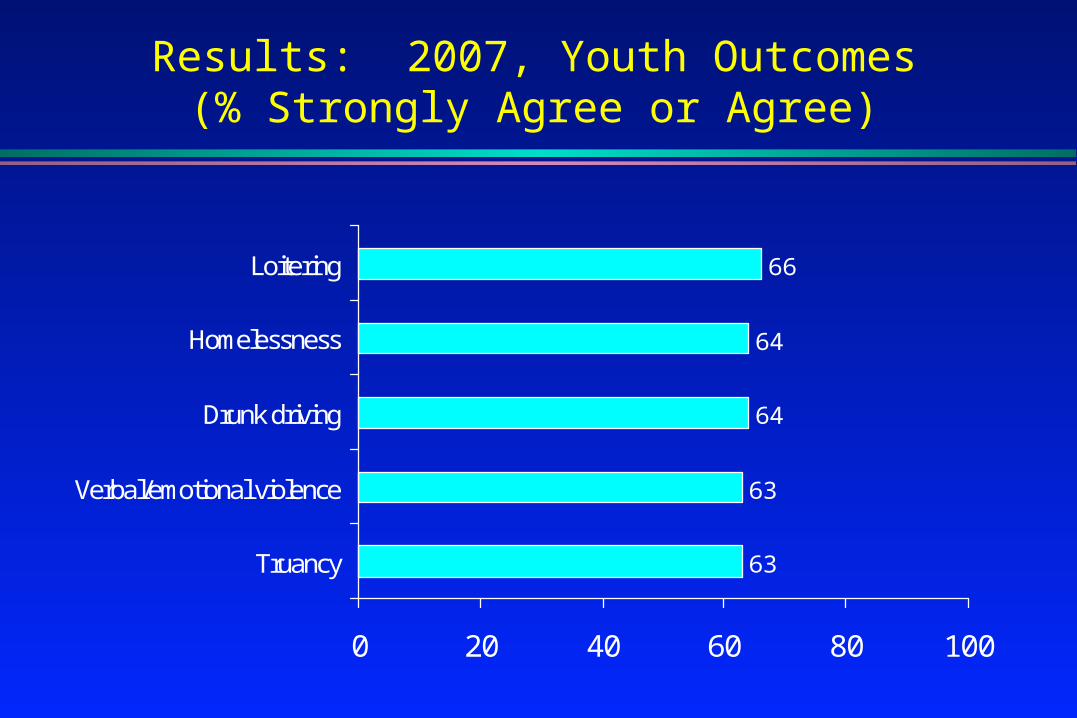
Results: 2007, Youth Outcomes(% Strongly Agree or Agree)
63
63
64
64
66
0 20 40 60 80 100
Truancy
Verbal/emotional violence
Drunk driving
Homelessness
Loitering
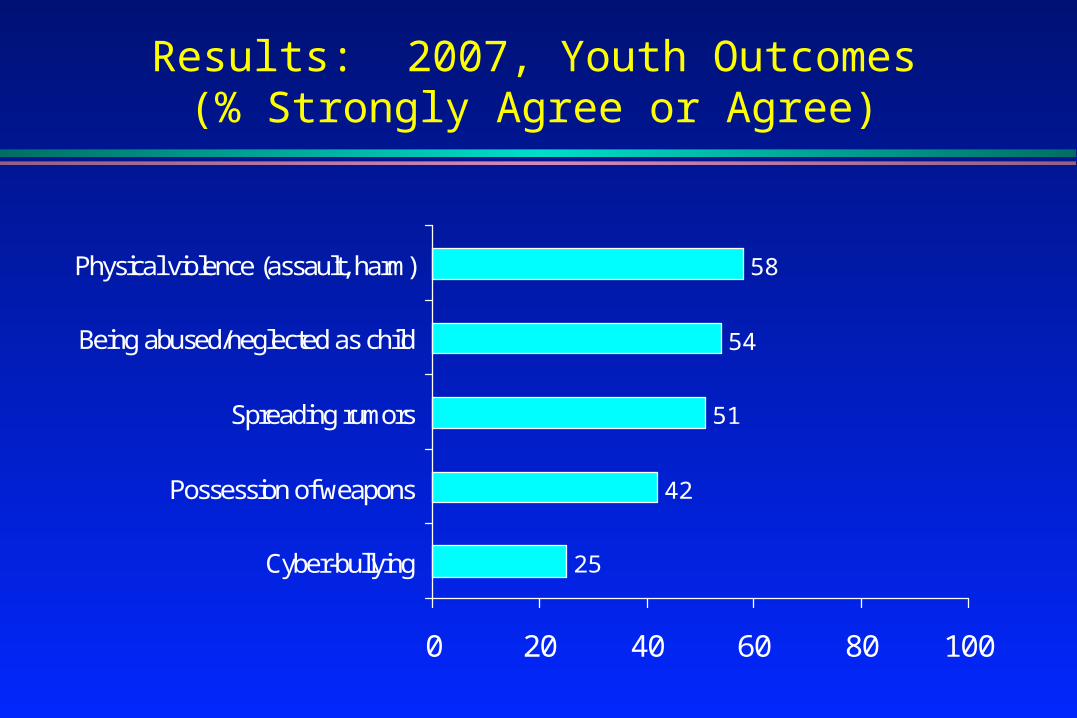
Results: 2007, Youth Outcomes(% Strongly Agree or Agree)
25
42
51
54
58
0 20 40 60 80 100
Cyber-bullying
Possession of weapons
Spreading rumors
Being abused/neglected as child
Physical violence (assault, harm)
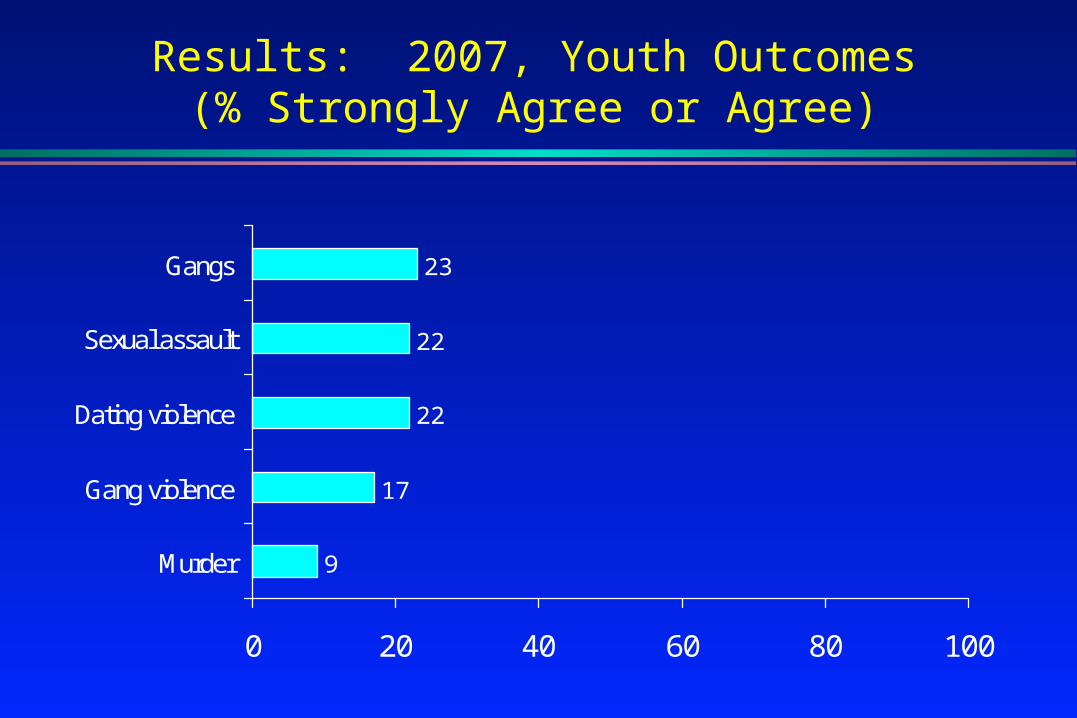
Results: 2007, Youth Outcomes(% Strongly Agree or Agree)
9
17
22
22
23
0 20 40 60 80 100
Murder
Gang violence
Dating violence
Sexual assault
Gangs

Results: 2007, Community SurveyRisk-Protective Factors
1. Demographics
2. Community
3. Causes of Youth Violence
4. Protective Factors
5. Youth Substance Use
6. Perceived Support
7. Physical Health
8. Religion, Spirituality
9. Ethnic Identity
10.Colonialism
11.Parent Supervision & Involvement
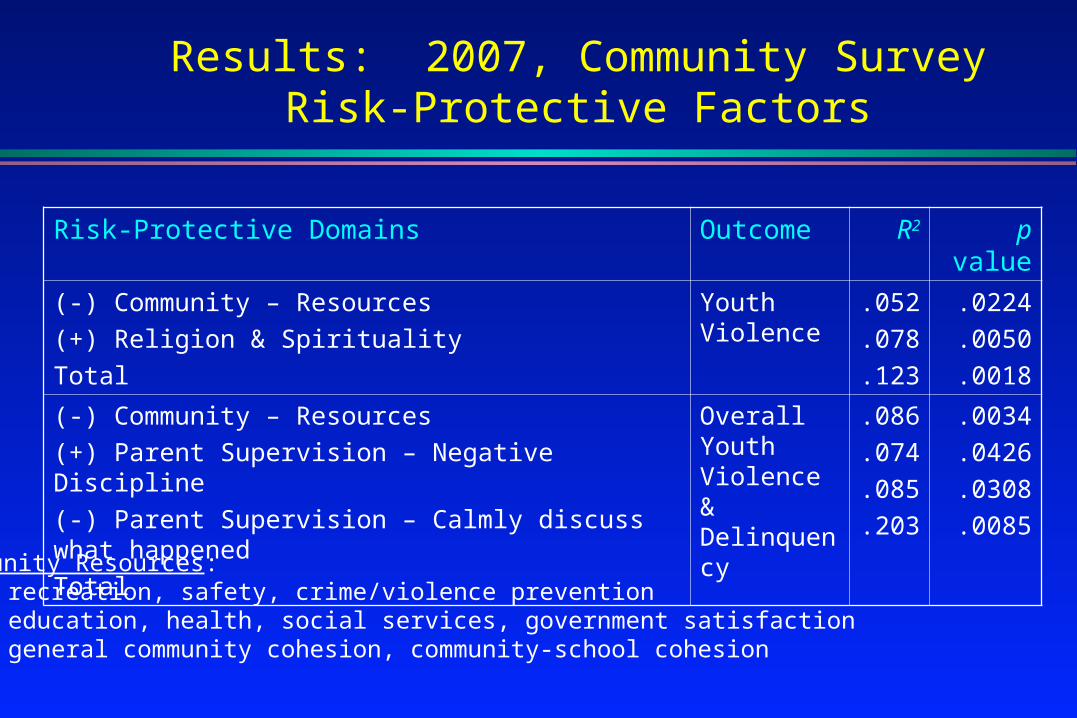
Results: 2007, Community SurveyRisk-Protective Factors
Risk-Protective Domains Outcome R2 p value
(-) Community – Resources
(+) Religion & Spirituality
Total
Youth Violence
.052
.078
.123
.0224
.0050
.0018
(-) Community – Resources
(+) Parent Supervision – Negative Discipline
(-) Parent Supervision – Calmly discuss what happened
Total
Overall Youth Violence & Delinquency
.086
.074
.085
.203
.0034
.0426
.0308
.0085
Community Resources:• recreation, safety, crime/violence prevention• education, health, social services, government satisfaction• general community cohesion, community-school cohesion
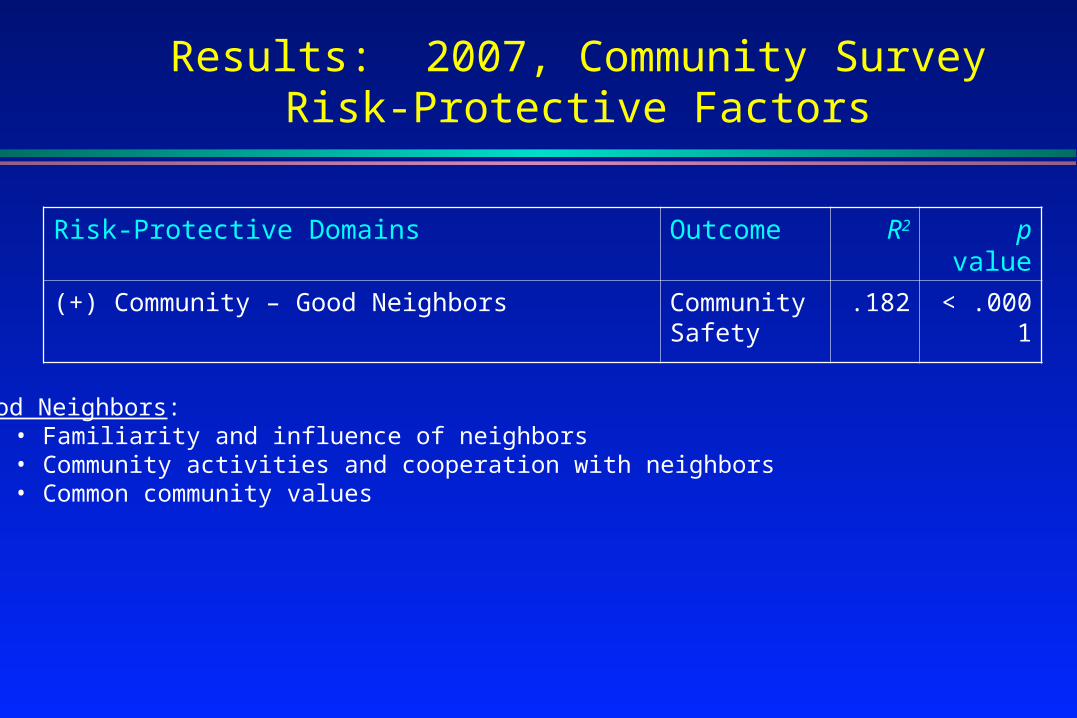
Results: 2007, Community SurveyRisk-Protective Factors
Risk-Protective Domains Outcome R2 p value
(+) Community – Good Neighbors Community Safety
.182 < .0001
Good Neighbors:• Familiarity and influence of neighbors• Community activities and cooperation with neighbors• Common community values

2007 O`ahu High School Survey: What Causes Fights?
41.5
19.7
25.3 24.3
76.5
34.4
24.2 23
0
10
20
30
40
50
60
70
80
90
Rumors Dating Respect Conflict b/tSchools
Boys
Girls
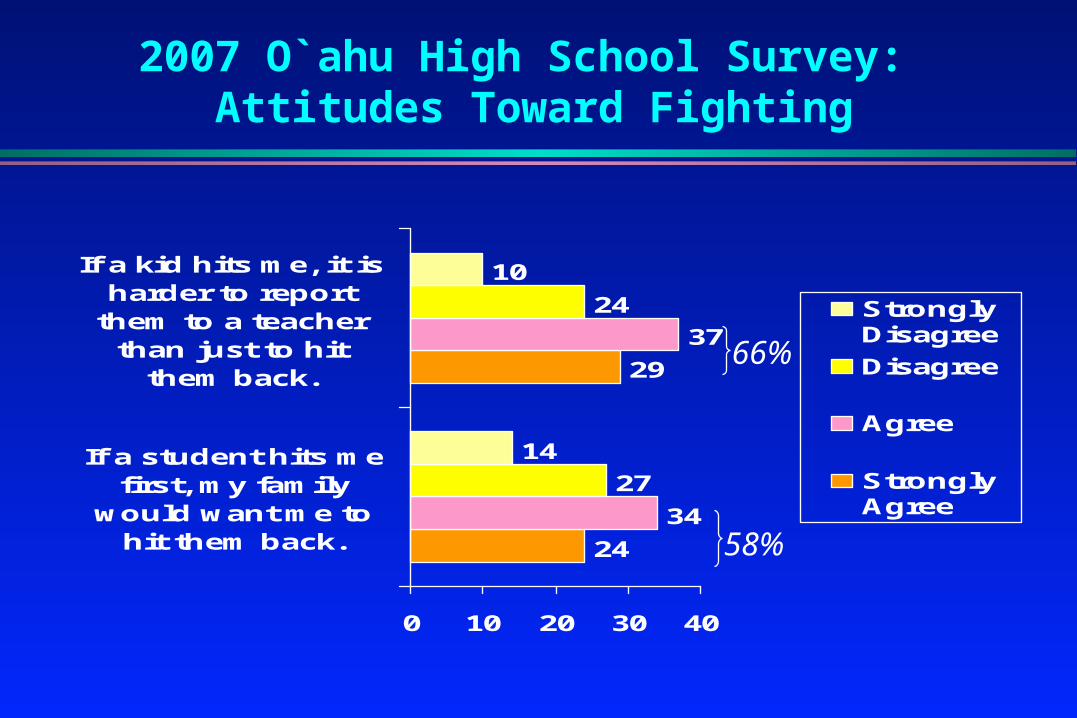
2007 O`ahu High School Survey: Attitudes Toward Fighting
24
29
34
37
27
24
14
10
0 10 20 30 40
If a student hits mefirst, my family
would want me tohit them back.
If a kid hits me, it isharder to report
them to a teacherthan just to hit
them back.
StronglyDisagree
Disagree
Agree
StronglyAgree
58%
66%

Comparison to YRBS (2005)
Item Description (Youth Risk Behavior Survey) One O`ahu High School
Hawai‘I U.S.
In physical fight 28% 27% 36%
In physical fight on school property 17% 10% 14%
Felt unsafe to go to school within past 30 days 10% 6% 7%
Threatened/injured with weapon on school property 3% 7% 8%
Seriously considered suicide 17% 20% 17%
Ever forced to have sexual intercourse 8% 10% 8%
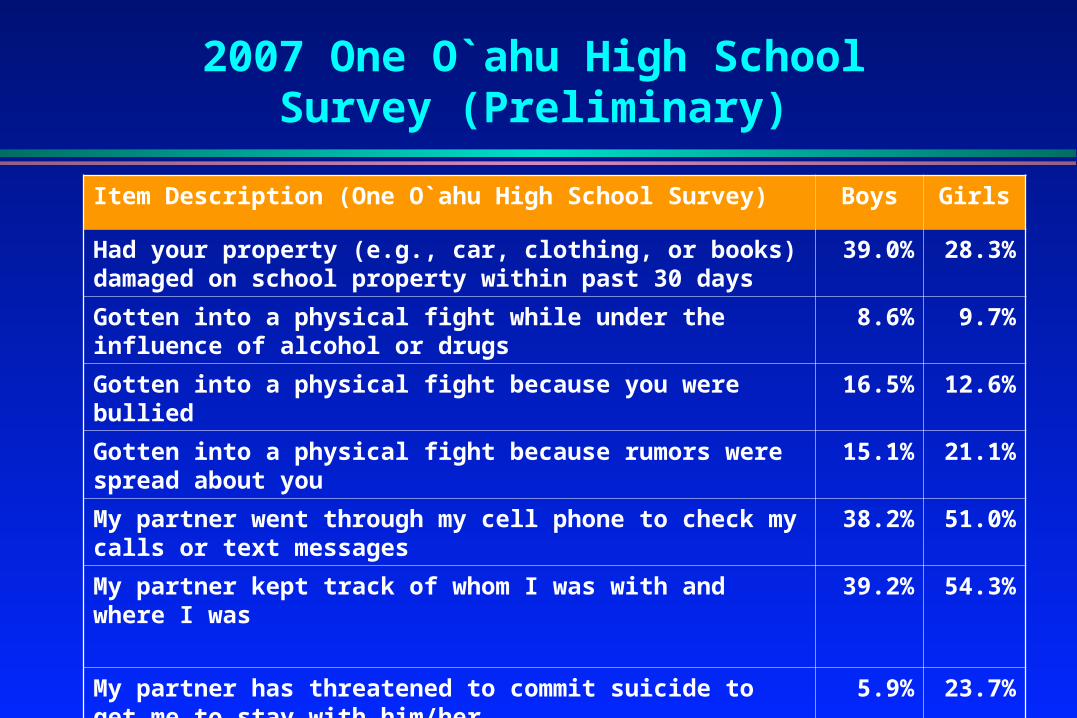
2007 One O`ahu High School Survey (Preliminary)
Item Description (One O`ahu High School Survey) Boys Girls
Had your property (e.g., car, clothing, or books) damaged on school property within past 30 days
39.0% 28.3%
Gotten into a physical fight while under the influence of alcohol or drugs
8.6% 9.7%
Gotten into a physical fight because you were bullied 16.5% 12.6%
Gotten into a physical fight because rumors were spread about you
15.1% 21.1%
My partner went through my cell phone to check my calls or text messages
38.2% 51.0%
My partner kept track of whom I was with and where I was 39.2% 54.3%
My partner has threatened to commit suicide to get me to stay with him/her
5.9% 23.7%

Ecological Model:Examples of Prevention Strategies
Individual•Social development programs•Cultural enrichment
Relationship•Parenting programmes• Home visitation• Family therapy
Community•Reducing alcohol availability • Identify and refer people at risk for substance abuse or violence
Societal•Public information • Strengthen police and judicial systems• Reduce poverty and inequality
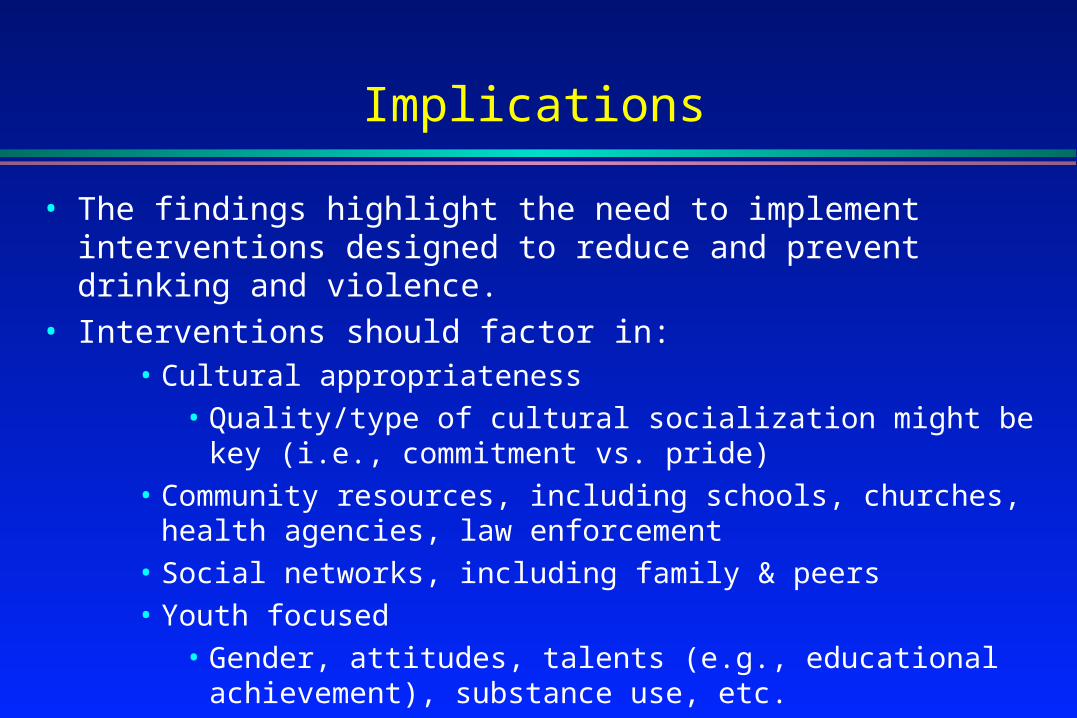
Implications
• The findings highlight the need to implement interventions designed to reduce and prevent drinking and violence.
• Interventions should factor in:• Cultural appropriateness
• Quality/type of cultural socialization might be key (i.e., commitment vs. pride)
• Community resources, including schools, churches, health agencies, law enforcement
• Social networks, including family & peers
• Youth focused
• Gender, attitudes, talents (e.g., educational achievement), substance use, etc.
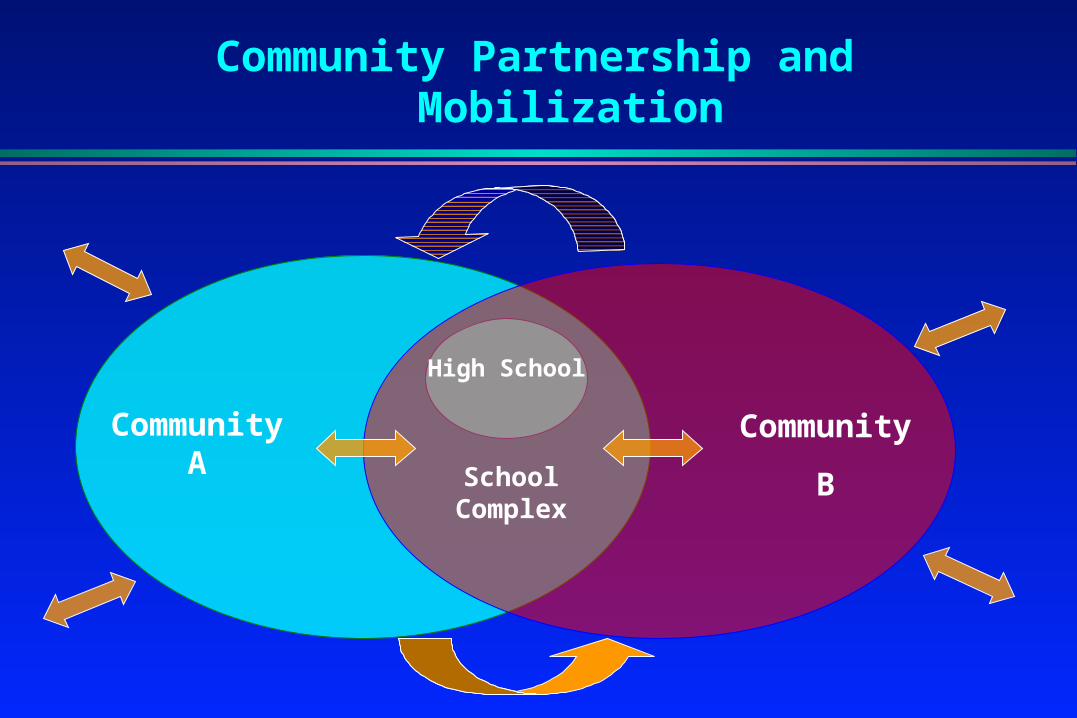
School Complex
Community A
Community
B
High School
Community Partnership and Mobilization

Community Work Group
Religious Groups
Teen Organizations
Cultural Groups
Women’s Group
Local Business
Youth Development
Private Schools
Home Associations
Community Togetherness
Meetings
More individuals & organizations
coming in
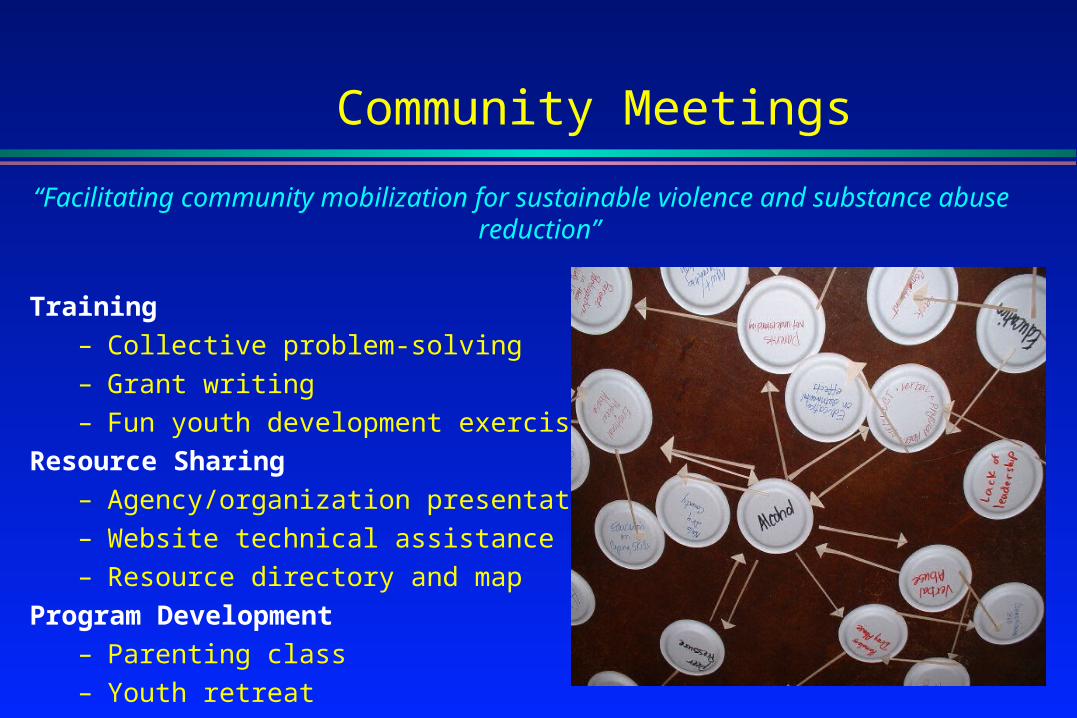
Community Meetings
“Facilitating community mobilization for sustainable violence and substance abuse reduction”
Training – Collective problem-solving
– Grant writing
– Fun youth development exercises
Resource Sharing– Agency/organization presentations
– Website technical assistance
– Resource directory and map
Program Development– Parenting class
– Youth retreat
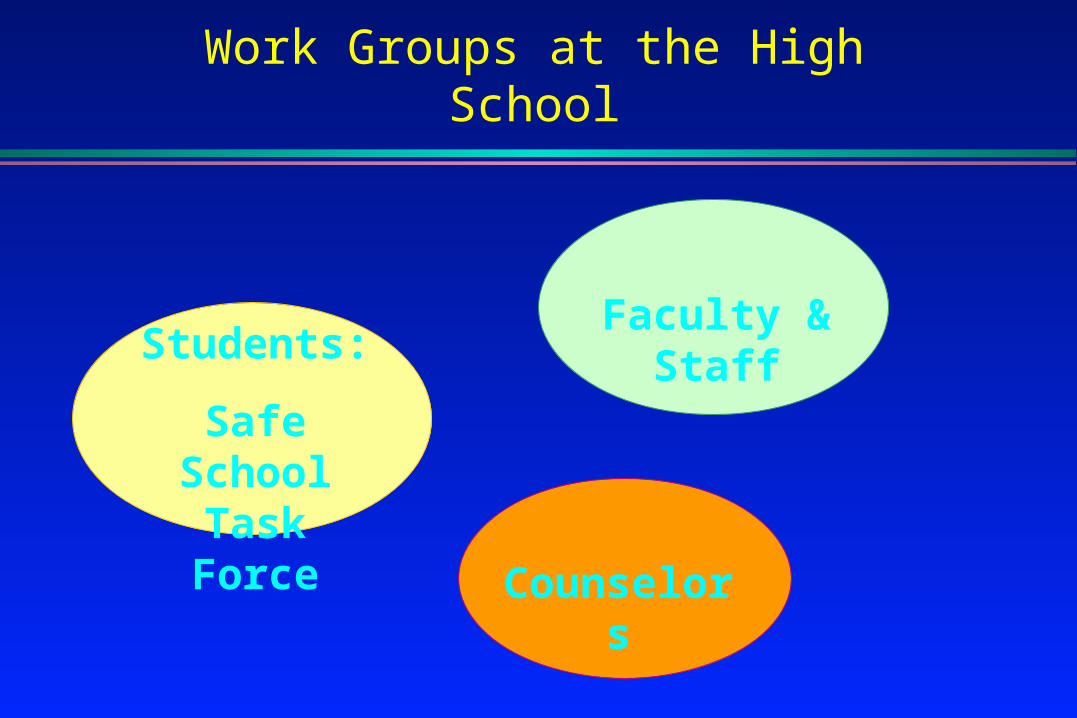
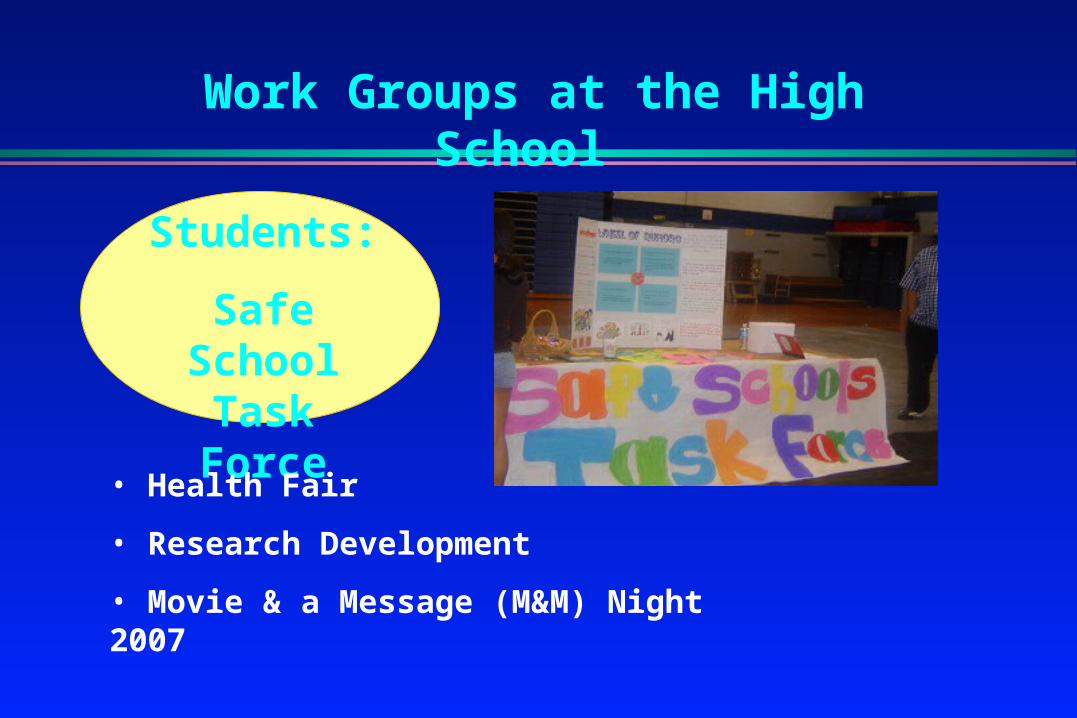
Work Groups at the High School
Students:
Safe School Task Force
Faculty & Staff
Counselors
Students:
Safe School Task Force
Work Groups at the High School
• Health Fair
• Research Development
• Movie & a Message (M&M) Night 2007
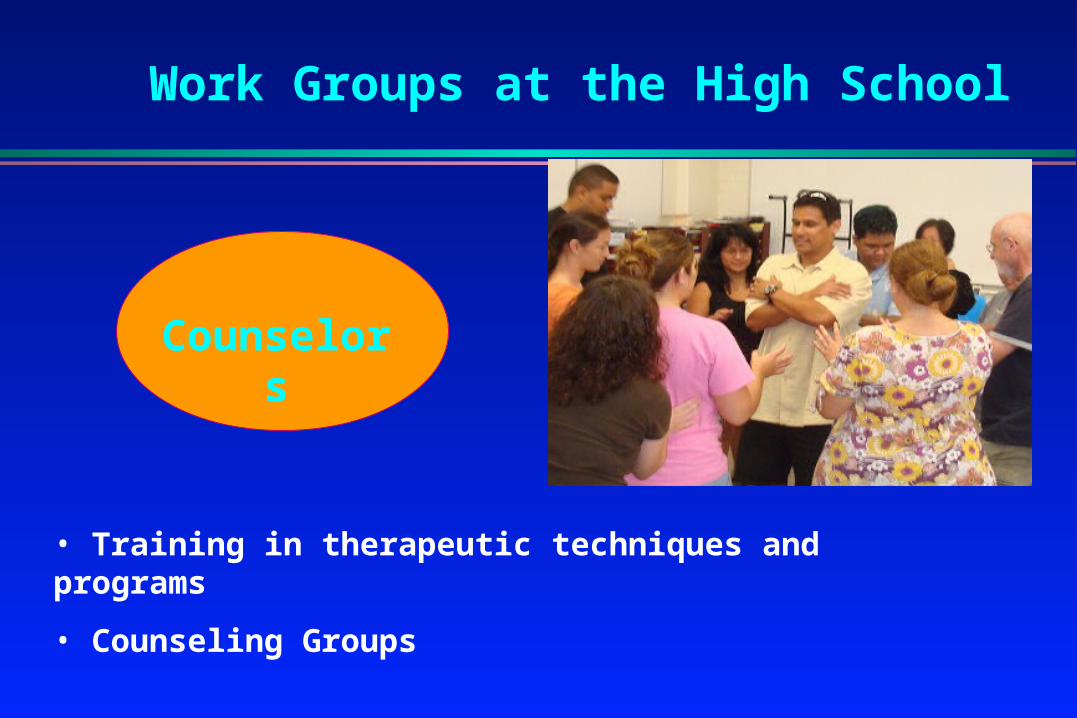
Counselors
Work Groups at the High School
• Training in therapeutic techniques and programs
• Counseling Groups

Faculty & Staff
Work Groups at the High School
• Freshman Jump Start
• Movie & a Message (M&M) Night
• Ethnic Studies
• DOE PDERI Summer Course
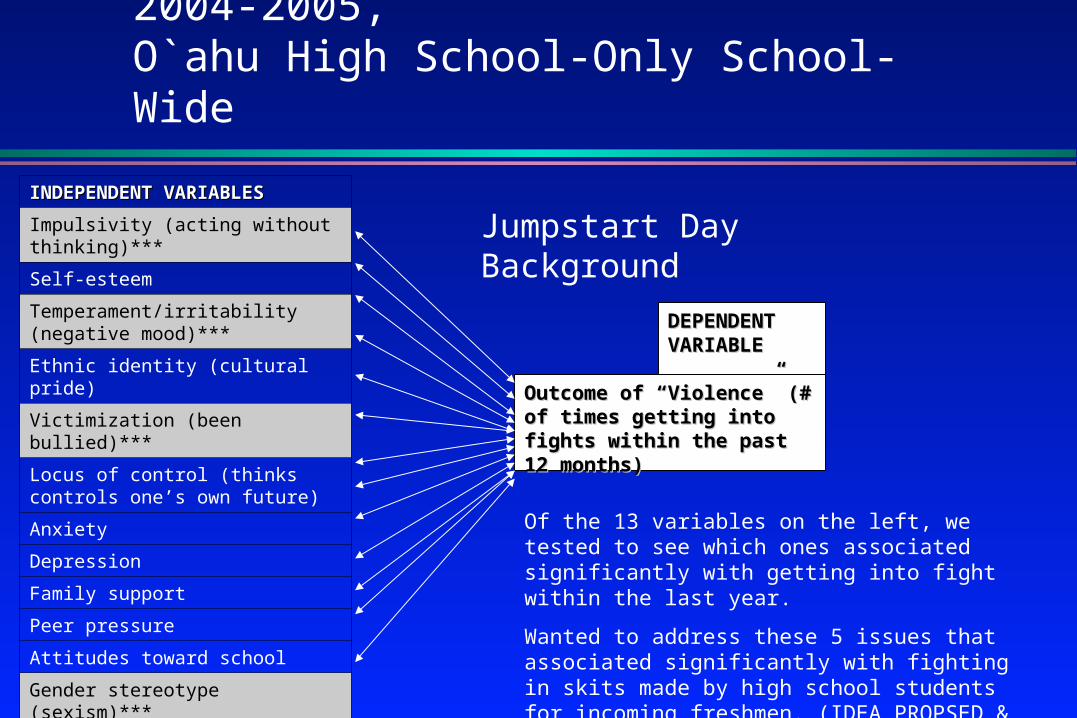
2004-2005,O`ahu High School-Only School-Wide
INDEPENDENT VARIABLESINDEPENDENT VARIABLES
Impulsivity (acting without thinking)***
Self-esteem
Temperament/irritability (negative mood)***
Ethnic identity (cultural pride)
Victimization (been bullied)***
Locus of control (thinks controls one’s own future)
Anxiety
Depression
Family support
Peer pressure
Attitudes toward school
Gender stereotype (sexism)***
Substance Use (smoking cigarettes***; alcohol; marijuana)
Jumpstart Day Background
DEPENDENT DEPENDENT VARIABLEVARIABLE
Outcome of “Violence” (# of times Outcome of “Violence” (# of times getting into fights within the past getting into fights within the past 12 months)12 months)
Of the 13 variables on the left, we tested to see which ones associated significantly with getting into fight within the last year.
Wanted to address these 5 issues that associated significantly with fighting in skits made by high school students for incoming freshmen. (IDEA PROPSED & DESIGNED BY TEACHERS WORKGROUP)
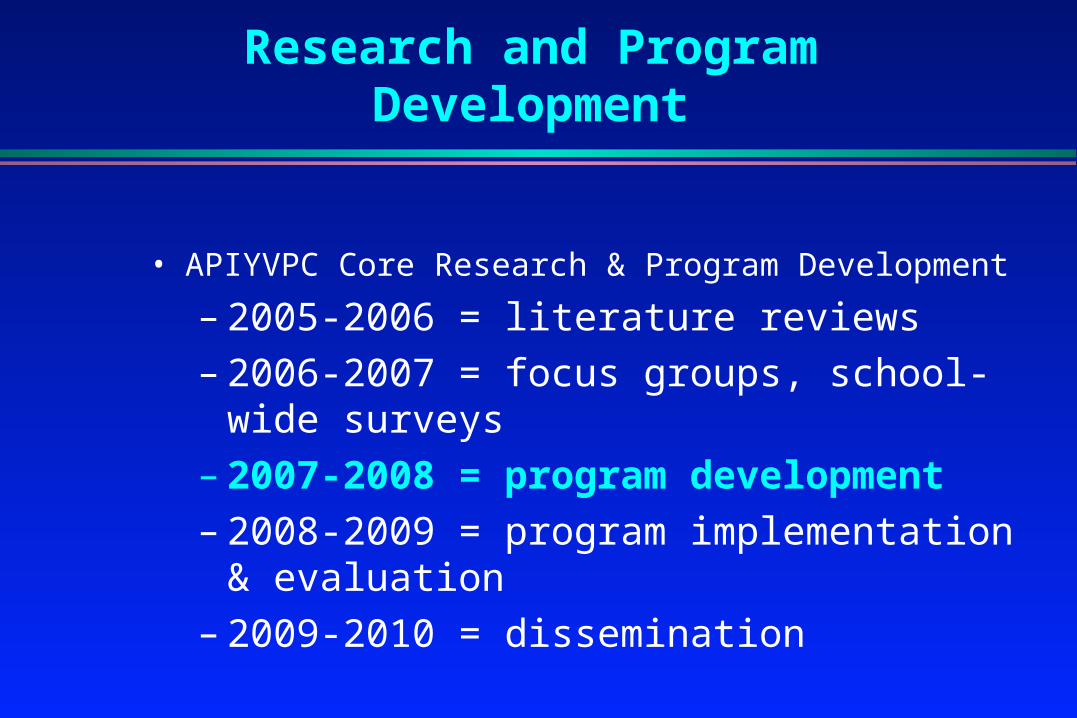
Research and Program Development
• APIYVPC Core Research & Program Development
– 2005-2006 = literature reviews
– 2006-2007 = focus groups, school-wide surveys
– 2007-2008 = program development
– 2008-2009 = program implementation & evaluation
– 2009-2010 = dissemination
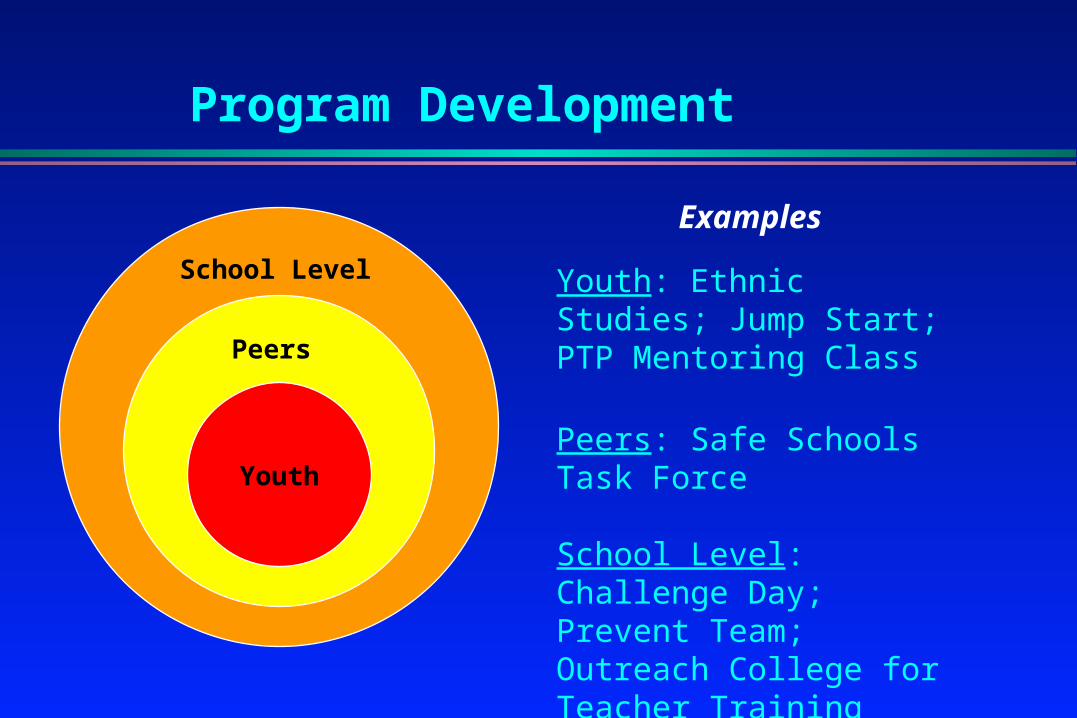
Program Development
School Level
Peers
Youth
Youth: Ethnic Studies; Jump Start; PTP Mentoring Class
Peers: Safe Schools Task Force
School Level: Challenge Day; Prevent Team; Outreach College for Teacher Training
Examples
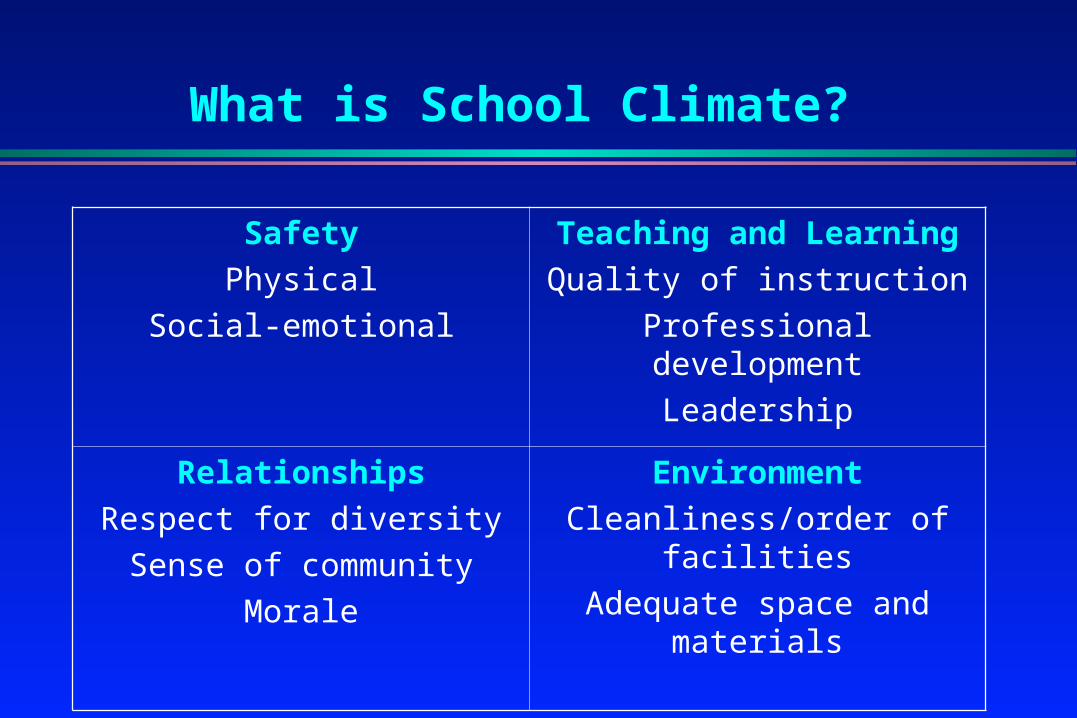
What is School Climate?
Safety
Physical
Social-emotional
Teaching and Learning
Quality of instruction
Professional development
Leadership
Relationships
Respect for diversity
Sense of community
Morale
Environment
Cleanliness/order of facilities
Adequate space and materials
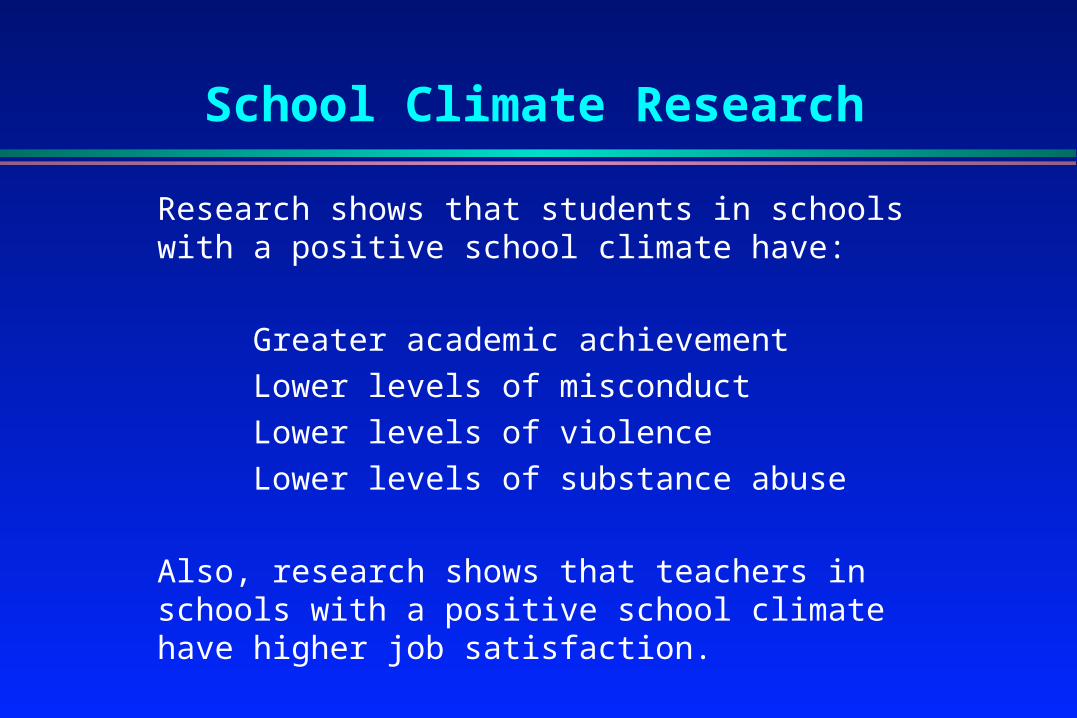
School Climate Research
Research shows that students in schools with a positive school climate have:
Greater academic achievement
Lower levels of misconduct
Lower levels of violence
Lower levels of substance abuse
Also, research shows that teachers in schools with a positive school climate have higher job satisfaction.

School Climate Dimensions
Safety:I feel safe in all areas in and around my school. 64%Students being disruptive keep me from learning. 56%Students threatening other students make it hard to learn. 48%The classrooms and hallways are kept under control. 41%When students are spreading rumors, most of my
teachers know what to do to stop it. 33%
Relationships:Teachers are fair in dealing with students. 57%The school rules are fairly enforced. 48% Teachers are respected. 38%Most teachers at my school want to stop fights from happening. 84% Most students at my school want to stop fights from happening. 18%

Next Steps
1. Community: Continue community efforts to address youth violence & development
2. Research: Continue surveillance studies of students in school & community
3. Program: Develop, evaluate, & disseminate an effective, culturally appropriate prevention/intervention program
4. Train: Continue to train teachers, school officials, community members, practitioners, & academicians
5. Dissemination: Disseminate our findings
6. Evaluate: Continue to evaluate & improve the APIYVPC
7. Renew: Renewal application at end 2009
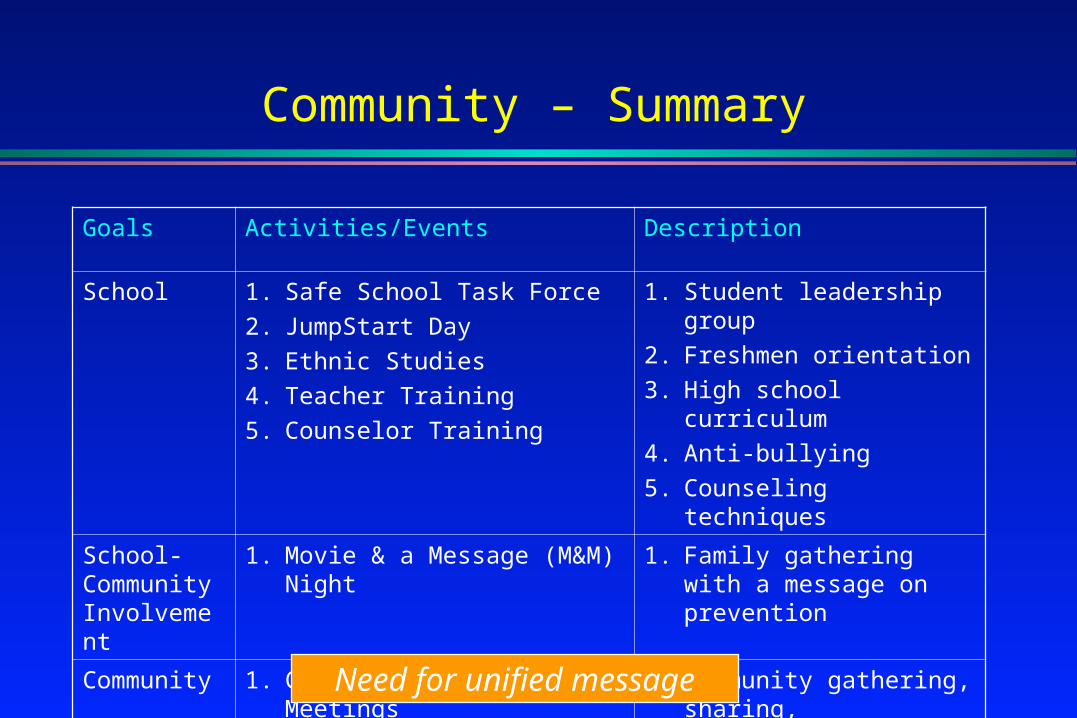
Community – Summary
Goals Activities/Events Description
School 1. Safe School Task Force
2. JumpStart Day
3. Ethnic Studies
4. Teacher Training
5. Counselor Training
1. Student leadership group
2. Freshmen orientation
3. High school curriculum
4. Anti-bullying
5. Counseling techniques
School-Community Involvement
1. Movie & a Message (M&M) Night
1. Family gathering with a message on prevention
Community 1. Community Work Group Meetings
1. Community gathering, sharing, collaboration, training, projects
Need for unified message
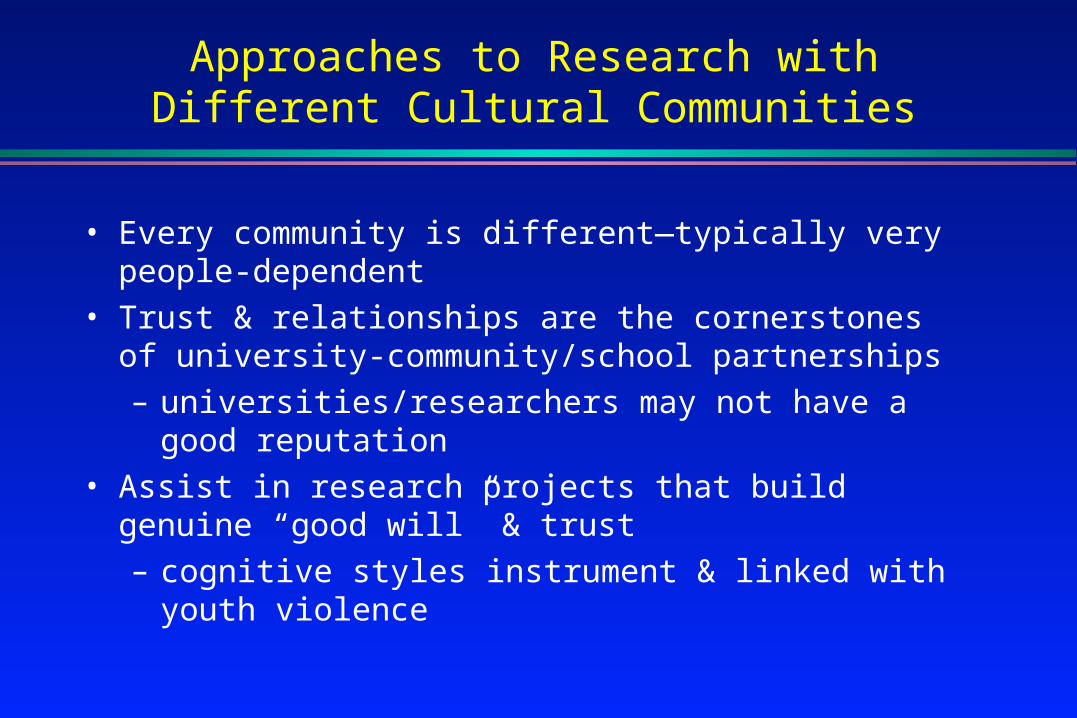
Approaches to Research with Different Cultural Communities
• Every community is different—typically very people-dependent
• Trust & relationships are the cornerstones of university-community/school partnerships– universities/researchers may not have a good reputation
• Assist in research projects that build genuine “good will” & trust– cognitive styles instrument & linked with youth violence
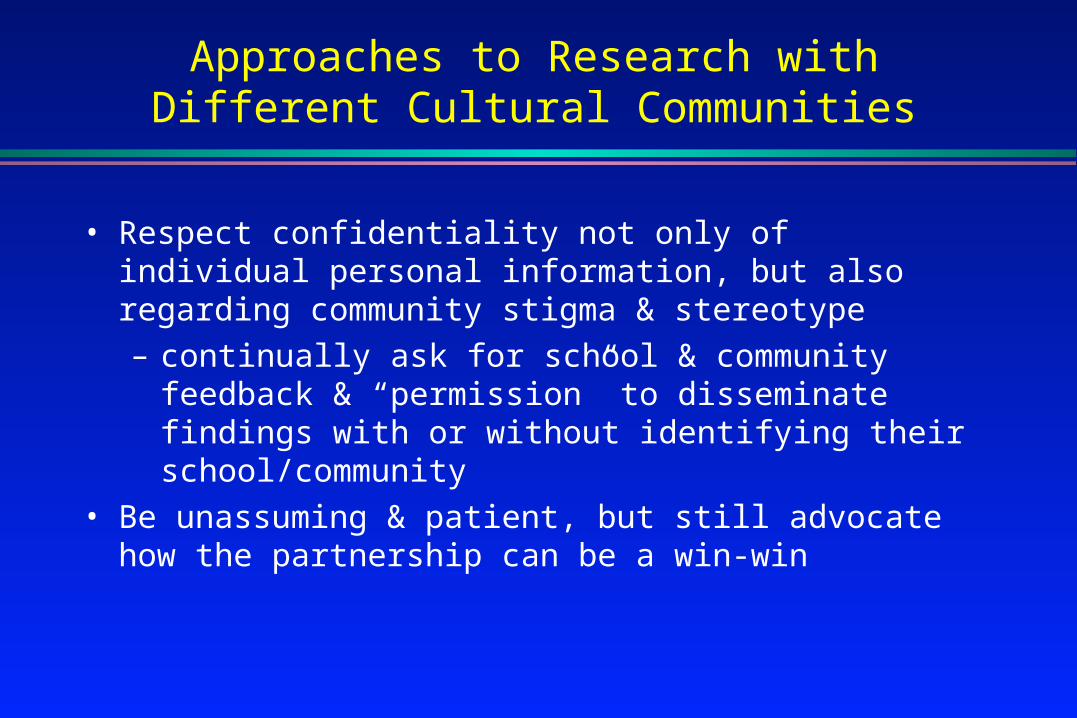
Approaches to Research with Different Cultural Communities
• Respect confidentiality not only of individual personal information, but also regarding community stigma & stereotype– continually ask for school & community feedback &
“permission” to disseminate findings with or without identifying their school/community
• Be unassuming & patient, but still advocate how the partnership can be a win-win

Challenges to Program Design & Implementation
Epistemology (how knowledge is gained)– spiritual, subjective, personal, private
– empirical (data-driven), objective, public, repeatable
Potential Solutions:– respect different views; not all may be resolvable
– try & work within their framework
– conceptualize the empirical approach as supplemental rather than contradictory
– use mixed methods (i.e., qualitative & quantitative)
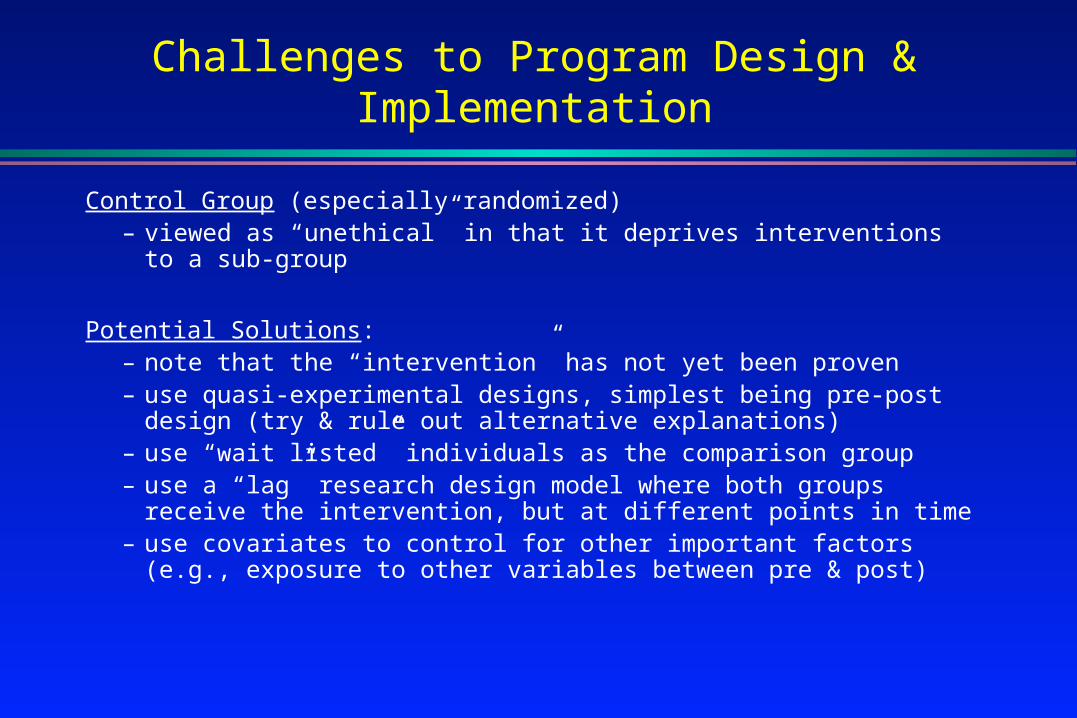
Challenges to Program Design & Implementation
Control Group (especially randomized)– viewed as “unethical” in that it deprives interventions to a sub-
group
Potential Solutions:– note that the “intervention” has not yet been proven– use quasi-experimental designs, simplest being pre-post design
(try & rule out alternative explanations)– use “wait listed” individuals as the comparison group– use a “lag” research design model where both groups receive the
intervention, but at different points in time– use covariates to control for other important factors (e.g.,
exposure to other variables between pre & post)
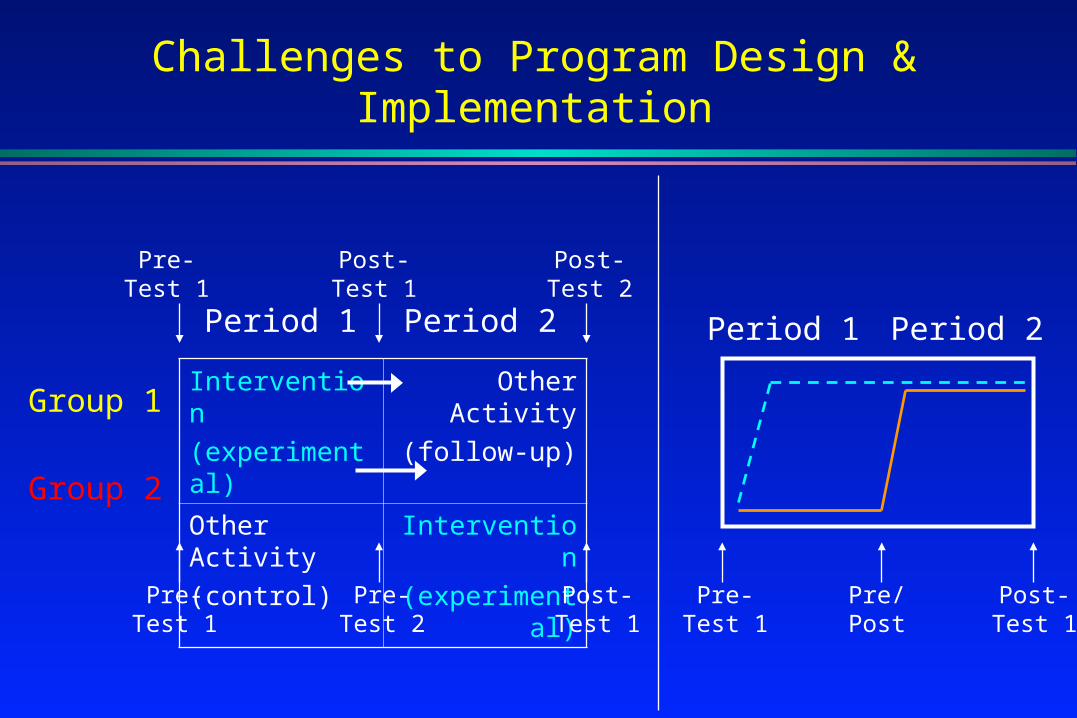
Challenges to Program Design & Implementation
Intervention
(experimental)
Other Activity
(follow-up)
Other Activity
(control)
Intervention
(experimental)
Pre-Test 1
Post-Test 1
Post-Test 2
Pre-Test 1
Pre-Test 2
Post-Test 1
Group 2
Group 1
Period 1 Period 2
Pre-Test 1
Pre/Post
Post-Test 1
Period 1 Period 2
Challenges to Program Design & Implementation
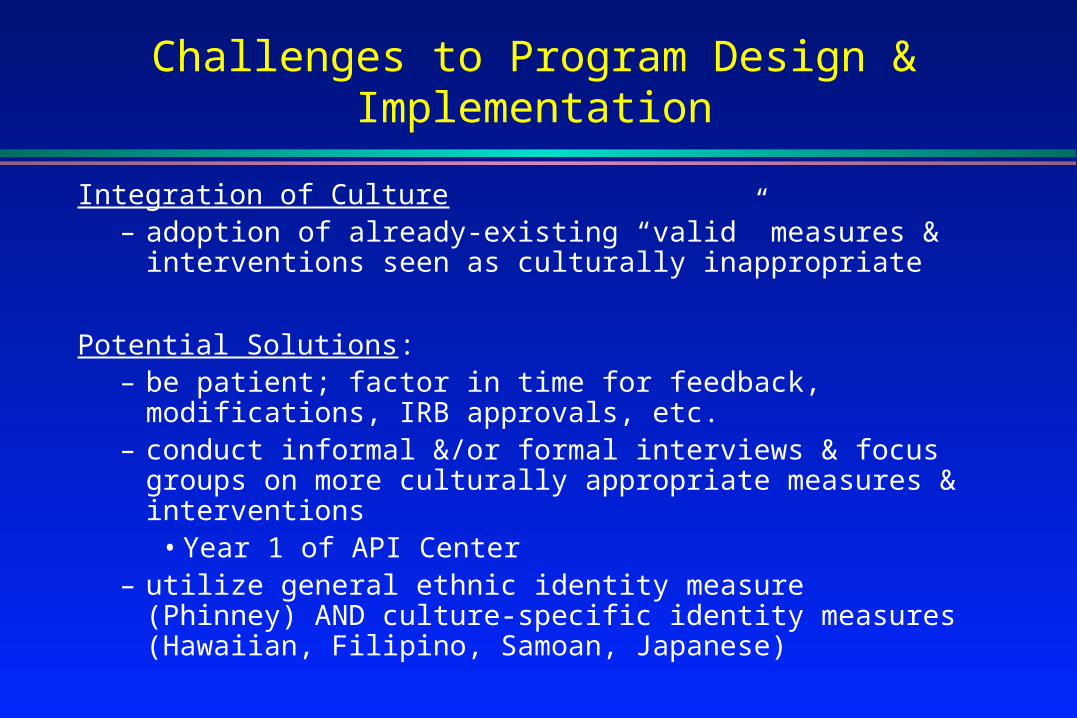
Integration of Culture– adoption of already-existing “valid” measures & interventions
seen as culturally inappropriate
Potential Solutions:– be patient; factor in time for feedback, modifications, IRB
approvals, etc.– conduct informal &/or formal interviews & focus groups on
more culturally appropriate measures & interventions• Year 1 of API Center
– utilize general ethnic identity measure (Phinney) AND culture-specific identity measures (Hawaiian, Filipino, Samoan, Japanese)
Thank You