Embed Size (px)
Citation preview

Norwalk Tank Farm Update
Presented to the Norwalk Tank FarmRestoration Advisory BoardFebruary 23, 2017

Agenda
Kinder Morgan Update– Remediation Systems Operations Summary– Biosparge Pilot Testing Update– Planned Remediation Activities
• SVE Demolition and New RTO Installation• Southeastern Area Biosparge Well
– Pipeline Relocation Activities Update

3
South-Central Area
Southeast Area
Intermediate 24-inch Block ValveDiesel Fuel
Release Area
Southeastern 24-inch Block Valve
Site Location and SFPP Remediation Areas
West SideBarrierSystem
LA Basin
Norwalk Site

Remediation Systems Operations Summary

Remediation System Operations Summary
SVE and Biosparge Systems– 3rd Quarter 2016
• Operated 87% of time (98% excluding planned shutdowns)– 4th Quarter 2016
• Operated 27% of time (95% excluding planned shutdowns)• Low uptime due to SVE demolition activities
TFE/GWE System– 3rd Quarter 2016
• Operated 25% of time (100% excluding planned shutdowns)• Low uptime due to installation of OWS/DAF system
– 4th Quarter 2016• Operated 57% of time (100% excluding planned shutdowns)• Low uptime due to SVE demolition activities

SVE System Operations Summary
Equivalent Fuel Treated - SVE– Based on weekly monitoring of influent vapor concentration, vapor extraction
flow rate, and hours of operation.– Pounds / 6.6 lbs/gal = gallons
– 3rd Quarter 2016 – 4,606 gallons (30,403 pounds)– 4th Quarter 2016 – 640 gallons (4,225 pounds)
• Low mass removal due to downtime from SVE demolition– Since 1995 – Approx. 526,800 gallons (3.47 million pounds)

SVE System Operations Summary

TFE/GWE System Operations Summary
Groundwater Extracted– 3rd Quarter 2016
• South-Central and Southeast Areas – 217,956 gallons• West Side Barrier – none (shutdown in third quarter 2008)
– 4th Quarter 2016• South-Central and Southeast Areas – 586,485 gallons• West Side Barrier – none (shutdown in third quarter 2008)
– Since 1995• South-Central and Southeast Areas– 71.7 million gallons • West Side Barrier – 26.9 million gallons

TFE/GWE System Operations Summary
Equivalent Fuel Treated – TFE/GWE– Based on monthly monitoring of influent TPH concentration and volume of
extracted groundwater.– Pounds / 6.6 lbs/gal = gallons
– 3rd Quarter 2016 – 1 gallon (7 pounds)– 4th Quarter 2016 – 7 gallons (44 pounds)– Lower mass removal due to downtime from OWS system install and
SVE demolition, and decreased TPH concentration in groundwater influent (due to biosparge activities)

TFE System Operations Summary
Free Product Extracted– 3rd Quarter 2016
• No free product observed to accumulate in the product holding tank – 4th Quarter 2016
• No free product observed to accumulate in the product holding tank• 4 gallons of product bailed from GMW-O-18
– Less product recovered due to decline in measurable product in extraction wells as a result of biosparge activities
– Since 1995 – 14,425 gallons product extracted

TFE/GWE System Operations Summary

Confirmation of Pipeline Integrity
Because of the apparent increase in product thickness in GMW-O-18 (~5 feet) the following activities were performed to confirm that a new fuel release had not occurred:– Pressure testing of active pipelines
• All pipelines passed the pressure tests (i.e., no pressure drop) and were put back online
– Laboratory analysis of product sample• Similar to previous analytical from GMW-36
– Bailed 4 gallons from GMW-O-18 and gauged nearby monitor wells for product• Product did not recover after 24 hrs; no product
observed in PZ-5, GMW-O-16, and GMW-O-19 Increase in measurable product a result of
dropping water levels and TFE downtime in this well due to presence of a stuck pump

Biosparge Pilot Test Update

Horizontal Well and SVP Layout and DesignWell Casing and Screen SCH 80 PVC 4-inch diameter well Open slot design (no sand pack
required); slot width 0.010 inches Screen depth of 45 feet bgs 250 feet of riser casing; 600 feet of
screen
Soil Vapor Monitoring Probe Network SVM-1 through SVM-16 Double or Triple Nested
(7, 15, 22 feet bgs)

Biosparge Compressor System
Kaiser 100 HP Rotary Screw Air Compressor(max rate of 494 scfm at 125 psi)
Air Compressor Manifold
Digital Display
Compressed Air Tank Enclosure (8 x 20’)

Objectives and Approach
Estimate Zone of Influence– In-Situ Trolls (DO and WLs)– SF6 Tracer Test
Evaluate VI Risk in Offsite Area– Weekly/Monthly PID Monitoring– Monthly Mobile Laboratory Analysis
• VOCs, TPH-gas, Fixed Gases
Evaluate Effectiveness of Mass Removal– Routine Gauging Events– Routine Lab Analysis for TPH, VOCs

In-Situ Troll and Manual Water Level Data
In-Situ Trolls installed in 6 wells- Good WL data recovery- Optical DO sensors unreliable
- Maximum WL rise of 13 feet occurred during 2nd day of ramp up at 120 scfm
- Maximum WL collapse of 4 feet after shutdowns
- WL rise generally declines with lateral distance from biosparge well

Tracer Study
Manifold
SF6 Tanks
• Waited ~4 weeks after ramping up from 0.1 scfm to 0.8 scfm flow
• Inject SF6 gas in biosparge well for 8 to 12 hours• Sample groundwater from select wells following
day for SF6 analysis• Collect dissolved oxygen and other field
parameters during sampling• Observe wells for “bubbling”
SF6 Tracer Test
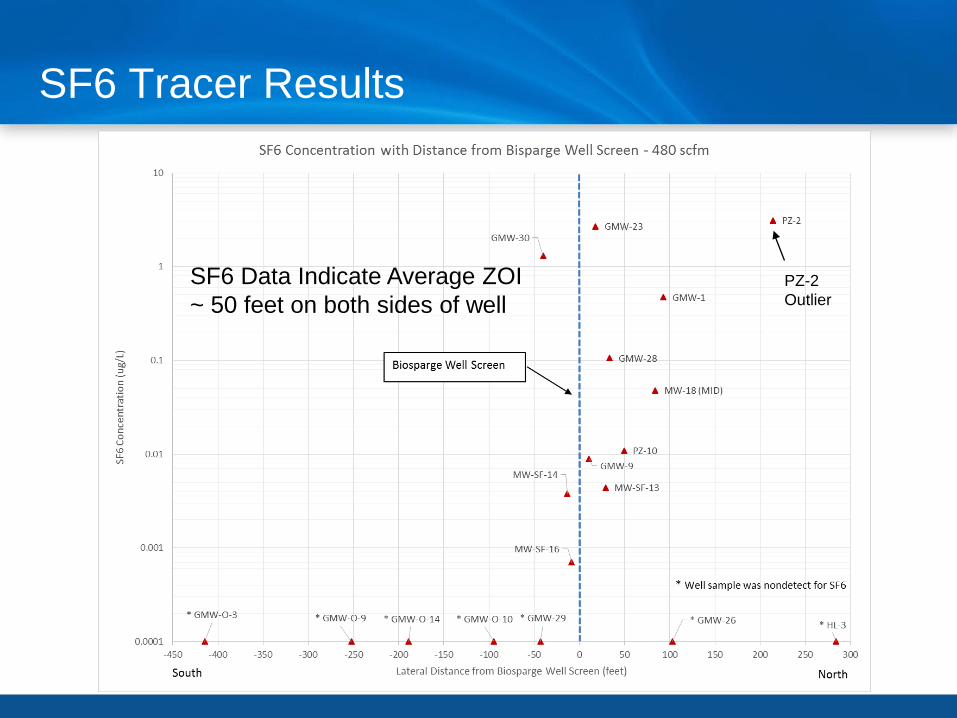
SF6 Tracer Results
SF6 Data Indicate Average ZOI ~ 50 feet on both sides of well
PZ-2Outlier

Field DO Results
DO Data Generally Consistent with SF6 Data Average ZOI ~ 50 feet on both sides of well

SF6 and Field DO Isoconcentrations

Soil Vapor Monitoring Using Field PID
All Probes
ShallowProbes
MiddleProbes
Deep Probes

Soil Vapor Probe Mobile Laboratory Results
Onsite and Offsite Probes Sampled in January, February, April, May, June, and August 2016 using Mobile Laboratory– Analyzed for VOCs, TPH-gas, and Fixed Gases
Offsite Probes– RSLs in shallow (5 foot) and middle (15 foot) probes were not exceeded– RSLs exceeded in February at one location in the deepest (22 foot) probe
depth; RSLs were not exceeded at this location subsequently Onsite Probes
– In January/February, RSLs exceeded in three probes at one or more discrete depths
– After February, VOCs and TPH-g nondetect in shallow and middle depths of all probes
– RSLs continue to be exceeded in deepest (22 foot) depth of SVM-14• SVM-14 is located within ~10 lateral feet of well screen• Deepest probe is just above smear zone so high VOCs not unexpected

Reduction in Free Product• Average reduction of 1 to 2 feet
in 21 wells with measurable product
• Of the 21 wells, a 100 percent reduction of product was observed in 16 wells
BS01

Wells with Reduction in TPH and VOCs
GMW-9
GMW-23
GMW-25
MW-SF-1
MW-SF-4
MW-SF-15
MW-SF-13
MW-SF-6GMW-O-23

Conclusions
Tracer Testing– Data supports ZOI of ~50 feet on both sides of well– DO and SF6 reported in well PZ-2, located 200 feet away
Soil Vapor Monitoring– Highest VOCs during first few months of operation – VI risk in shallow media highest in onsite area closest to the biosparge
well screen– Offsite VI risk is minimal assuming continued operation of the SVE
system Groundwater Monitoring
– Average reduction in product thickness of 1 to 2 feet– 100 percent reduction in 16 of 21 wells monitored– Significant reduction in dissolved-phase hydrocarbons for wells
primarily located within ~50 to 100 feet

Planned Remediation Activities

Old SVE Demolition
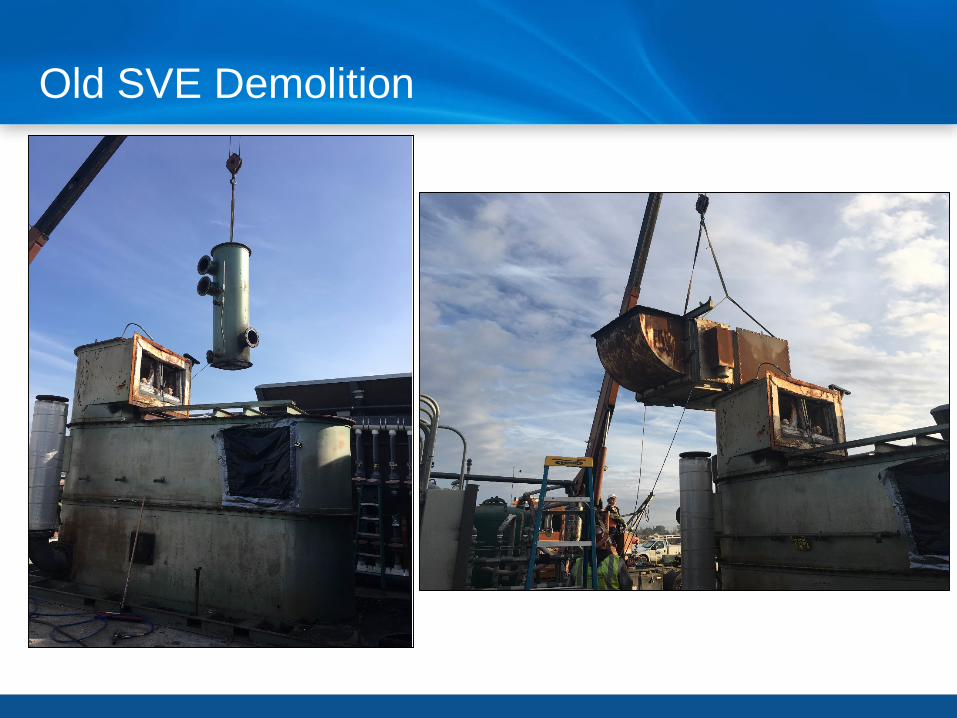
Old SVE Demolition

Old SVE Demolition

Old SVE Demolition

New RTO Unit

New RTO Unit

Biosparge Expansion Well
BS Expansion Well
Biosparge Expansion Well in Southeastern Area (Q3 or Q4 2017) SCH 80 PVC 4-inch diameter well Screen depth of 45 feet bgs; open slot design (no sand pack required) 400 feet of riser casing; 200 feet of screen

Pipeline Relocation Activities

Pipeline Relocation – 8/15/16

Pipeline Relocation – 2/20/17

Questions

Backup Dissolved Phase Summary

TPH-g Reduction
Table 9TPH-g Reduction in Select South-central Area WellsSFPP Norwalk Pump StationNorwalk, California
Baseline March-16 April-16 June-16 August-16 October-16
Well Type
Distance from BS Well Screen(feet) Date
TPH-g(mg/L)
TPH-g(mg/L)
Reduction(%)
TPH-g(mg/L)
Reduction(%)
TPH-g(mg/L)
Reduction(%)
TPH-g(mg/L)
Reduction(%)
TPH-g(mg/L)
Reduction(%)
MW-SF-4 SVE 8 01/15/13 13000 ns --- ns --- 540 -96% 50 -100% 250 -98%GMW-9 SVE/TFE 11 10/13/11 61000 ns --- ns --- ns --- 94 -100% 67 -100%GMW-23 MW 18 04/23/15 37000 540 -99% ns --- 120 -100% 59 -100% 130 -100%
MW-SF-15 SVE/TFE 25 10/14/11 35000 ns --- ns --- ns --- 300 -99% 250 -99%MW-SF-1 SVE 26 01/15/13 8500 ns --- ns --- 260 -97% 50 -99% 55 -99%
MW-SF-13 SVE/TFE 29 10/14/11 42000 ns --- ns --- ns --- 790 -98% 5300 -87%GMW-28 MW 33 10/26/15 280 520 Increase 600 Increase 230 -18% 88 -69% 25 -91%MW-SF-6 SVE/TFE 42 10/13/11 40000 ns --- ns --- ns --- 13000 -68% 8400 -79%
PZ-10 MW 49 10/26/15 340 ns --- 100 -71% ns --- ns --- ns ---GMW-O-23 SVE/TFE 76 10/19/12 29000 ns --- ns --- 17000 -41% 8700 -70% 2800 -90%
GMW-1 MW 93 10/23/15 110 25 -77% 55 -50% 25 -77% 25 -77% 57 -48%GMW-O-10 MW 94 10/26/15 160 91 -43% 910 Increase 87 -46% 25 -84% 25 -84%GMW-O-20 SVE/TFE 185 10/19/12 36000 ns --- ns --- 23000 -36% 13000 -64% 35000 -3%GMW-O-14 MW 189 10/26/15 24000 21000 -13% 3200 -87% 13000 -46% 6000 -75% 30000 Increase
PZ-2 MW 214 10/27/15 210 1200 Increase 2300 Increase 790 Increase 590 Increase 410 IncreaseAverage TPH-g Reduction --- -58% --- -69% --- -62% --- -85% --- -82%
Benzene Reduction
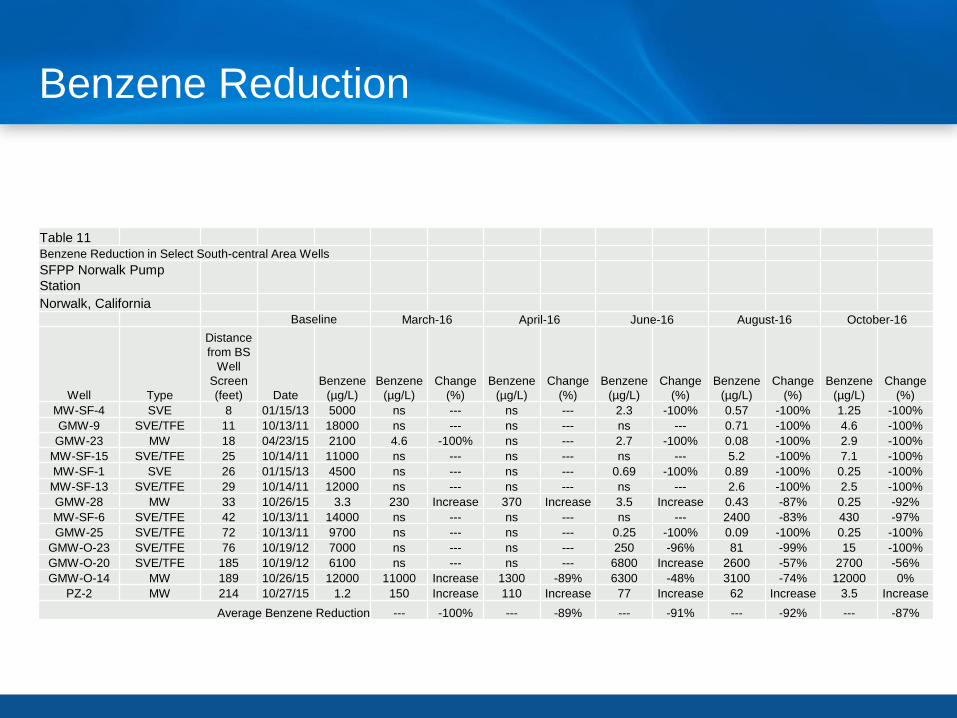
Table 11Benzene Reduction in Select South-central Area WellsSFPP Norwalk Pump StationNorwalk, California
Baseline March-16 April-16 June-16 August-16 October-16
Well Type
Distance from BS
Well Screen(feet) Date
Benzene(µg/L)
Benzene(µg/L)
Change(%)
Benzene(µg/L)
Change(%)
Benzene(µg/L)
Change(%)
Benzene(µg/L)
Change(%)
Benzene(µg/L)
Change(%)
MW-SF-4 SVE 8 01/15/13 5000 ns --- ns --- 2.3 -100% 0.57 -100% 1.25 -100%GMW-9 SVE/TFE 11 10/13/11 18000 ns --- ns --- ns --- 0.71 -100% 4.6 -100%
GMW-23 MW 18 04/23/15 2100 4.6 -100% ns --- 2.7 -100% 0.08 -100% 2.9 -100%MW-SF-15 SVE/TFE 25 10/14/11 11000 ns --- ns --- ns --- 5.2 -100% 7.1 -100%MW-SF-1 SVE 26 01/15/13 4500 ns --- ns --- 0.69 -100% 0.89 -100% 0.25 -100%MW-SF-13 SVE/TFE 29 10/14/11 12000 ns --- ns --- ns --- 2.6 -100% 2.5 -100%GMW-28 MW 33 10/26/15 3.3 230 Increase 370 Increase 3.5 Increase 0.43 -87% 0.25 -92%MW-SF-6 SVE/TFE 42 10/13/11 14000 ns --- ns --- ns --- 2400 -83% 430 -97%GMW-25 SVE/TFE 72 10/13/11 9700 ns --- ns --- 0.25 -100% 0.09 -100% 0.25 -100%
GMW-O-23 SVE/TFE 76 10/19/12 7000 ns --- ns --- 250 -96% 81 -99% 15 -100%GMW-O-20 SVE/TFE 185 10/19/12 6100 ns --- ns --- 6800 Increase 2600 -57% 2700 -56%GMW-O-14 MW 189 10/26/15 12000 11000 Increase 1300 -89% 6300 -48% 3100 -74% 12000 0%
PZ-2 MW 214 10/27/15 1.2 150 Increase 110 Increase 77 Increase 62 Increase 3.5 IncreaseAverage Benzene Reduction --- -100% --- -89% --- -91% --- -92% --- -87%