Embed Size (px)
Citation preview
Presented by Kathleen E. Pavelka, CFRE, President
Telecomp, Inc.
ADVANCED ANNUAL GIVING TECHNIQUES:Taking Your Program to the Next Level

Formula for Success
There are only TWO ways to Increase your Success:
#1 Increase the number of people giving
#2 Increase the average level of support
Do BOTH
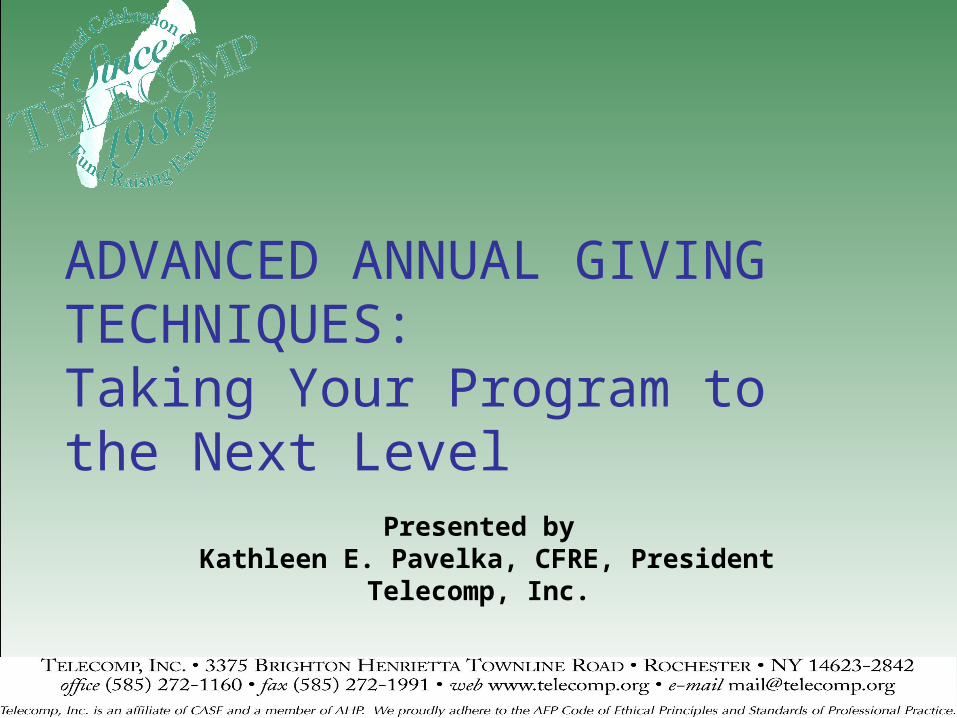
Your Foundation for Success
Major Gift Donors
Leadership Donors
Repeat Annual Donors
First-time Annual Donors

#1 Increase the Number of Donors
Ask More Expand your solicitation pool
(Ask More People) Increase the number of times you ask
(Ask More Often)
Ask Smarter Increase response rates (A Higher Percentage of your prospects
become donors)
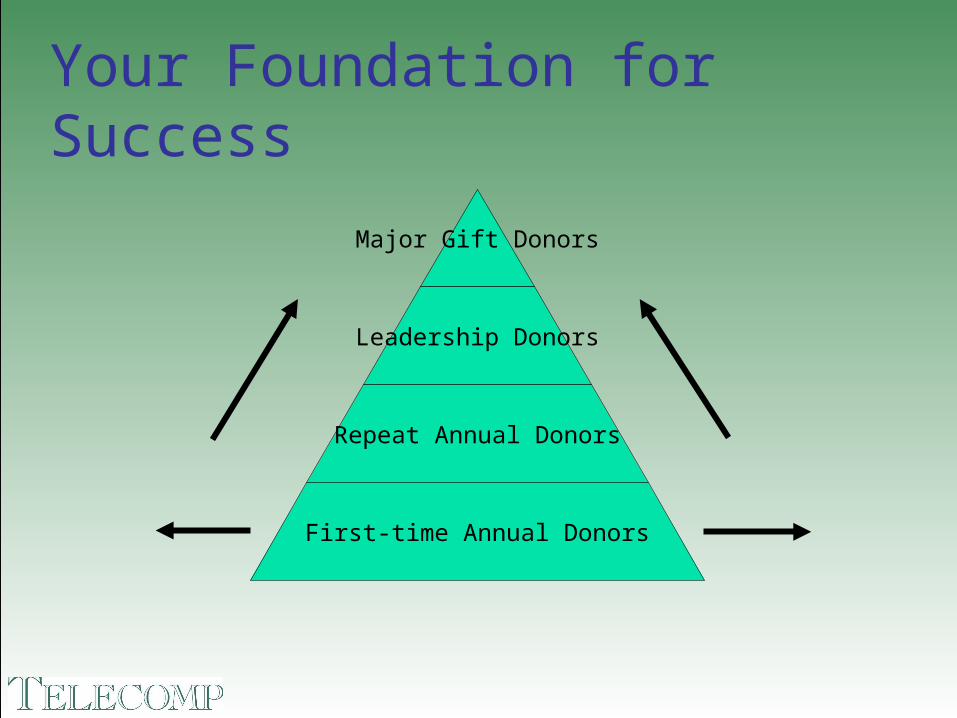
#2 Increase the Average Gift
Ask More Increase your Expectations
(Ask people to give more) Ask Smarter
Determine most capable and willing donors(Ask the right people)
Method(Ask the right way)

Embrace the Power of Math
You are smarter than a 5th Grader There is no test at the end This isn’t Rocket Science Numbers tell a story – get into your
comfort zone

The Power of Math
Client A
9,305 Donors
$114 Average Gift
Increase Average Gift by $10 = $93,050
(8.7% increase)
Client B 6,406 Donors
$226 Average Gift 75,000 Patients Increase Response Rate
by ½ point = 75,000 x .005 = 375 new donors x
$226 = $84,750 (5.9% increase)
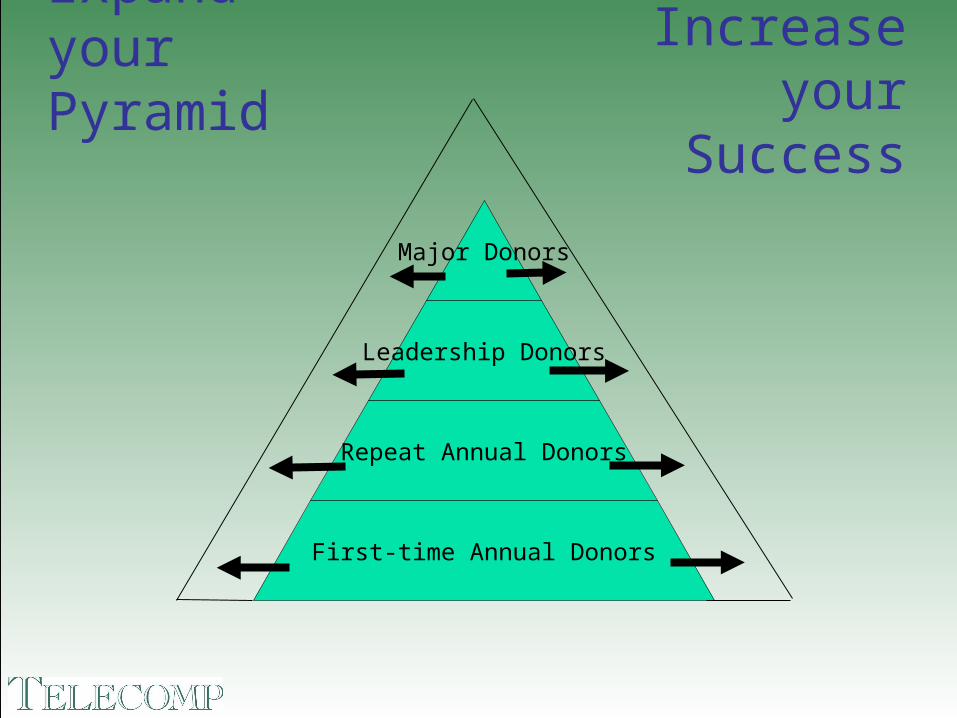
Expand yourPyramid
Major Donors
Leadership Donors
Repeat Annual Donors
First-time Annual Donors
Increase your
Success
Know what it is
or . . .
. . . You’ll spend a lot of time running in place
#1 Increase the Number of Donors Maximize Renewal Rate

#1 Increase the Number of Donors Maximize Renewal Rate
How to calculate Number of Prior Year Donors = 1,000
Number of Prior Year Donors who also have
made a gift in the current year = 600
Renewal Rate = 60% (600/1,000)
Benchmark Renewal Rate = 70% - 85%**Depending on type of institution
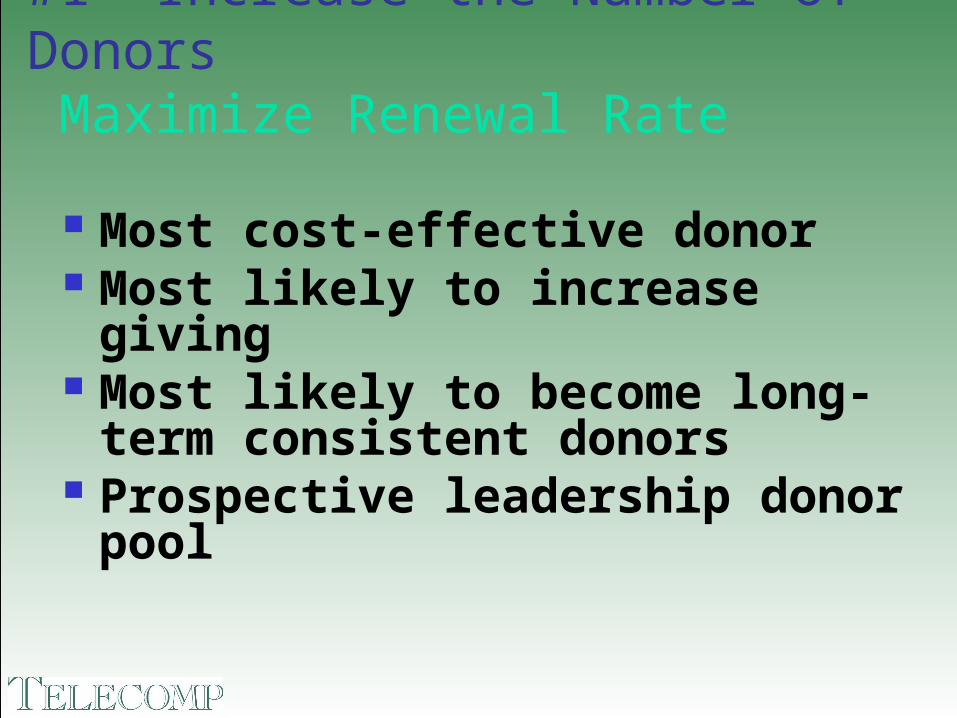
#1 Increase the Number of Donors Maximize Renewal Rate
Most cost-effective donor Most likely to increase giving Most likely to become long-term consistent
donors Prospective leadership donor pool

#1 Increase the Number of DonorsSegmentation Relationship to Institution/Organization
Group prospect/donors based on their relationship to you
Establish hierarchy and dual relationships Unique Case for Support
Segment should require a unique message Unique Objective
Segment should have a specific objective
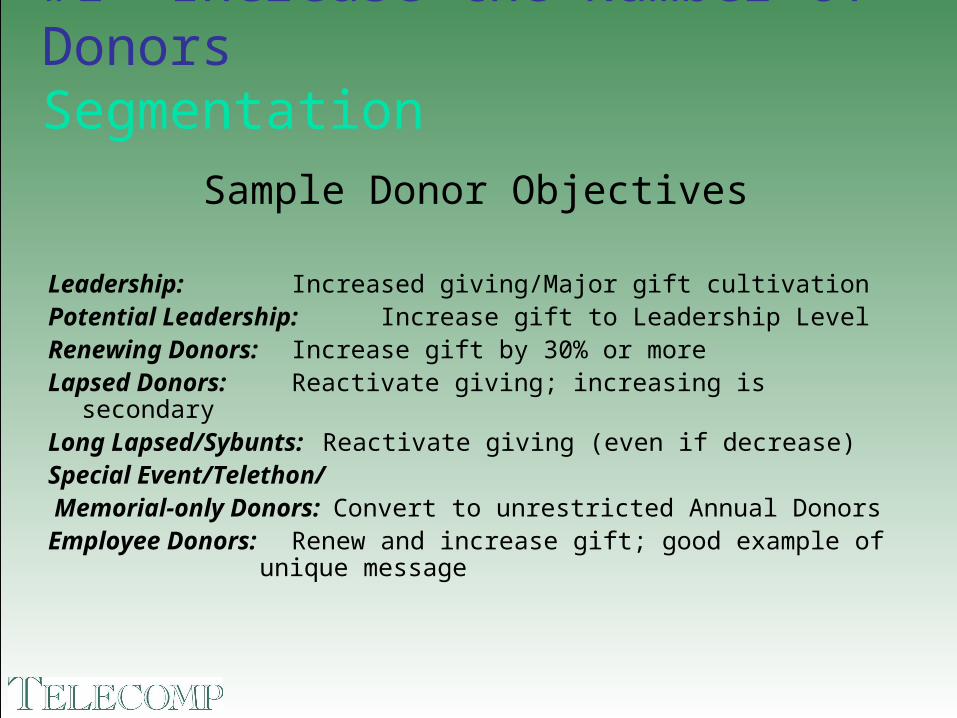
#1 Increase the Number of DonorsSegmentation
Sample Donor Objectives
Leadership: Increased giving/Major gift cultivation
Potential Leadership: Increase gift to Leadership LevelRenewing Donors: Increase gift by 30% or moreLapsed Donors: Reactivate giving; increasing is
secondaryLong Lapsed/Sybunts: Reactivate giving (even if decrease)Special Event/Telethon/ Memorial-only Donors: Convert to unrestricted Annual
DonorsEmployee Donors: Renew and increase gift; good
example of unique message
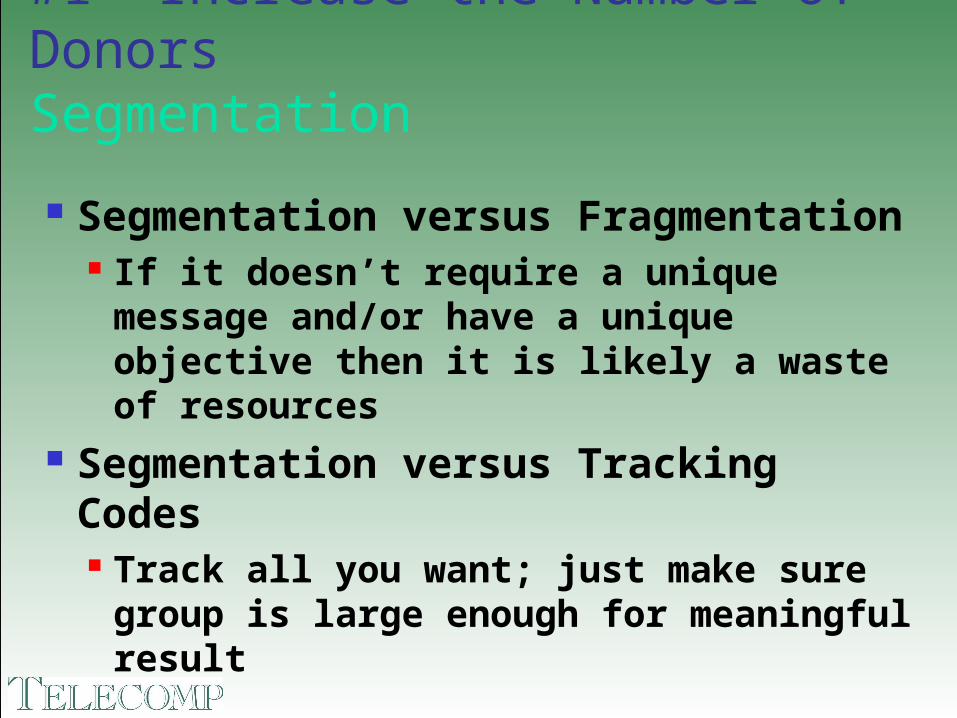
#1 Increase the Number of DonorsSegmentation
Segmentation versus Fragmentation If it doesn’t require a unique message and/or
have a unique objective then it is likely a waste of resources
Segmentation versus Tracking Codes Track all you want; just make sure group is
large enough for meaningful result
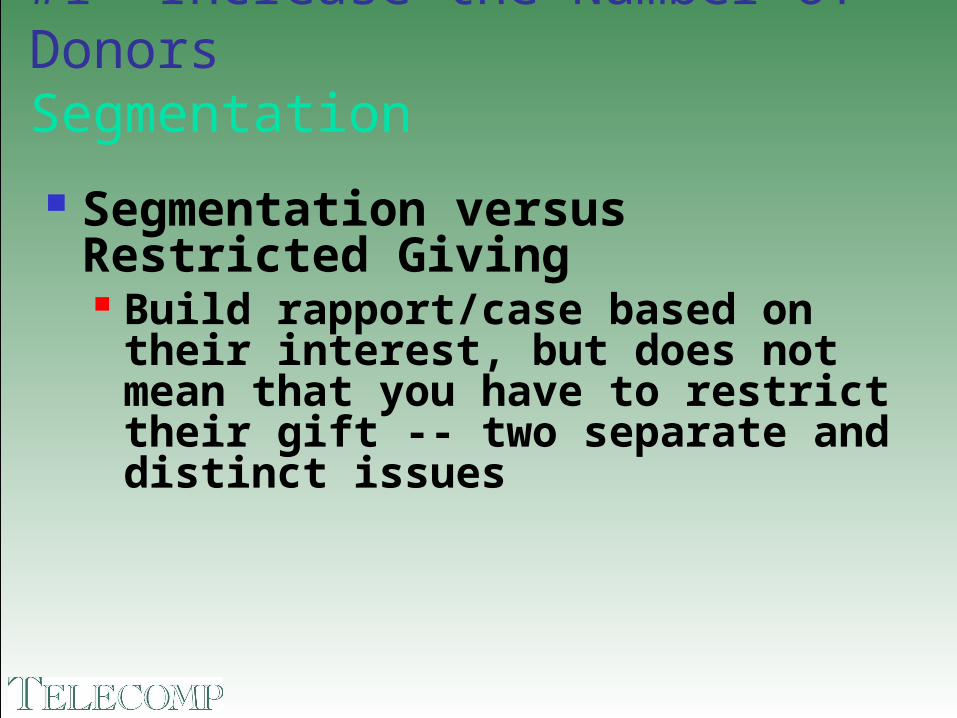
#1 Increase the Number of DonorsSegmentation
Segmentation versus Restricted Giving Build rapport/case based on their interest, but
does not mean that you have to restrict their gift -- two separate and distinct issues

#1 Increase the Number of Donors Solicitation Opportunities
Must provide multiple opportunities to give throughout the year
Solicit as long as each successive effort is cost effective In direct mail, expect the successive effort to cut in half Suggested Opportunities per year:Leadership: 3-5 Long-Lapsed/Non-Donors: 1-2 Potential Leadership: 5-8 Second Gift Appeal: 1-2Renewals: 5-8 Lapsed Donors: 3-5
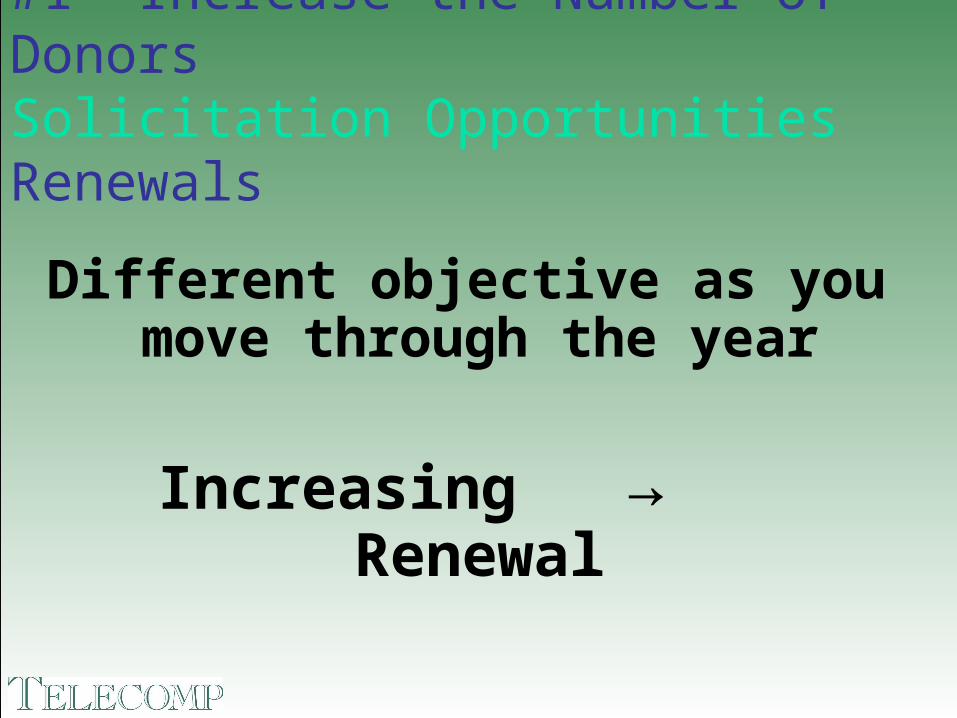
#1 Increase the Number of Donors Solicitation OpportunitiesRenewals
Different objective as you move through the year
Increasing → Renewal
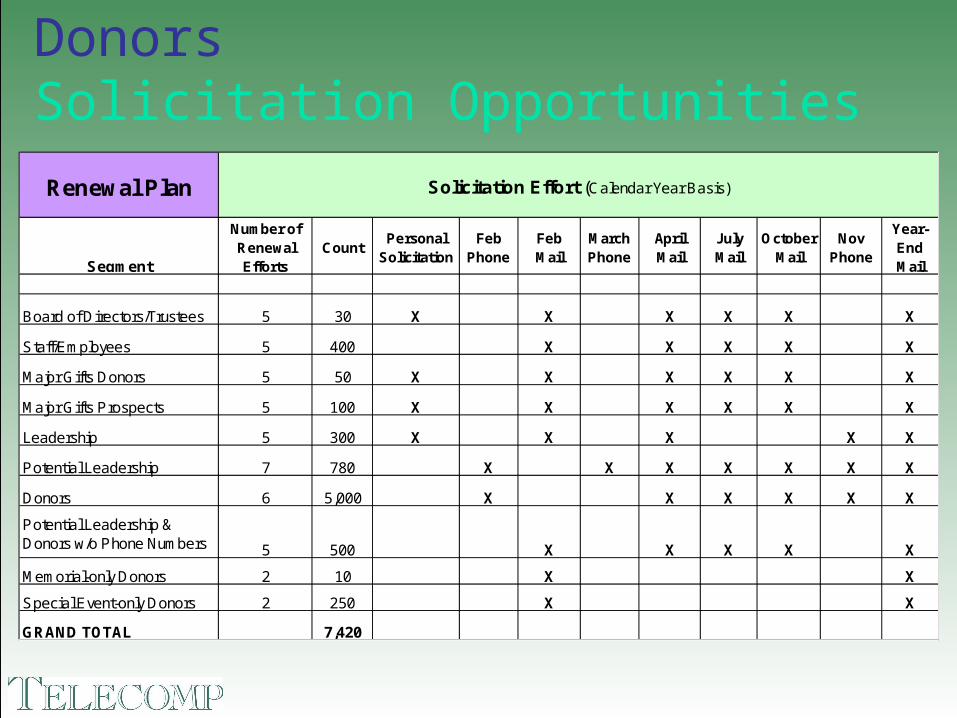
#1 Increase the Number of Donors Solicitation Opportunities
Renewal Plan
Segment
Number of Renewal Efforts
CountPersonal
SolicitationFeb
PhoneFeb Mail
March Phone
April Mail
July Mail
October Mail
Nov Phone
Year-End Mail
Board of Directors/Trustees 5 30 X X X X X X
Staff/Employees 5 400 X X X X X
Major Gifts Donors 5 50 X X X X X X
Major Gifts Prospects 5 100 X X X X X X
Leadership 5 300 X X X X X
Potential Leadership 7 780 X X X X X X X
Donors 6 5,000 X X X X X X
Potential Leadership & Donors w/o Phone Numbers 5 500 X X X X X
Memorial-only Donors 2 10 X X
Special Event-only Donors 2 250 X X
GRAND TOTAL 7,420
Solicitation Effort (Calendar Year Basis)
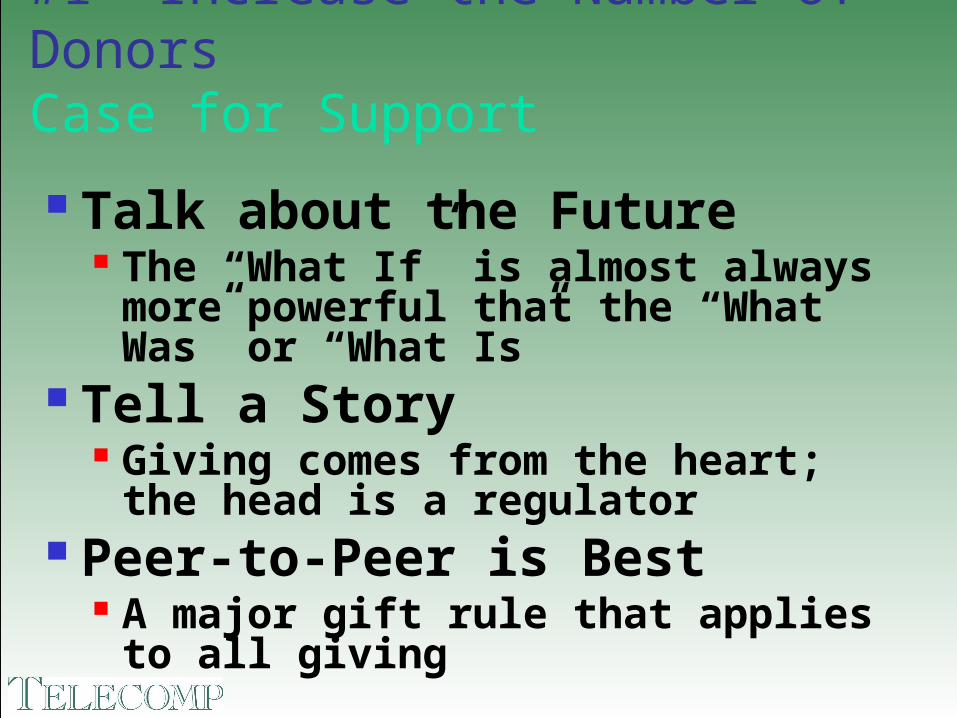
#1 Increase the Number of DonorsCase for Support
Talk about the Future The “What If” is almost always more powerful
that the “What Was” or “What Is” Tell a Story
Giving comes from the heart; the head is a regulator
Peer-to-Peer is Best A major gift rule that applies to all giving

#1 Increase the Number of DonorsCase for Support
Focus on the Donor What is important to him/her?
Impact of Gift Not what the money will buy; what it
will mean Vary the Case for Support
People give for different reasons

#2 Increasing the Average GiftObjective for Renewals
Increase giving from renewing donors to equal the “loss” from those who
do not renew

#2 Increasing the Average Gift Objective Illustration
Number Average
of Donors Gift Income Gift
Prior Year Results 1,000 $100,000 $100
Average Gift needed to generate the same $100,000 gift income at different Renewal Rates:
@ 70% 700 $143 @ 65% 650 $154 @ 60% 600 $167

#2 Increasing the Average GiftCreate New Leadership Donors
Establish a “Chair” of your leadership society for communication purposes
Benefits that reinforce your case for giving On-campus activities AFP Leadership Society – great example Leadership Emails
Target mid-range donors and ask for a leadership gift ONLY

#2 Increasing the Average GiftCreate New Leadership Donors
Treat them like a leadership donor Communications, invitations, etc.
Quality solicitation materials Must match to the significance of the gift
Be specific – ask for a specific amount

#1 Increase the Average GiftCreating Leadership Donors Invitation-Style Leadership Package

Gannon University Targeted Leadership Solicitation
Method: Telephone Outreach Pledge RateAverage Pledge
Percent Increase
Targeted Solicitation for $1,000+ giftCalling period ended 12/15
9% $1,681 232%
Renewal Solicitation to remaining groupCalling period began 12/22
53% $321

Rochester Philharmonic Orchestra Targeted Leadership Solicitation
Method: Telephone Outreach Pledge RateAverage Pledge
Percent Increase
Targeted Solicitation for $600+ giftCalling period ended 12/11
7.7% $696 46%
Renewal Solicitation to remaining groupCalling period began 12/12
53% $354
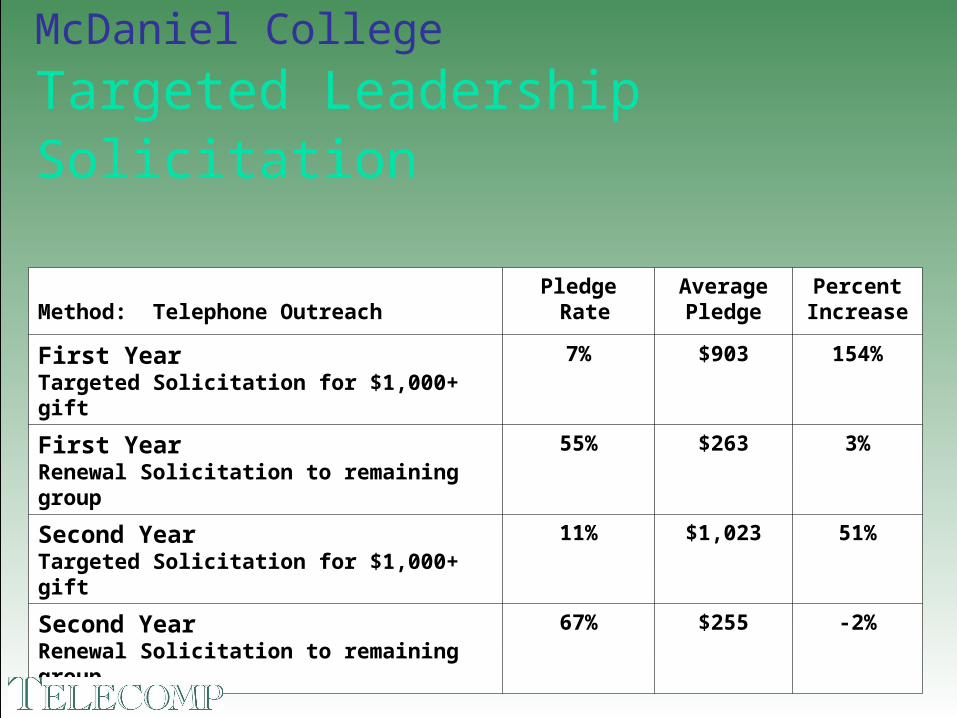
McDaniel College Targeted Leadership Solicitation
Method: Telephone OutreachPledge Rate
Average Pledge
Percent Increase
First YearTargeted Solicitation for $1,000+ gift
7% $903 154%
First YearRenewal Solicitation to remaining group
55% $263 3%
Second YearTargeted Solicitation for $1,000+ gift
11% $1,023 51%
Second YearRenewal Solicitation to remaining group
67% $255 -2%

#1 Increase the Average GiftCreating Leadership DonorsLeadership Lead Letter Series: Letter #1

#1 Increase the Average GiftCreating Leadership Donors Leadership Lead Letter Series: Brochure

#1 Increase the Average GiftCreating Leadership DonorsLeadership Lead Letter Series: Letter #2

New York Presbyterian Hospital Targeted Leadership Solicitation
Method: Telephone Outreach
Pledge Rate
Average Pledge
Percent Increase
First YearDonors $250 - $999
56% $487 34%
Second YearDonors $250 - $999
46% $506 42%

Method: Telephone Outreach
Number of
Pledges
Number of $1,000+ Pledges
Percent of New $1,000+
Pledges
First YearDonors $250 - $999
112 21 19%
Second YearDonors $250 - $999
70 18 26%
New York Presbyterian Hospital
Targeted Leadership Solicitation
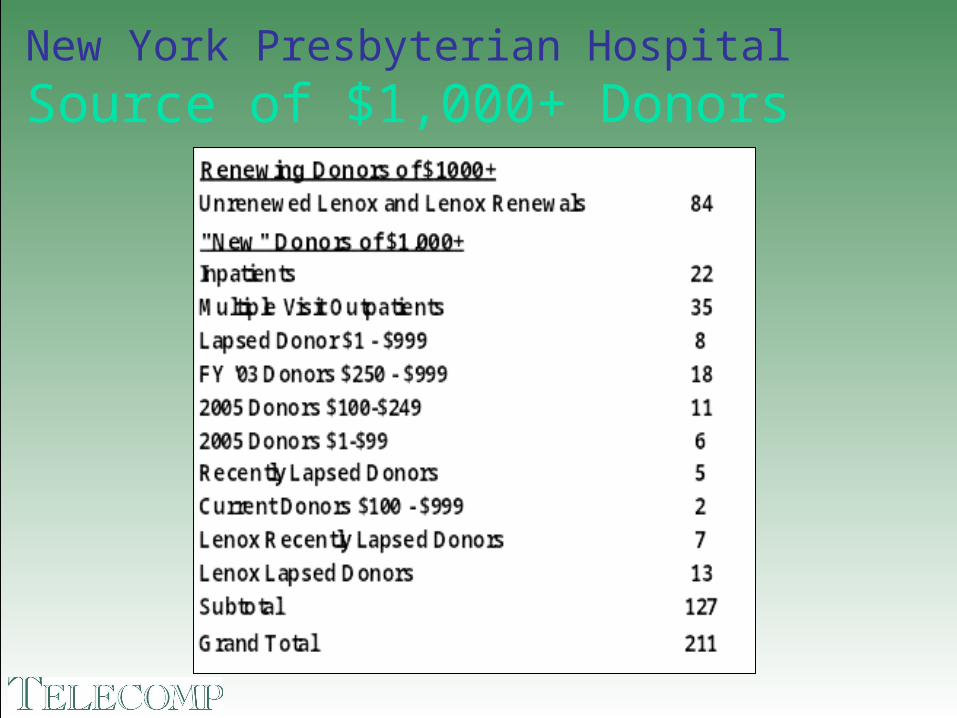
New York Presbyterian Hospital
Source of $1,000+ Donors
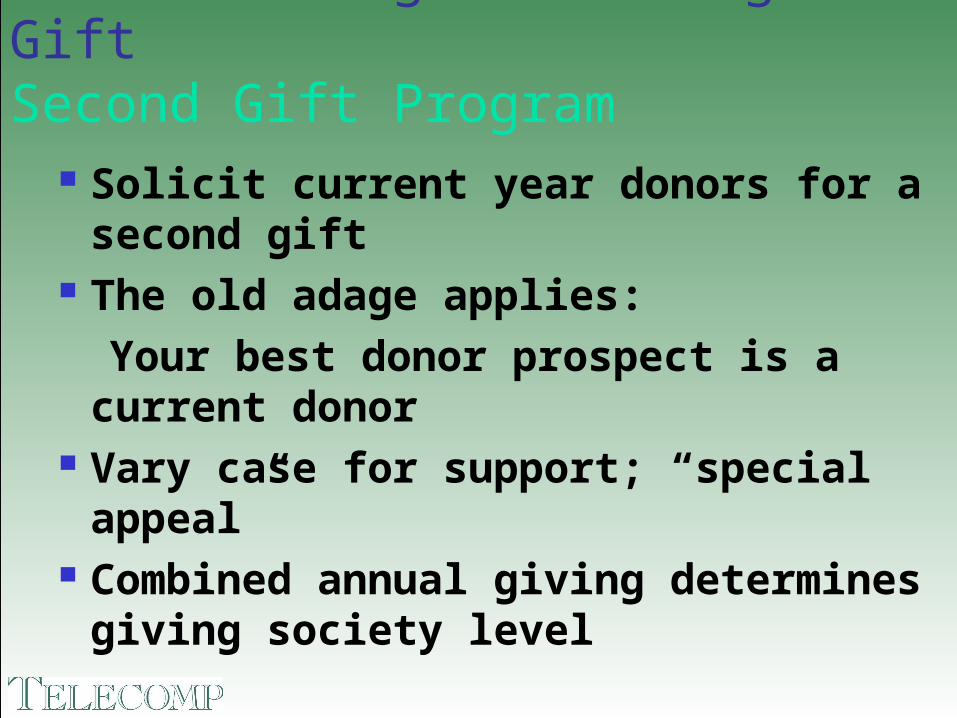
#2 Increasing the Average GiftSecond Gift Program
Solicit current year donors for a second gift The old adage applies:
Your best donor prospect is a current donor Vary case for support; “special appeal” Combined annual giving determines giving
society level

#2 Increasing the Average GiftSecond Gift Program
Segment Pledge
Rate Average Pledge
Income per Solicitation
New York Presbyterian Hospital
Current Donors $1-$99
25% $52 $13
Current Donors $100-$249
46% $115 $53
Current Donors $250-$999
37% $270 $99
Current Donors $1,000+
51% $1,046 $535
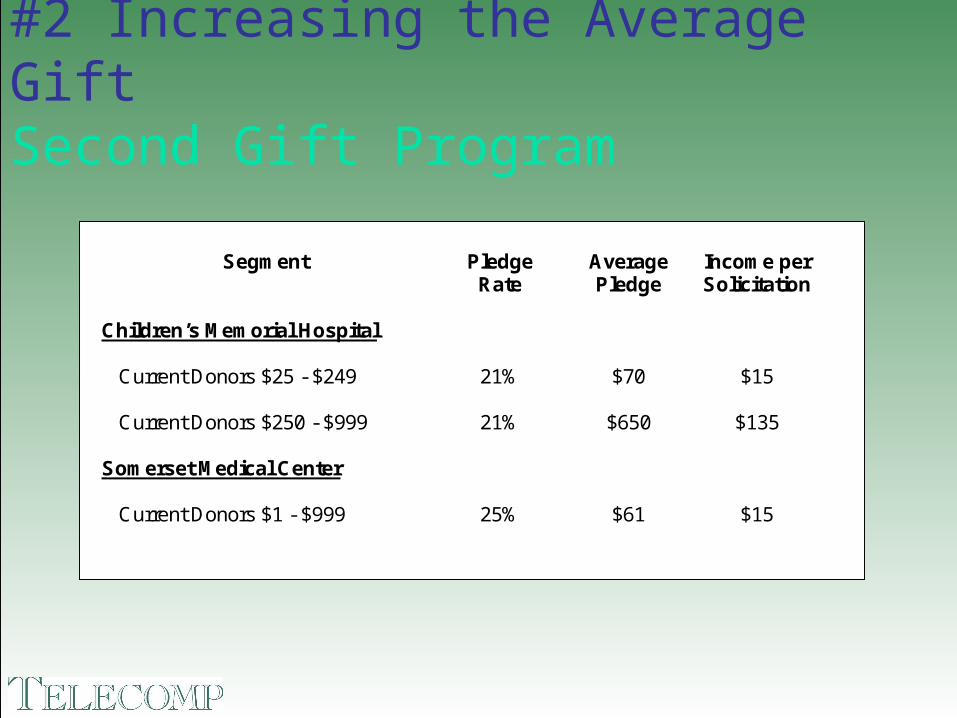
#2 Increasing the Average GiftSecond Gift Program
Segment Pledge
Rate Average Pledge
Income per Solicitation
Children’s Memorial Hospital
Current Donors $25 - $249
21% $70 $15
Current Donors $250 - $999
21% $650 $135
Somerset Medical Center
Current Donors $1 - $999
25% $61 $15

#1 Increase the Number of DonorsAcquisition
Investing in new donors to generate a future return

#1 Increase the Number of DonorsAcquisition
Set reasonable to high expectations for giving
New low-end donors generally
DO NOT serve your organization

Children’s Memorial HospitalResults by Donor Giving Level
Segment Pledge Rate
Average Pledge
Income per Solicitation
FY ’05 Donors <$25 20% $25 $5 $25-$49 29% $44 $13 $50-$99 28% $67 $18 $100+
31% $127 $40
Recently Lapsed Donors <$25 6% $26 $1 $25-$49 14% $43 $6 $50-$99 14% $64 $9 $100+
18% $121 $22

Acquisition
Minimizing your loss and achieving your goal as effectively as possible
RESULTS
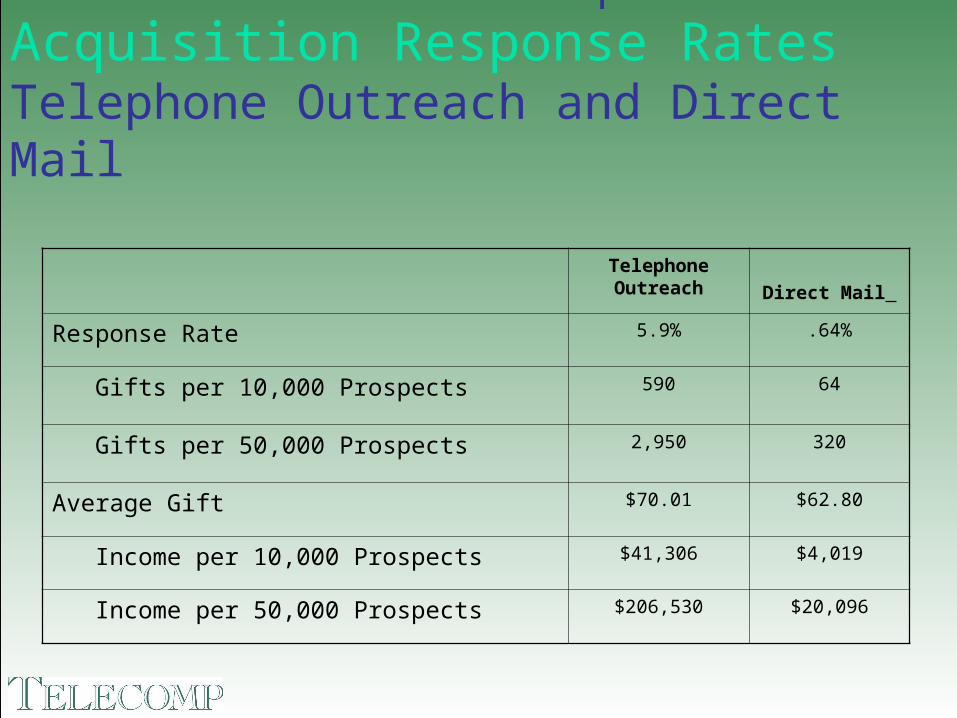
Children’s Memorial Hospital
Acquisition Response RatesTelephone Outreach and Direct Mail
Telephone Outreach Direct Mail
Response Rate 5.9% .64%
Gifts per 10,000 Prospects 590 64
Gifts per 50,000 Prospects 2,950 320
Average Gift $70.01 $62.80
Income per 10,000 Prospects $41,306 $4,019
Income per 50,000 Prospects $206,530 $20,096

Children’s Memorial Hospital
Cost of AcquisitionTelephone Outreach and Direct Mail
Telephone Outreach Direct Mail
Year 1 Loss per New Donor $16.74 $13.88
Year 2 Renewal Response Rate 39% 22%
Year 2 Average Gift $95.36 $67.64
Year 2 Net Income per Donor $72.21 $44.49
Year 1 & 2 Cumulative Net Income per Donor
$55.47 $30.61
Cumulative Net Income per 10,000 Prospects
$12,763 $431
Cumulative Net Income per 50,000 Prospects
$63,818 $2,155

New York Presbyterian HospitalComparative Results of Rated Prospects in an Acquisition Effort
Segment Contact
Rate Pledge
Rate Average Pledge
Income per Solicitation
Lenox Inpatients Wealth Screen
64% 17% $188 $33
General Inpatients Lenox Series
51% 16% $178 $24
General Inpatients Standard
57% 17% $131 $22
Lenox Outpatients Wealth Screen
51% 8% $188 $14
General Outpatients Standard
51% 13% $92 $12
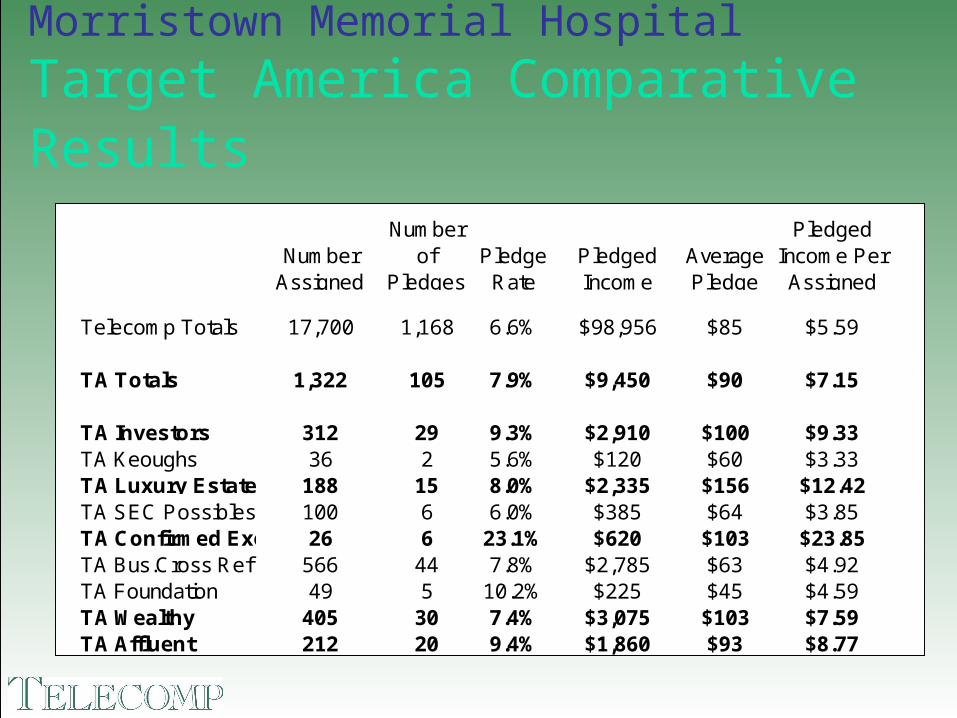
Morristown Memorial Hospital
Target America Comparative Results
Number Assigned
Number of
PledgesPledge
RatePledged Income
Average Pledge
Pledged Income Per Assigned
Telecomp Totals 17,700 1,168 6.6% $98,956 $85 $5.59
TA Totals 1,322 105 7.9% $9,450 $90 $7.15
TA Investors 312 29 9.3% $2,910 $100 $9.33TA Keoughs 36 2 5.6% $120 $60 $3.33TA Luxury Estates 188 15 8.0% $2,335 $156 $12.42TA SEC Possibles 100 6 6.0% $385 $64 $3.85TA Confirmed Executives26 6 23.1% $620 $103 $23.85TA Bus.Cross Ref 566 44 7.8% $2,785 $63 $4.92TA Foundation 49 5 10.2% $225 $45 $4.59TA Wealthy 405 30 7.4% $3,075 $103 $7.59TA Affluent 212 20 9.4% $1,860 $93 $8.77
MEASURE
EVERYTHING
After all, you must Know Your Math
MEASURE
EVERYTHING
After all, you must Know Your Math
Barriers to Getting It Done
Budget Restrictions Short-Staffed Management Approval Board Approval Philosophy IT
Show them The Power of Math

And take your institution to new heights!