Embed Size (px)
Citation preview
Global AirlinesPresented by:
Jenny KuanGabriel Li
Morris Tang
Industry Overview Southwest Airlines British Airways Singapore Airlines
Agenda
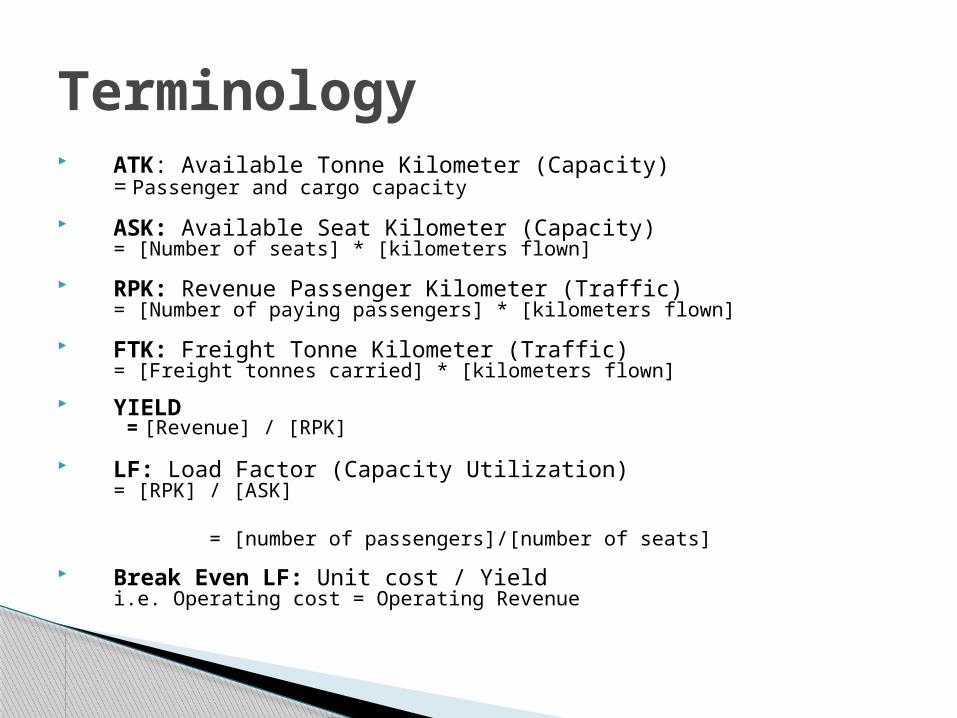
ATK: Available Tonne Kilometer (Capacity)= Passenger and cargo capacity
ASK: Available Seat Kilometer (Capacity) = [Number of seats] * [kilometers flown]
RPK: Revenue Passenger Kilometer (Traffic)= [Number of paying passengers] * [kilometers flown]
FTK: Freight Tonne Kilometer (Traffic)= [Freight tonnes carried] * [kilometers flown]
YIELD = [Revenue] / [RPK]
LF: Load Factor (Capacity Utilization)= [RPK] / [ASK]
= [number of passengers]/[number of seats]
Break Even LF: Unit cost / Yield i.e. Operating cost = Operating Revenue
Terminology
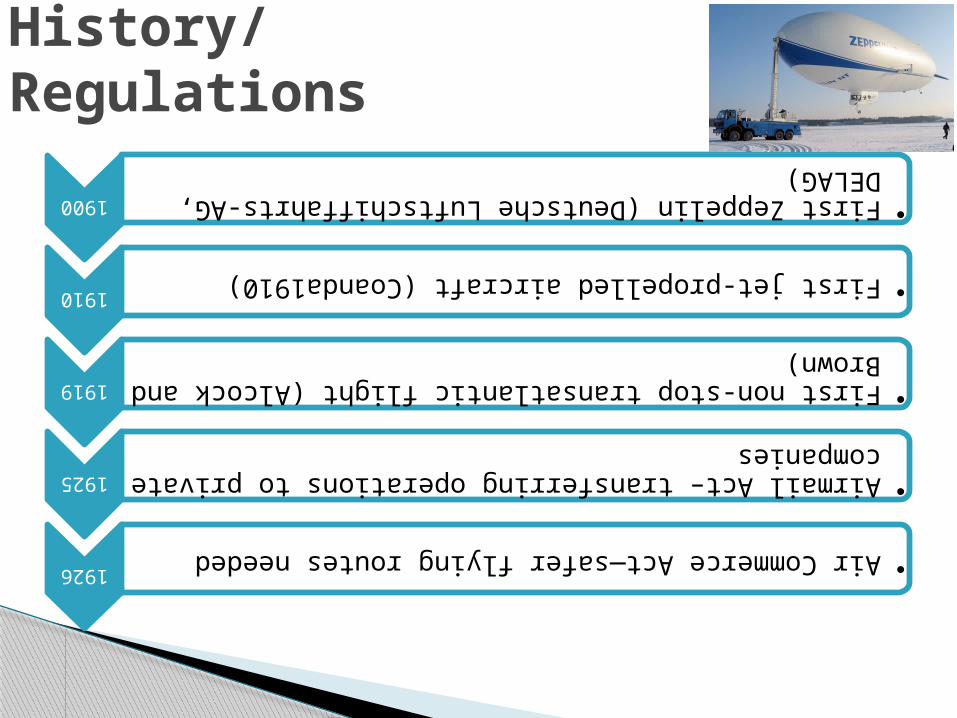
1900
•First Zeppelin (Deutsche Luftschiffahrts-AG, DELAG)
1910
•First jet-propelled aircraft (Coanda1910)
1919
•First non-stop transatlantic flight (Alcock and Brown)
1925
•Airmail Act– transferring operations to private companies
1926
•Air Commerce Act—safer flying routes needed
History/Regulations
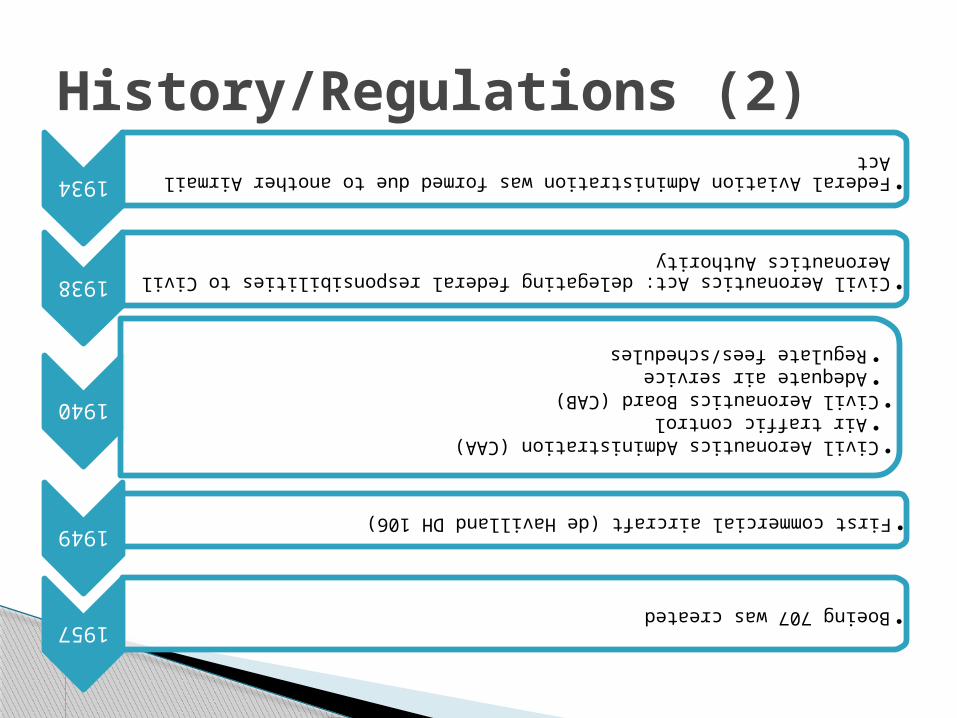
1934
•Federal Aviation Administration was formed due to another Airmail Act
1938
•Civil Aeronautics Act: delegating federal responsibilities to Civil Aeronautics Authority
1940
•Civil Aeronautics Administration (CAA)•Air traffic
control•Civil
Aeronautics Board (CAB)•Adequate air
service•Regulate
fees/schedules
1949
•First commercial aircraft (de Havilland DH 106)
1957
•Boeing 707 was created
History/Regulations (2)
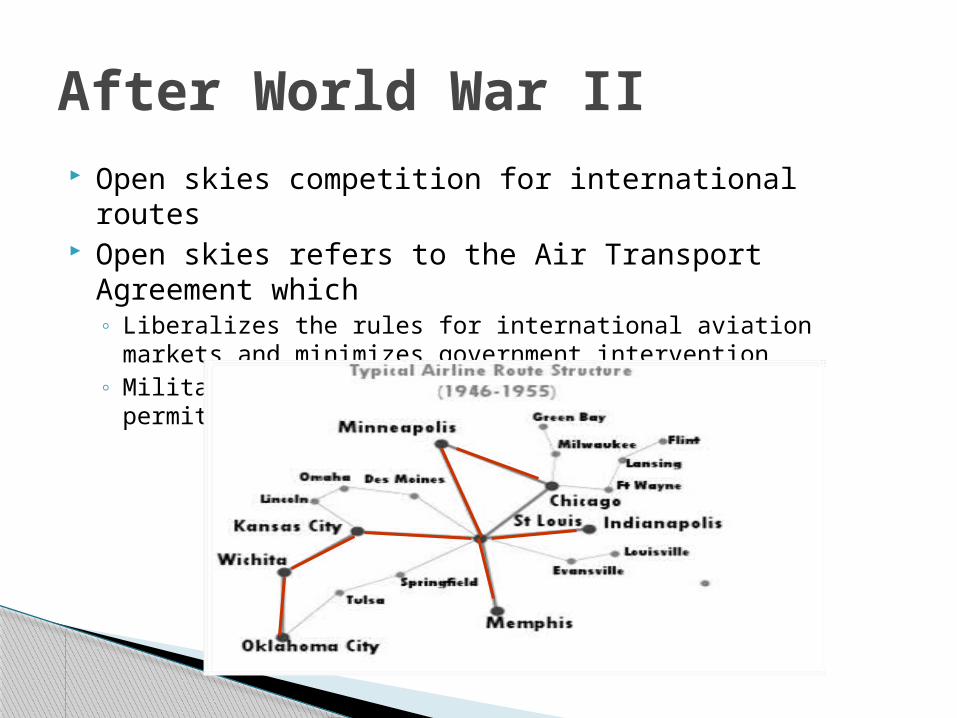
Open skies competition for international routes Open skies refers to the Air Transport Agreement
which◦ Liberalizes the rules for international aviation markets and
minimizes government intervention◦ Military and other state-based flights may be permitted
After World War II
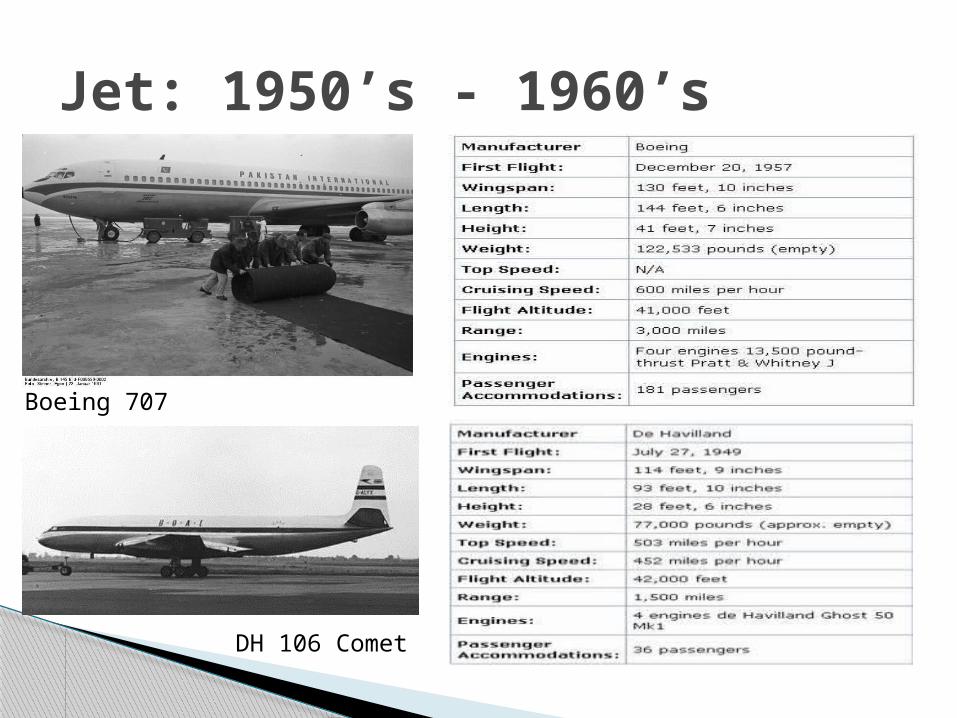
Jet: 1950’s - 1960’s
Boeing 707
DH 106 Comet
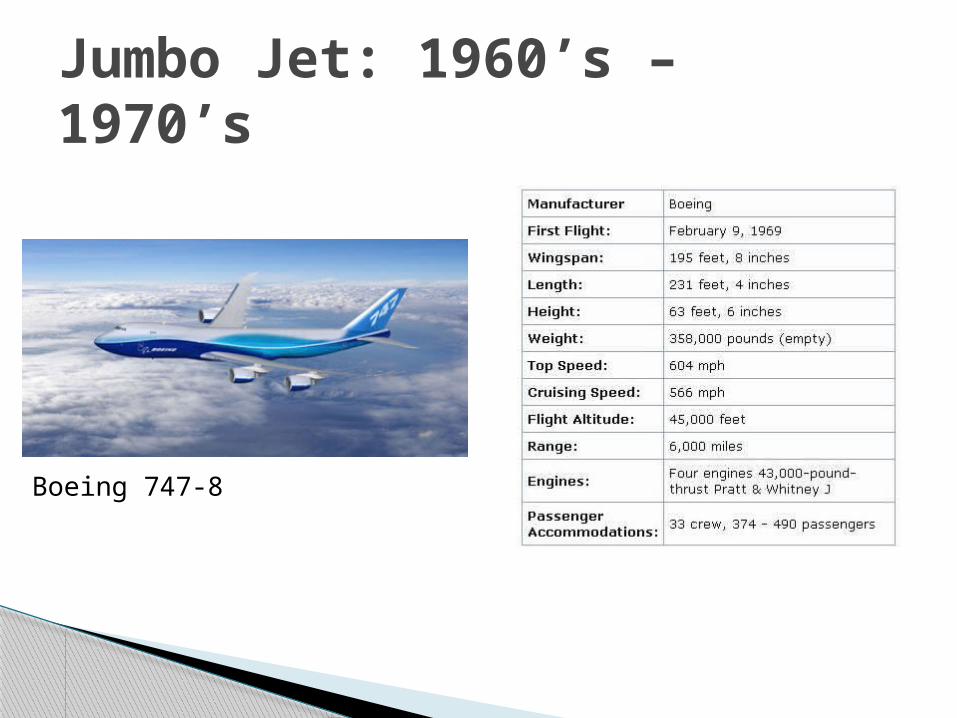
Jumbo Jet: 1960’s – 1970’s
Boeing 747-8
To remove government control over fares, routes, and market entry => CAB eliminated
Underserved airports opened to major carriers
Mergers between local carriers were allowed Implementation of “Hub and Spoke” system
Airline Deregulation Act (1978)
CAB
Key factors affecting the business:◦ Airport capacity◦ Route structure◦ Technology◦ Costs to lease/buy the aircrafts◦ Weather◦ Cost of fuel◦ Cost of labour
Global Airlines
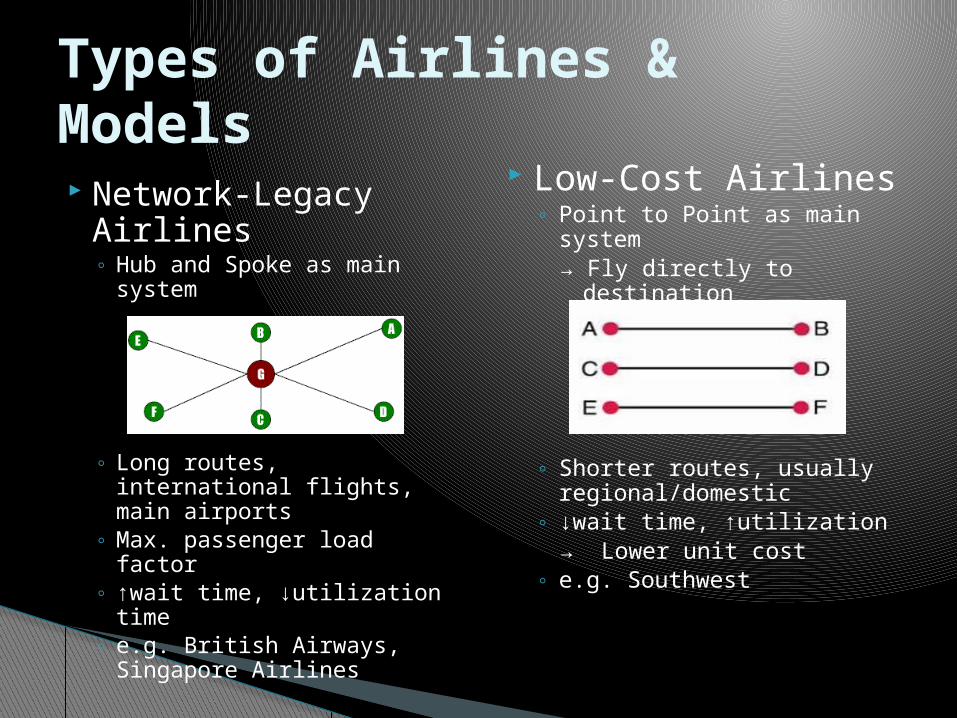
Network-Legacy Airlines◦ Hub and Spoke as main
system
◦ Long routes, international flights, main airports
◦ Max. passenger load factor
◦ ↑wait time, ↓utilization time
◦ e.g. British Airways, Singapore Airlines
Low-Cost Airlines◦ Point to Point as main
system→ Fly directly to destination
◦ Shorter routes, usually regional/domestic
◦ ↓wait time, ↑utilization→ Lower unit cost
◦ e.g. Southwest
Types of Airlines & Models
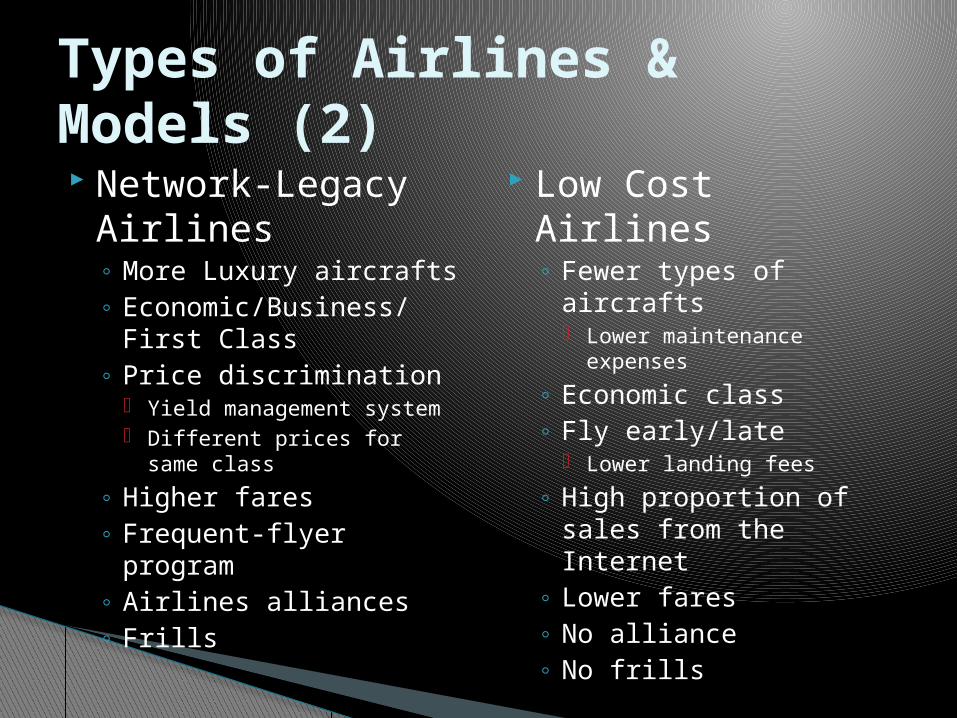
Network-Legacy Airlines◦ More Luxury aircrafts◦ Economic/Business/First
Class◦ Price discrimination
Yield management system Different prices for same
class
◦ Higher fares◦ Frequent-flyer program◦ Airlines alliances◦ Frills
Low Cost Airlines◦ Fewer types of aircrafts
Lower maintenance expenses
◦ Economic class◦ Fly early/late
Lower landing fees
◦ High proportion of sales from the Internet
◦ Lower fares◦ No alliance◦ No frills
Types of Airlines & Models (2)
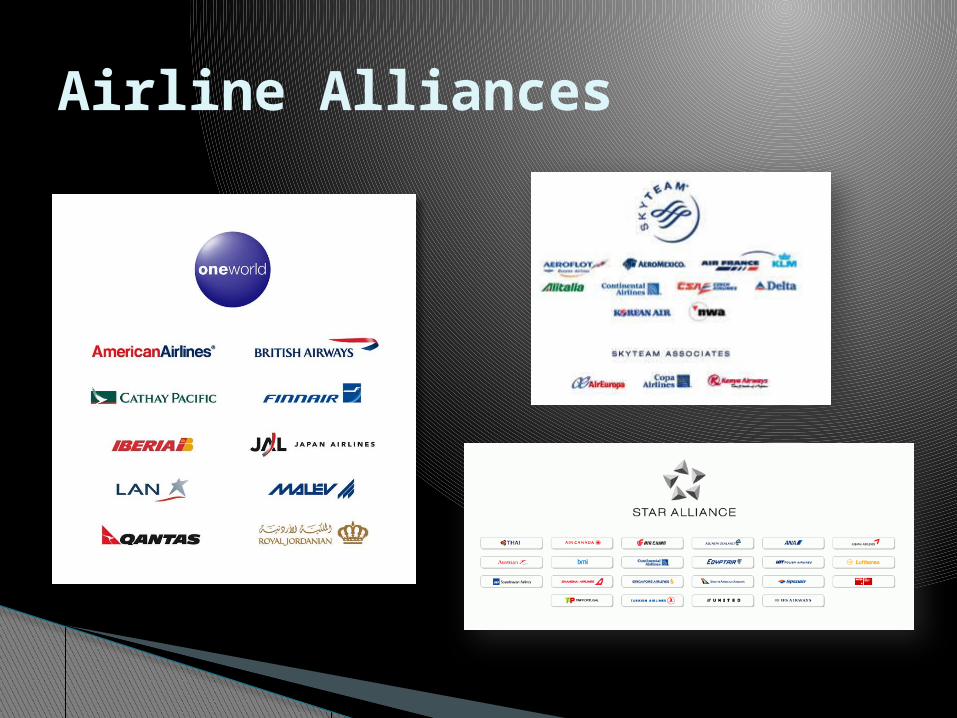
Airline Alliances
An extended and optimized network Cost reduction from sharing of
◦ Sales offices◦ Maintenance/operational facilities◦ Operational staff◦ Investment and purchases
Benefits Traveler◦ Lower Price◦ More choice of departure and destination◦ Faster mileage reward
Benefits of Alliances
Industry Overview
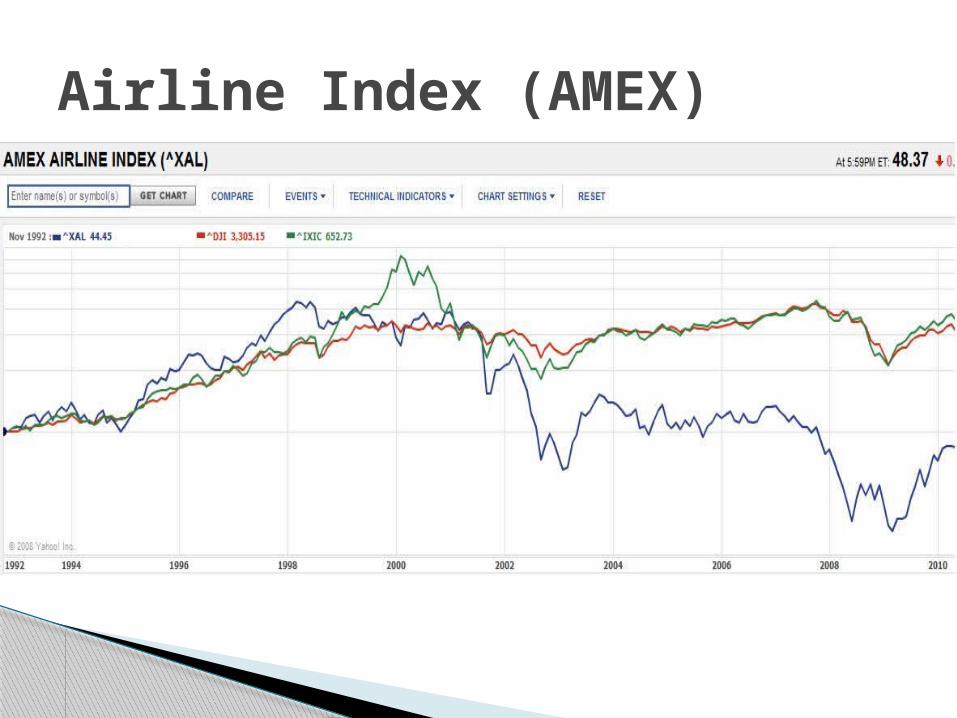
Airline Index (AMEX)
1990 1991 1992 1993 1994 1995 1996 1997 1998 1999 2000 2001 2002 2003 2004 2005 2006 2007 2008 2009 2010 2Qs
0.0
5.0
10.0
15.0
20.0
25.0
30.0
35.0
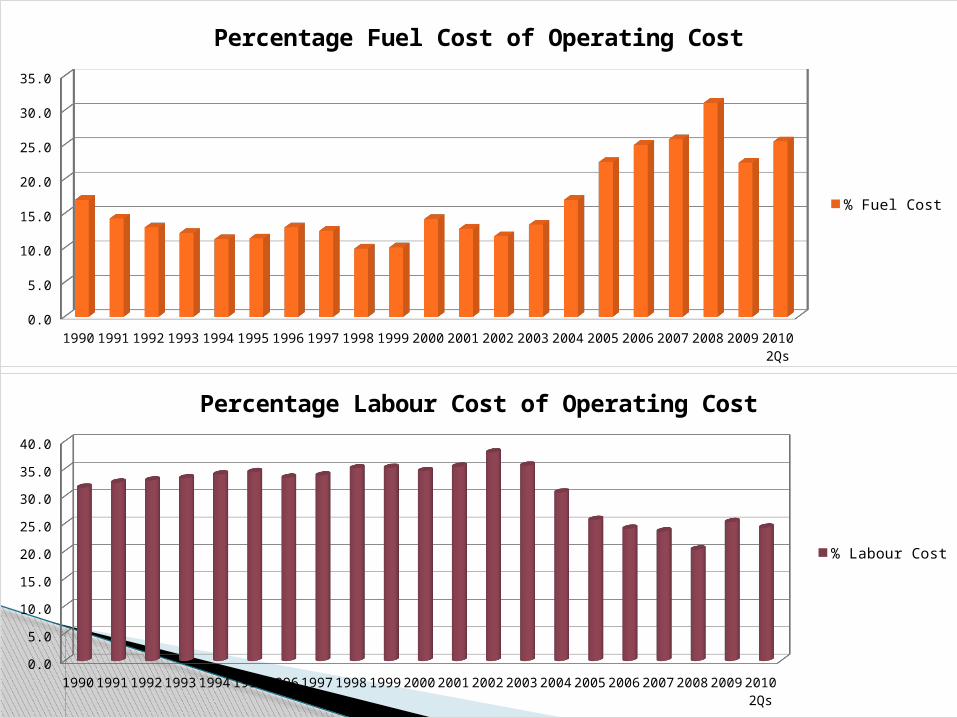
Percentage Fuel Cost of Operating Cost
% Fuel Cost
1990
1991
1992
1993
1994
1995
1996
1997
1998
1999
2000
2001
2002
2003
2004
2005
2006
2007
2008
2009
2010
2Qs
0.0
5.0
10.0
15.0
20.0
25.0
30.0
35.0
40.0
Percentage Labour Cost of Operating Cost
% Labour Cost
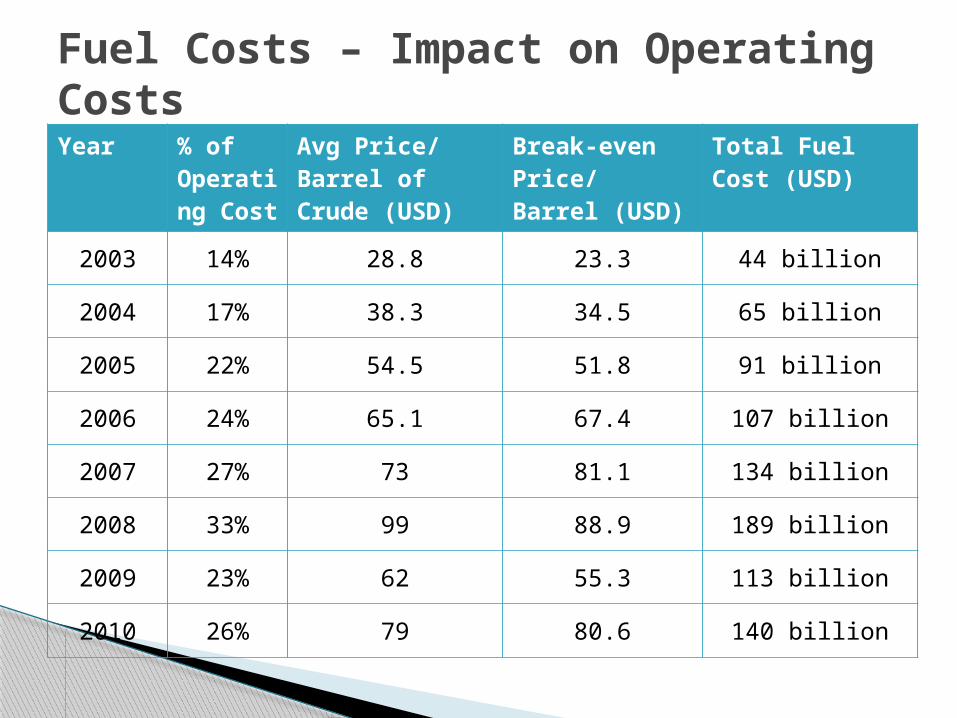
Year % of Operating Cost
Avg Price/ Barrel of Crude (USD)
Break-even Price/ Barrel (USD)
Total Fuel Cost (USD)
2003 14% 28.8 23.3 44 billion
2004 17% 38.3 34.5 65 billion
2005 22% 54.5 51.8 91 billion
2006 24% 65.1 67.4 107 billion
2007 27% 73 81.1 134 billion
2008 33% 99 88.9 189 billion
2009 23% 62 55.3 113 billion
2010 26% 79 80.6 140 billion
Fuel Costs – Impact on Operating Costs
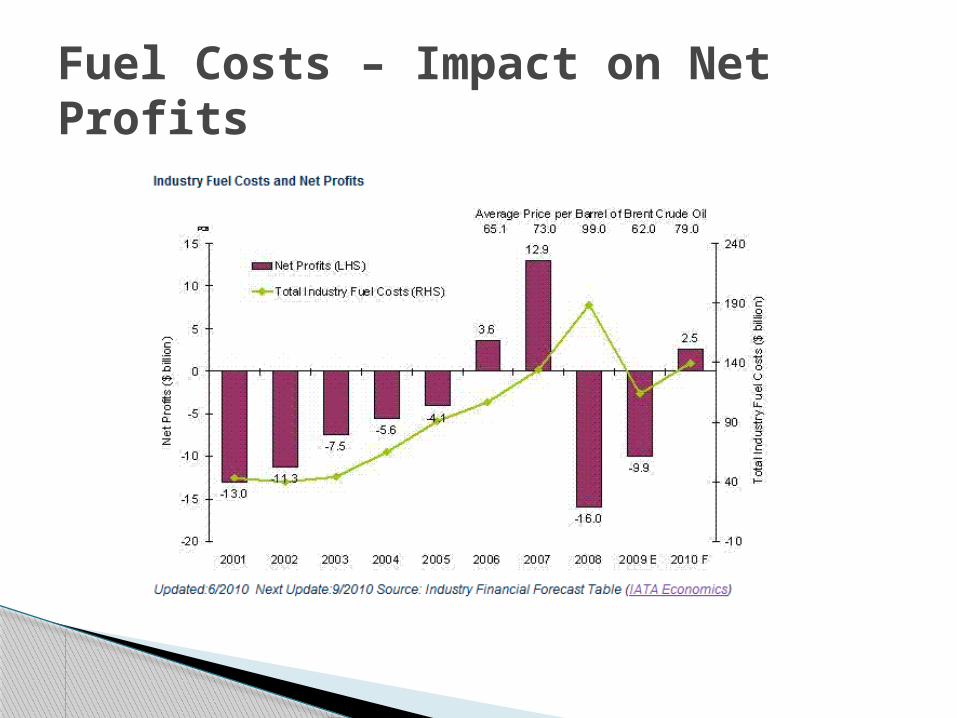
Fuel Costs – Impact on Net Profits
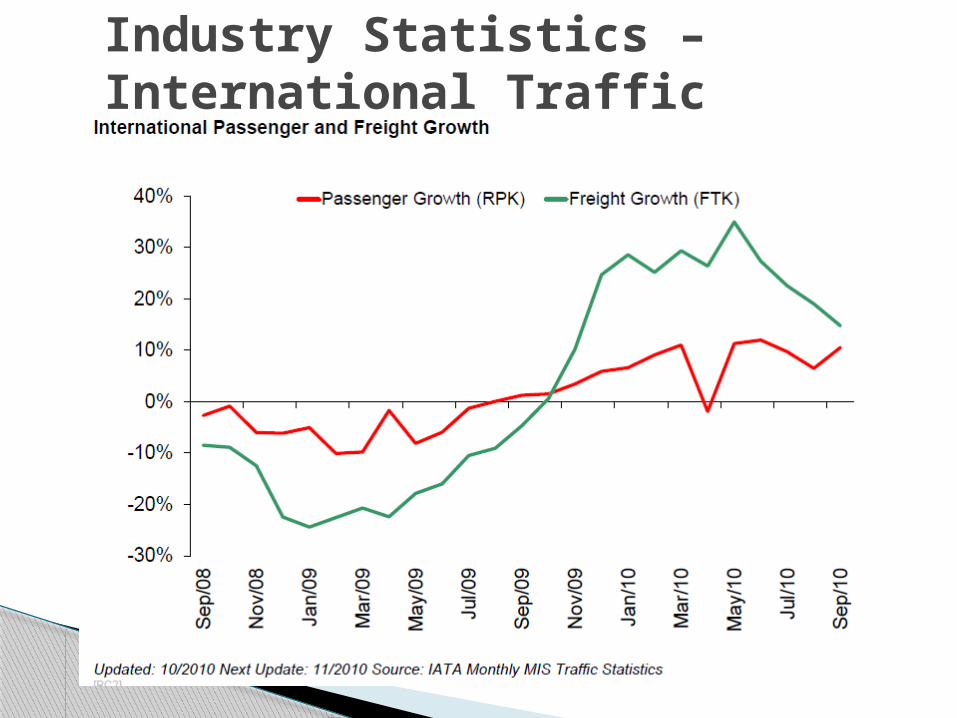
Industry Statistics – International Traffic
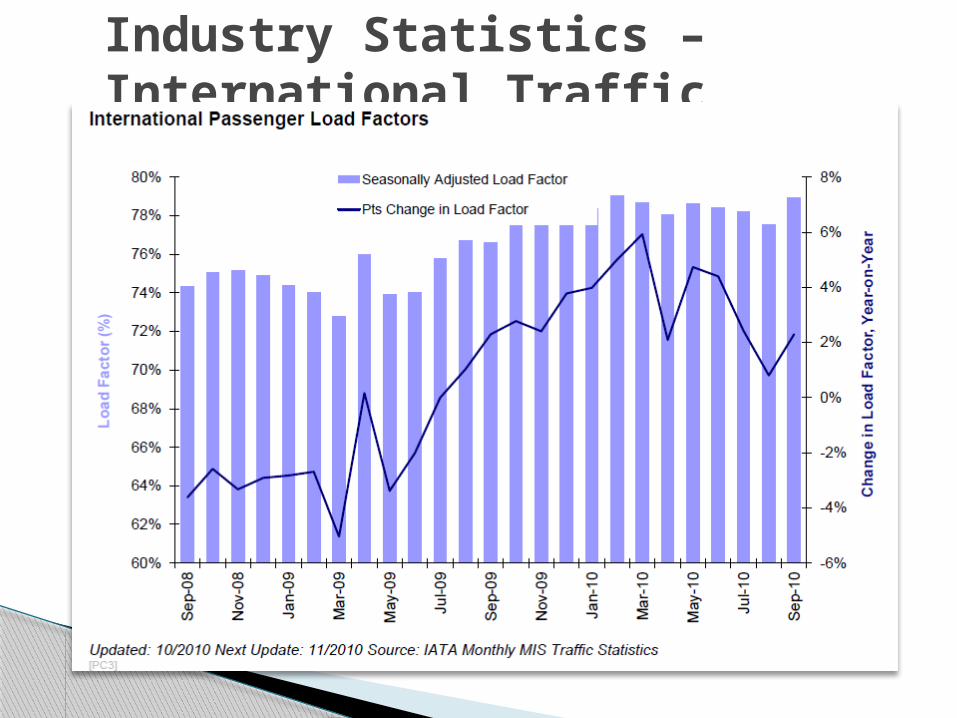
Industry Statistics – International Traffic
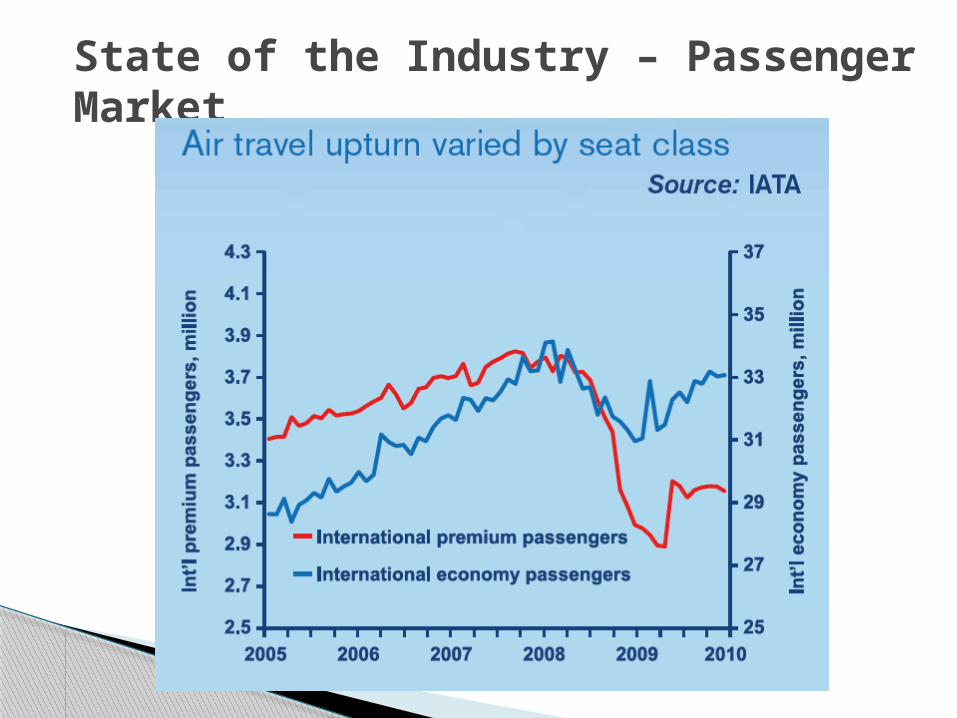
State of the Industry – Passenger Market
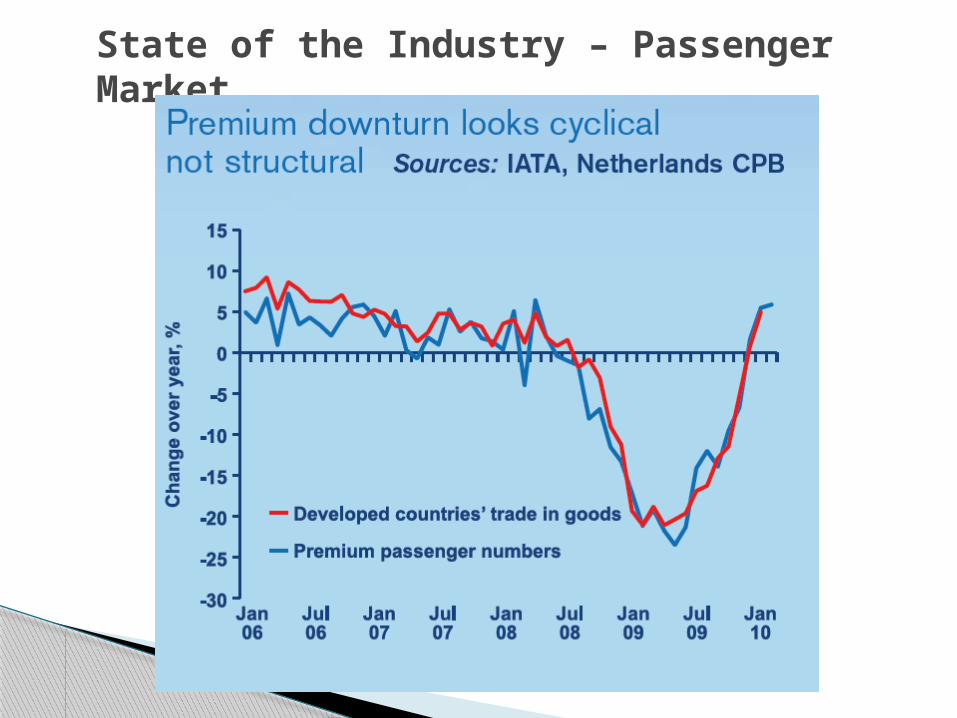
State of the Industry – Passenger Market
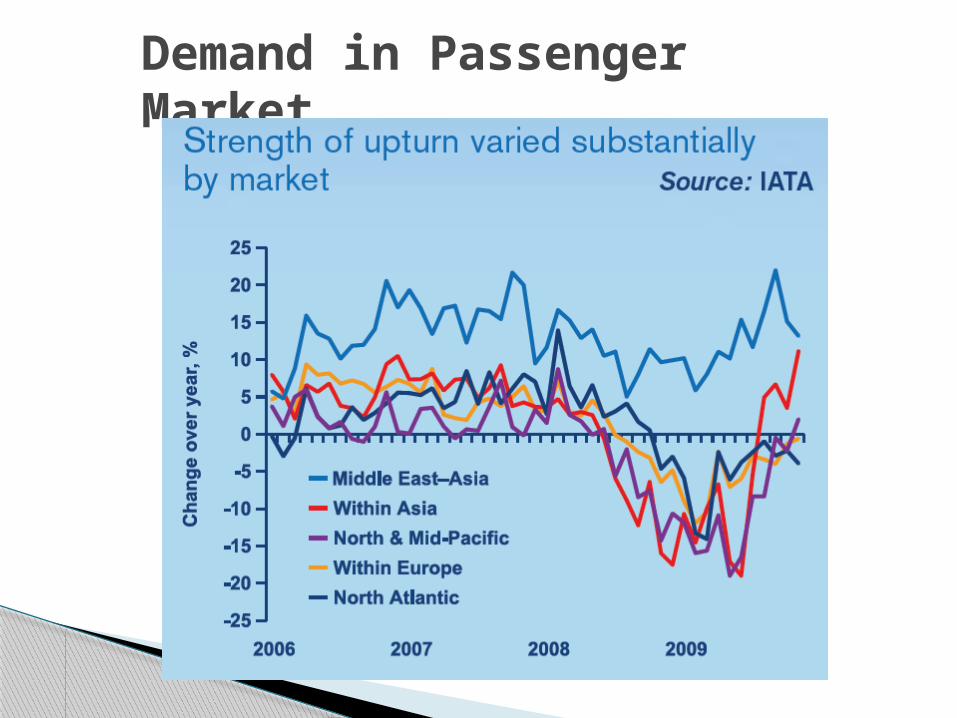
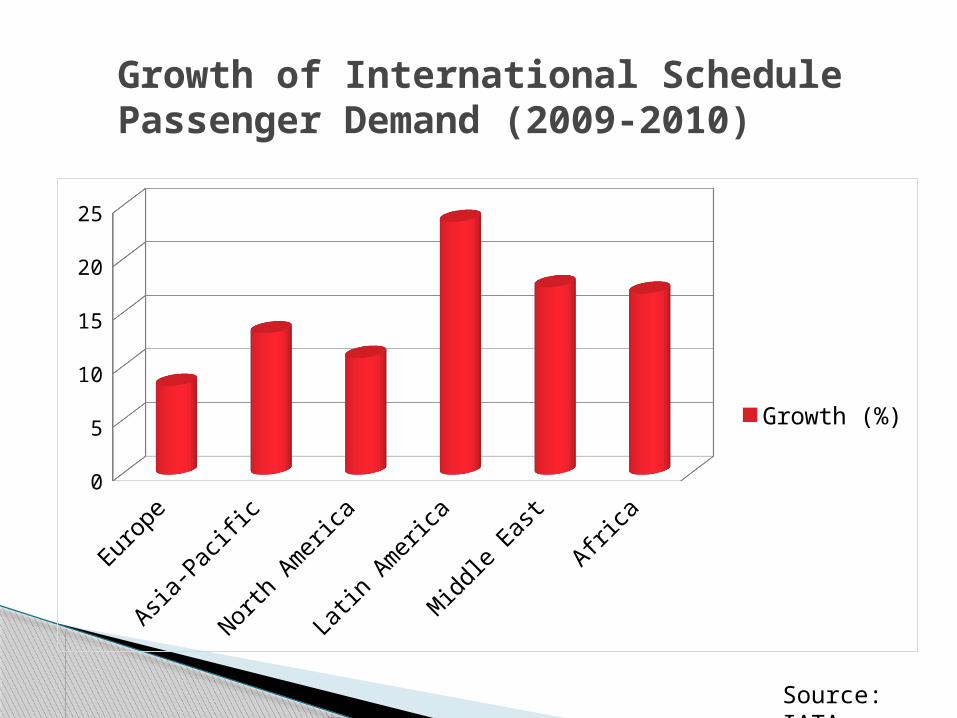
Demand in Passenger Market
Euro
pe
Asia
-Pac
ific
North
Am
erica
Latin
Am
erica
Mid
dle
East
Afric
a0
5
10
15
20
25
Growth (%)
Growth of International Schedule Passenger Demand (2009-2010)
Source: IATA
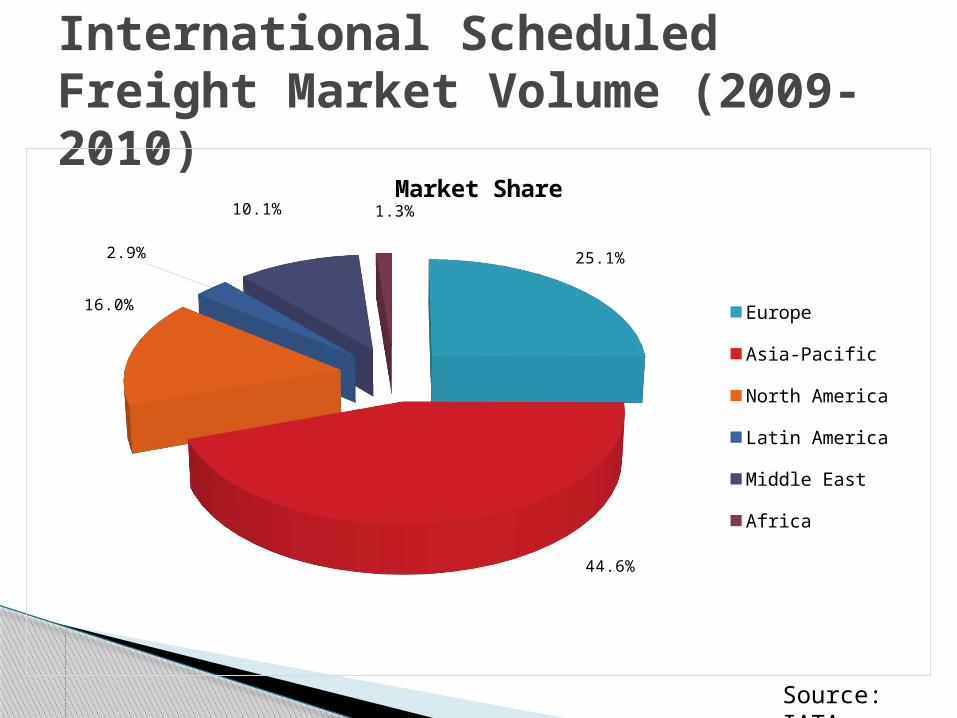
International Scheduled Freight Market Volume (2009-2010)
25.1%
44.6%
16.0%
2.9%
10.1% 1.3%
Market Share
Europe
Asia-Pacific
North America
Latin America
Middle East
Africa
Source: IATA
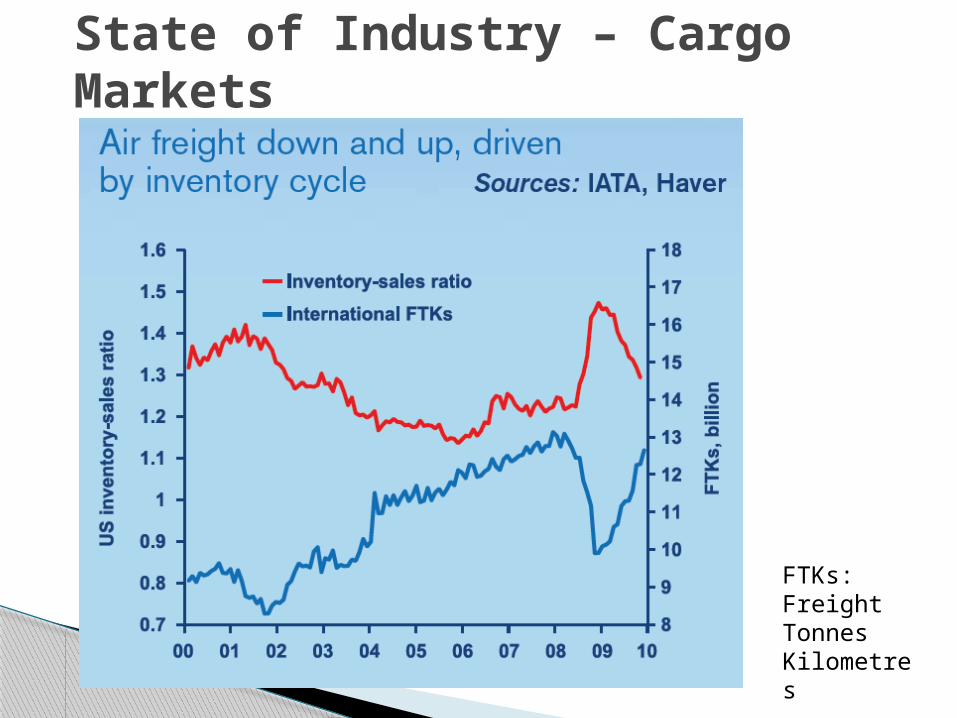
State of Industry – Cargo Markets
FTKs: Freight Tonnes Kilometres
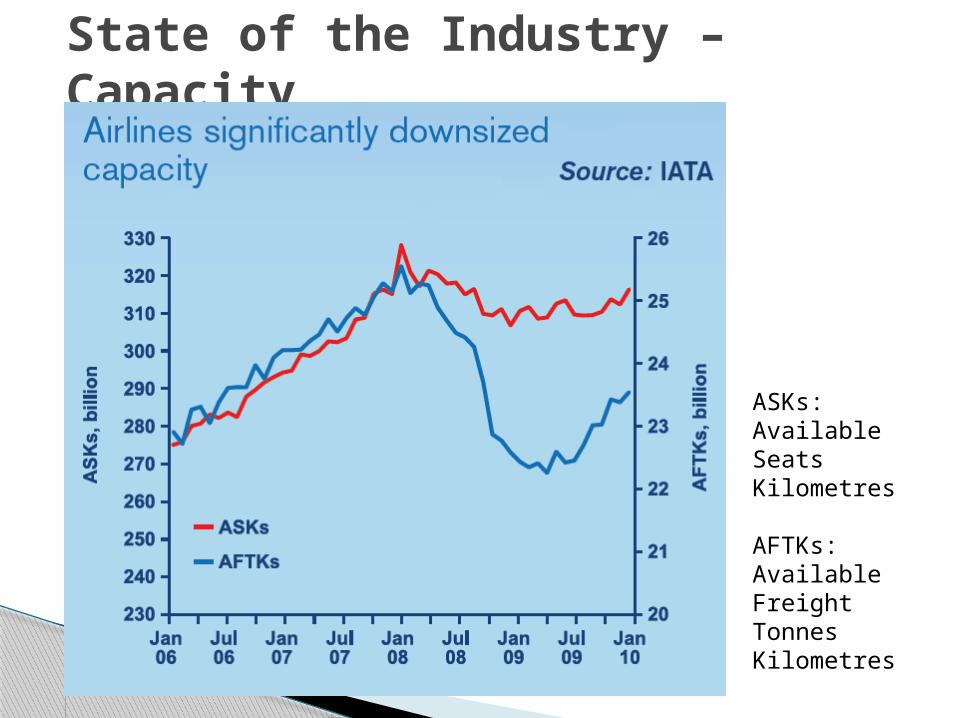
State of the Industry – Capacity
ASKs:Available Seats Kilometres
AFTKs:Available Freight Tonnes Kilometres
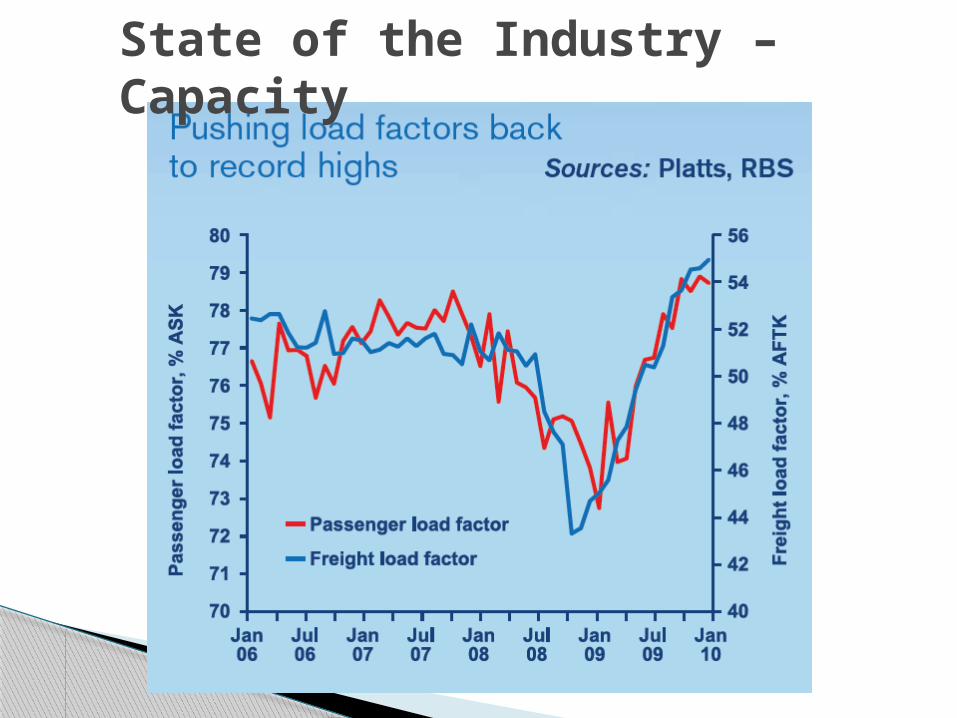
State of the Industry – Capacity
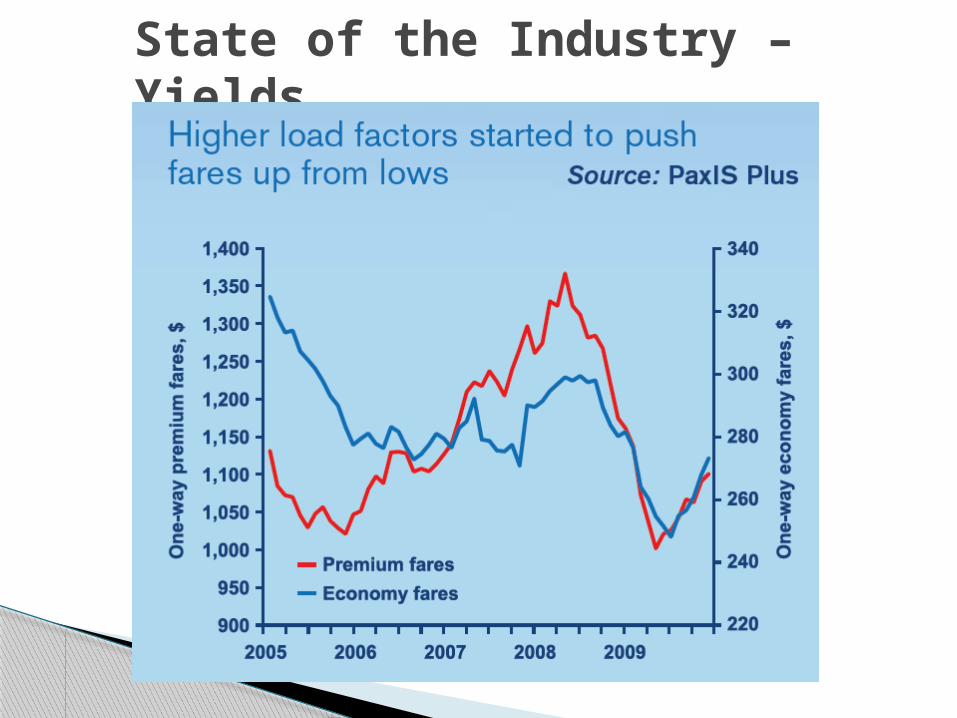
State of the Industry – Yields
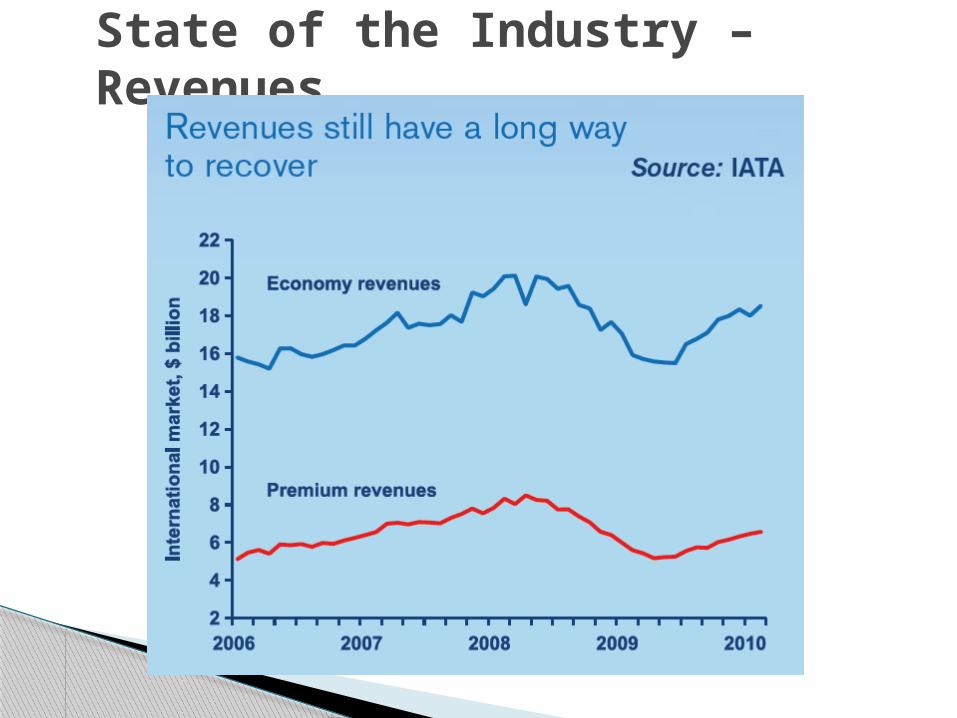
State of the Industry – Revenues
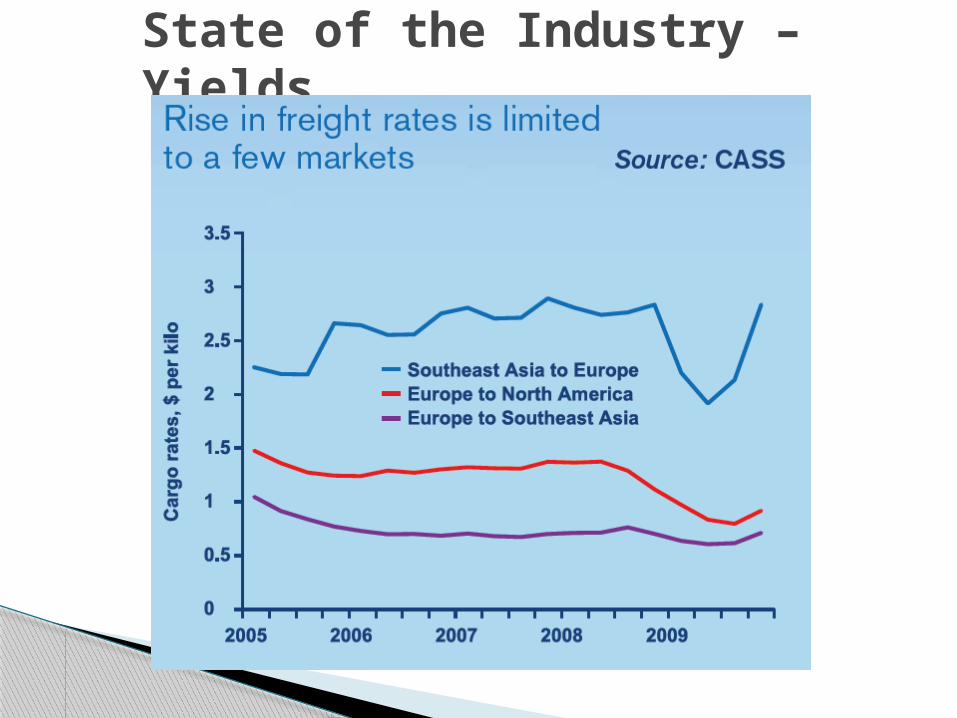
State of the Industry – Yields
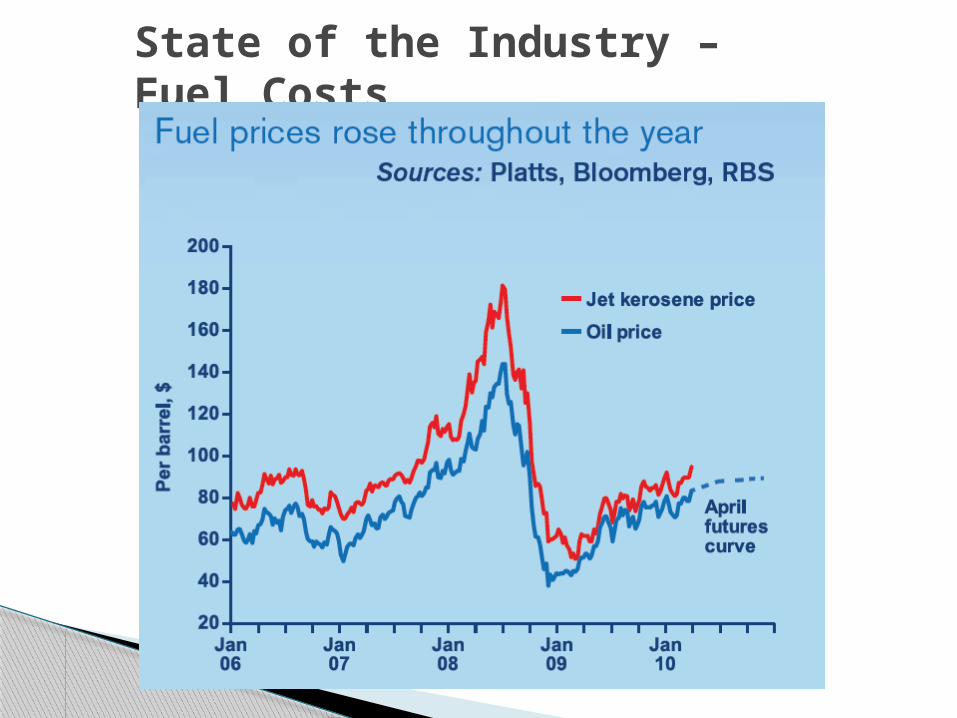
State of the Industry – Fuel Costs
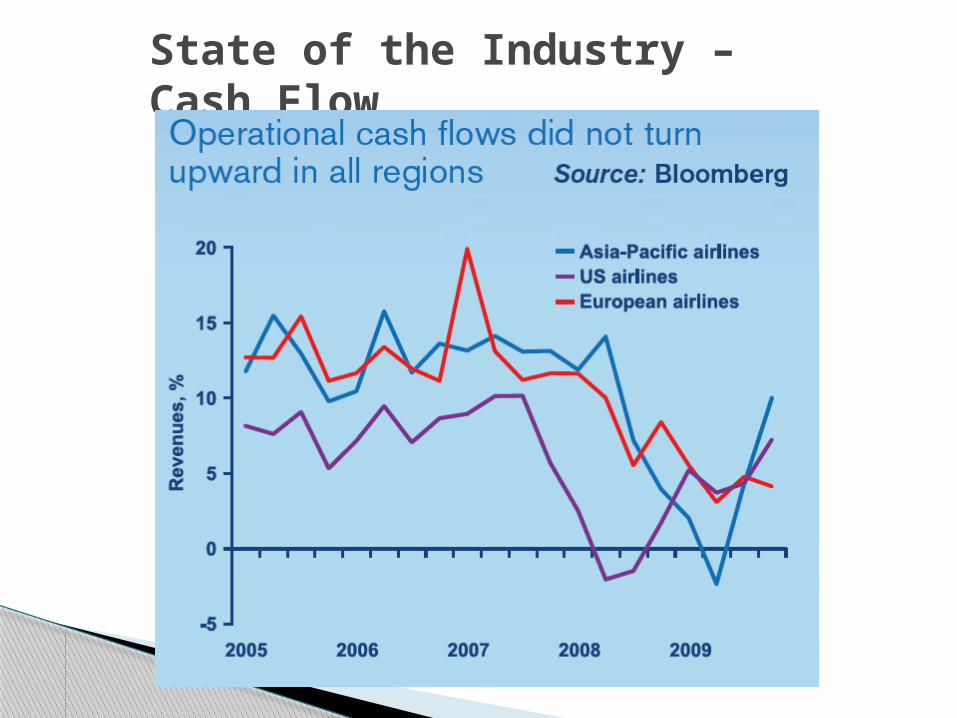
State of the Industry – Cash Flow
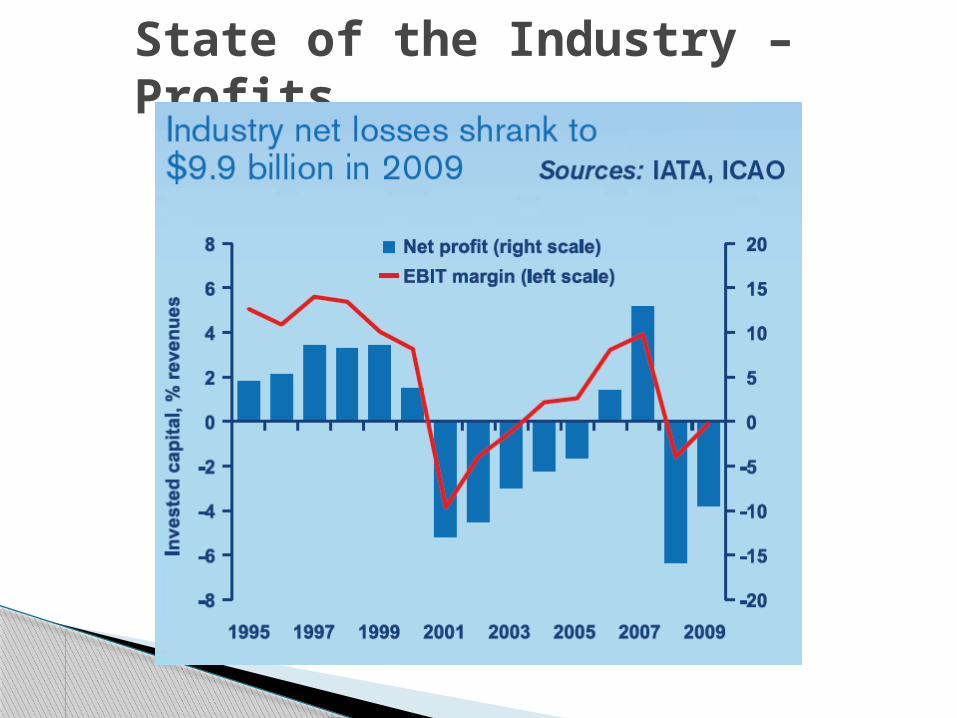
State of the Industry – Profits
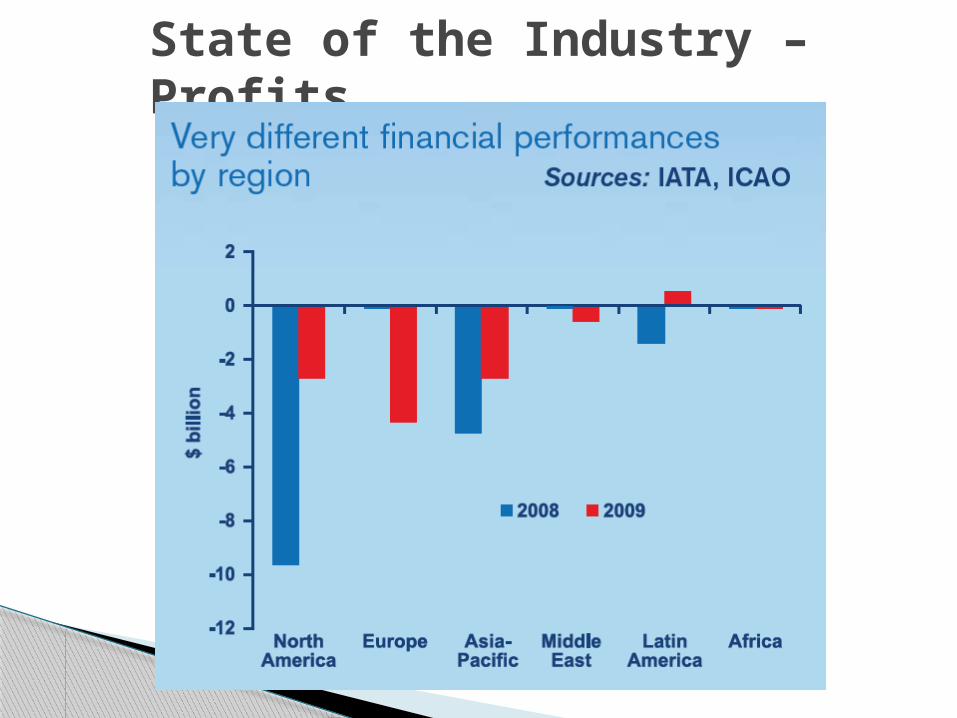
State of the Industry – Profits
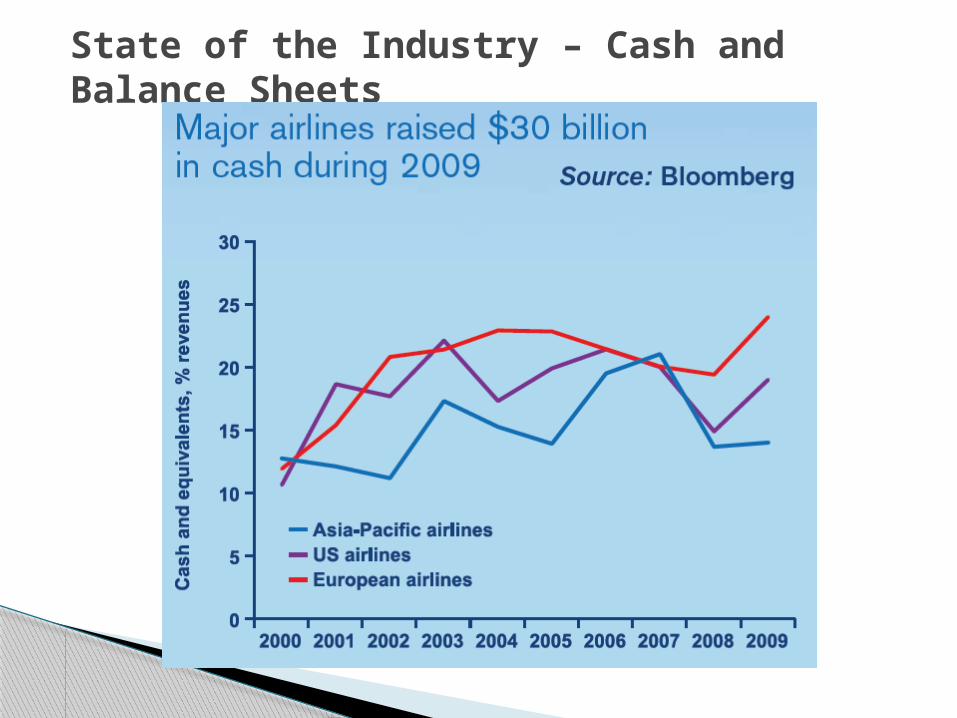
State of the Industry – Cash and Balance Sheets
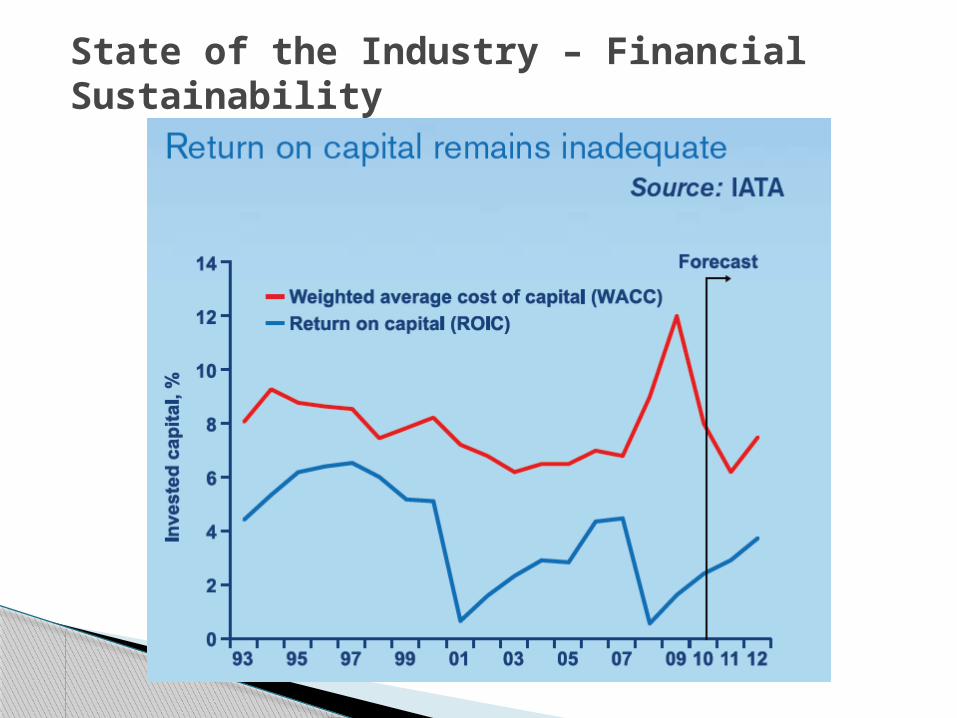
State of the Industry – Financial Sustainability
Southwest Airlines
SOUTHWEST AIRLINES

Stock Quote (NYSE:LUV)
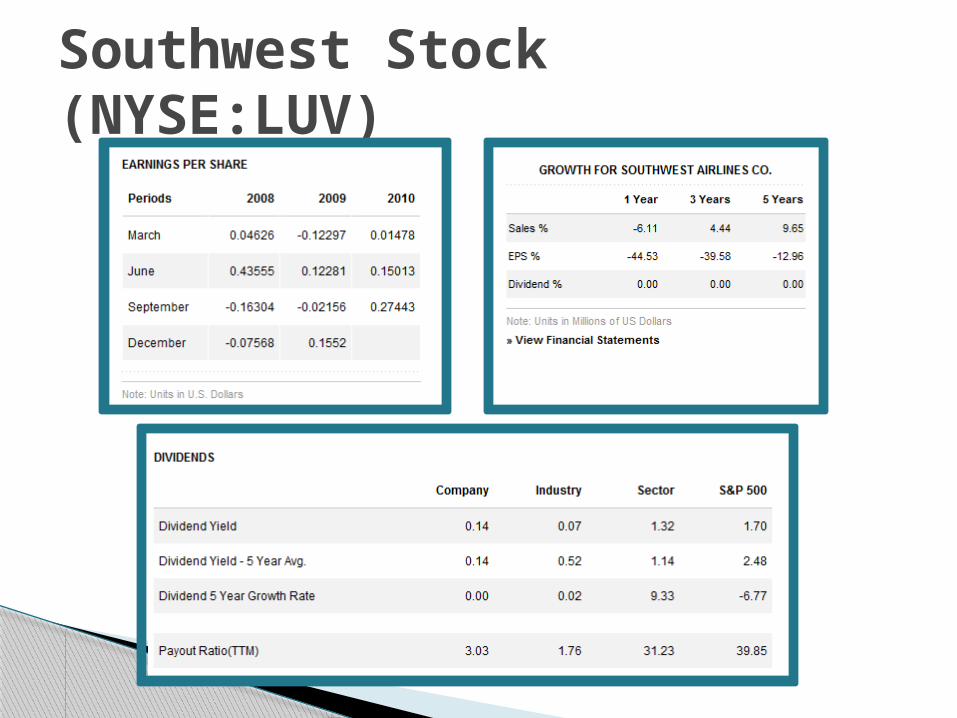
Southwest Stock (NYSE:LUV)
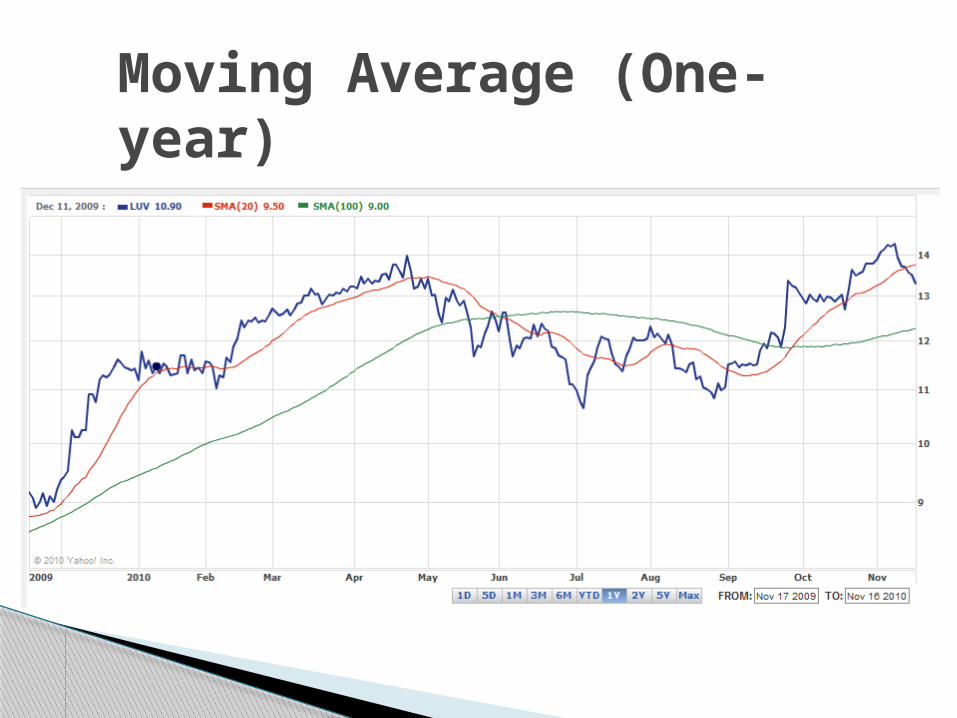
Moving Average (One-year)
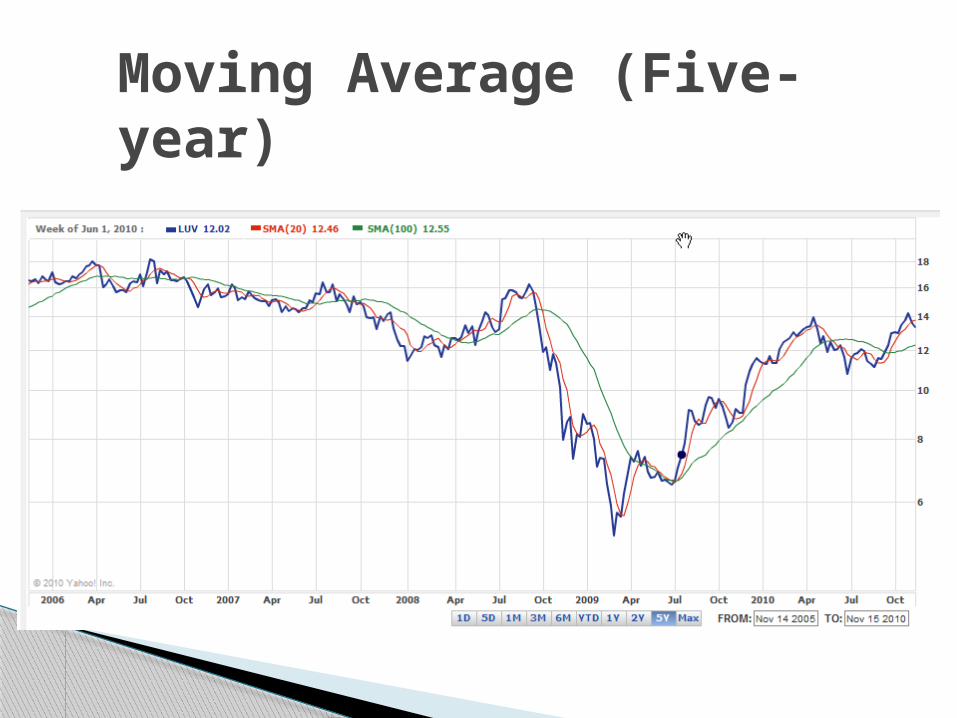
Moving Average (Five-year)
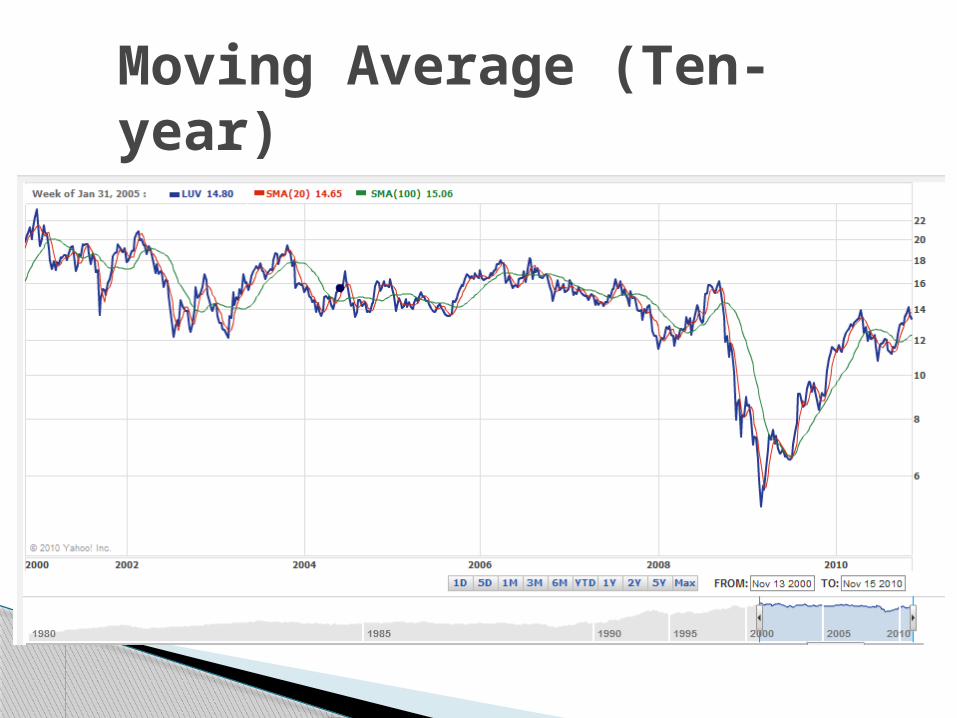
Moving Average (Ten-year)
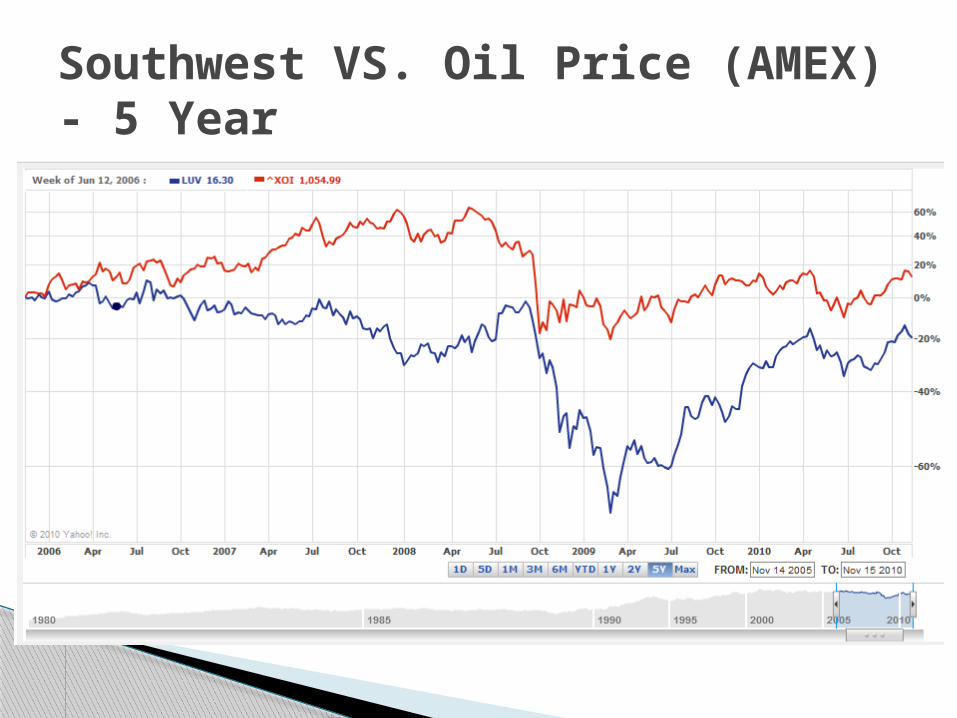
Southwest VS. Oil Price (AMEX) - 5 Year
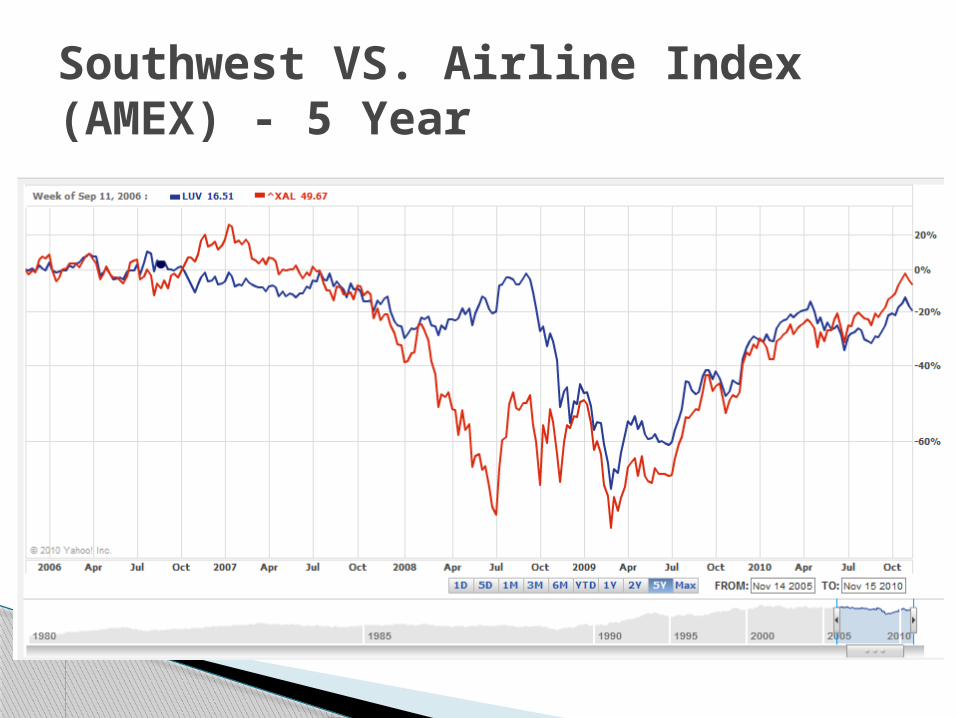
Southwest VS. Airline Index (AMEX) - 5 Year
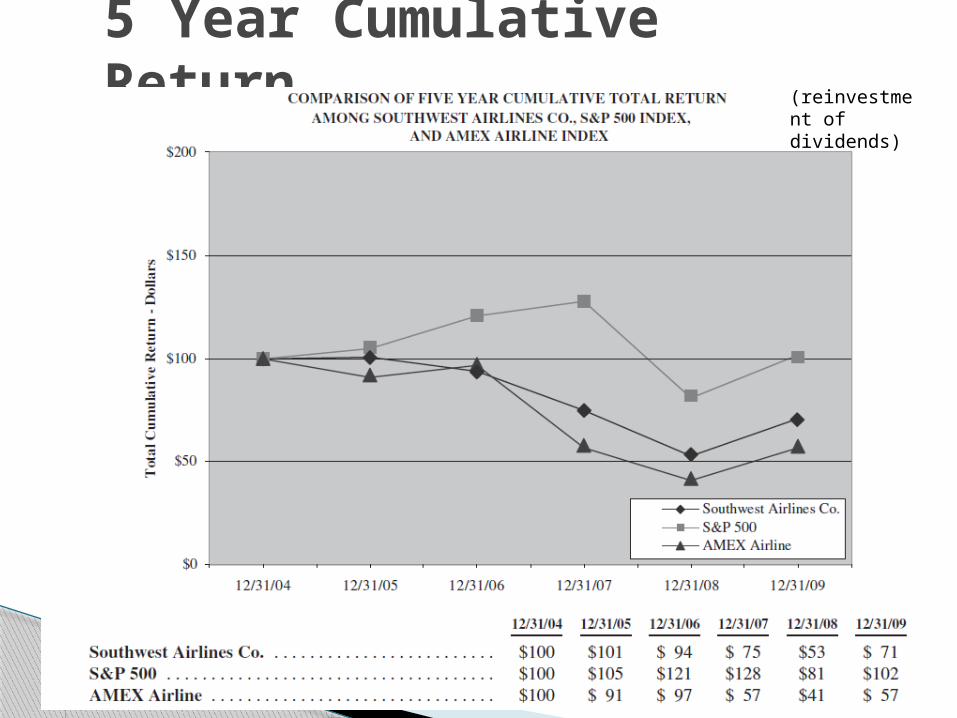
5 Year Cumulative Return (reinvestment
of dividends)
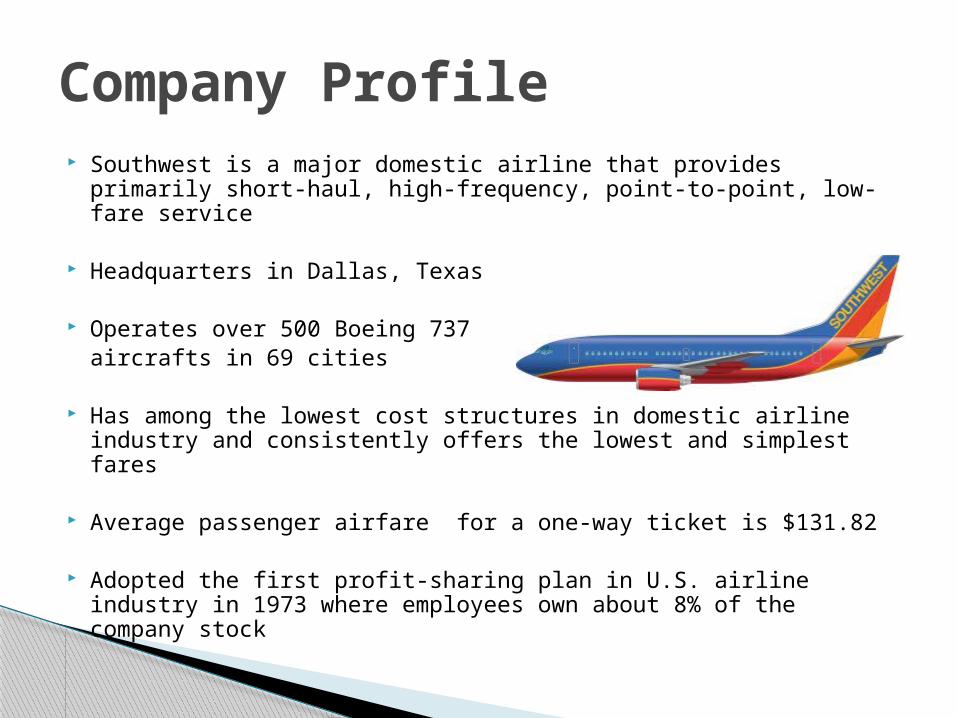
Southwest is a major domestic airline that provides primarily short-haul, high-frequency, point-to-point, low-fare service
Headquarters in Dallas, Texas
Operates over 500 Boeing 737 aircrafts in 69 cities
Has among the lowest cost structures in domestic airline industry and consistently offers the lowest and simplest fares
Average passenger airfare for a one-way ticket is $131.82
Adopted the first profit-sharing plan in U.S. airline industry in 1973 where employees own about 8% of the company stock
Company Profile
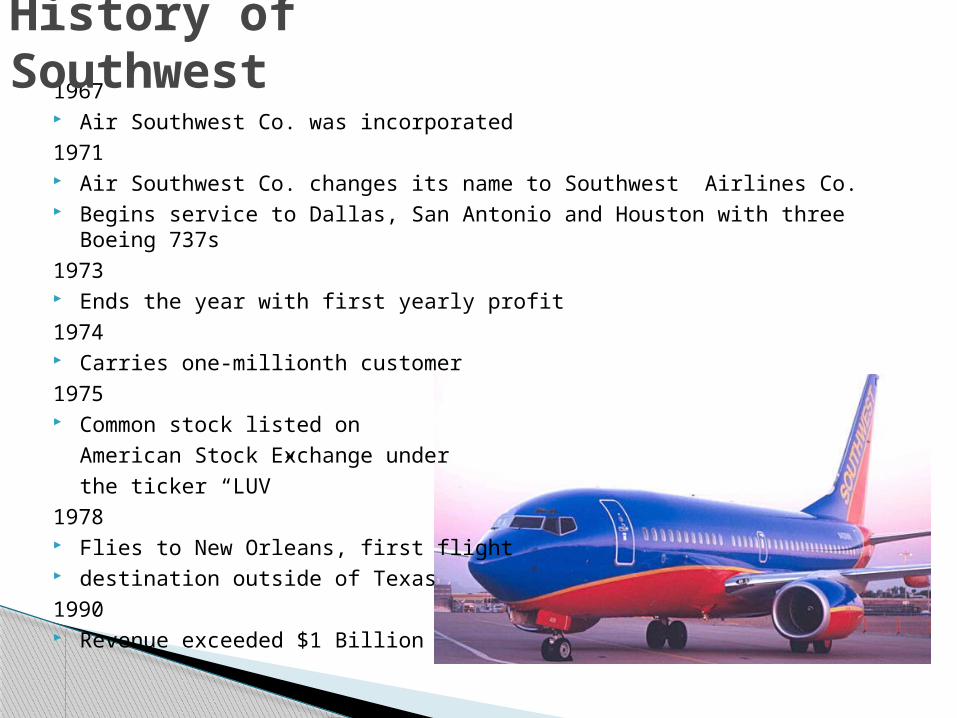
1967 Air Southwest Co. was incorporated1971 Air Southwest Co. changes its name to Southwest Airlines Co. Begins service to Dallas, San Antonio and Houston with three Boeing 737s1973 Ends the year with first yearly profit1974 Carries one-millionth customer1975 Common stock listed on
American Stock Exchange underthe ticker “LUV”
1978 Flies to New Orleans, first flight destination outside of Texas1990 Revenue exceeded $1 Billion
History of Southwest
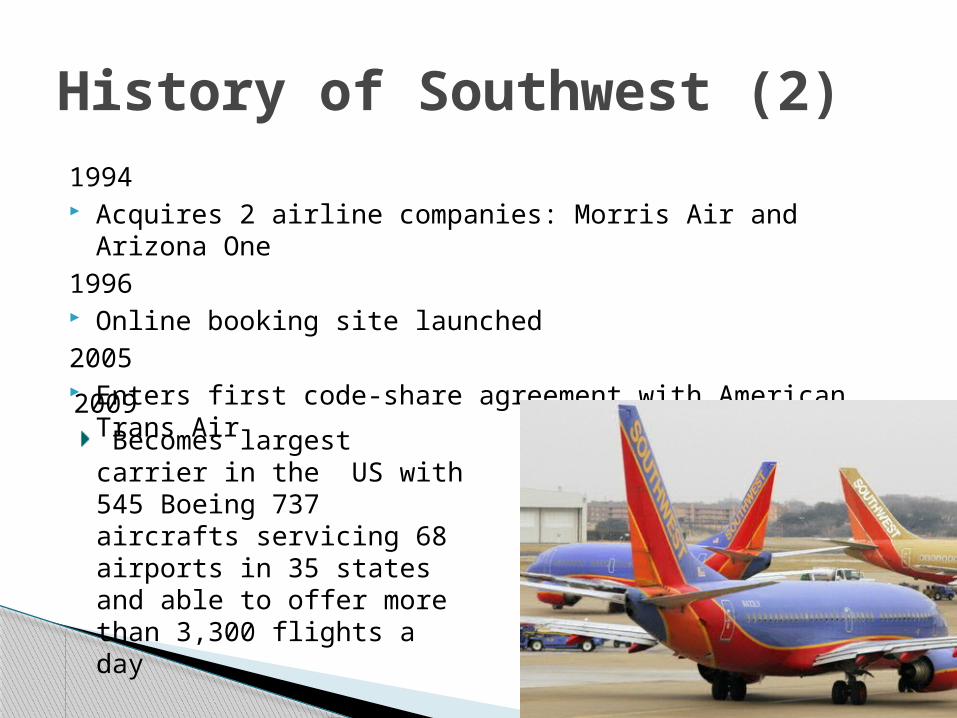
1994 Acquires 2 airline companies: Morris Air and Arizona One1996 Online booking site launched2005 Enters first code-share agreement with American Trans Air
History of Southwest (2)
2009 Becomes largest carrier in the US with 545 Boeing 737 aircrafts servicing 68 airports in 35 states and able to offer more than 3,300 flights a day
World’s largest low cost carrier
Maintains the 4th largest passenger fleet of aircraft among all airlines
One of the most profitable airlines (37th consecutive profitable year in 2010)
Has nearly 35,000 employees and makes more than 3,200 flights a day
Southwest Airlines Today
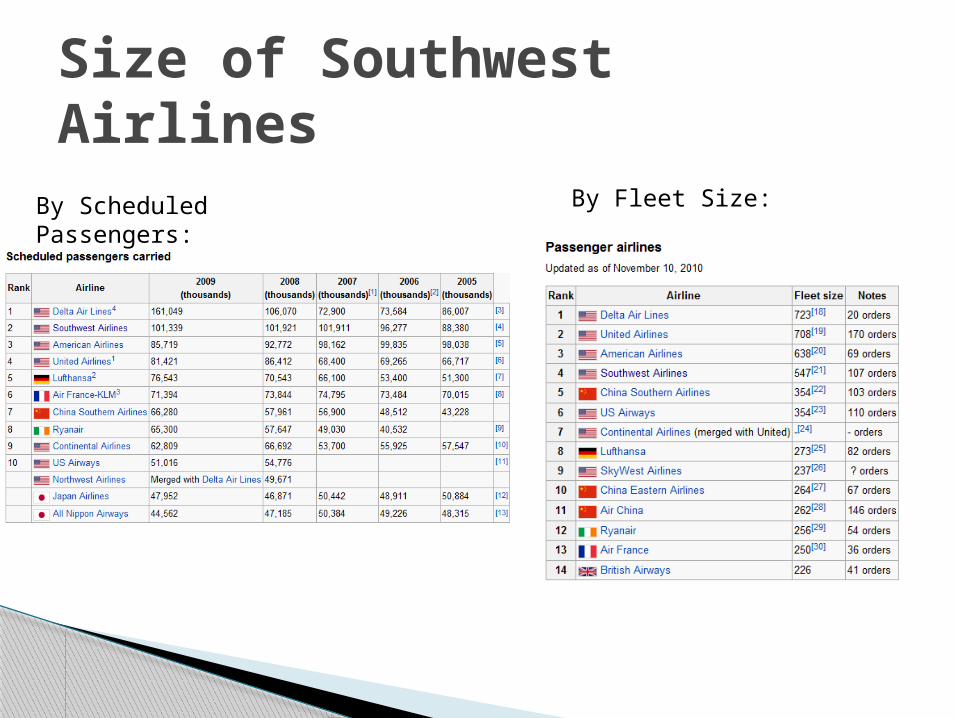
Size of Southwest Airlines
By Fleet Size:By Scheduled Passengers:
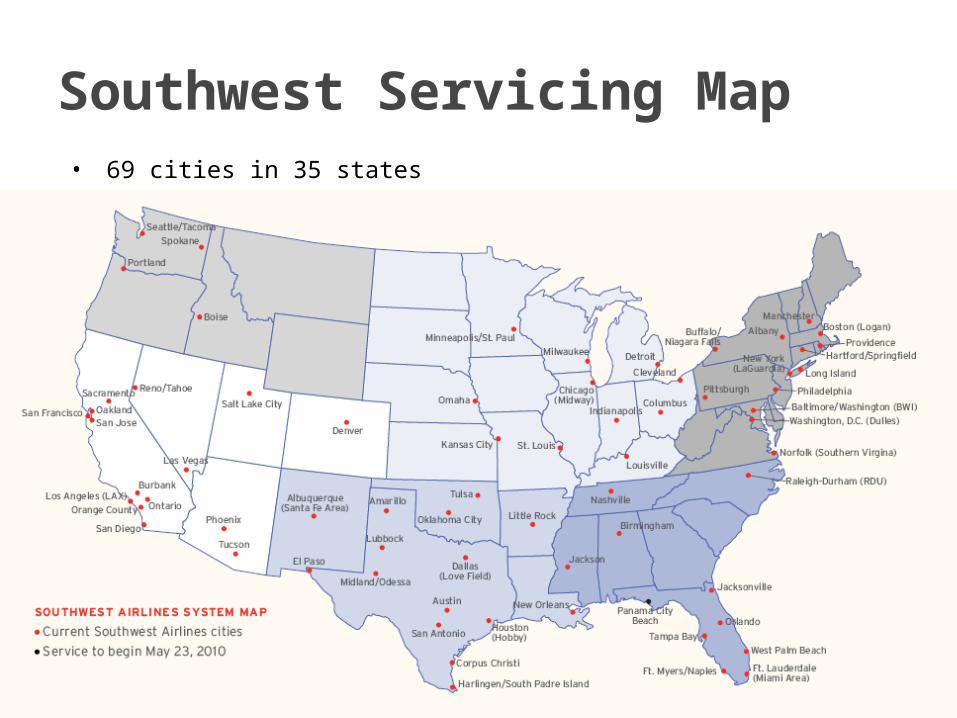
Southwest Servicing Map• 69 cities in 35 states
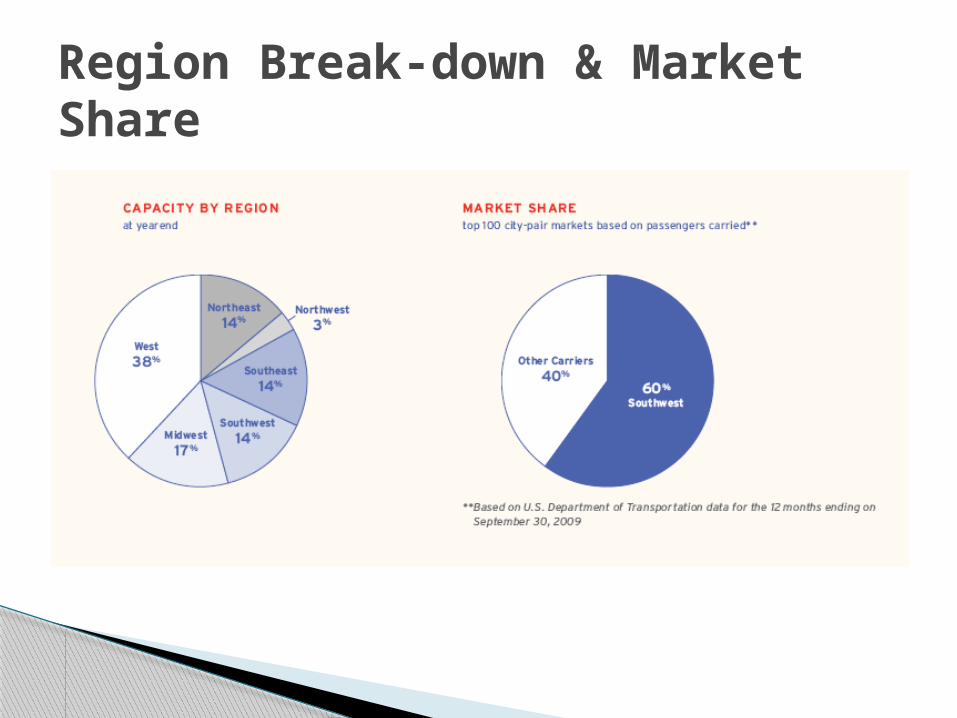
Region Break-down & Market Share
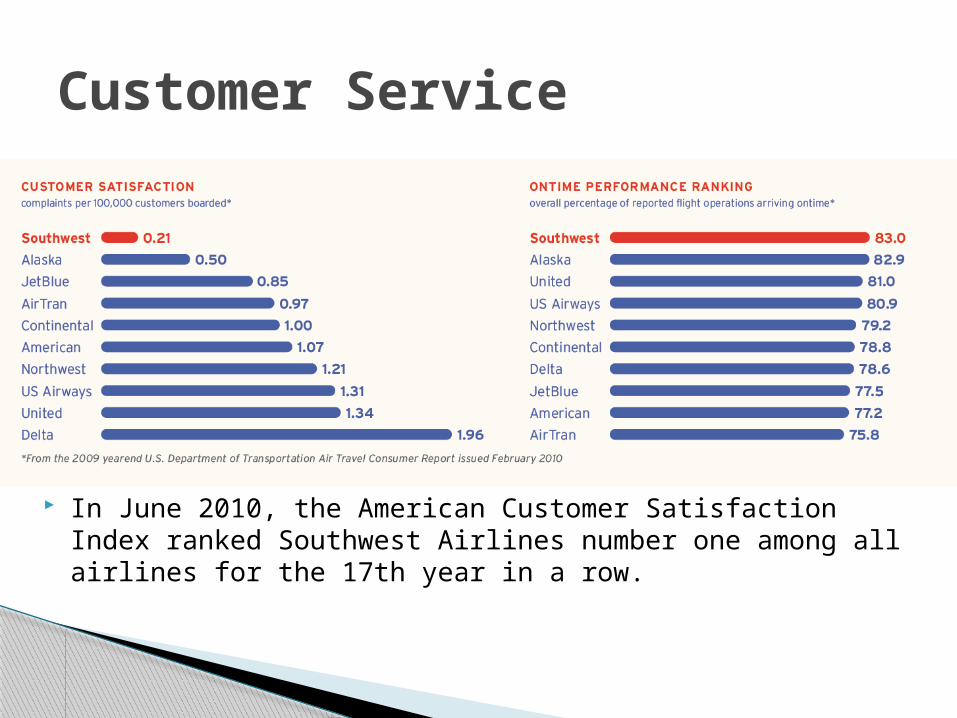
In June 2010, the American Customer Satisfaction Index ranked Southwest Airlines number one among all airlines for the 17th year in a row.
Customer Service
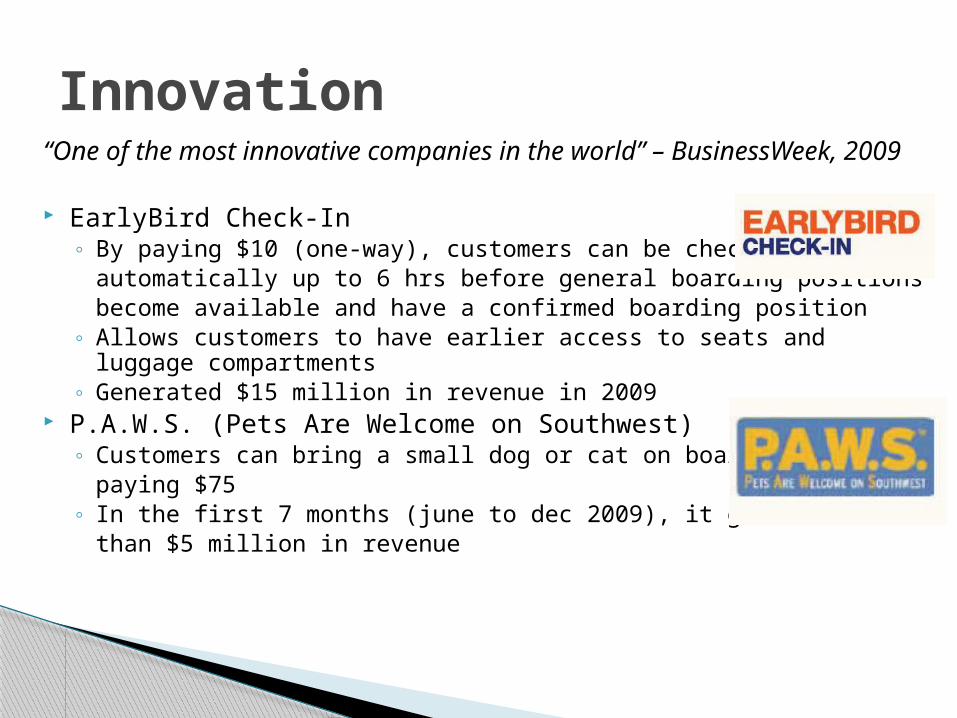
“One of the most innovative companies in the world” – BusinessWeek, 2009
EarlyBird Check-In◦ By paying $10 (one-way), customers can be checked in
automatically up to 6 hrs before general boarding positions become available and have a confirmed boarding position
◦ Allows customers to have earlier access to seats and luggage compartments
◦ Generated $15 million in revenue in 2009 P.A.W.S. (Pets Are Welcome on Southwest)
◦ Customers can bring a small dog or cat on board by paying $75
◦ In the first 7 months (june to dec 2009), it generated more than $5 million in revenue
Innovation
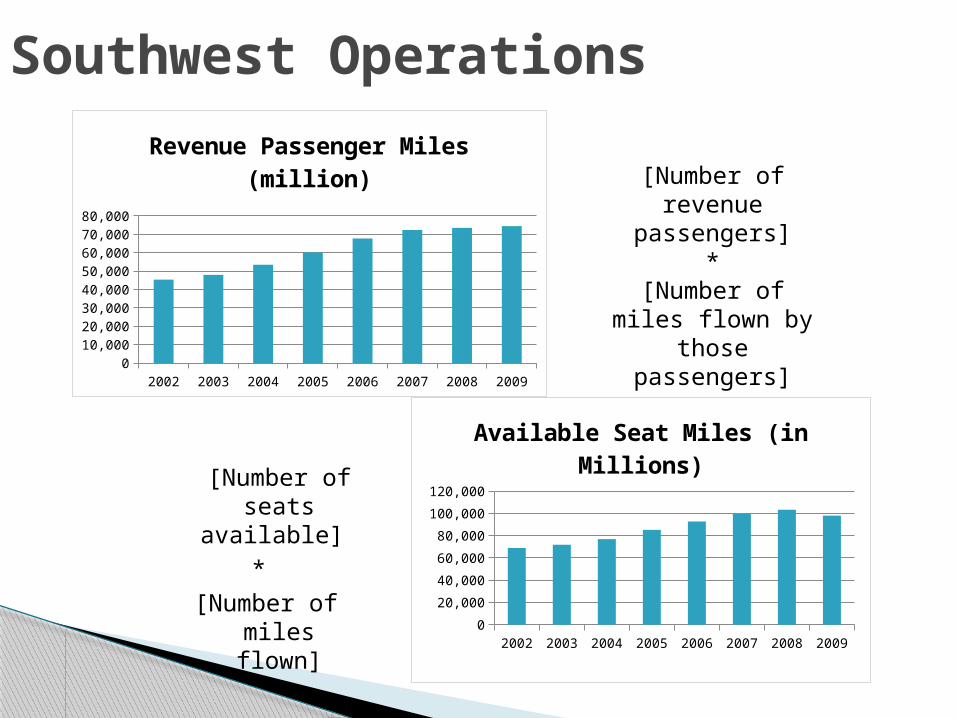
[Number of seats
available] *
[Number of miles flown]
Southwest Operations
2002 2003 2004 2005 2006 2007 2008 20090
20,000
40,000
60,000
80,000
100,000
120,000
Available Seat Miles (in Millions)
2002 2003 2004 2005 2006 2007 2008 20090
10,000
20,000
30,000
40,000
50,000
60,000
70,000
80,000
Revenue Passenger Miles (million) [Number of
revenue passengers]
*[Number of miles
flown by those passengers]
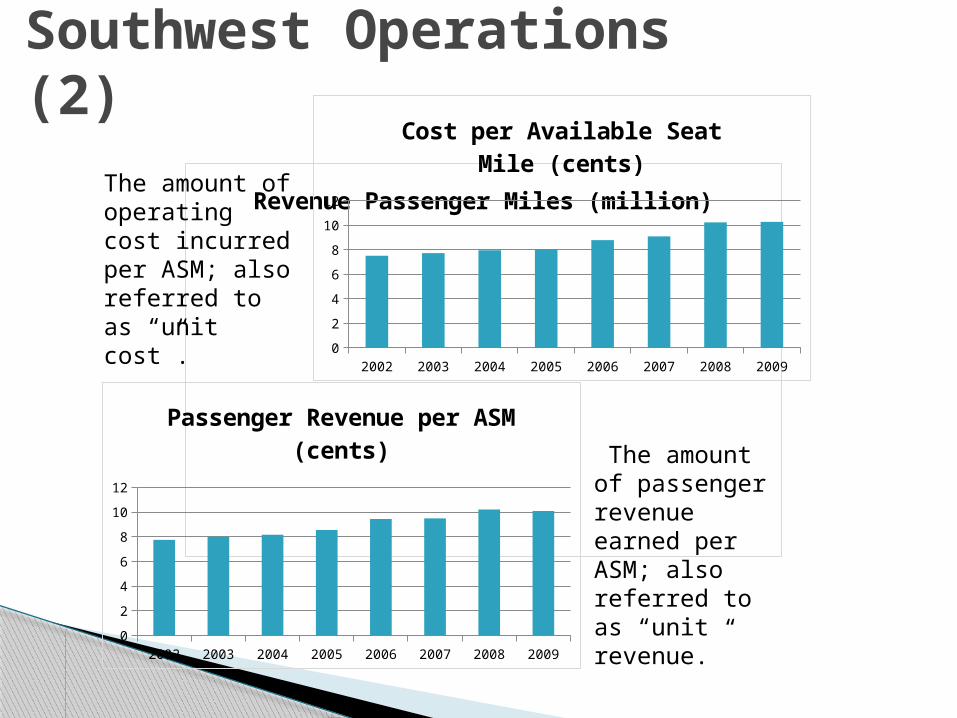
Southwest Operations (2)
Revenue Passenger Miles (million)
2002 2003 2004 2005 2006 2007 2008 20090
2
4
6
8
10
12
Cost per Available Seat Mile (cents)
2002 2003 2004 2005 2006 2007 2008 20090
2
4
6
8
10
12
Passenger Revenue per ASM (cents) The amount of
passenger revenue earned per ASM; also referred to as “unit revenue.”
The amount of operating cost incurred per ASM; also referred to as “unit cost”.
Southwest AirlinesManagement
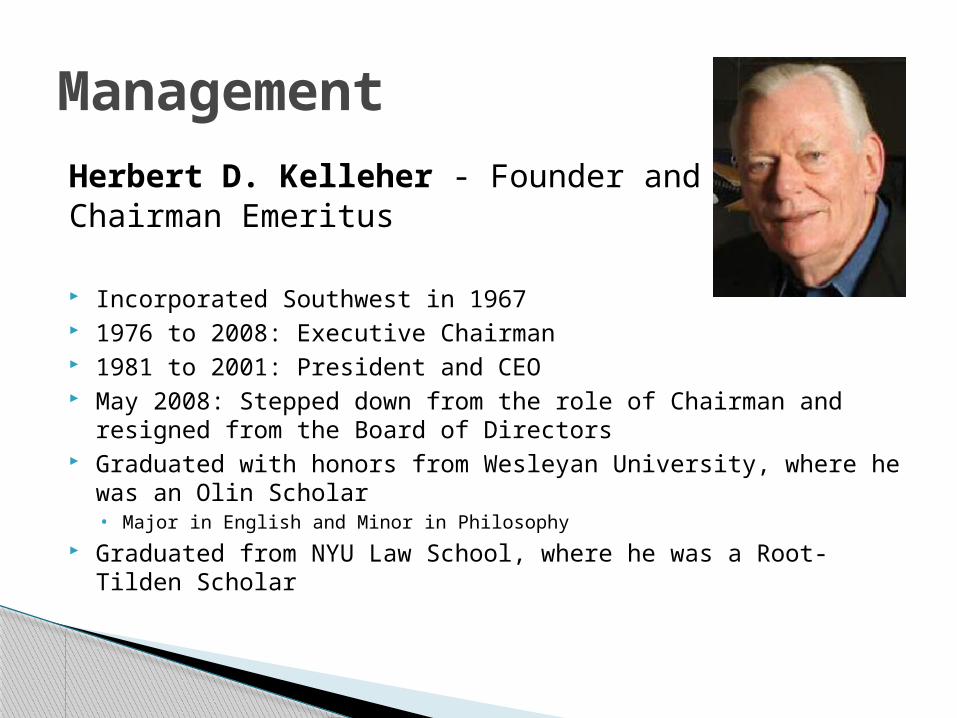
Herbert D. Kelleher - Founder and Chairman Emeritus
Incorporated Southwest in 1967 1976 to 2008: Executive Chairman 1981 to 2001: President and CEO May 2008: Stepped down from the role of Chairman and resigned
from the Board of Directors Graduated with honors from Wesleyan University, where he was
an Olin Scholar• Major in English and Minor in Philosophy
Graduated from NYU Law School, where he was a Root-Tilden Scholar
Management
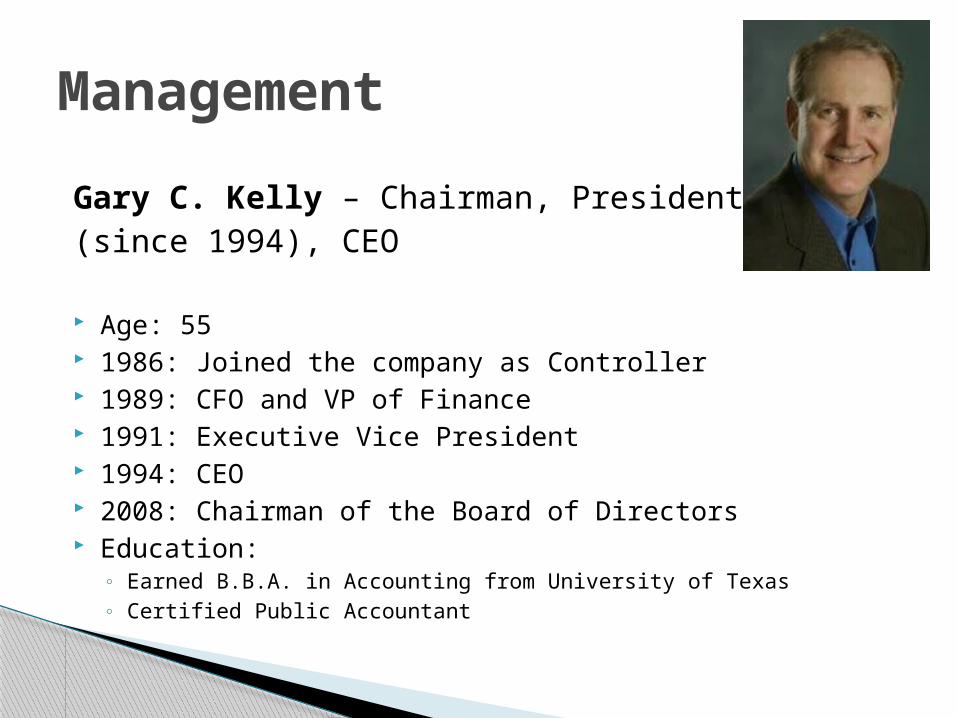
Gary C. Kelly – Chairman, President (since 1994), CEO
Age: 55 1986: Joined the company as Controller 1989: CFO and VP of Finance 1991: Executive Vice President 1994: CEO 2008: Chairman of the Board of Directors Education:
◦ Earned B.B.A. in Accounting from University of Texas◦ Certified Public Accountant
Management
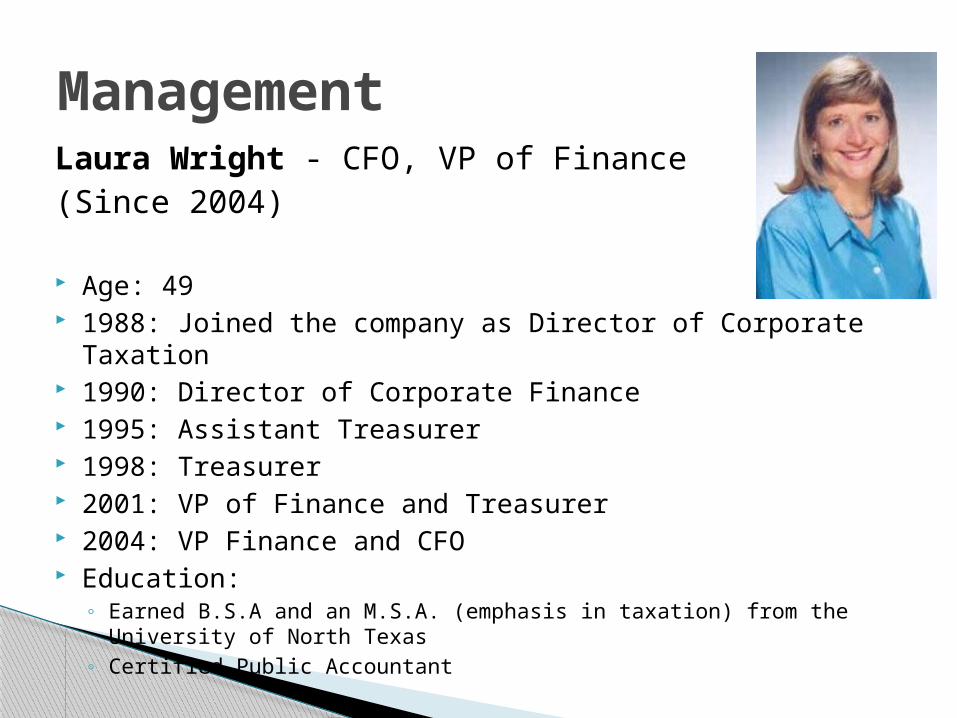
Laura Wright - CFO, VP of Finance (Since 2004)
Age: 49 1988: Joined the company as Director of Corporate Taxation 1990: Director of Corporate Finance 1995: Assistant Treasurer 1998: Treasurer 2001: VP of Finance and Treasurer 2004: VP Finance and CFO Education:
◦ Earned B.S.A and an M.S.A. (emphasis in taxation) from the University of North Texas
◦ Certified Public Accountant
Management
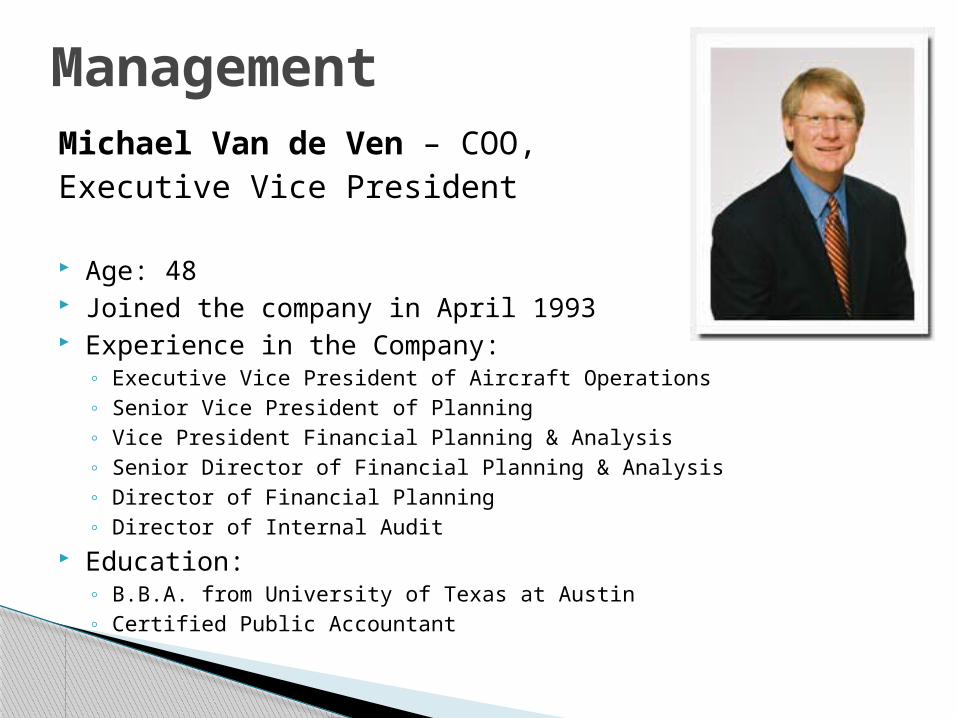
Michael Van de Ven – COO, Executive Vice President
Age: 48 Joined the company in April 1993 Experience in the Company:
◦ Executive Vice President of Aircraft Operations◦ Senior Vice President of Planning◦ Vice President Financial Planning & Analysis◦ Senior Director of Financial Planning & Analysis◦ Director of Financial Planning◦ Director of Internal Audit
Education:◦ B.B.A. from University of Texas at Austin◦ Certified Public Accountant
Management
Southwest AirlinesFinancial Analysis
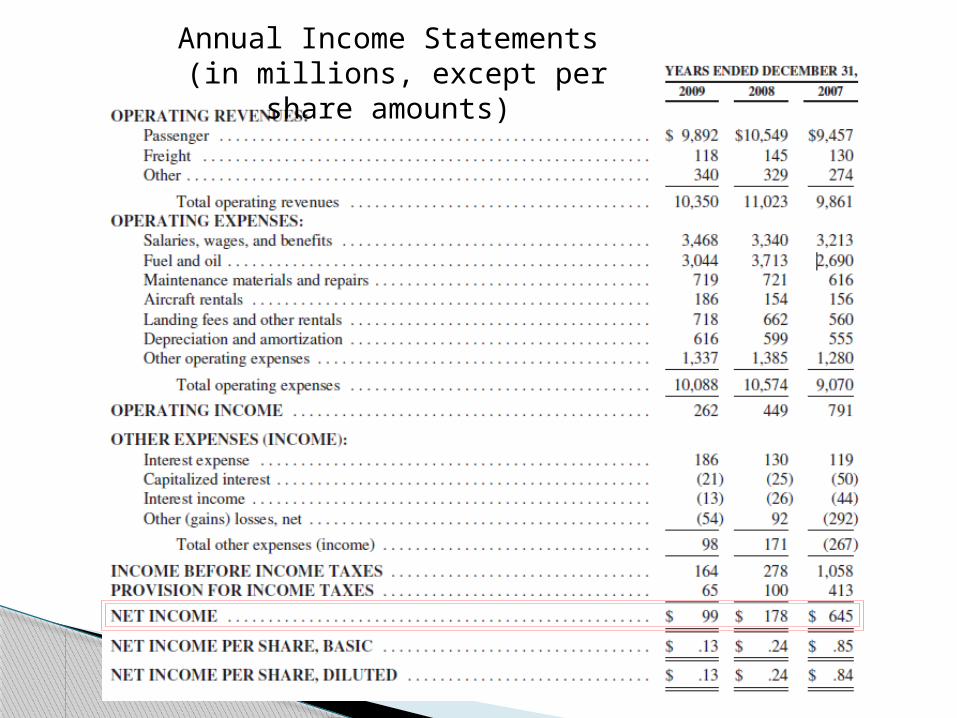
Annual Income Statements (in millions, except per share amounts)
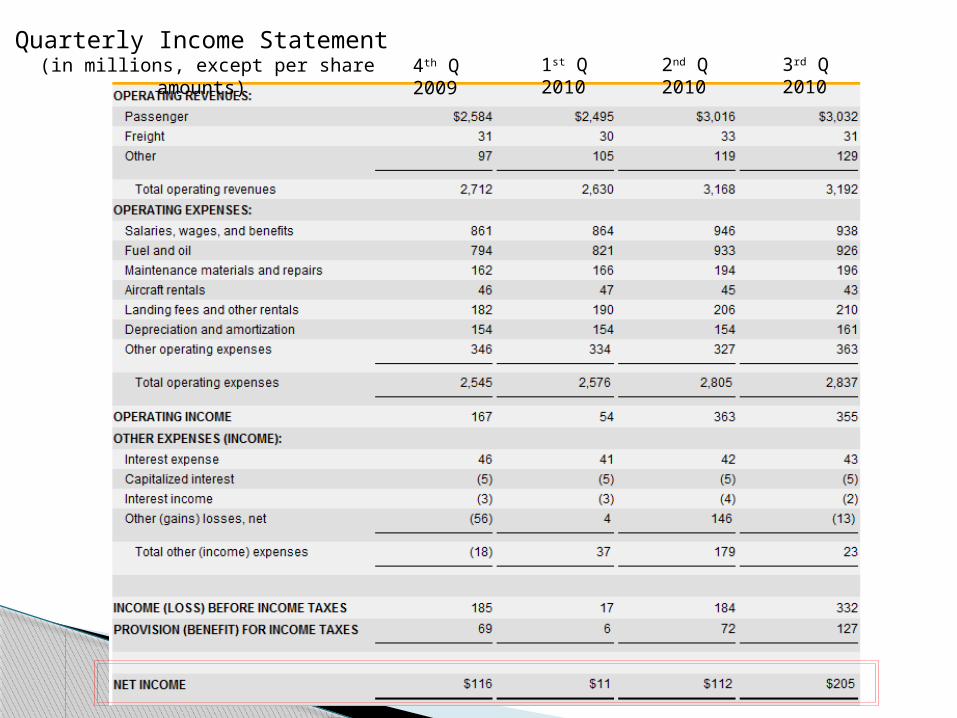
4th Q 2009
1st Q 2010
2nd Q 2010
3rd Q 2010
Quarterly Income Statement (in millions, except per share amounts)
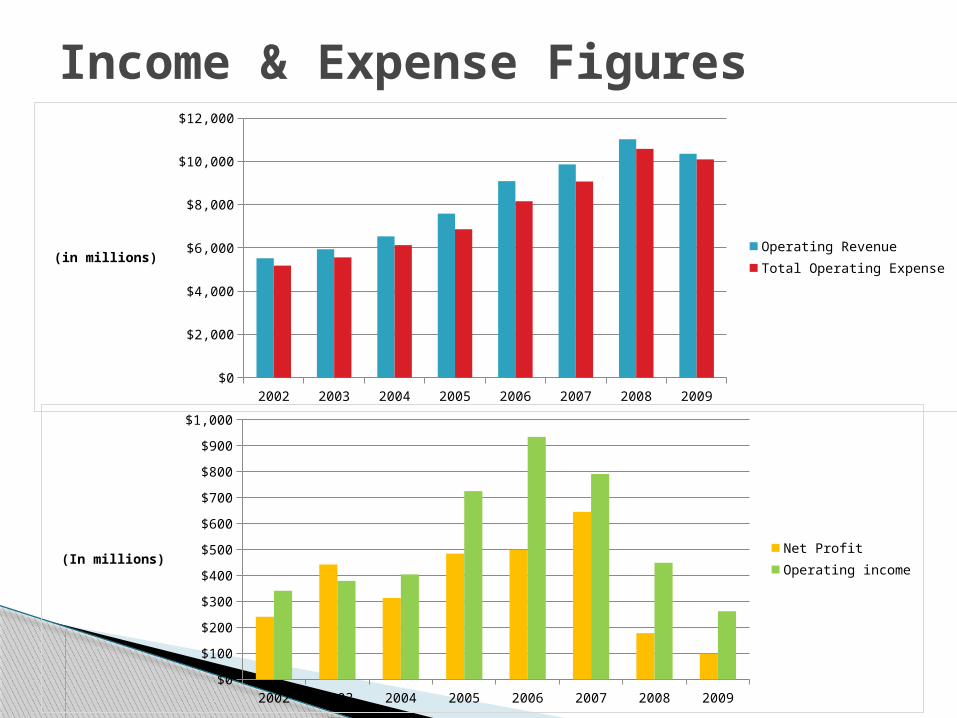
Income & Expense Figures
2002 2003 2004 2005 2006 2007 2008 2009$0
$2,000
$4,000
$6,000
$8,000
$10,000
$12,000
Operating RevenueTotal Operating Expense
(in millions)
2002 2003 2004 2005 2006 2007 2008 2009$0
$100
$200
$300
$400
$500
$600
$700
$800
$900
$1,000
Net ProfitOperating income
(In millions)
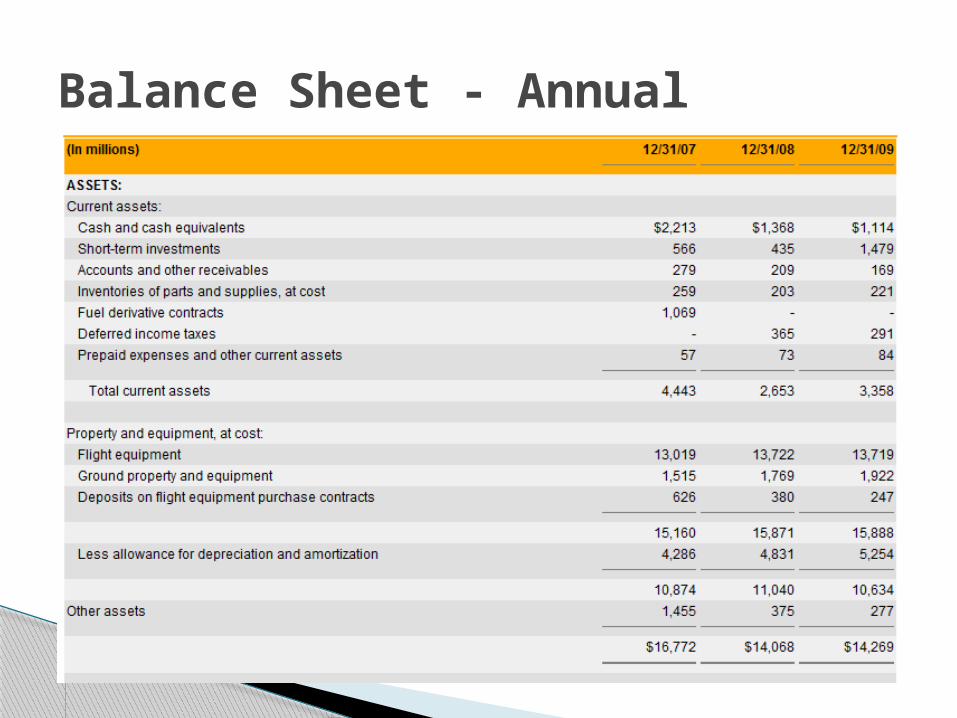
Balance Sheet - Annual
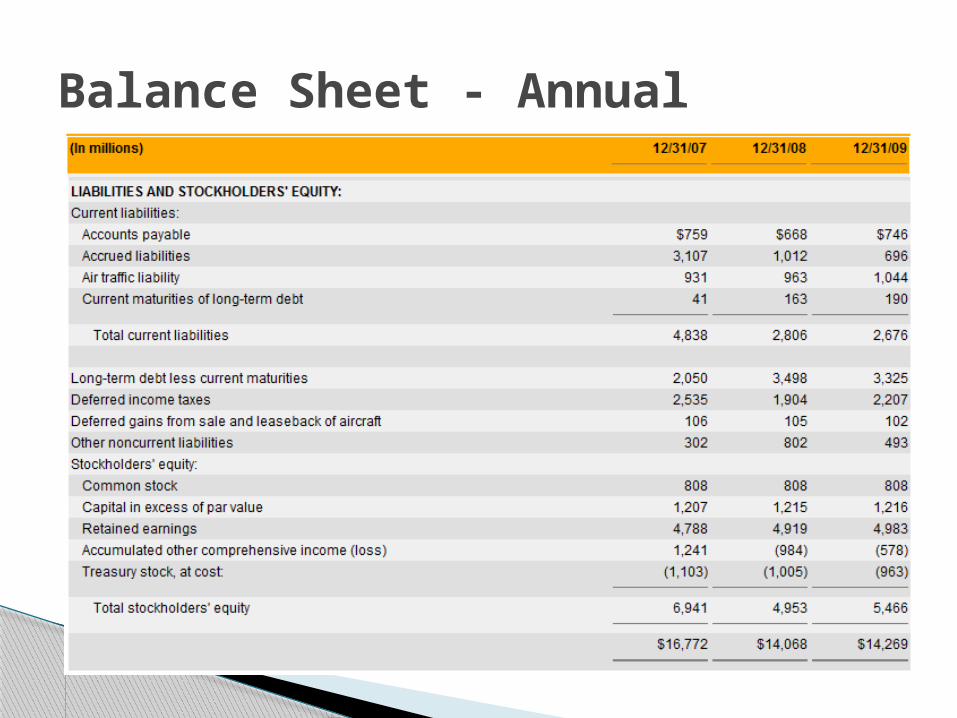
Balance Sheet - Annual
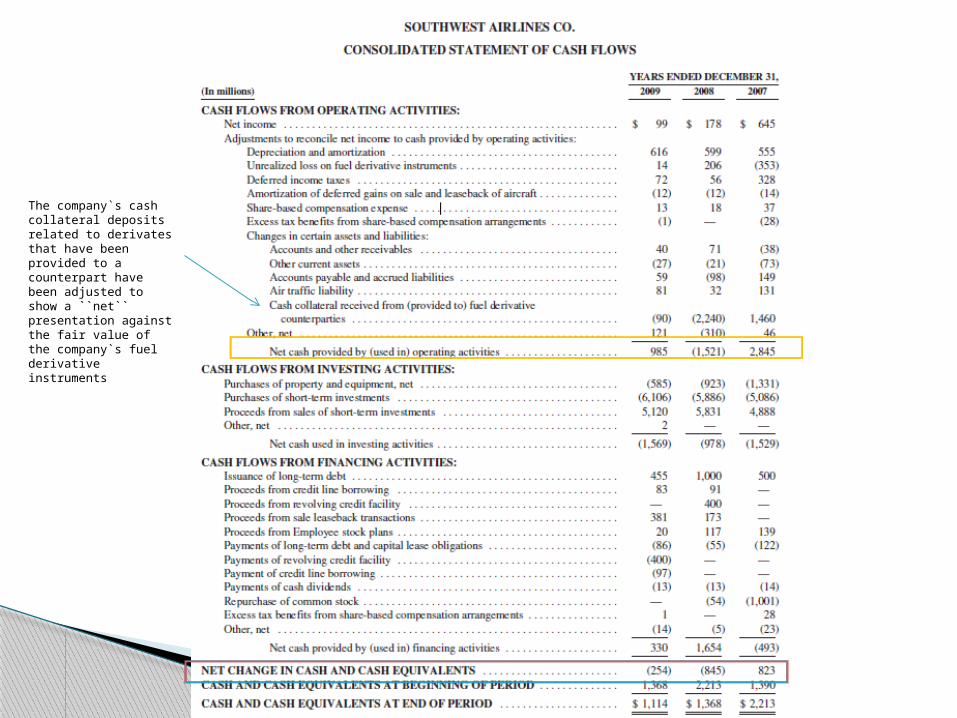
The company`s cash collateral deposits related to derivates that have been provided to a counterpart have been adjusted to show a ``net`` presentation against the fair value of the company`s fuel derivative instruments
Recommendation
HOLD
British Airwys
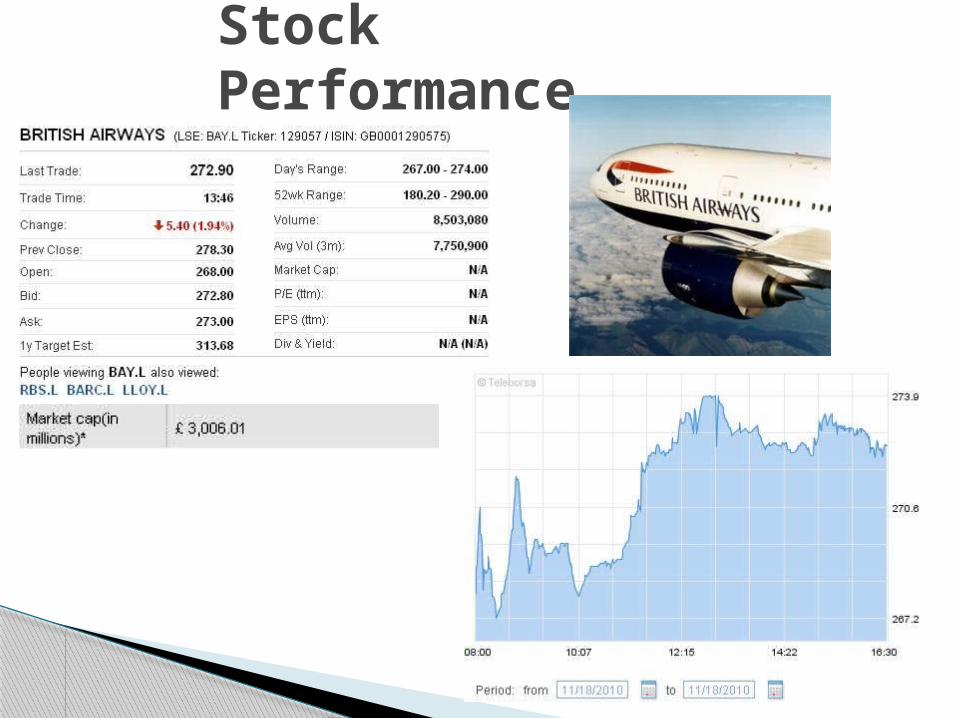
Stock Performance
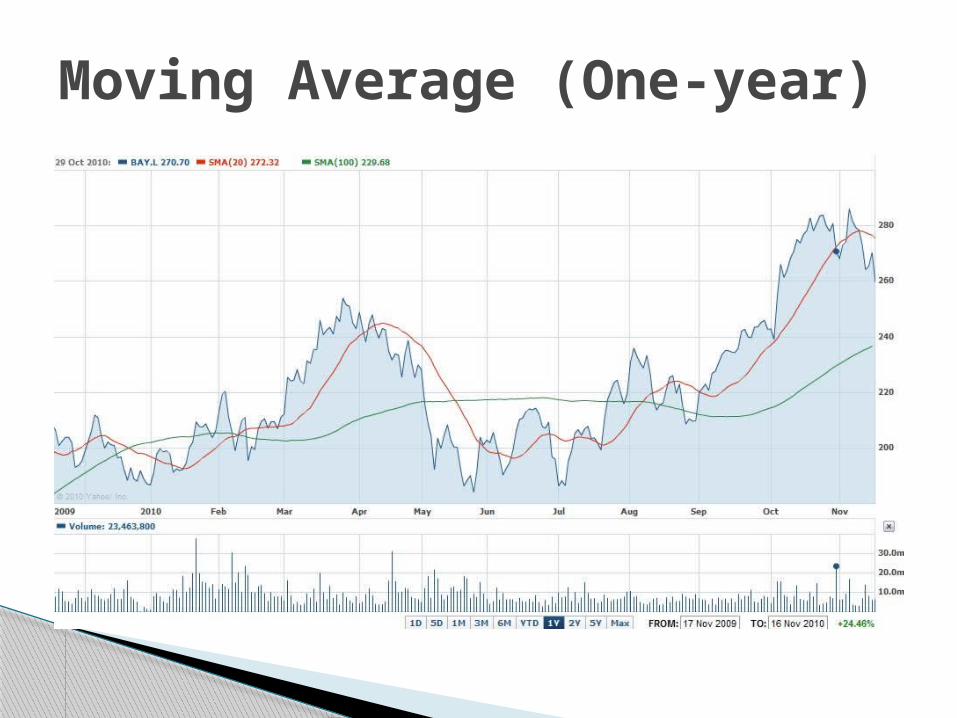
Moving Average (One-year)
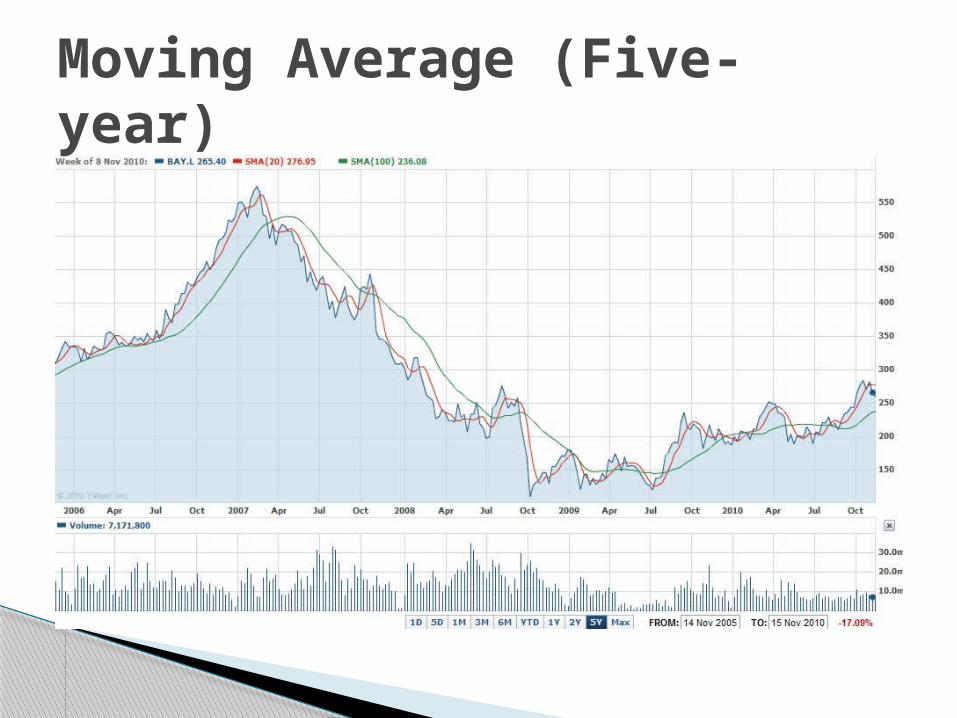
Moving Average (Five-year)
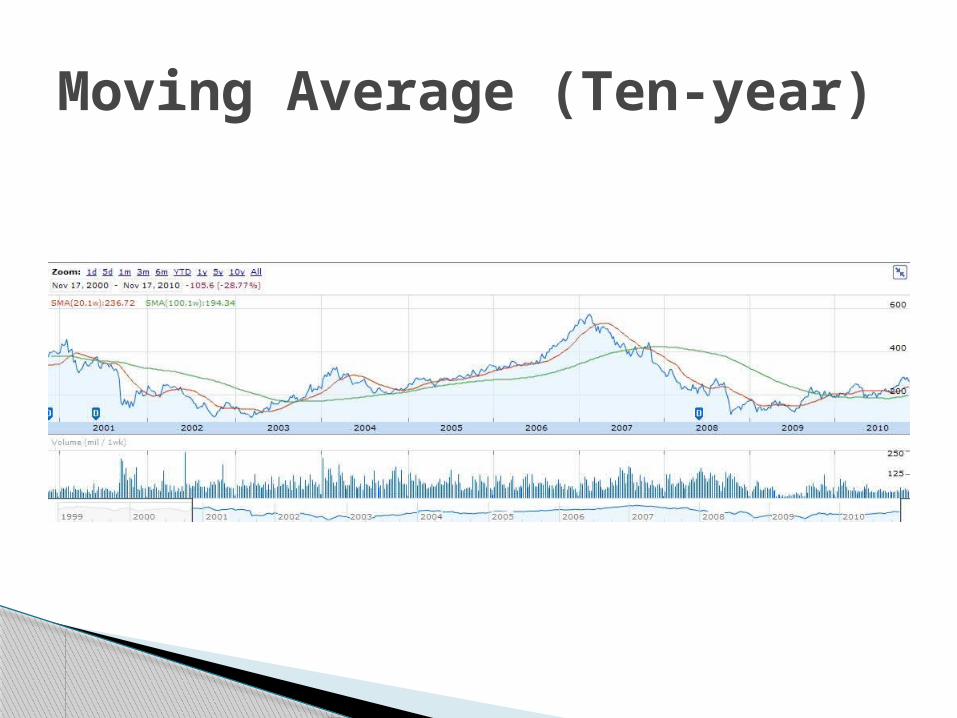
Moving Average (Ten-year)
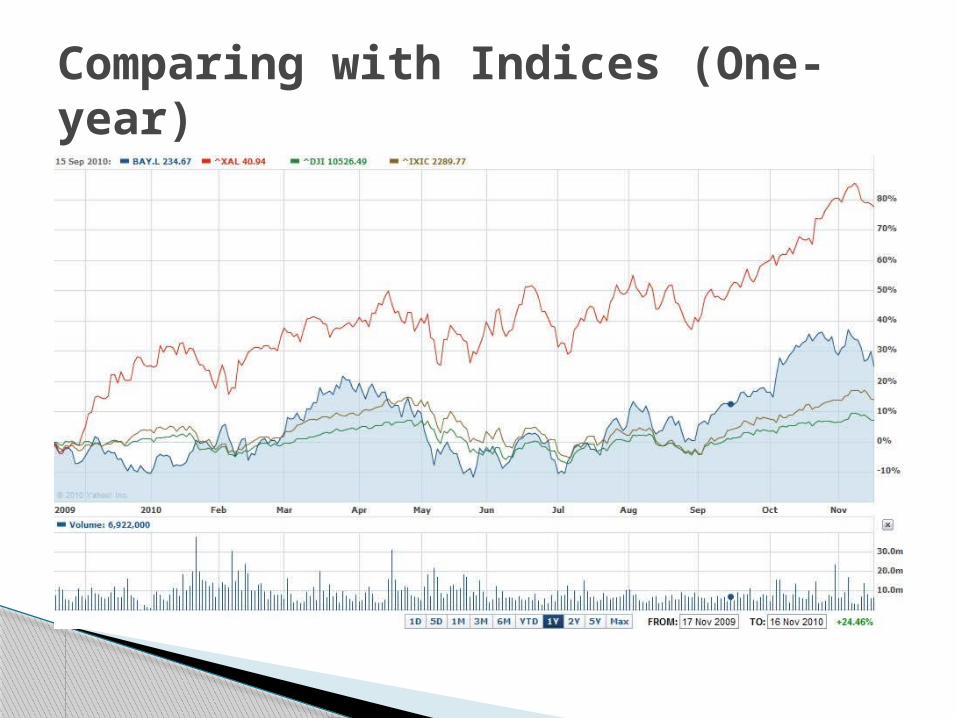
Comparing with Indices (One-year)
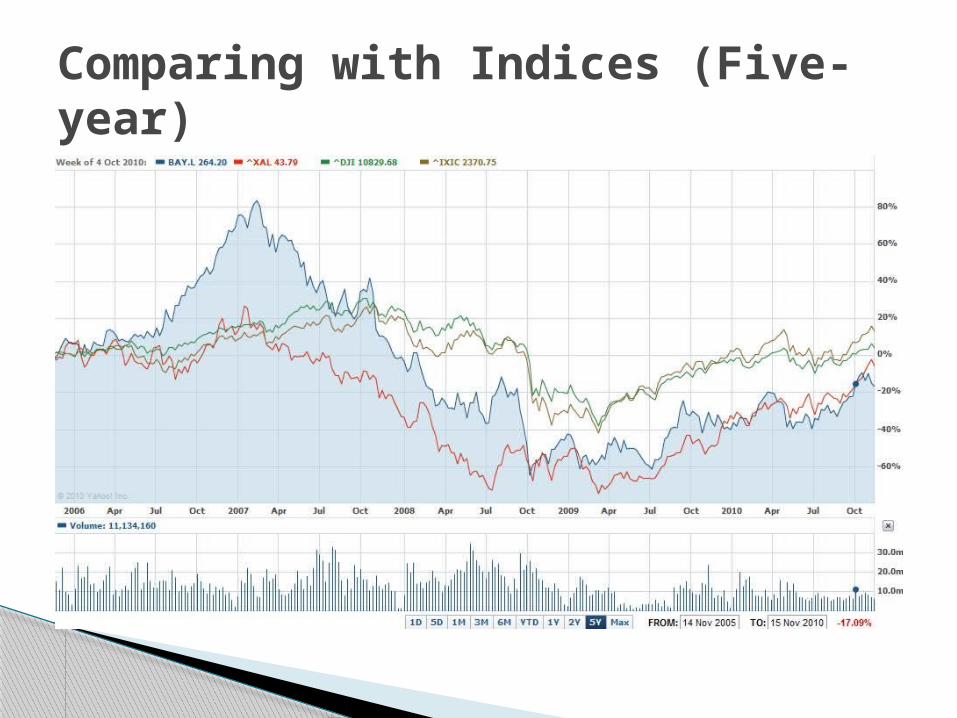
Comparing with Indices (Five-year)
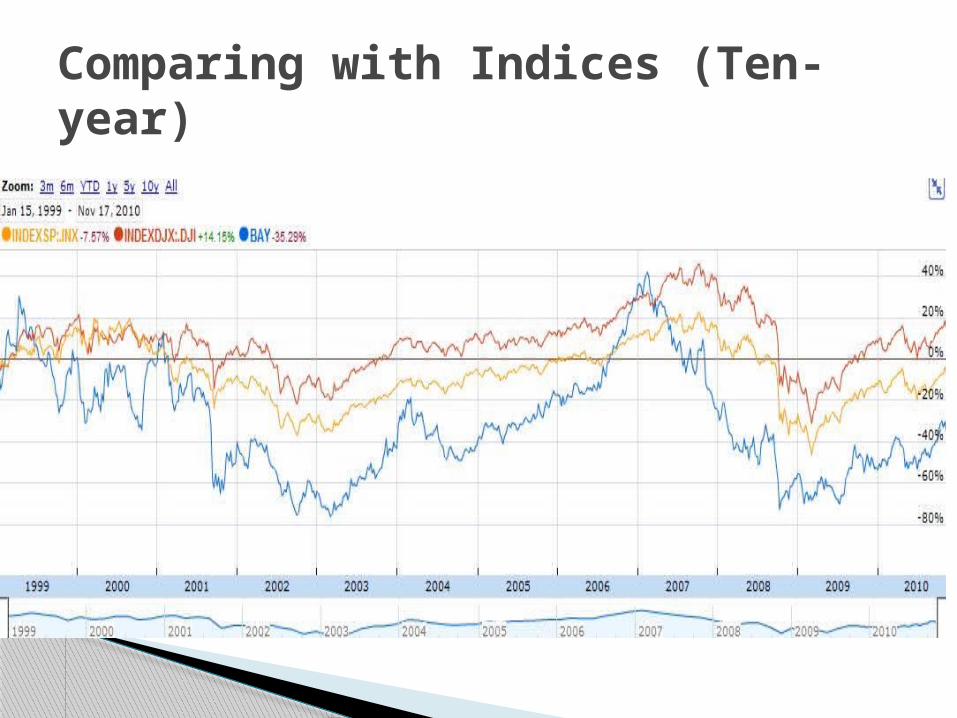
Comparing with Indices (Ten-year)
UK’s largest international scheduled airline
One of the largest Network-Legacy Airlines
Member of Oneworld Alliance
Flying to more than 300 destinations
HQ in London: Heathrow, Gatwick
Overview
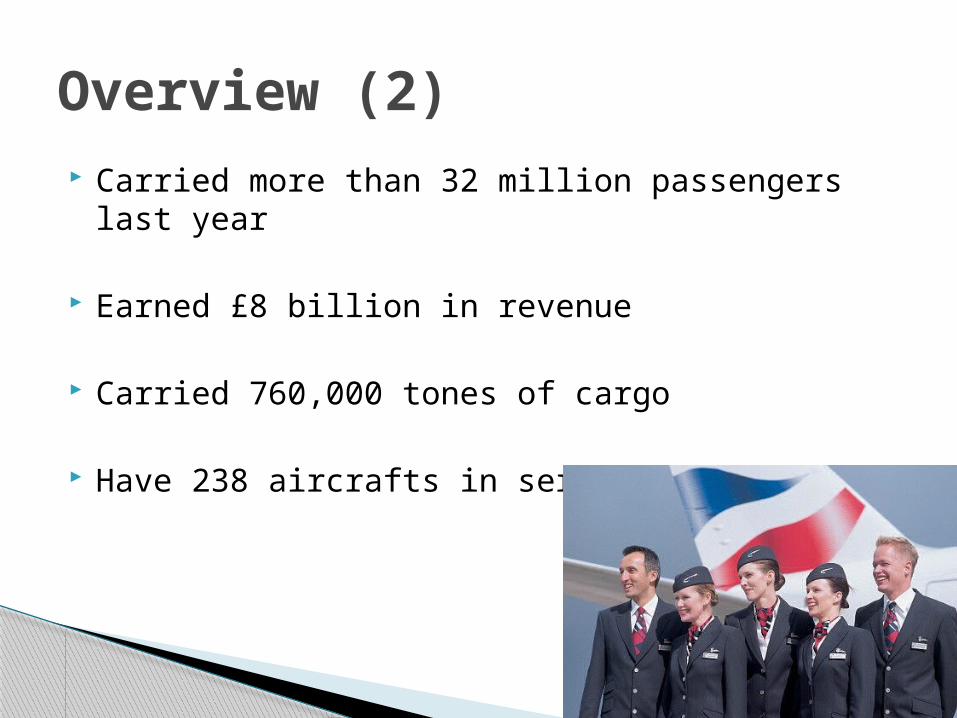
Carried more than 32 million passengers last year
Earned £8 billion in revenue
Carried 760,000 tones of cargo
Have 238 aircrafts in service
Overview (2)
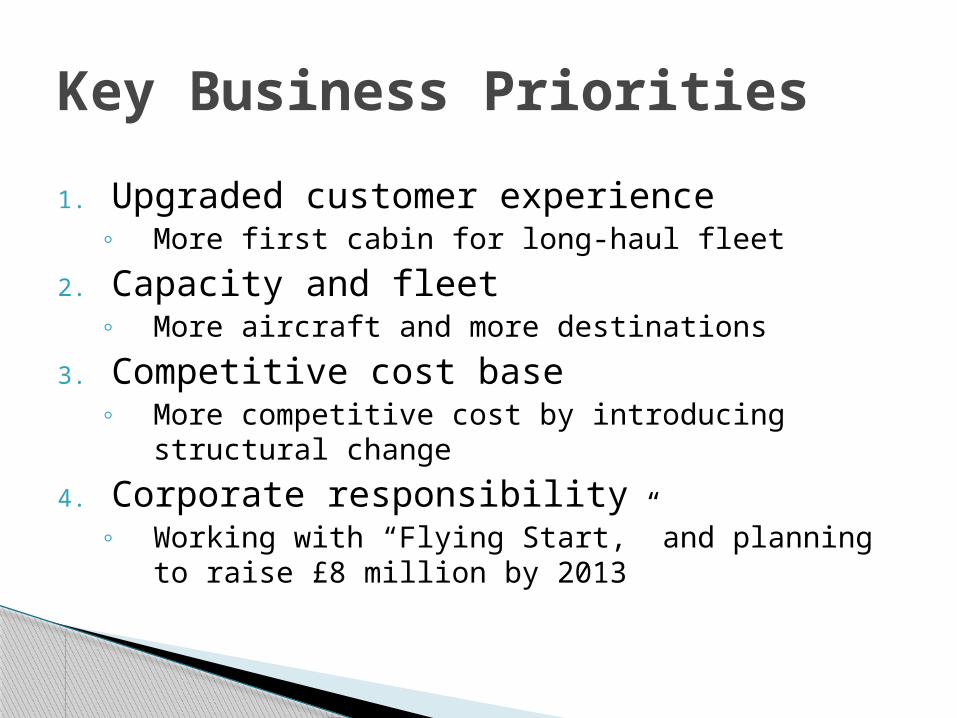
1. Upgraded customer experience◦ More first cabin for long-haul fleet
2. Capacity and fleet◦ More aircraft and more destinations
3. Competitive cost base◦ More competitive cost by introducing structural
change
4. Corporate responsibility◦ Working with “Flying Start,” and planning to raise
£8 million by 2013
Key Business Priorities
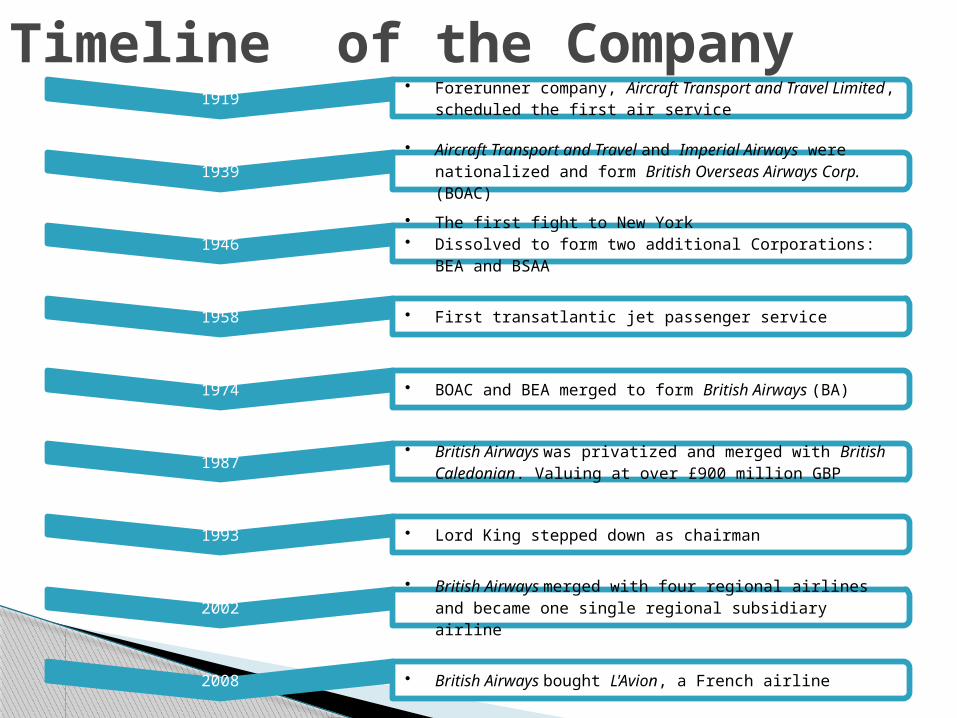
1919• Forerunner company, Aircraft Transport and Travel
Limited, scheduled the first air service
1939• Aircraft Transport and Travel and Imperial Airways were
nationalized and form British Overseas Airways Corp. (BOAC)
1946• The first fight to New York• Dissolved to form two additional Corporations: BEA and
BSAA
1958 • First transatlantic jet passenger service
1974 • BOAC and BEA merged to form British Airways (BA)
1987• British Airways was privatized and merged with British
Caledonian. Valuing at over £900 million GBP
1993 • Lord King stepped down as chairman
2002• British Airways merged with four regional airlines and
became one single regional subsidiary airline
2008 • British Airways bought L'Avion, a French airline
Timeline of the Company
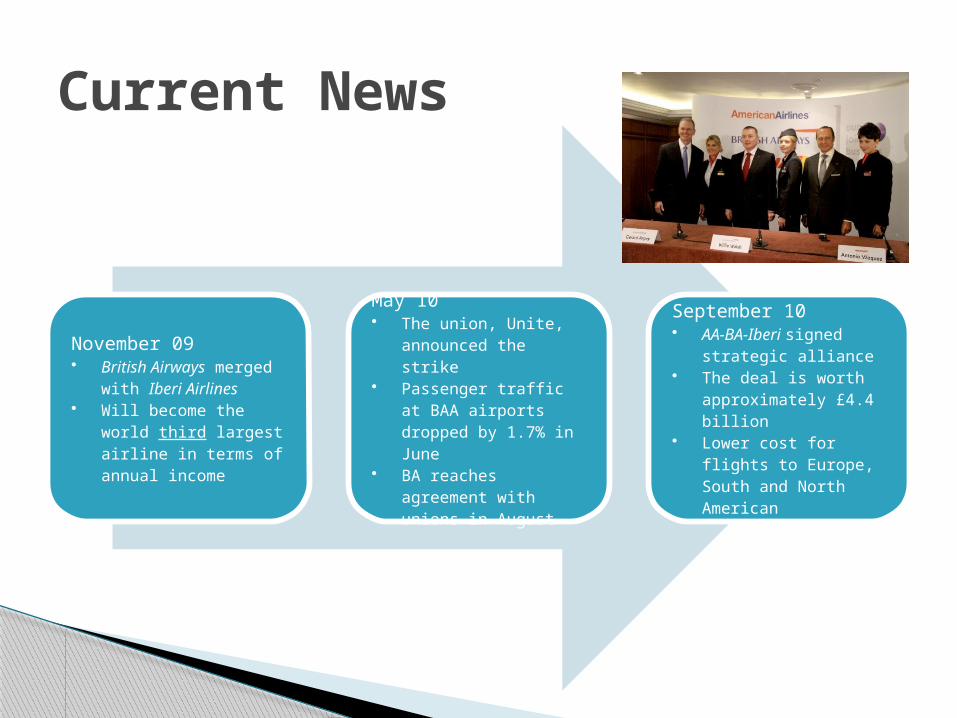
November 09• British Airways
merged with Iberi Airlines
• Will become the world third largest airline in terms of annual income
May 10• The union, Unite,
announced the strike• Passenger traffic at
BAA airports dropped by 1.7% in June
• BA reaches agreement with unions in August
September 10• AA-BA-Iberi signed
strategic alliance• The deal is worth
approximately £4.4 billion
• Lower cost for flights to Europe, South and North American
Current News
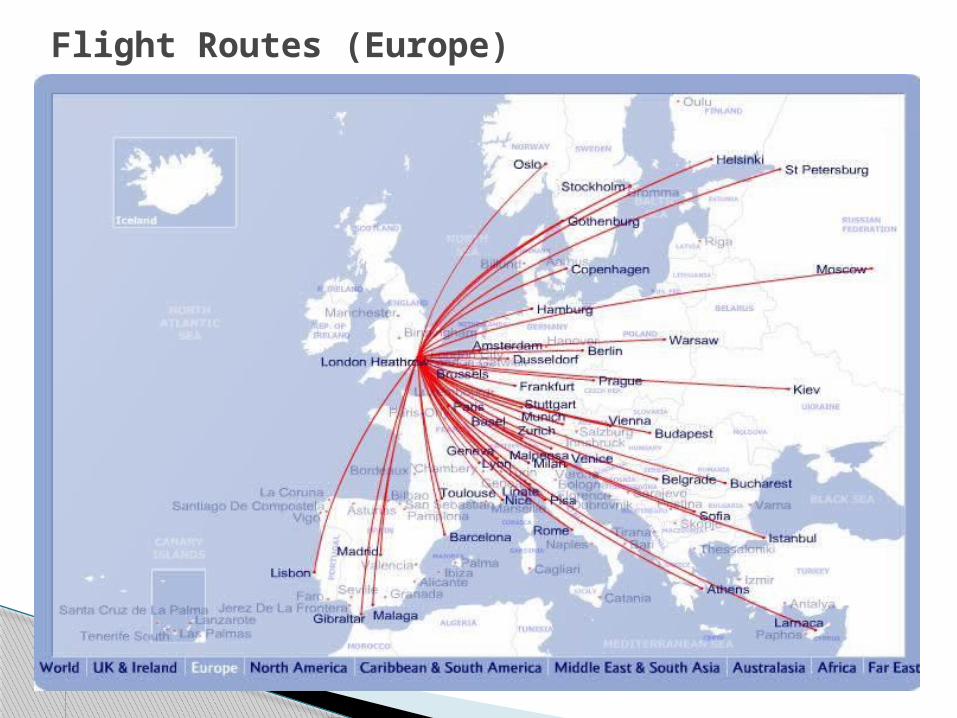
Flight Routes (Europe)
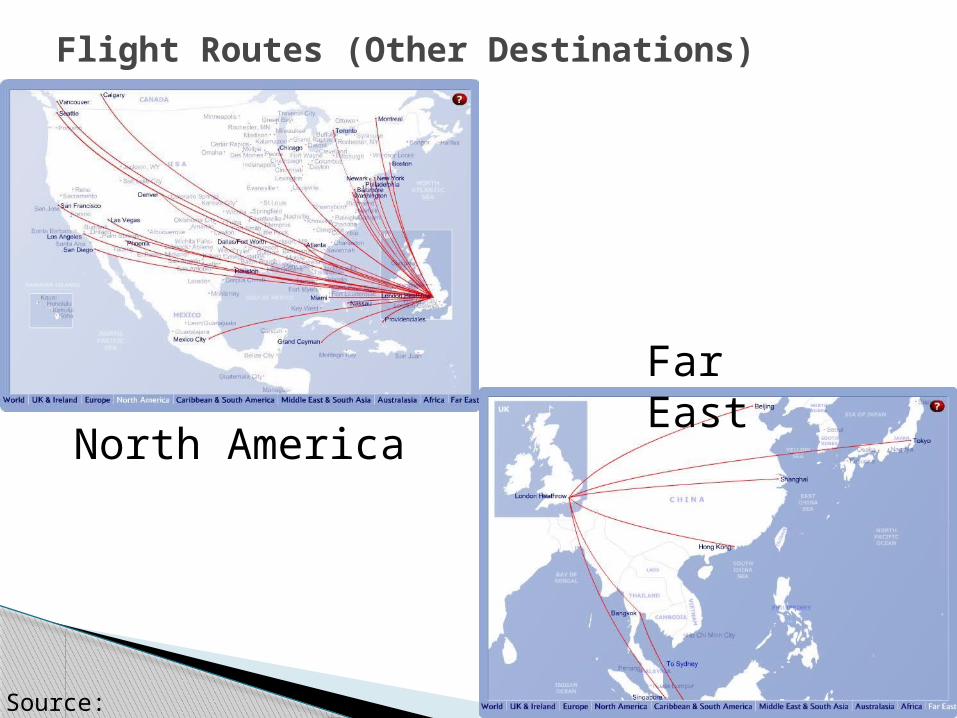
Flight Routes (Other Destinations)
North America
Far East
Source: BA
Management
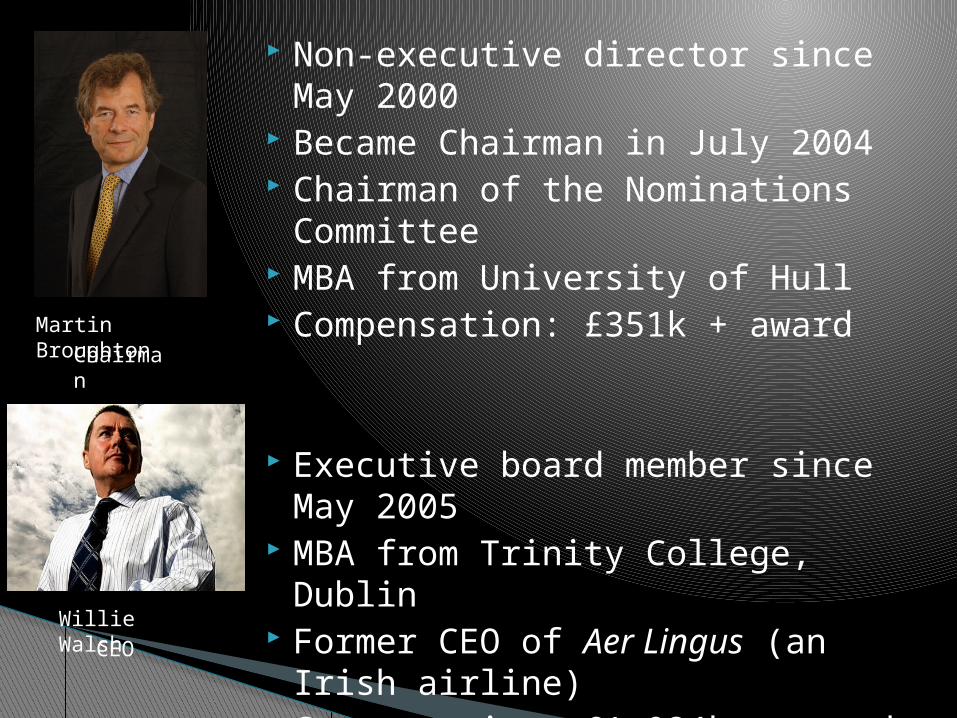
Non-executive director since May 2000 Became Chairman in July 2004 Chairman of the Nominations
Committee MBA from University of Hull Compensation: £351k + award
Executive board member since May 2005
MBA from Trinity College, Dublin Former CEO of Aer Lingus (an Irish
airline) Compensation: £1,024k + award
Martin BroughtonChairma
n
Willie WalshCEO
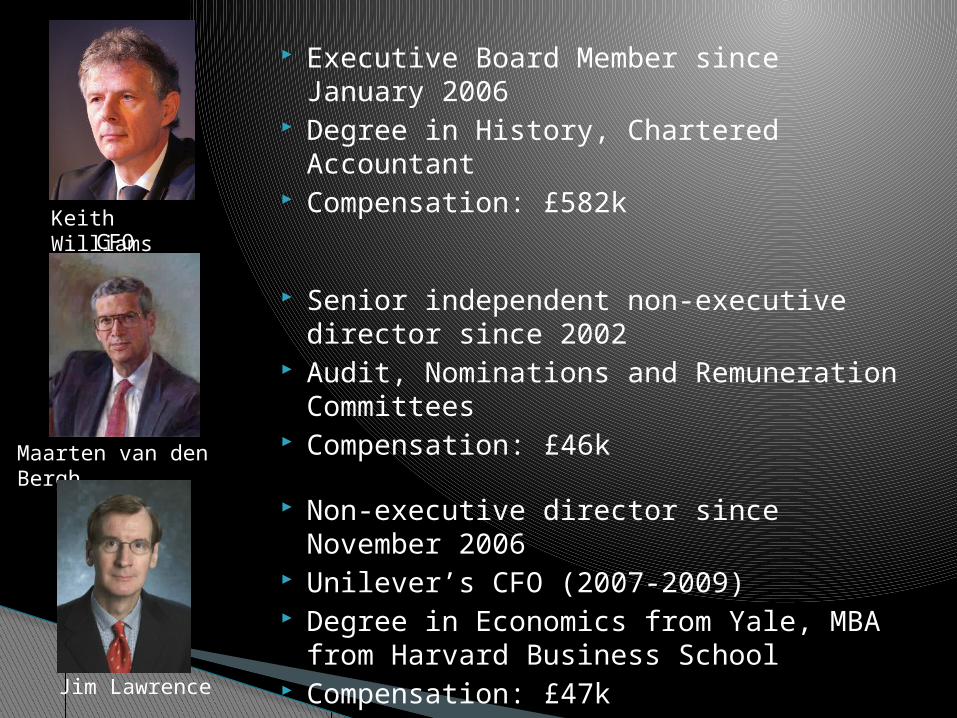
Executive Board Member since January 2006
Degree in History, Chartered Accountant
Compensation: £582k
Senior independent non-executive director since 2002
Audit, Nominations and Remuneration Committees
Compensation: £46k
Non-executive director since November 2006
Unilever’s CFO (2007-2009) Degree in Economics from Yale, MBA
from Harvard Business School Compensation: £47k
Keith WilliamsCFO
Maarten van den Bergh
Jim Lawrence
Financial Analysis
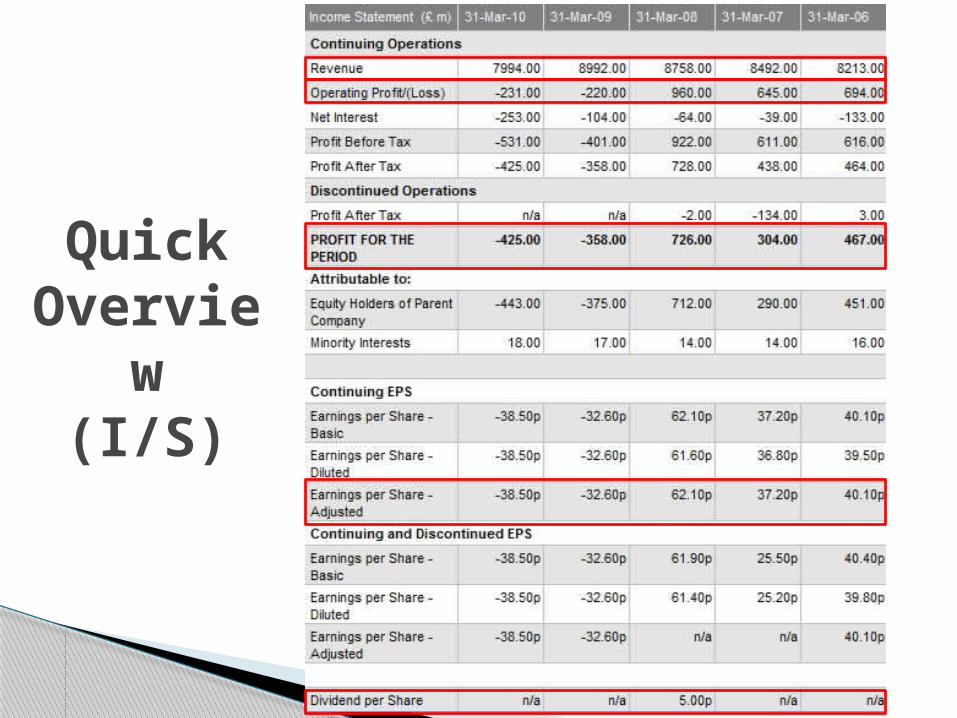
Quick Overvie
w(I/S)
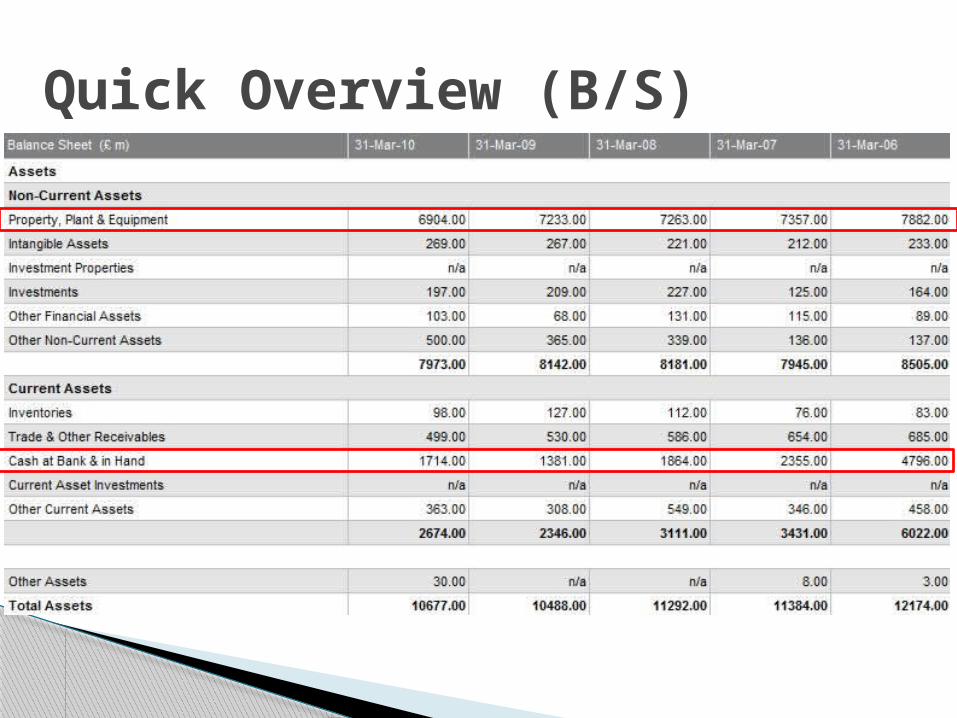
Quick Overview (B/S)
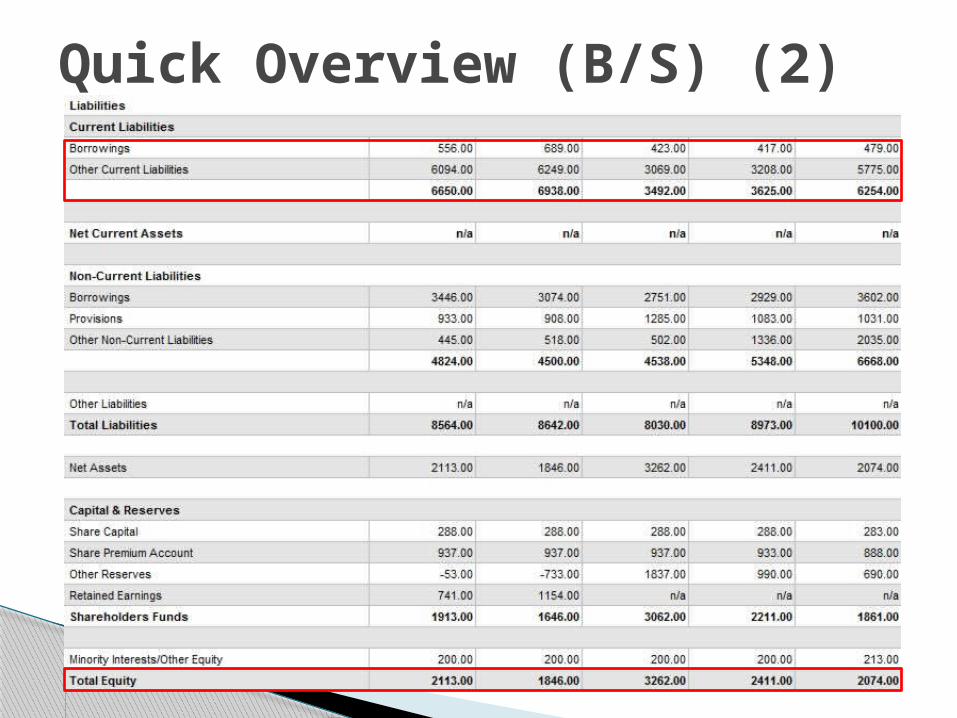
Quick Overview (B/S) (2)
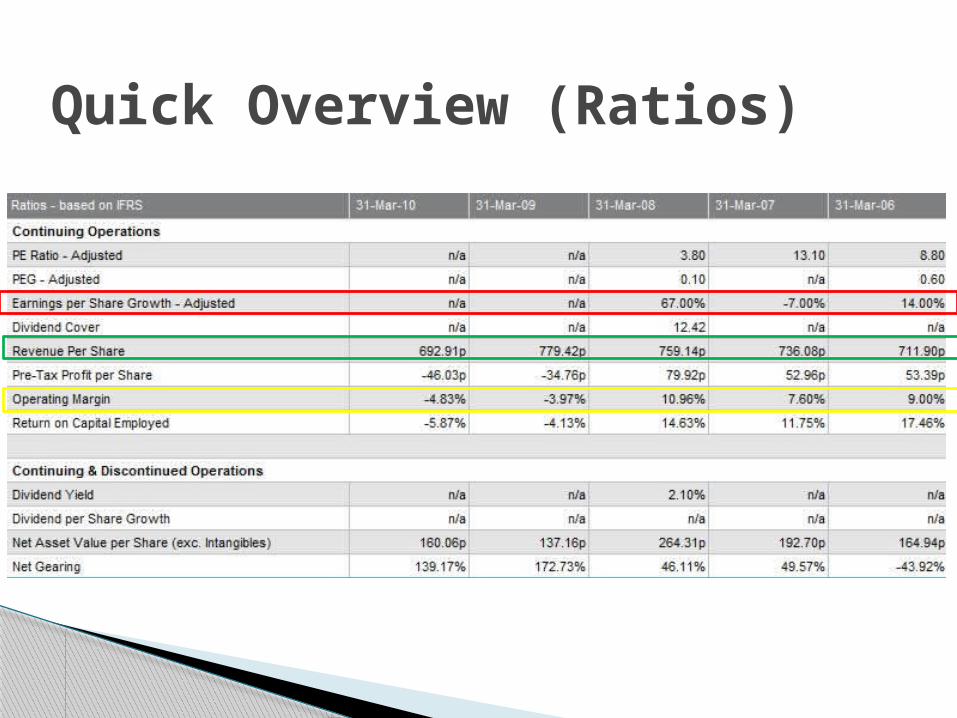
Quick Overview (Ratios)
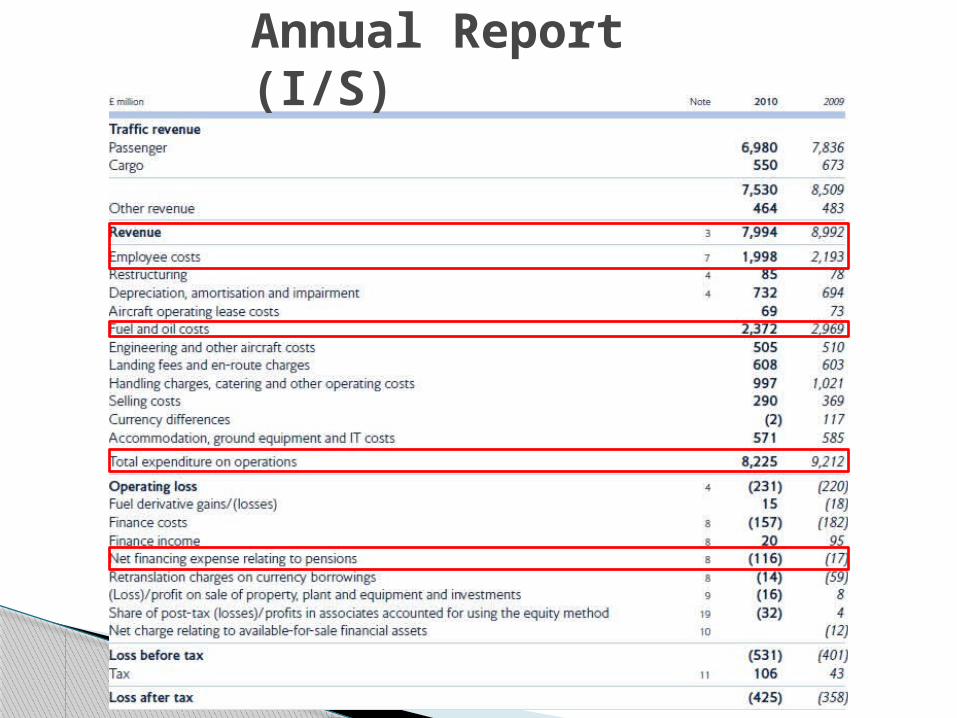
Annual Report (I/S)
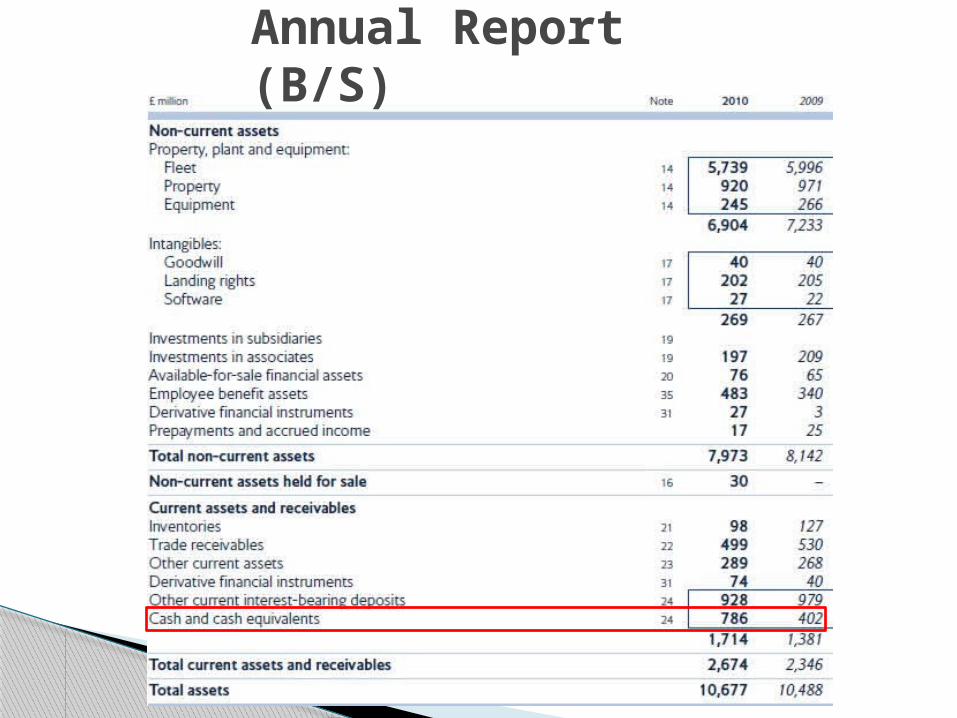
Annual Report (B/S)
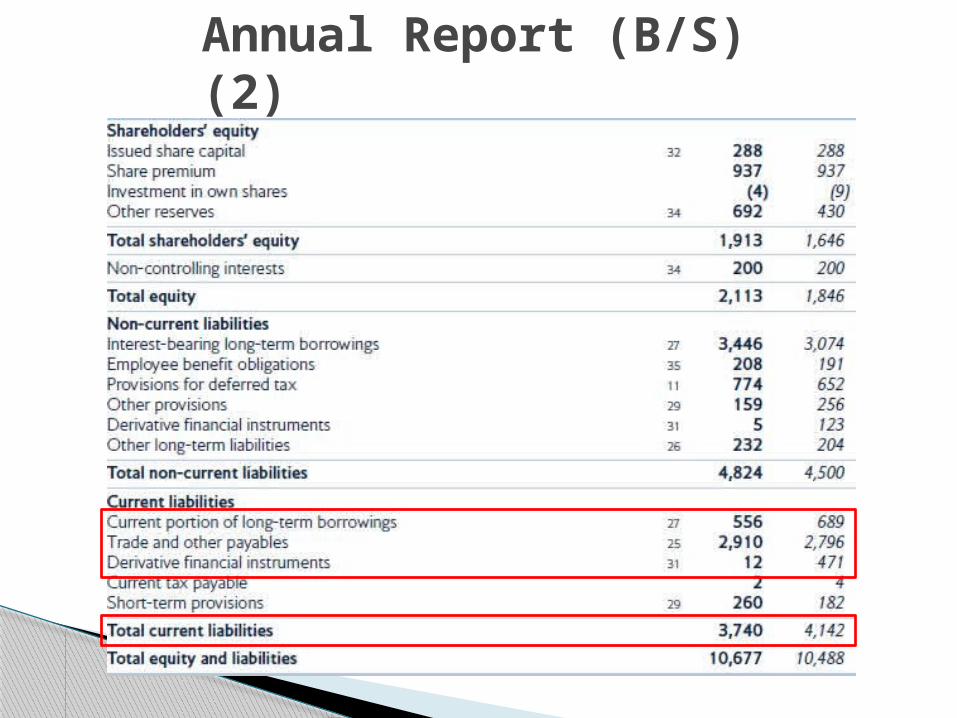
Annual Report (B/S) (2)
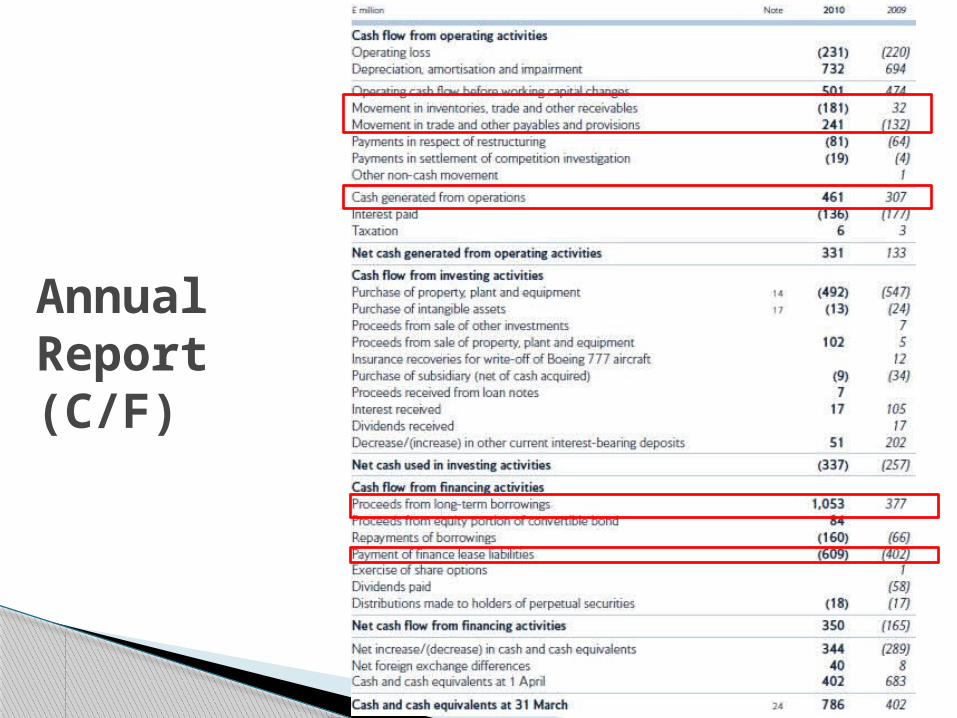
Annual Report (C/F)
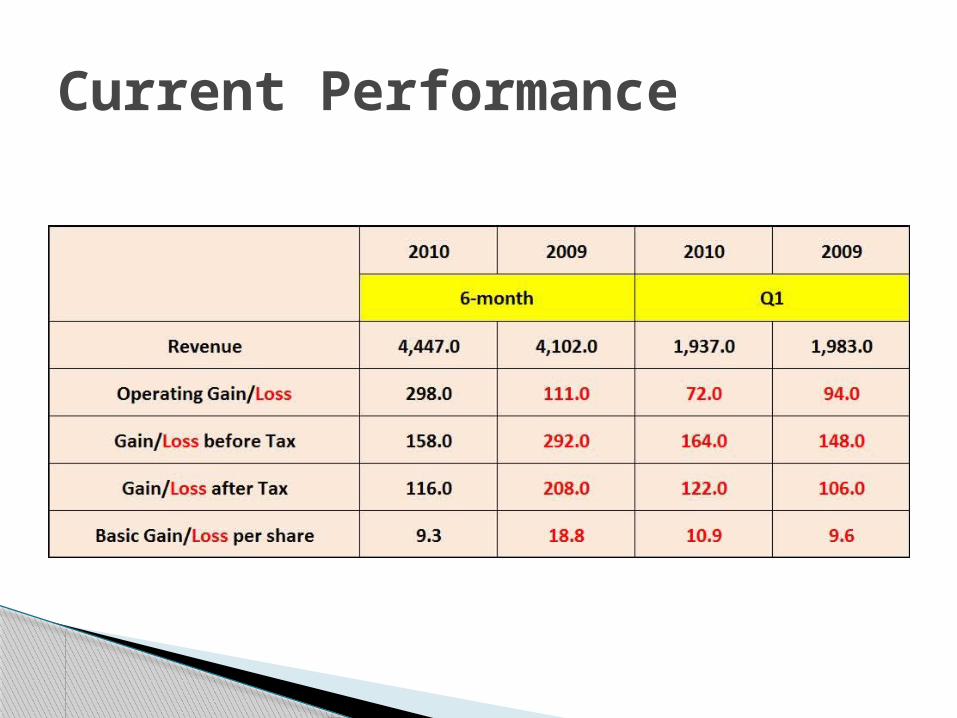
Current Performance
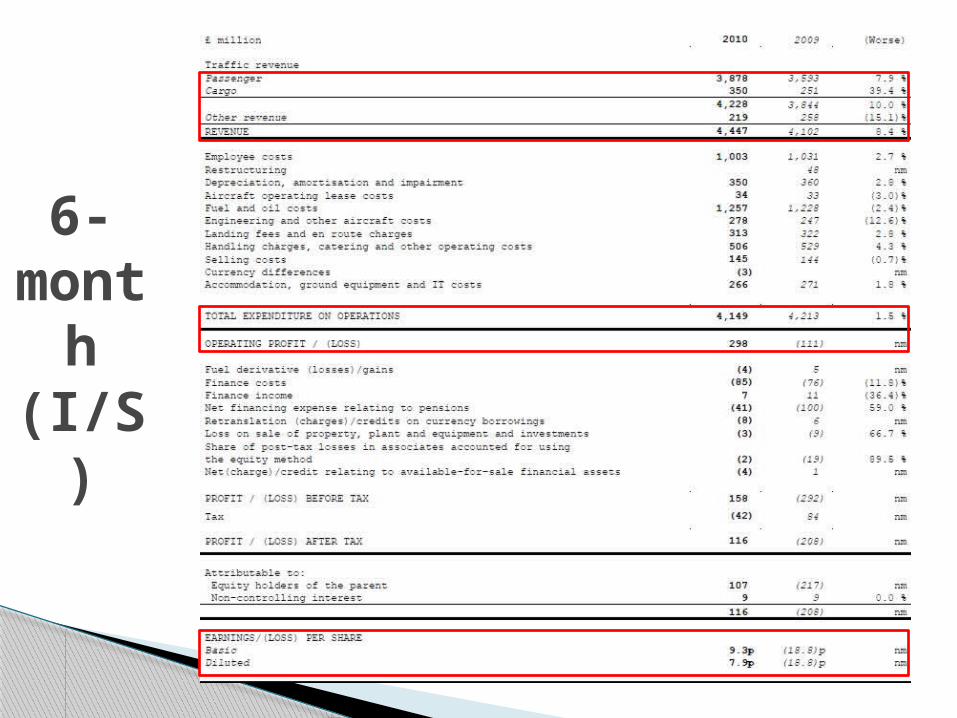
6-month
(I/S)
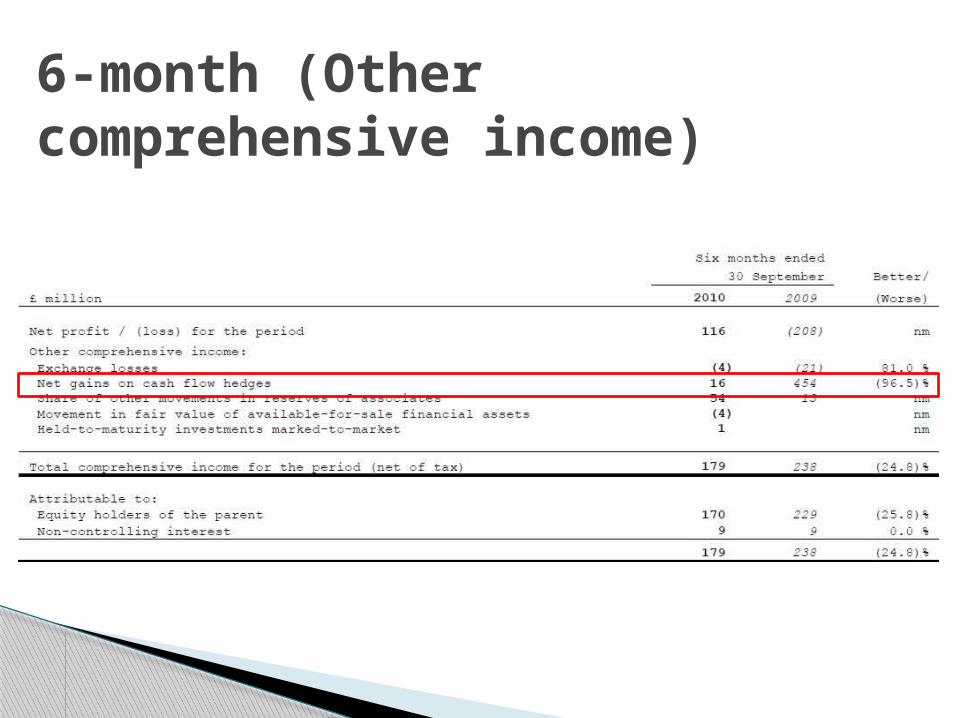
6-month (Other comprehensive income)
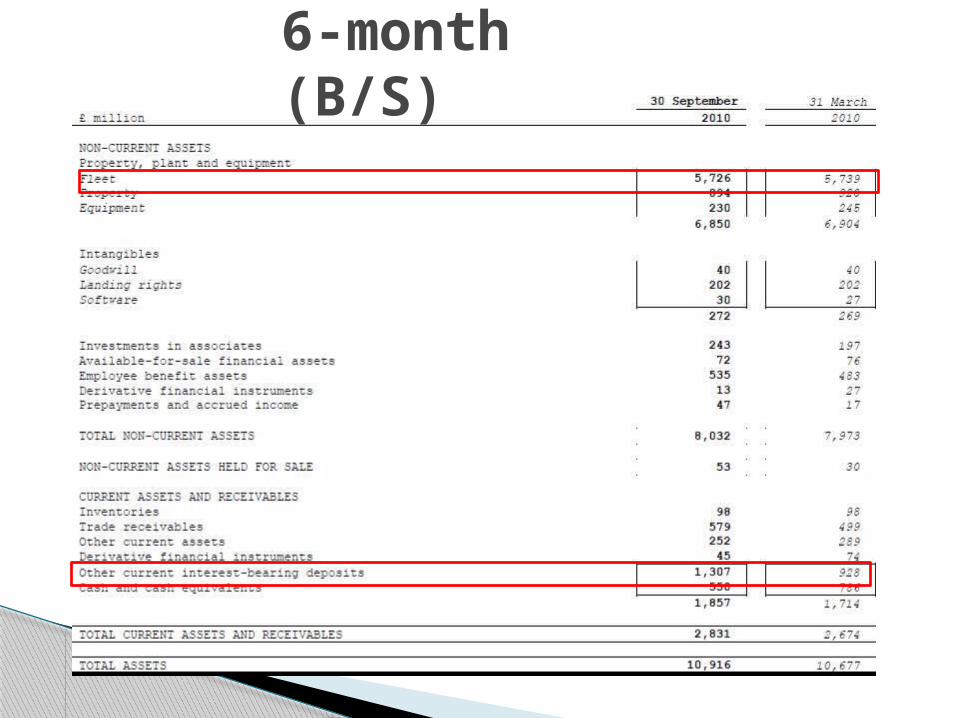
6-month (B/S)
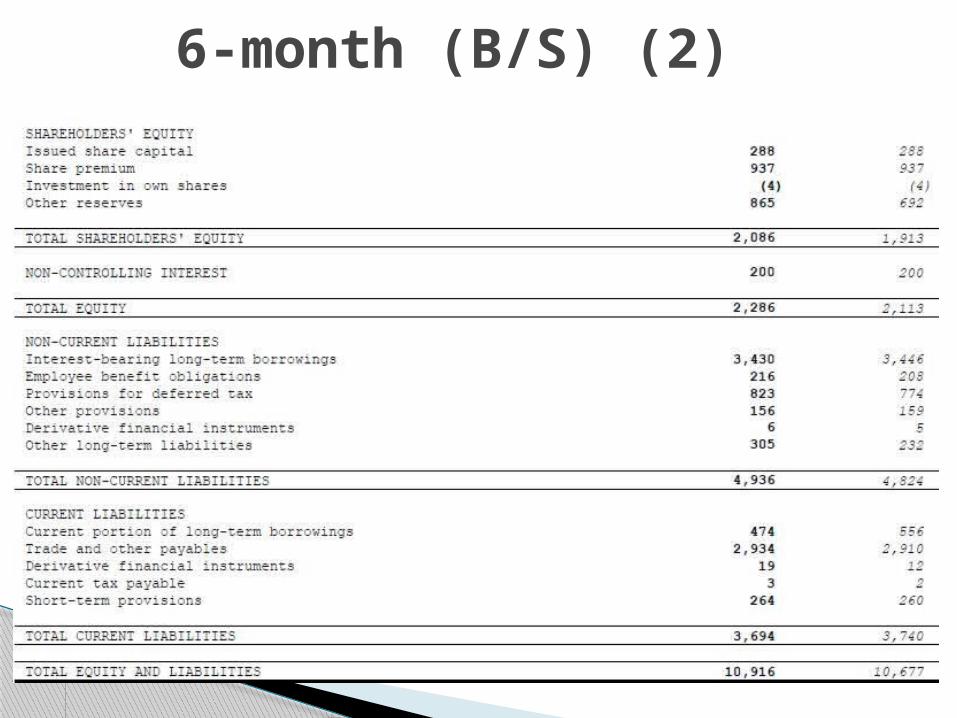
6-month (B/S) (2)
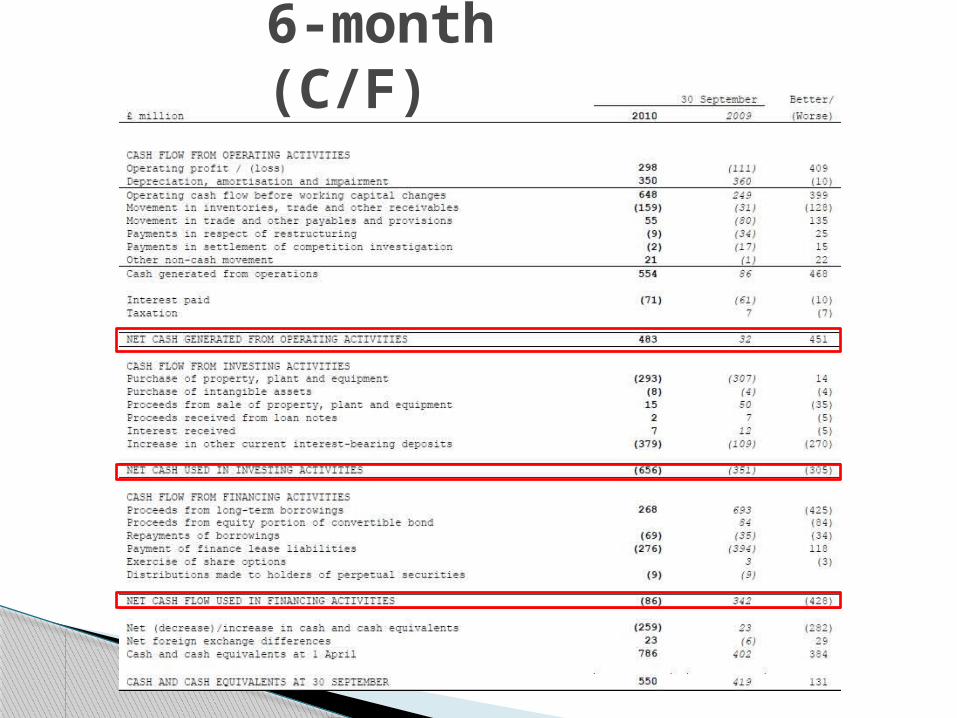
6-month (C/F)
Recommendation
HOLD
Singapore Airline
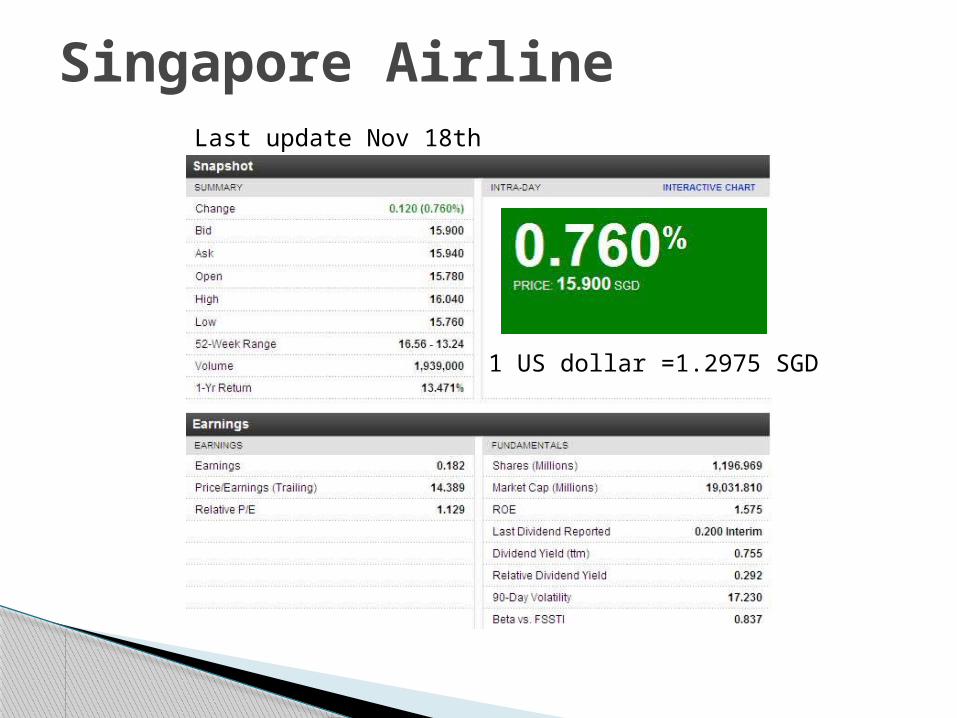
1 US dollar =1.2975 SGD
Last update Nov 18th
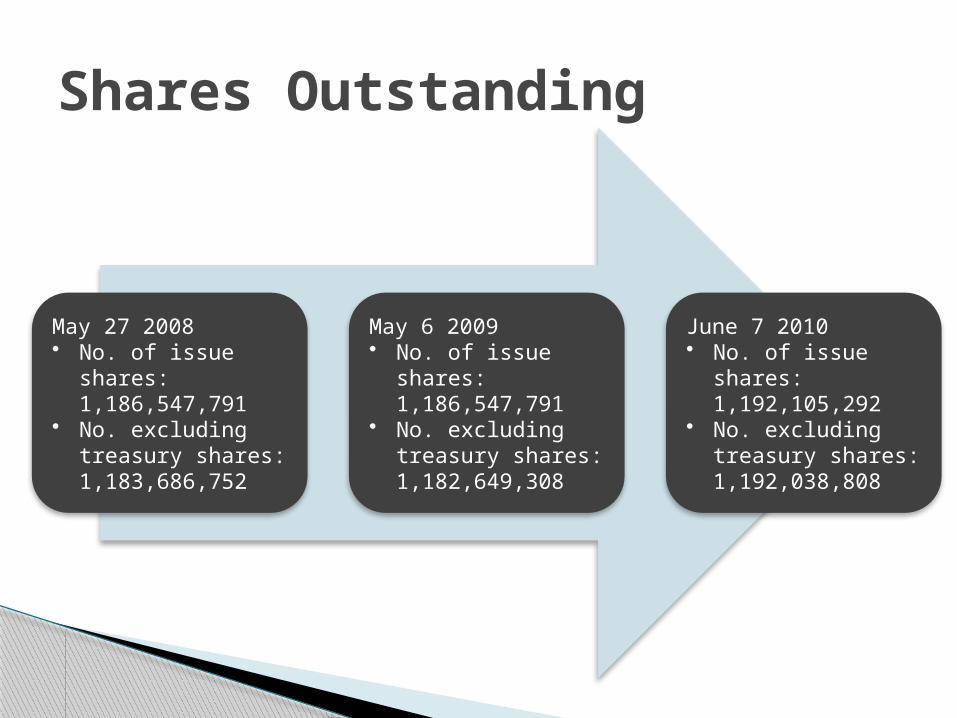
May 27 2008• No. of issue
shares: 1,186,547,791
• No. excluding treasury shares: 1,183,686,752
May 6 2009• No. of issue
shares: 1,186,547,791
• No. excluding treasury shares: 1,182,649,308
June 7 2010• No. of issue
shares: 1,192,105,292
• No. excluding treasury shares: 1,192,038,808
Shares Outstanding
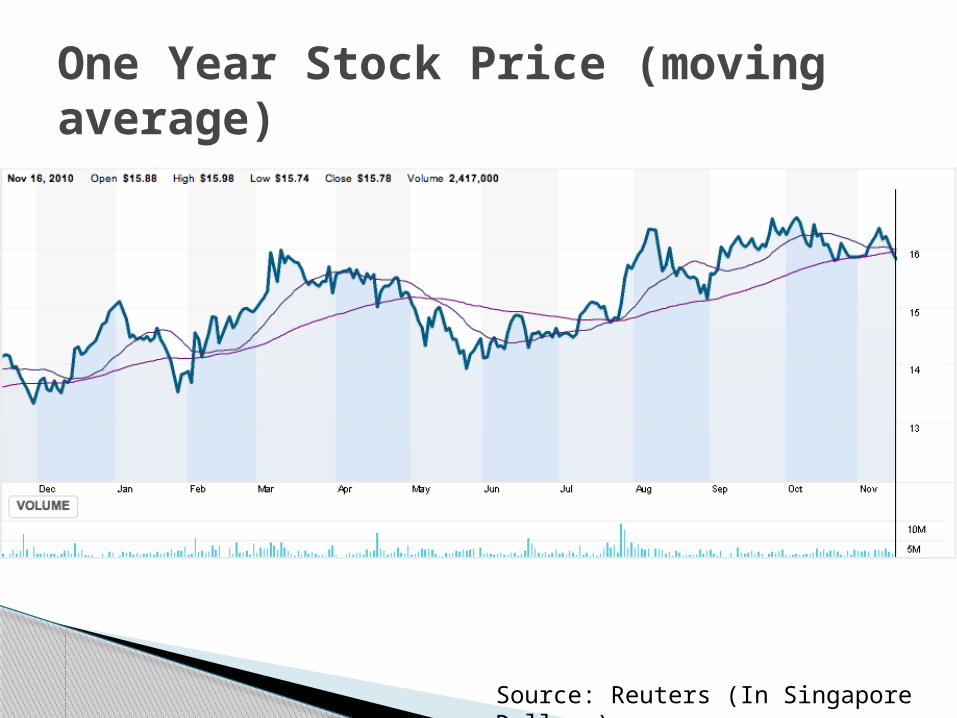
One Year Stock Price (moving average)
Source: Reuters (In Singapore Dollars)
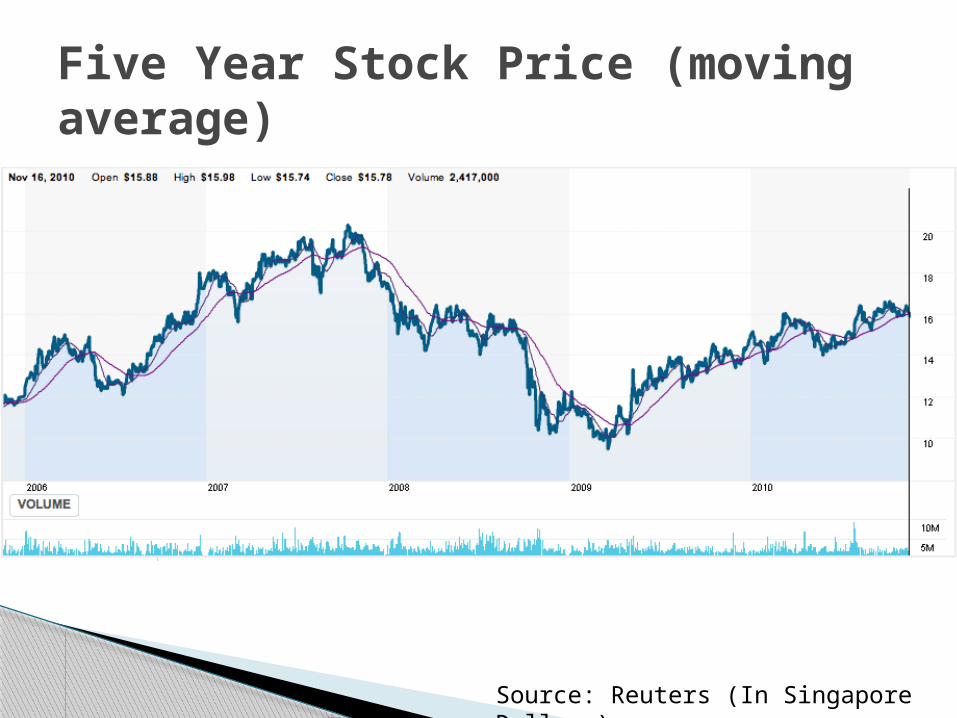
Five Year Stock Price (moving average)
Source: Reuters (In Singapore Dollars)
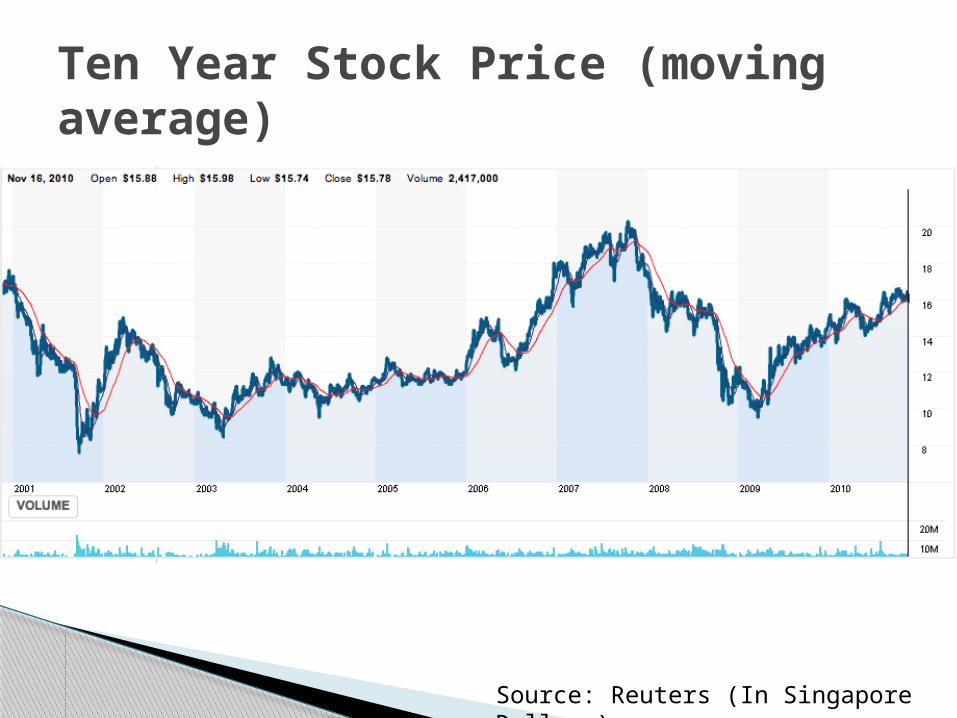
Ten Year Stock Price (moving average)
Source: Reuters (In Singapore Dollars)
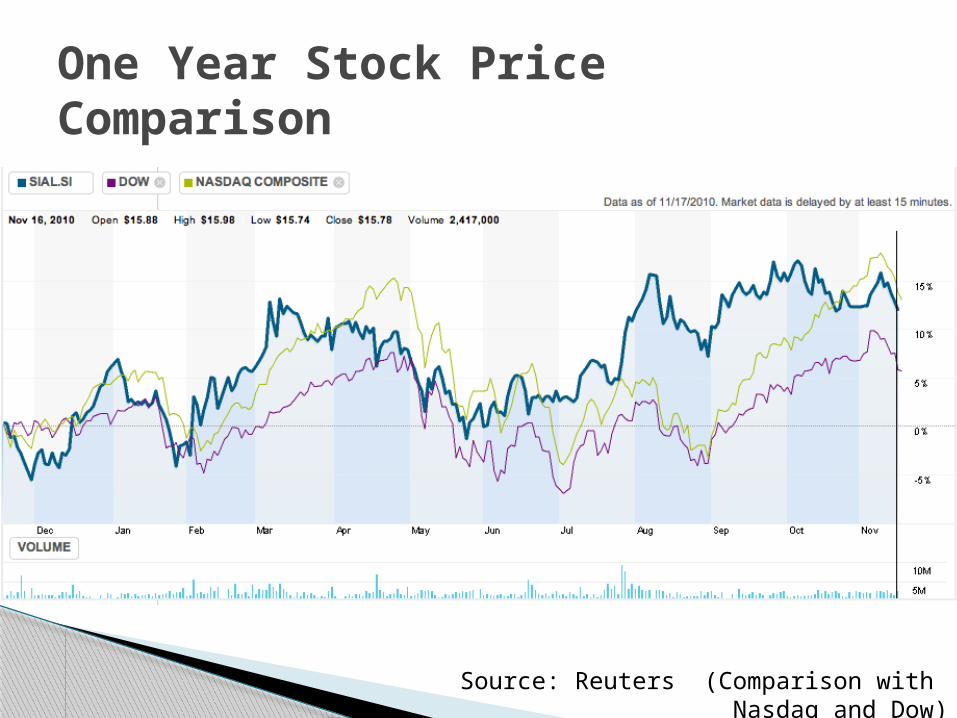
One Year Stock Price Comparison
Source: Reuters (Comparison with Nasdaq and Dow)
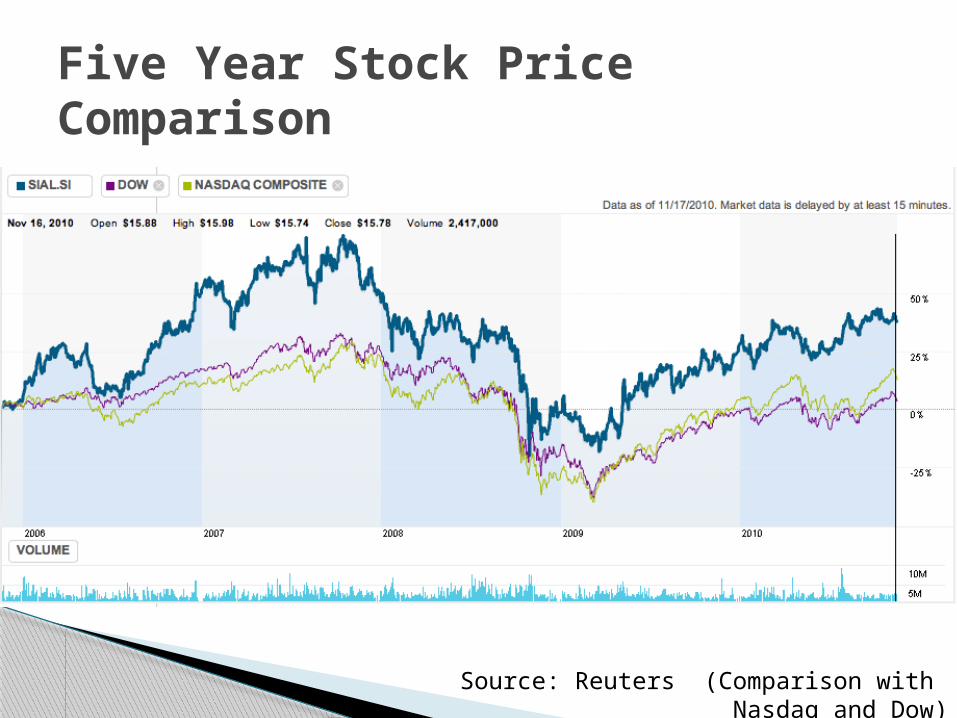
Five Year Stock Price Comparison
Source: Reuters (Comparison with Nasdaq and Dow)
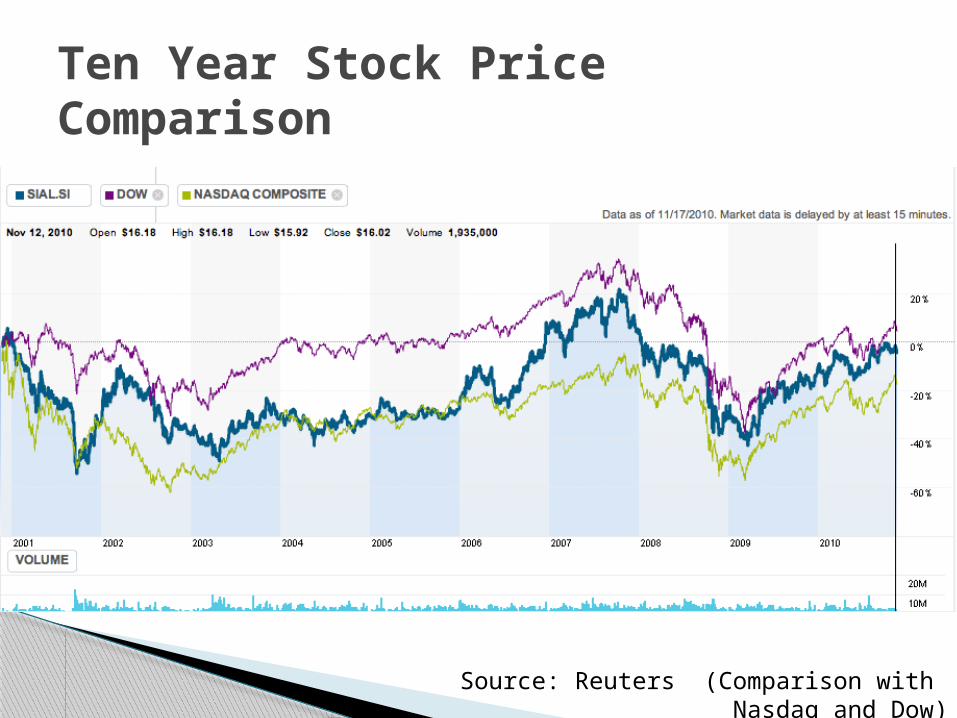
Ten Year Stock Price Comparison
Source: Reuters (Comparison with Nasdaq and Dow)
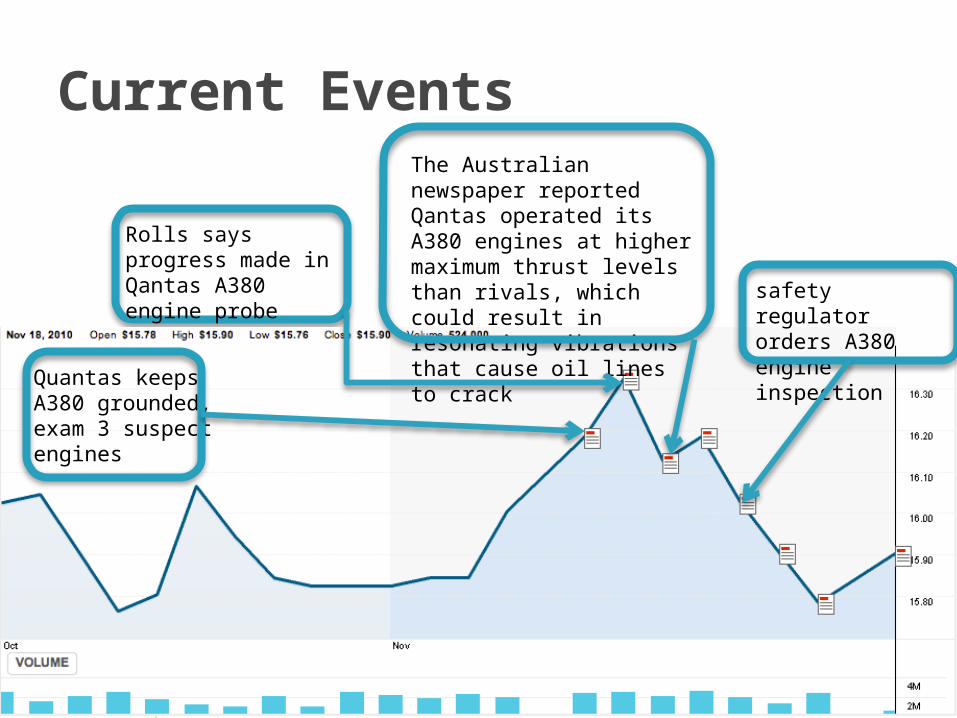
Current Events
Quantas keeps A380 grounded, exam 3 suspect engines
Rolls says progress made in Qantas A380 engine probe
The Australian newspaper reported Qantas operated its A380 engines at higher maximum thrust levels than rivals, which could result in resonating vibrations that cause oil lines to crack
safety regulator orders A380 engine inspection
Listed and traded on Singapore Stock Exchange
Share price as of Nov 18th
◦ 15.90 SGD Currency exchange rate
as of Nov 18th
◦ 1 US = 1.2975 SGD
Singapore Airline
Begin as an incorporation of Malayan Airlines (MAL) in 1937.
First flight from British Straits Settlement of Singapore to Kuala Lumpur in 1947 using Airspeed Consul twin Engine airplane
In 1963, the Federation of Malaysia was born and the Airline became known as Malaysian Airways.
Singapore Airline Brief History
In May 1966, it became Malaysia-Singapore Airlines.
In 1972, Malaysia-Singapore Airlines split up to become two entities - Singapore Airlines and Malaysian Airline System
Singapore Airline Brief History
Provide innovative promotions to attract new customers and maintain competitive advantage
Maximize return for shareholder and employees
Stated Objectives
Continuously maintain profitable position in times of economy downturn, and recover loss as the economy starts to pick up.
Enhance customer experience by providing service such as free beverage (with or without alcohol) and hot towels…etc free of charge
Maintain cost efficiency by using latest aircraft (four A330-2010) and at the same time as marketing purpose. SIA also decommissioned 6 B777s (four for lease and two for sale)
Adding capacity to designations such as Hong Kong, New Delhi, and Seoul. Also Expanding the Singapore and Munich-Manchester service
Strategy
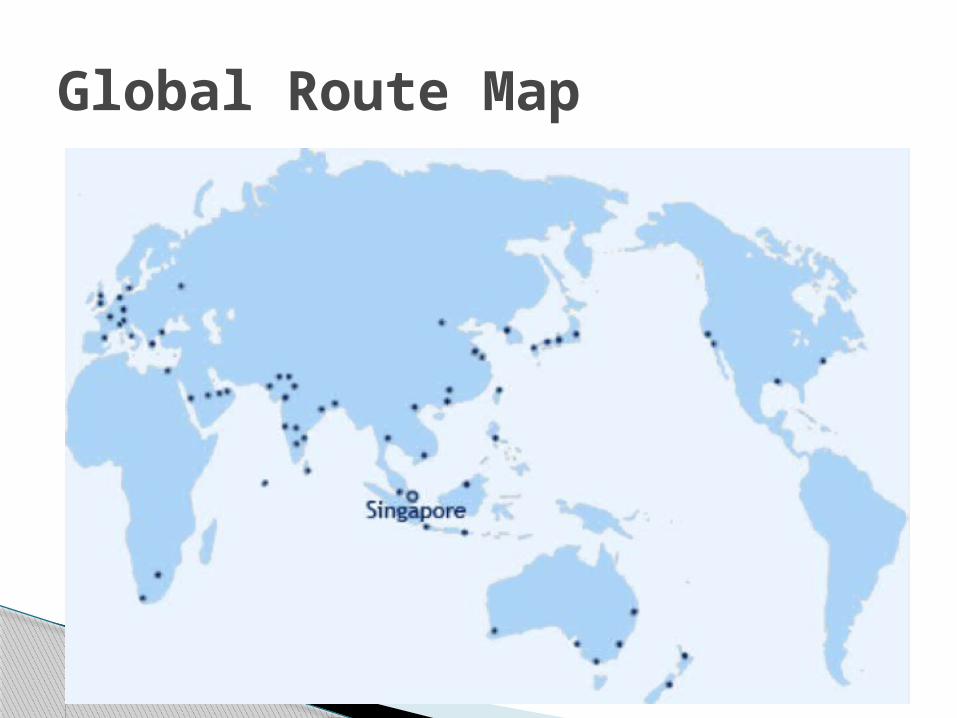
Global Route Map
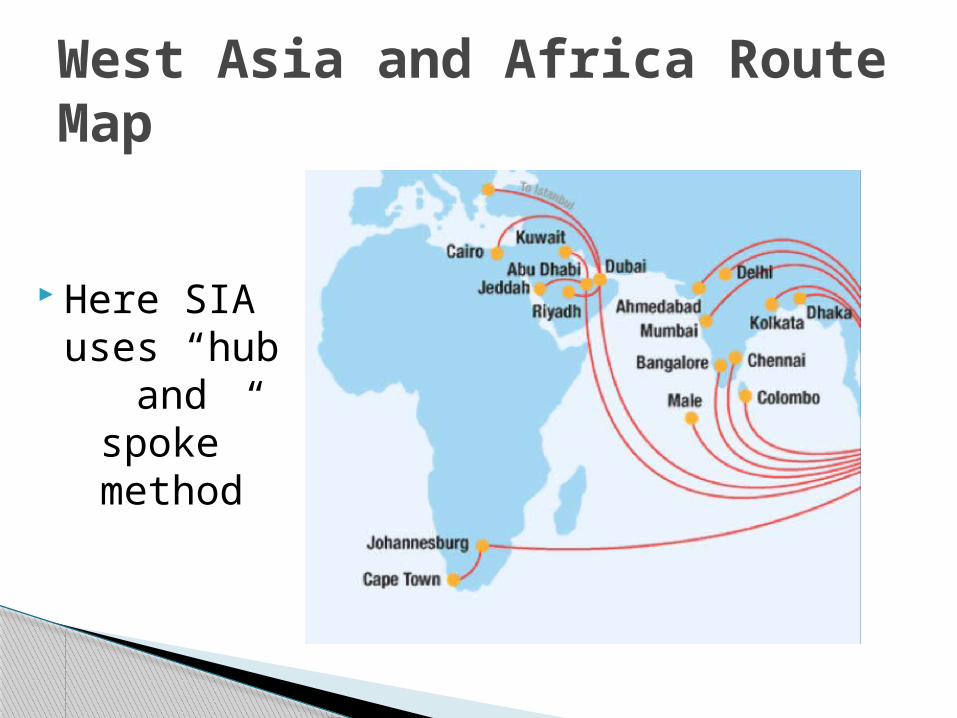
West Asia and Africa Route Map
Here SIA uses “hub and spoke”
method
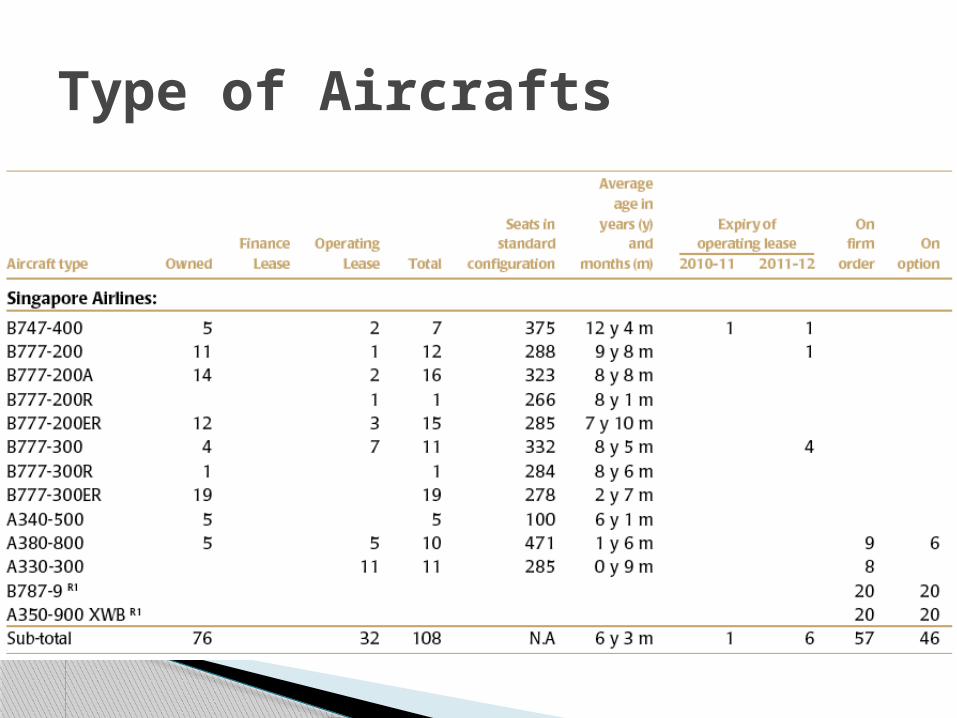
Type of Aircrafts
SilkAir Tradewinds Tour and Travel SIA Engineering Company SIA Cargo NO MORE Singapore Airport Terminal
Service (SATS) diversified from SIA in 2009
SIA Subsidiaries
Cathay Pacific Airways Limited
Japan Airline Corporation
Malaysian Airline System Berhad
Main Competitors
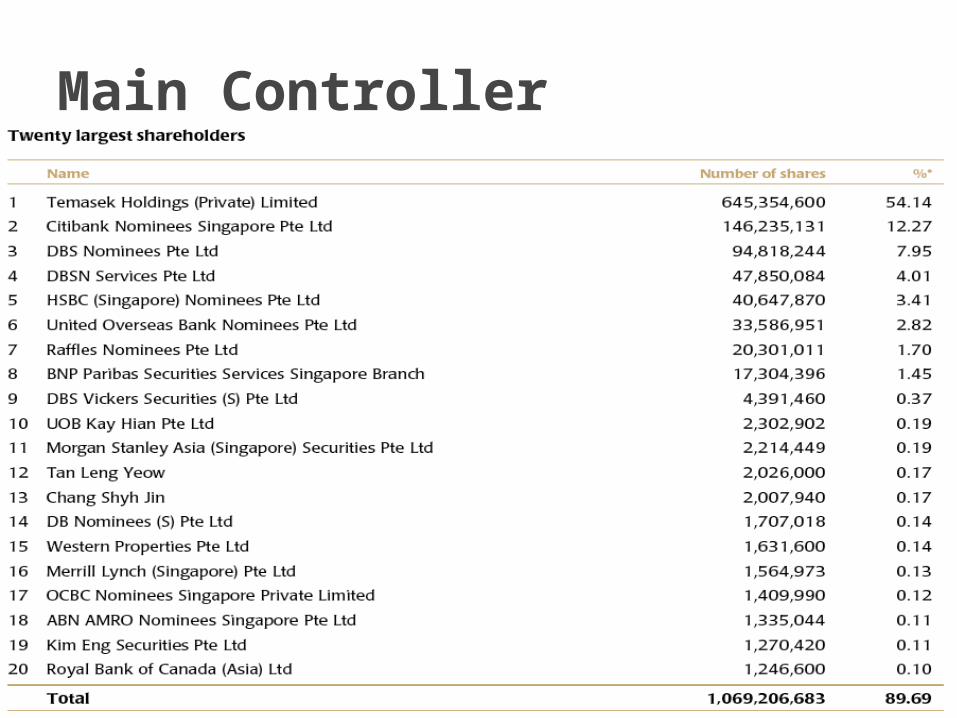
Main Controller
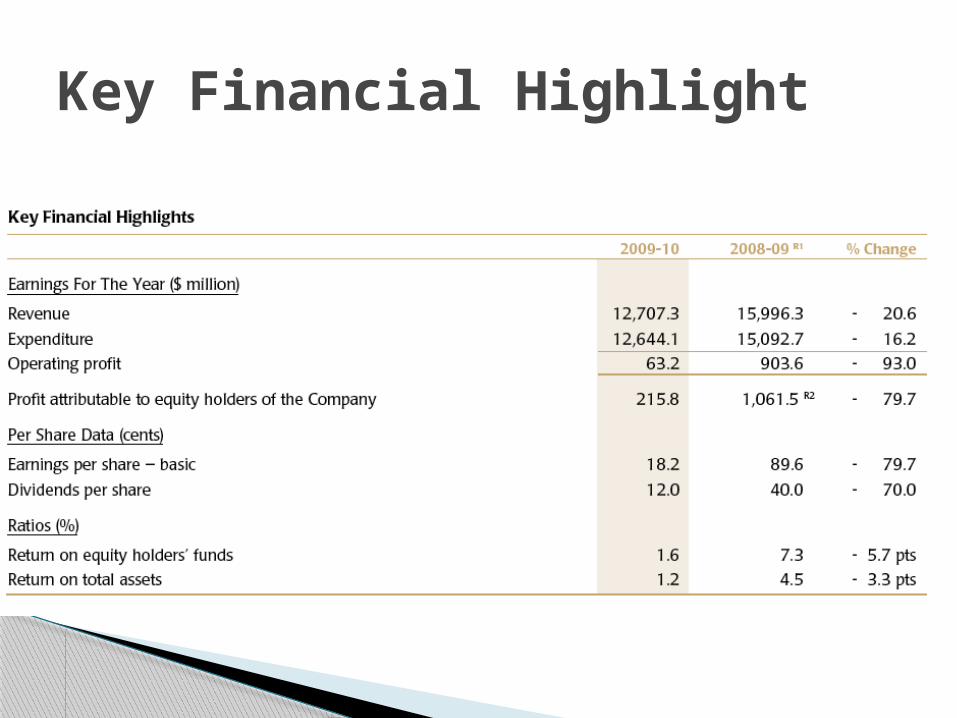
Key Financial Highlight
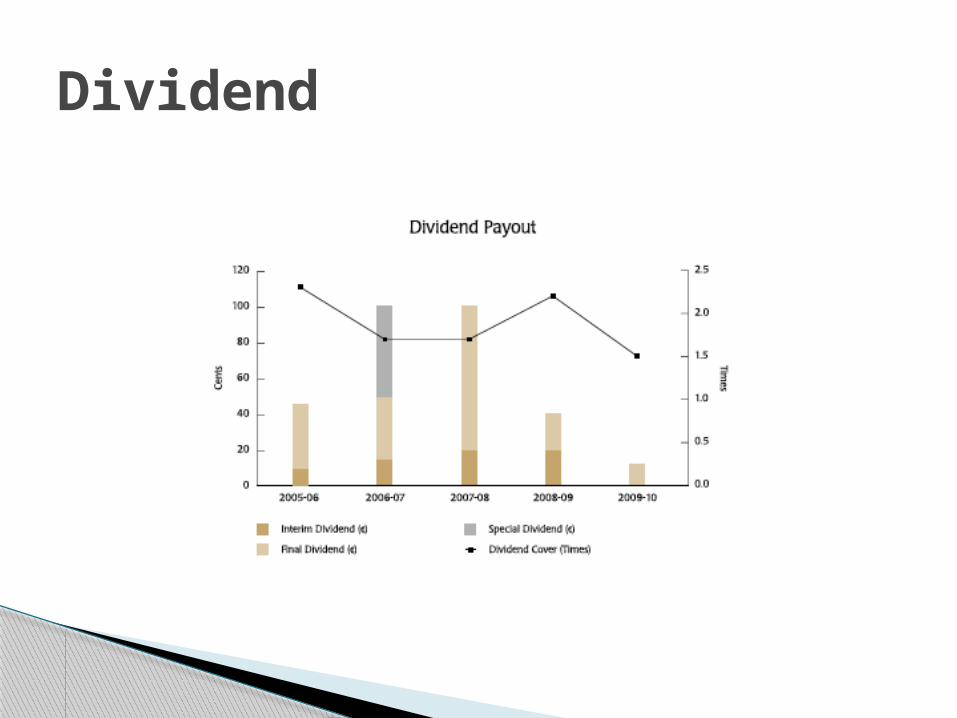
Dividend
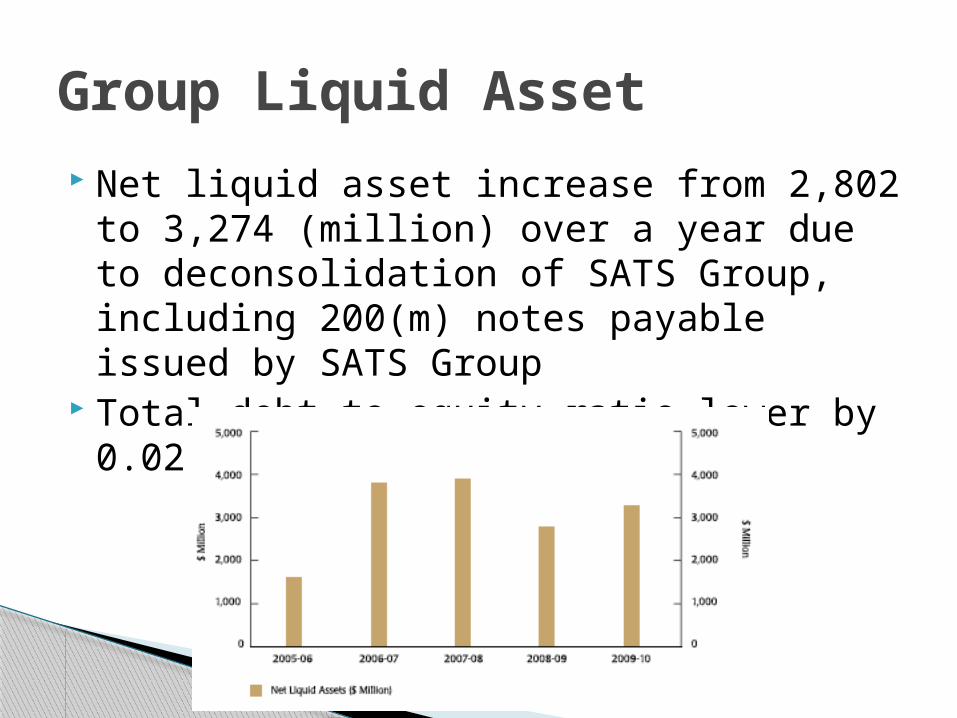
Net liquid asset increase from 2,802 to 3,274 (million) over a year due to deconsolidation of SATS Group, including 200(m) notes payable issued by SATS Group
Total debt to equity ratio lower by 0.02
Group Liquid Asset
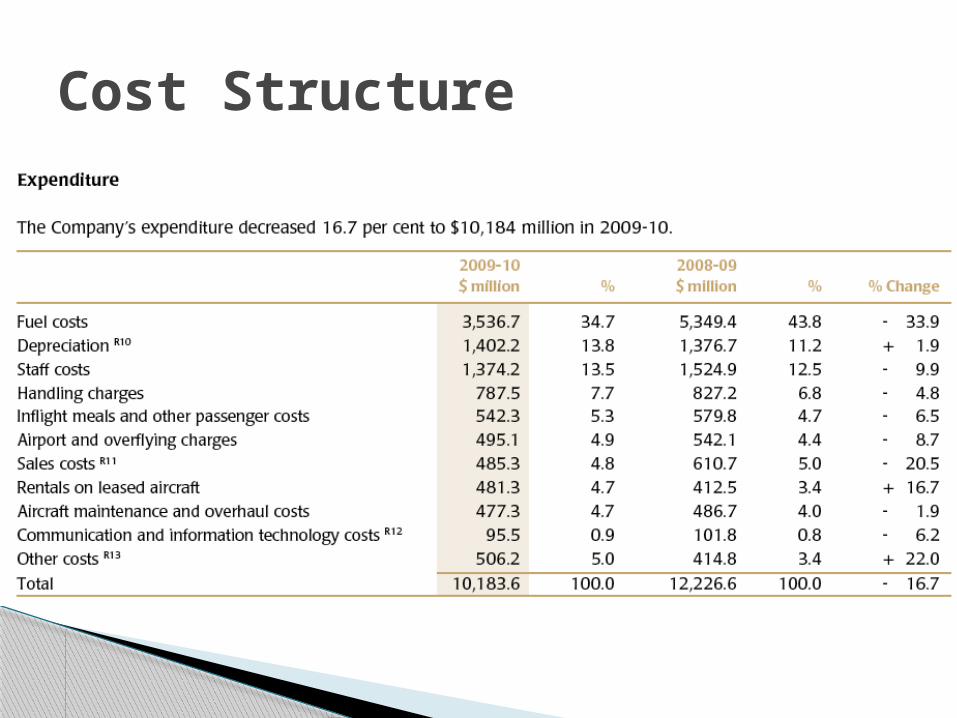
Cost Structure
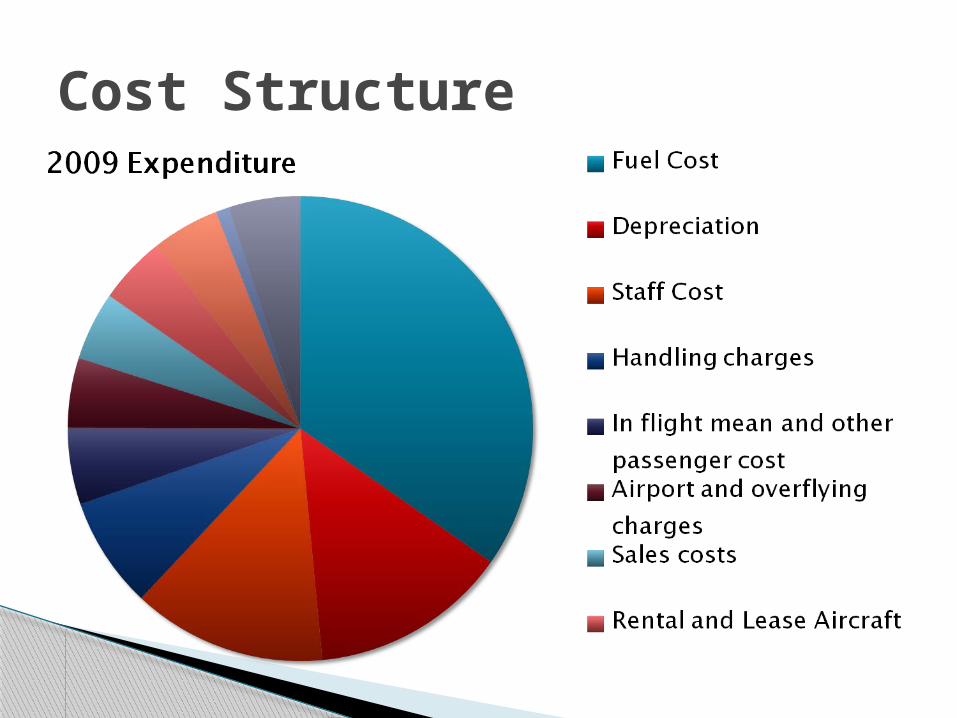
Cost Structure
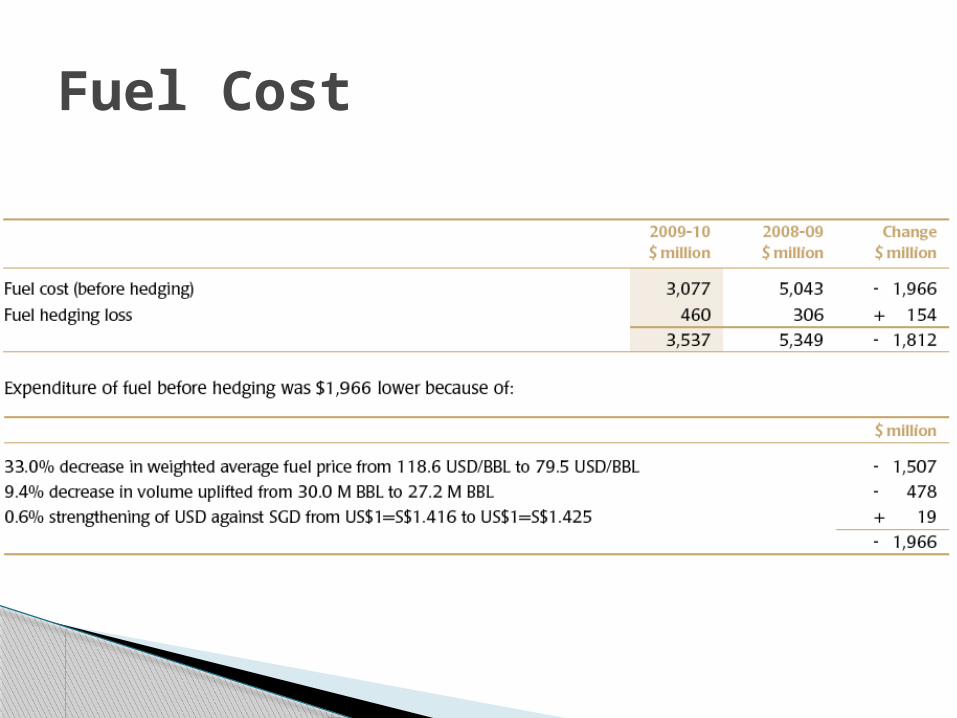
Fuel Cost
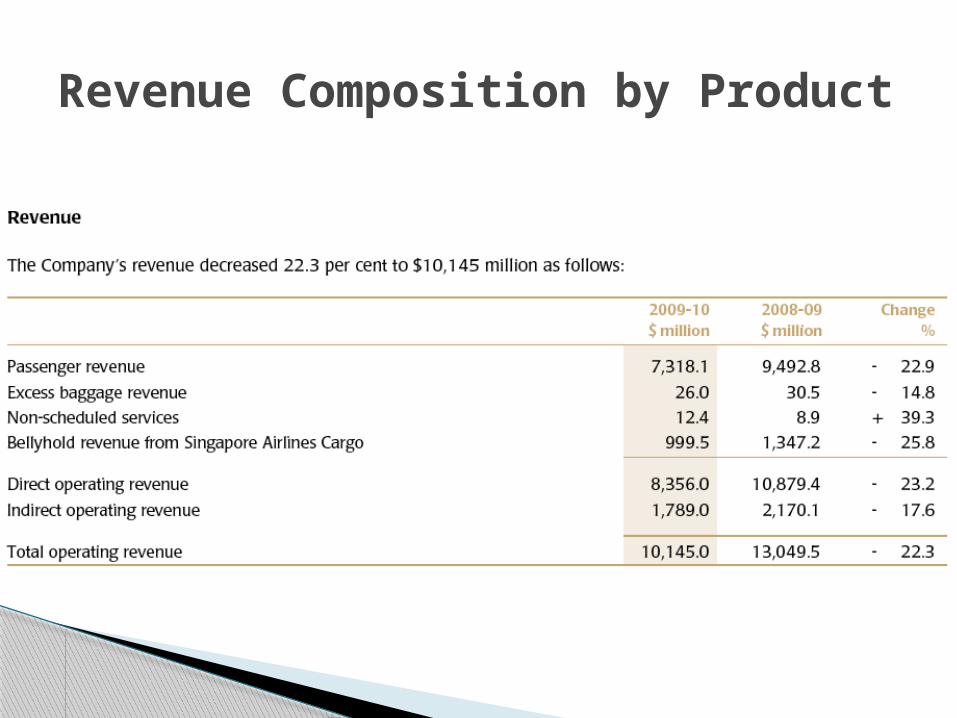
Revenue Composition by Product
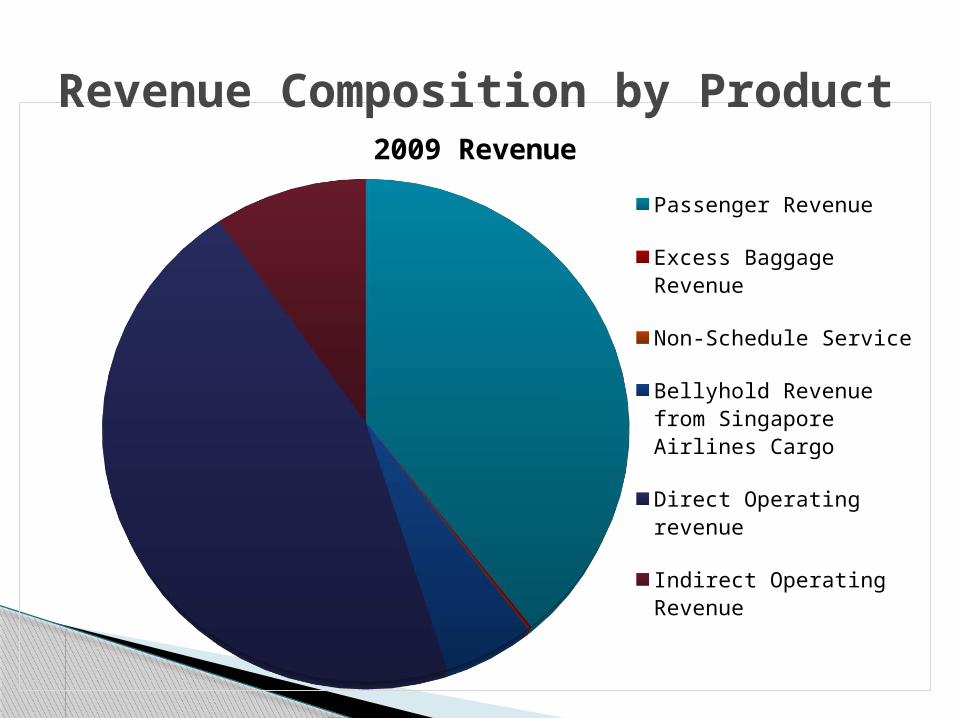
2009 Revenue
Passenger Revenue
Excess Baggage Revenue
Non-Schedule Service
Bellyhold Revenue from Singapore Airlines Cargo
Direct Operating revenue
Indirect Operating Revenue
Revenue Composition by Product
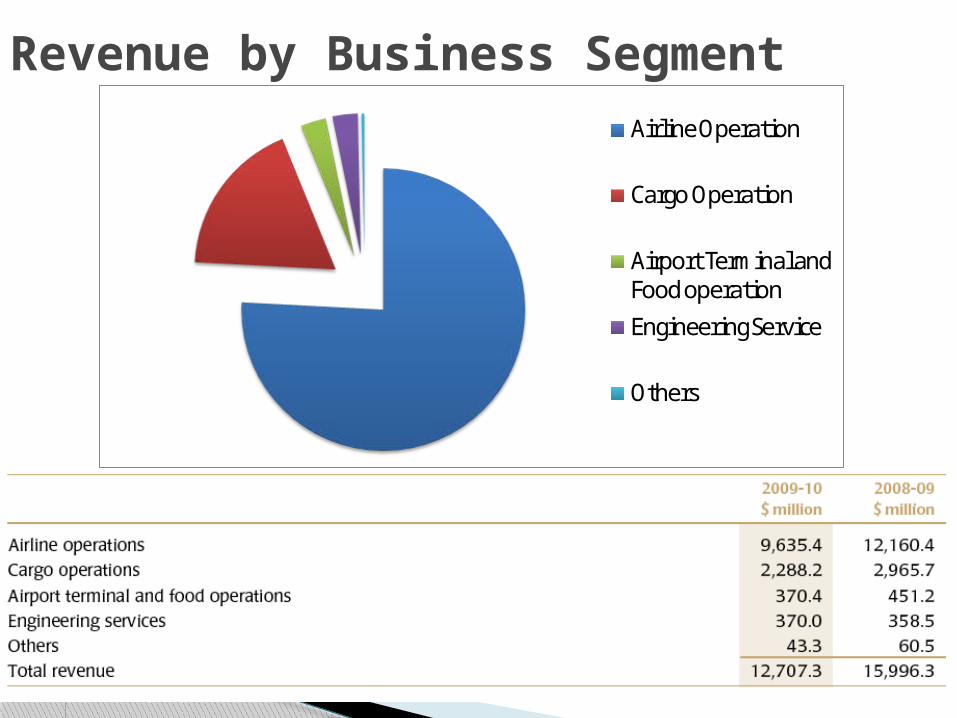
Airline Operation
Cargo Operation
Airport Terminal and Food operation
Engineering Service
Others
Revenue by Business Segment
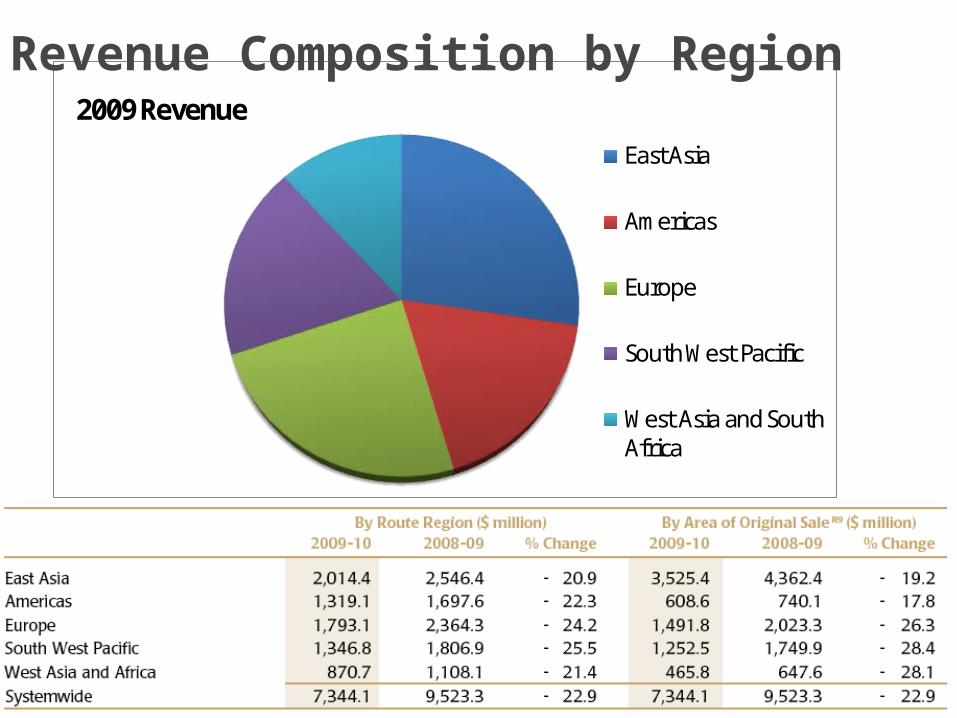
2009 RevenueEast Asia
Americas
Europe
South West Pacific
West Asia and South Africa
Revenue Composition by Region
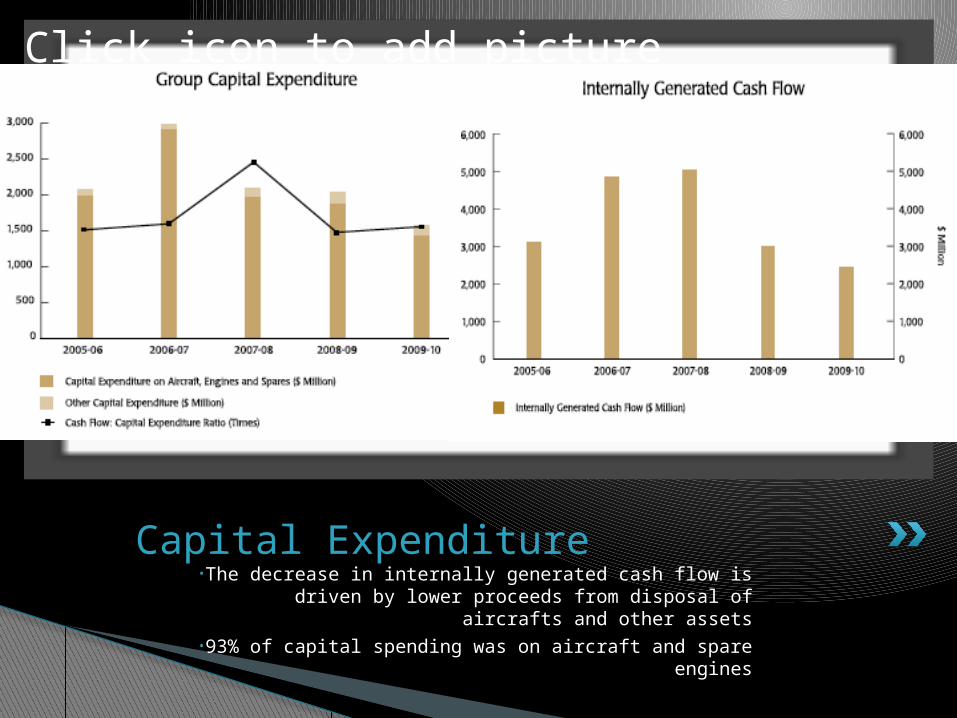
•The decrease in internally generated cash flow is driven by lower proceeds from disposal of aircrafts and other
assets•93% of capital spending was on aircraft and spare engines
Click icon to add picture
Capital Expenditure
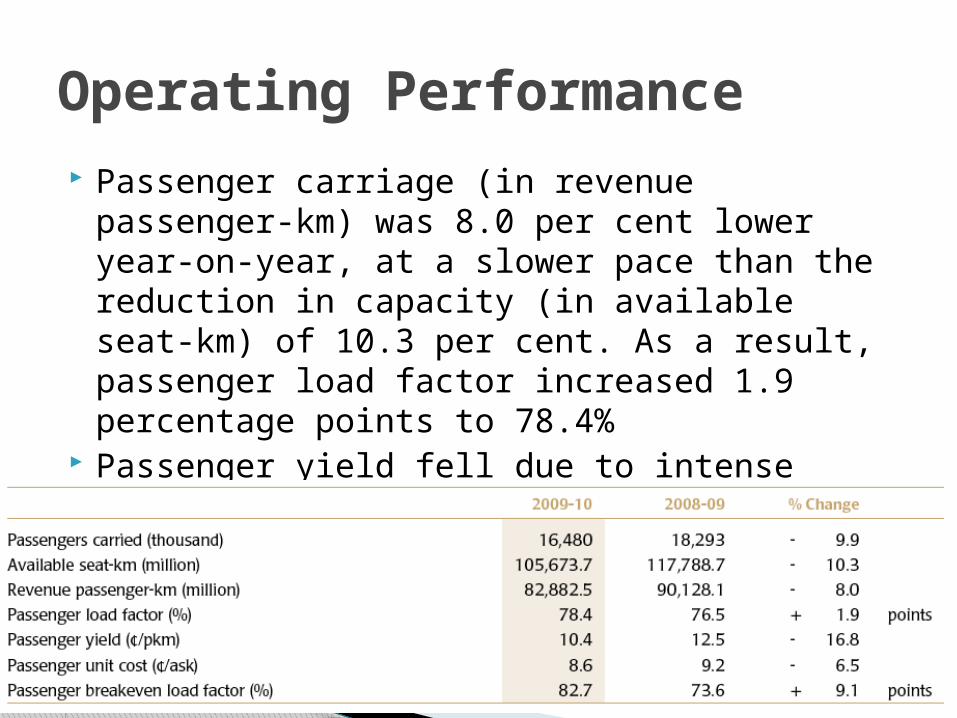
Passenger carriage (in revenue passenger-km) was 8.0 per cent lower year-on-year, at a slower pace than the reduction in capacity (in available seat-km) of 10.3 per cent. As a result, passenger load factor increased 1.9 percentage points to 78.4%
Passenger yield fell due to intense competition and aggressive promotional fare activities
Operating Performance
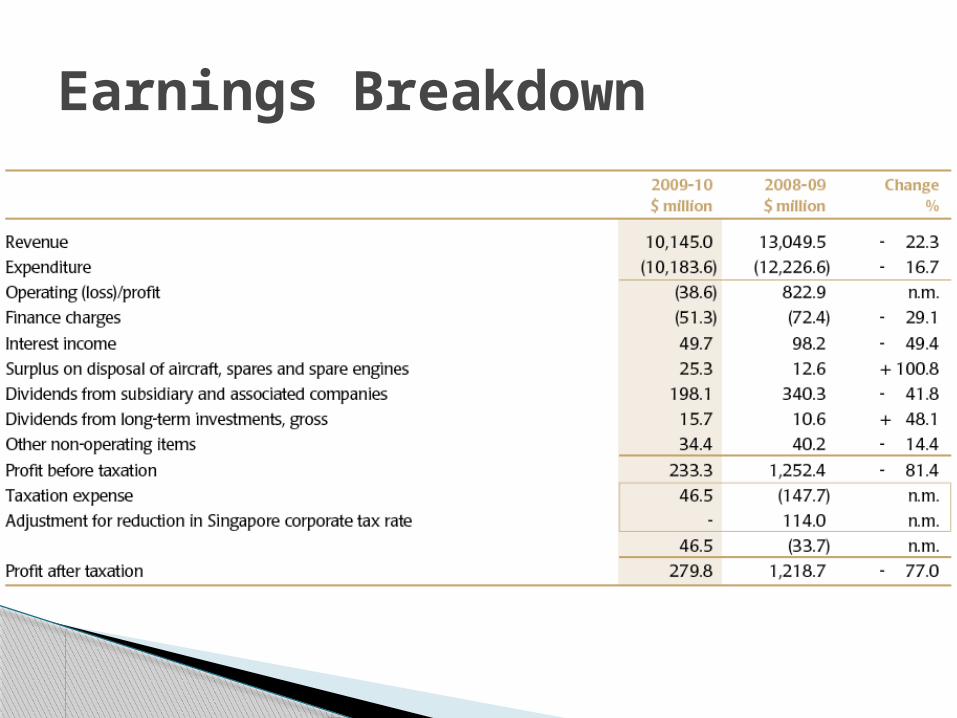
Earnings Breakdown
Singapore AirlinesManagement
Joined SIA in 1972 and held senior assignments and headed the planning and marketing division at corporate headquarters.
Become CEO in 2003 Director of Singapore Exchange Ltd
and Government of Singapore Investment Corporation
Member of board of governors of IATA Bachelor degree (honors) in
mechanical engineering from university of Singapore
Master degree in Operations Research and Management Studies from Imperial College, University of London
CEO: Chew Choon Seng
Became chairman of BOD in 2006 Managing Director of Shanghai Commercial
& Savings Bank (Taiwan) and Great Malaysia Textile Investments Pte Ltd
President of the Singapore National Employers’ Federation since 1988 and is a Council Member of the Singapore National Wages Council
Nominated Member of Parliament from 1994-1997 and was awarded the Distinguished Service Order Award in 2006 and the Public Service Star Award in 1998
graduated from Northwestern University, Illinois, USA in 1973 with a Masters in Business Administration
BOD Chairman: Stephen Lee Ching Yen
Become senior Executive Vice President of Marketing & Corporate Services at Singapore Airlines Ltd. on March 1, 2010
Chief of Air Force from 1992 to 1995 and Chief of Defence Force in the Ministry of Defence from 1995 to 2000
graduated with a Bachelor of Arts in Engineering and has a Master of Arts degree in Engineering from the University of Cambridge
Master of Public Administration Degree from Harvard University in 1988
attended the Advanced Management Program at the Harvard Business School in 2000
Senior Executive VP: Bey Soo Khiang
Singapore AirlinesFinancial Analysis
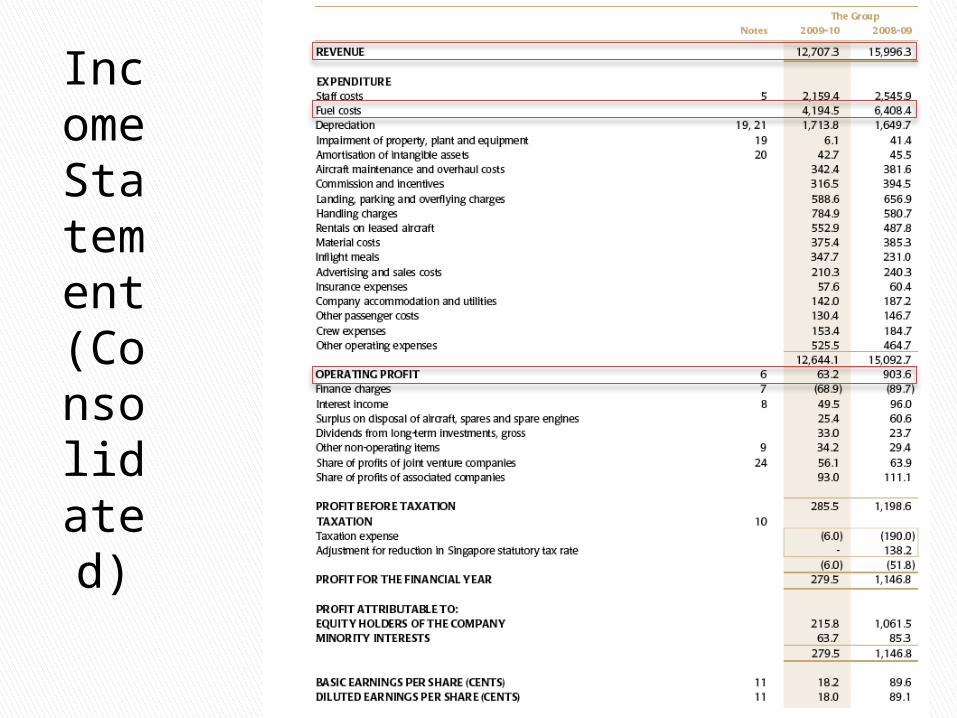
Income Statement (Consolidated)
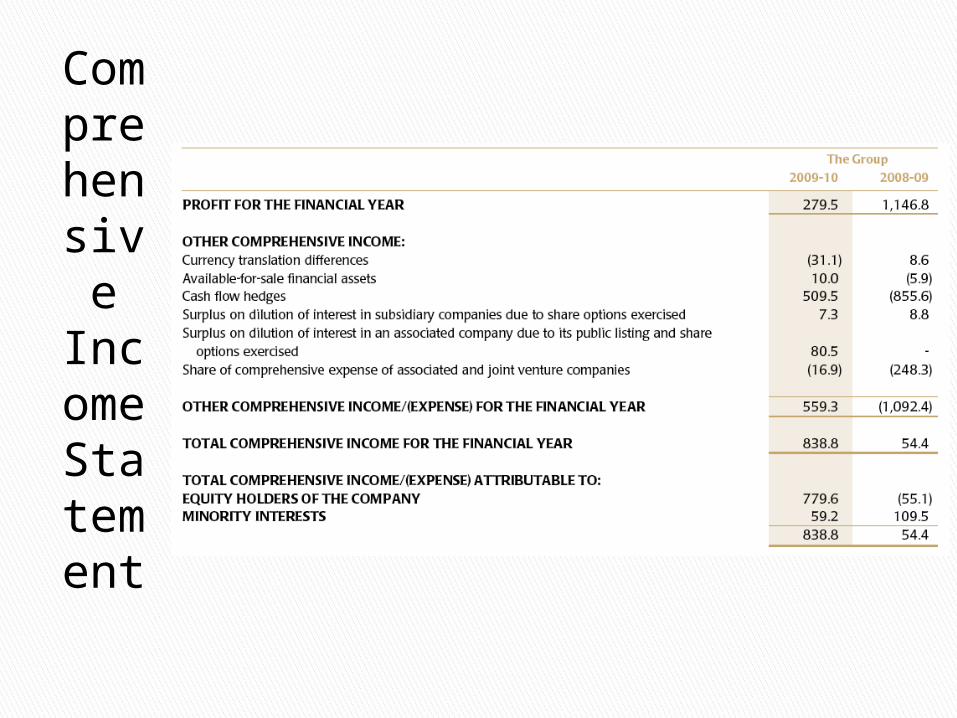
Comprehensiv
e Income Statement
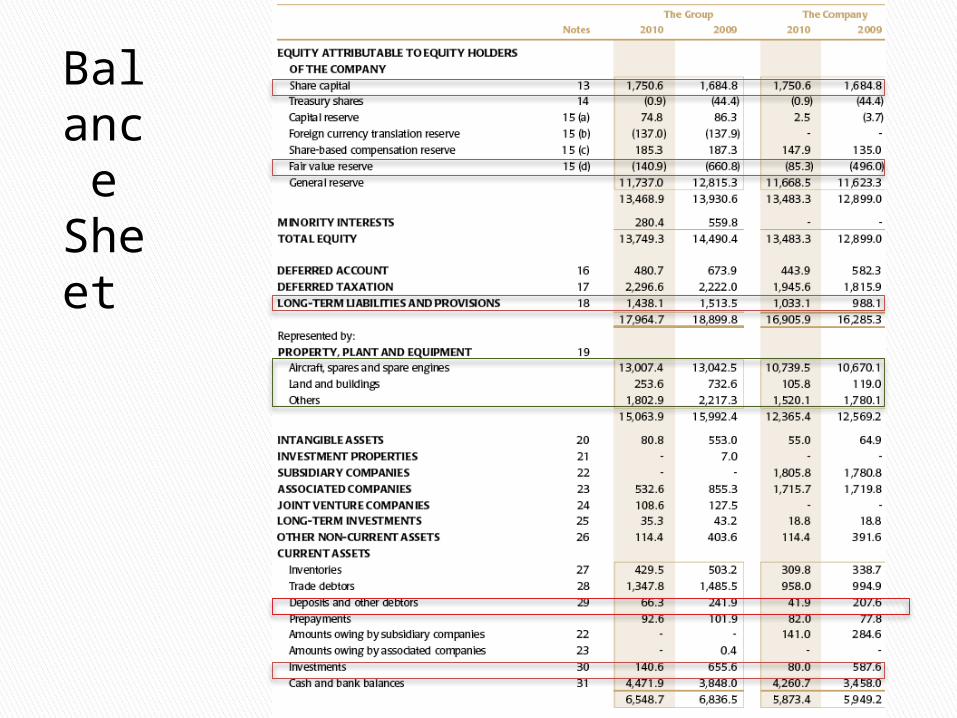
Balance Sheet
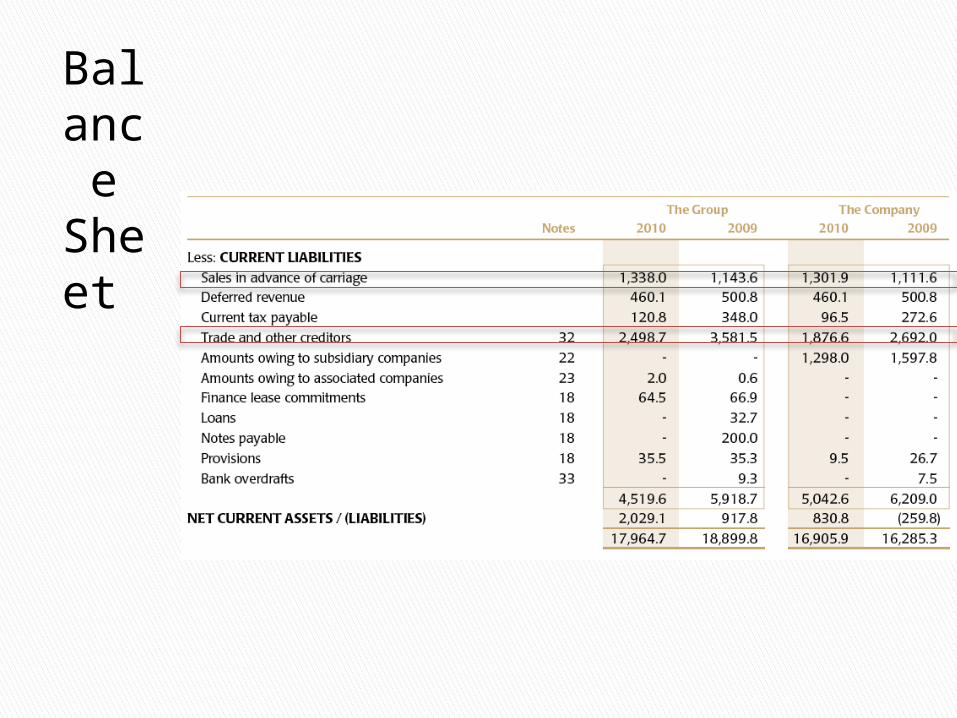
Balance Sheet
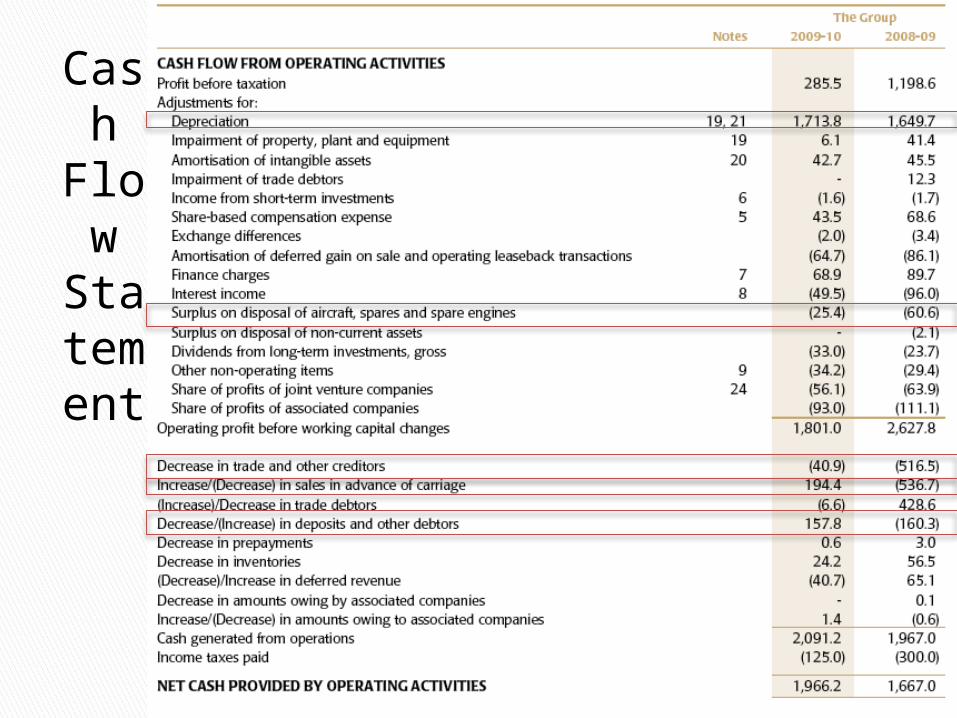
Cash
Flow
Statement
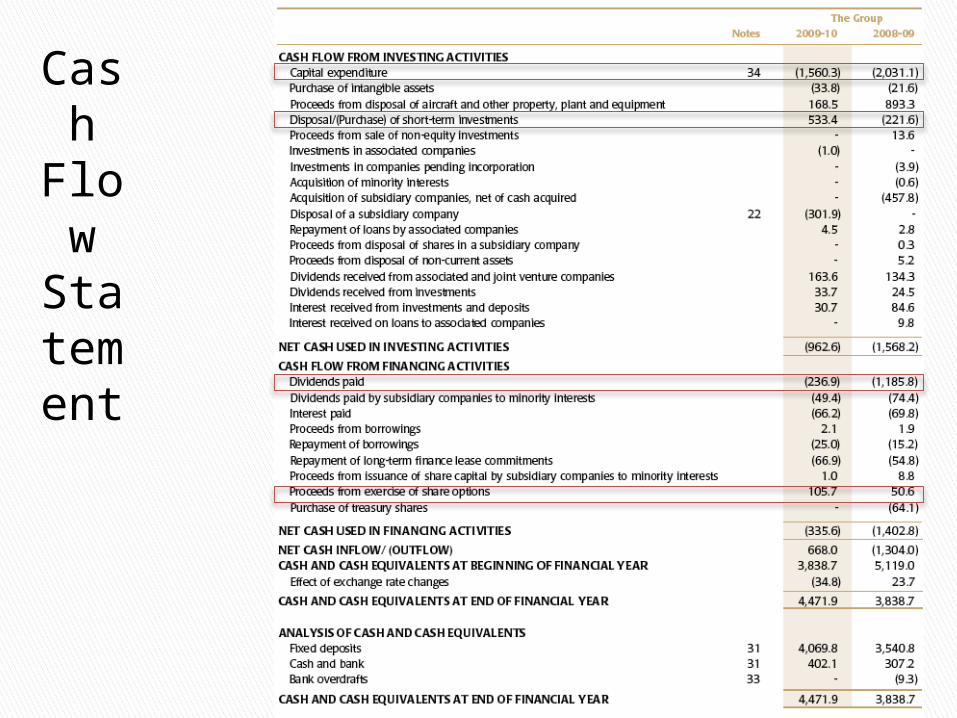
Cash
Flow
Statement
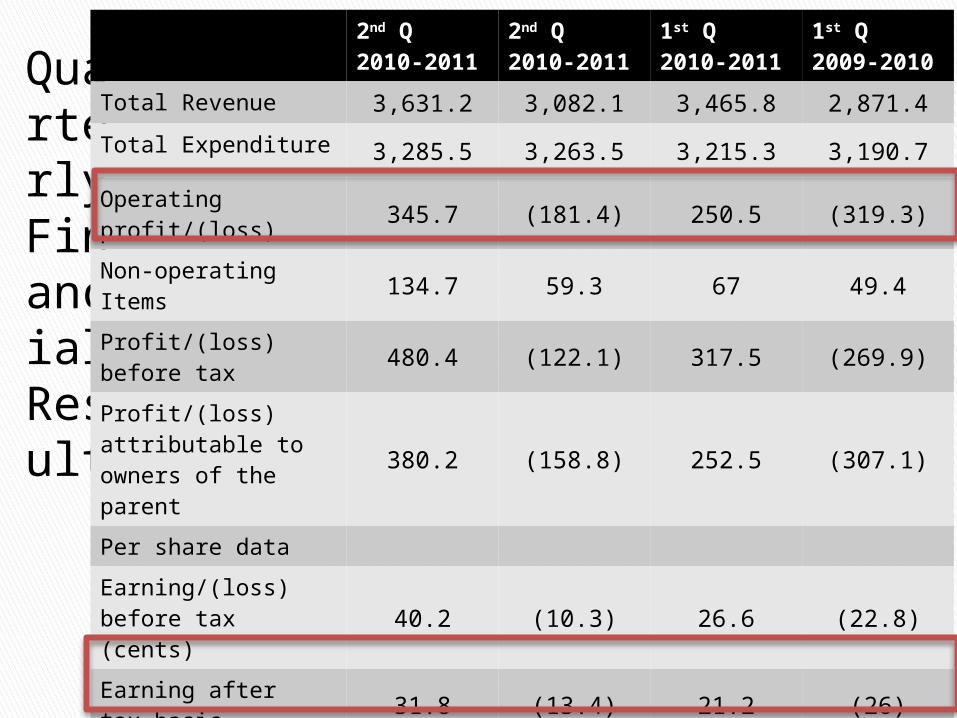
Quarterl
y Financia
l Result
2nd Q 2010-2011
2nd Q 2010-2011
1st Q 2010-2011
1st Q 2009-2010
Total Revenue 3,631.2 3,082.1 3,465.8 2,871.4
Total Expenditure 3,285.5 3,263.5 3,215.3 3,190.7
Operating profit/(loss) 345.7 (181.4) 250.5 (319.3)
Non-operating Items 134.7 59.3 67 49.4
Profit/(loss) before tax 480.4 (122.1) 317.5 (269.9)
Profit/(loss) attributable to owners of the parent
380.2 (158.8) 252.5 (307.1)
Per share data
Earning/(loss) before tax (cents) 40.2 (10.3) 26.6 (22.8)
Earning after tax-basic 31.8 (13.4) 21.2 (26)
Earning after tax- diluted 31.4 (13.4) 20.9 (26)
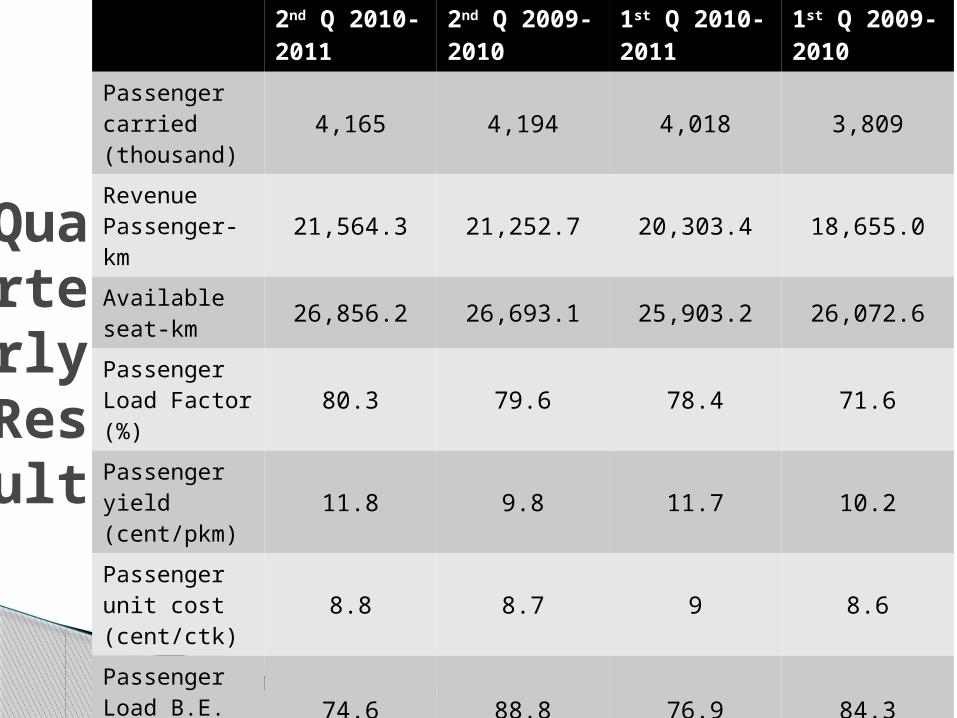
2nd Q 2010-2011
2nd Q 2009-2010
1st Q 2010-2011
1st Q 2009-2010
Passenger carried (thousand)
4,165 4,194 4,018 3,809
Revenue Passenger-km
21,564.3 21,252.7 20,303.4 18,655.0
Available seat-km 26,856.2 26,693.1 25,903.2 26,072.6
Passenger Load Factor (%)
80.3 79.6 78.4 71.6
Passenger yield (cent/pkm)
11.8 9.8 11.7 10.2
Passenger unit cost (cent/ctk)
8.8 8.7 9 8.6
Passenger Load B.E. factor (%)
74.6 88.8 76.9 84.3
Quarterly Result
Recommendation
BUY