Embed Size (px)
Citation preview
Industry – Alla Serebrova
Delta Airlines - Eugene
Southwest Airlines - Shaun
British Airways - Alex
Global AirlinesGlobal Airlines
Presentation AgendaPresentation Agenda
Industry Characteristics
Current State
Market Outlook
Companies in focus: Delta Airlines
Southwest
British Airways
YIELD: Revenues divided by revenue passenger-kilometers; it represents an aggregate of all the airfare and airline charges and is measured on a per-kilometer basis.
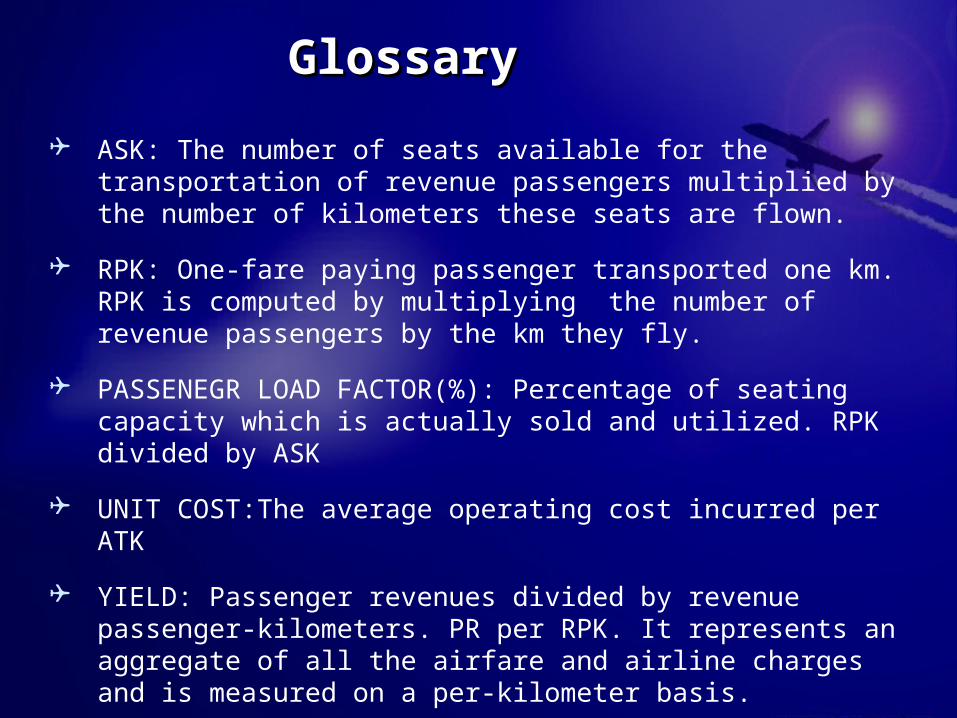
ASK: The number of seats available for the transportation of revenue passengers multiplied by the number of kilometers these seats are flown.
RPK: One-fare paying passenger transported one km. RPK is computed by multiplying the number of revenue passengers by the km they fly.
PASSENEGR LOAD FACTOR(%): Percentage of seating capacity which is actually sold and utilized. RPK divided by ASK
UNIT COST:The average operating cost incurred per ATK
YIELD: Passenger revenues divided by revenue passenger-kilometers. PR per RPK. It represents an aggregate of all the airfare and airline charges and is measured on a per-kilometer basis.
BREAK-EVEN LOAD FACTOR: The LF at which operating revenues cover operating costs. Unit Cost divided by Yield.
GlossaryGlossary
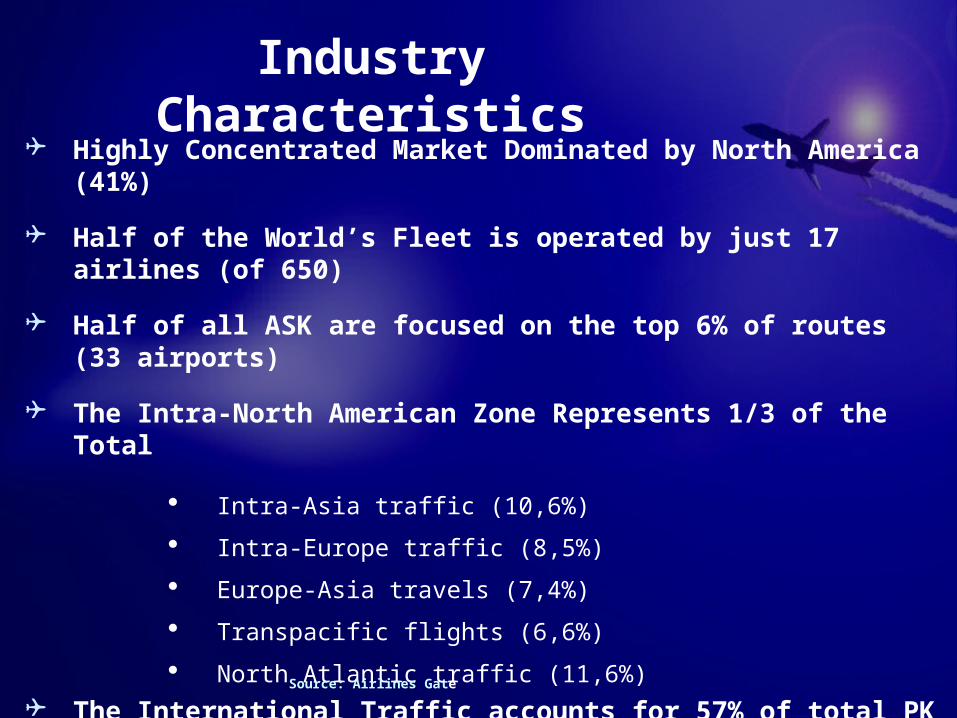
Highly Concentrated Market Dominated by North America (41%)
Half of the World’s Fleet is operated by just 17 airlines (of 650)
Half of all ASK are focused on the top 6% of routes (33 airports)
The Intra-North American Zone Represents 1/3 of the Total
Intra-Asia traffic (10,6%)
Intra-Europe traffic (8,5%)
Europe-Asia travels (7,4%)
Transpacific flights (6,6%)
North Atlantic traffic (11,6%) The International Traffic accounts for 57% of total PK
Industry Characteristics
Source: Airlines Gate
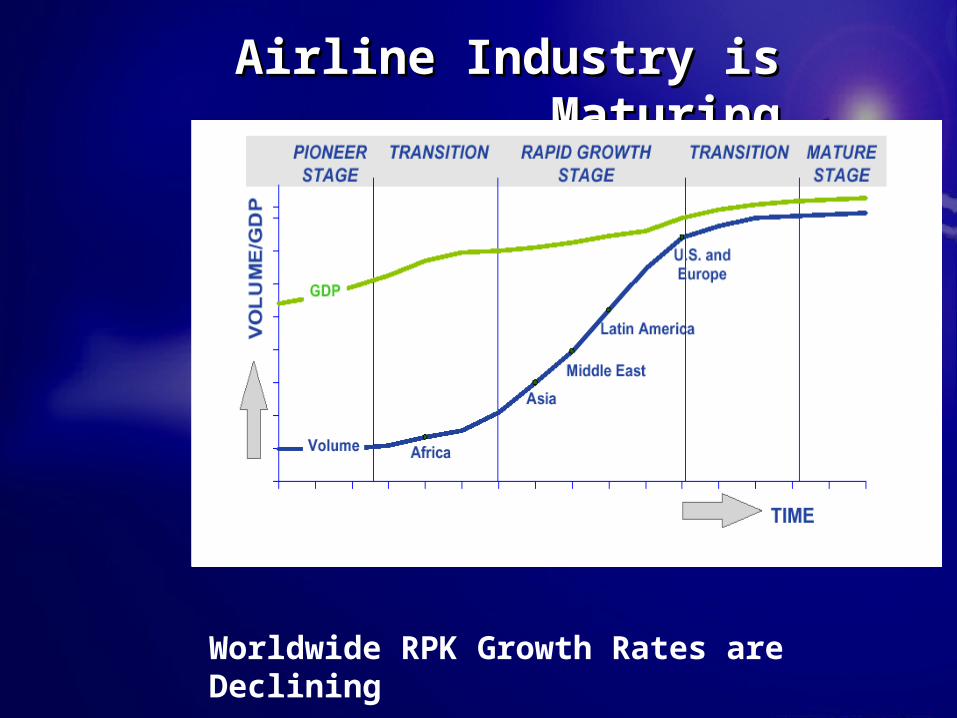
Airline Industry is MaturingAirline Industry is Maturing
Worldwide RPK Growth Rates are Declining
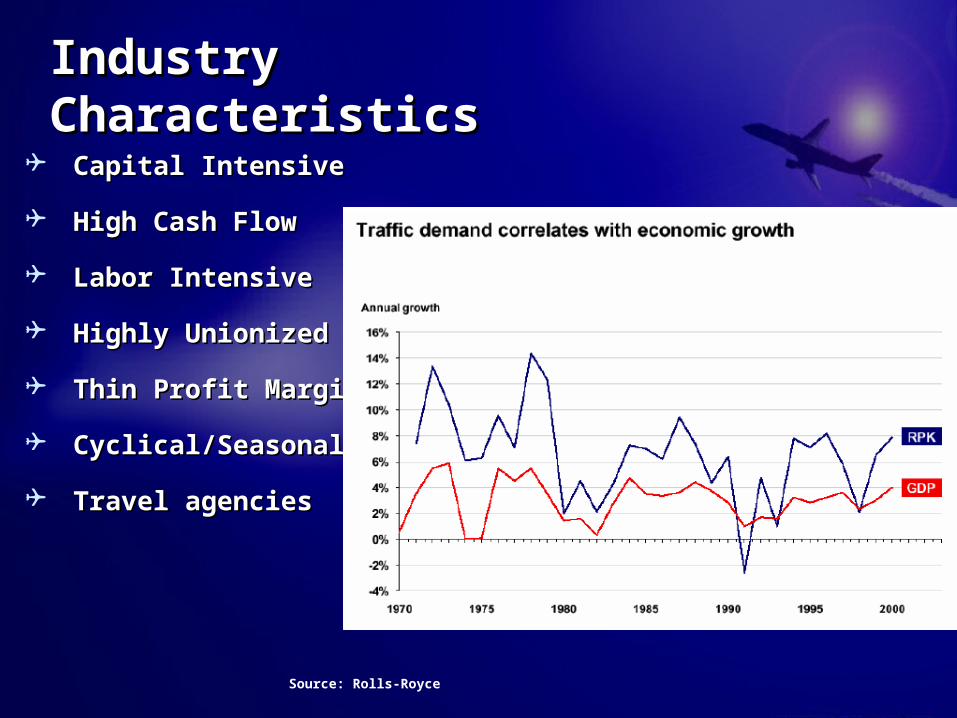
Capital IntensiveCapital Intensive
High Cash FlowHigh Cash Flow
Labor IntensiveLabor Intensive
Highly UnionizedHighly Unionized
Thin Profit MarginsThin Profit Margins
Cyclical/SeasonalCyclical/Seasonal
Travel agencies Travel agencies
Industry CharacteristicsIndustry Characteristics
Source: Rolls-Royce
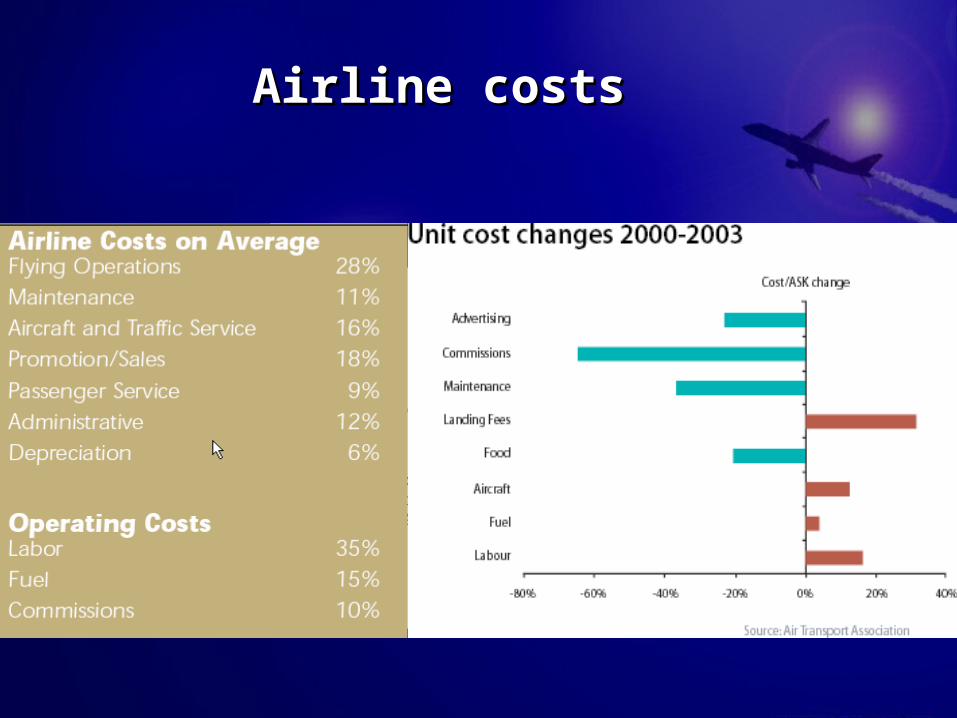
Airline costsAirline costs
Maintenance: parts and labor 13%
Flying Operations
27%
Depreciation6%
Administrative6%
Transport Related
10%
Passenger Service 9%
Promotion/Sales 13%
Aircraft and Traffic
Service 16%
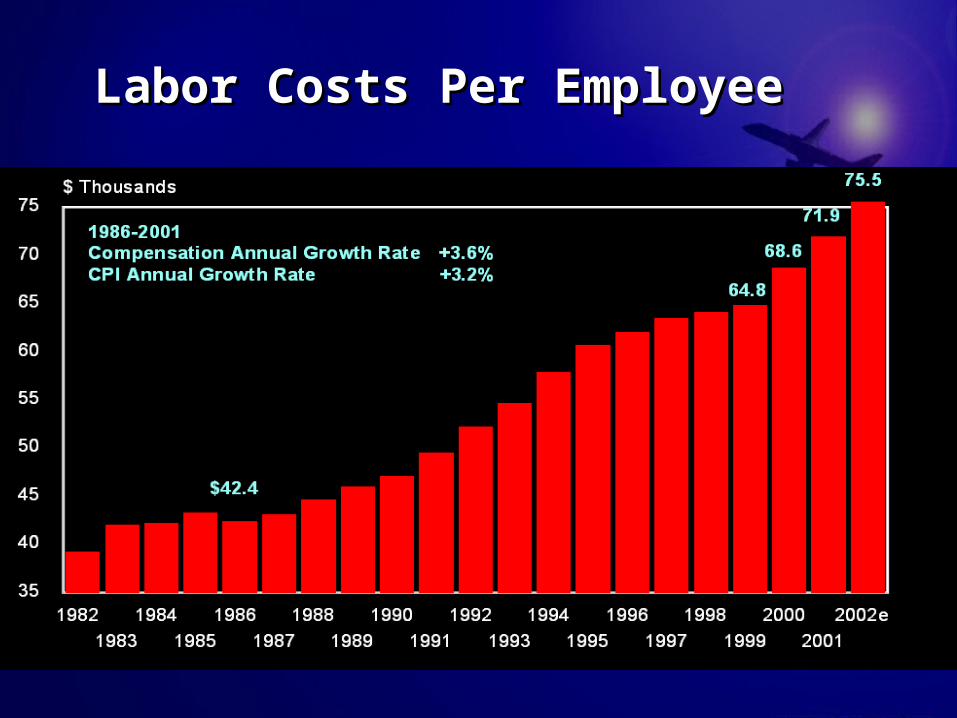
Labor Costs Per EmployeeLabor Costs Per Employee
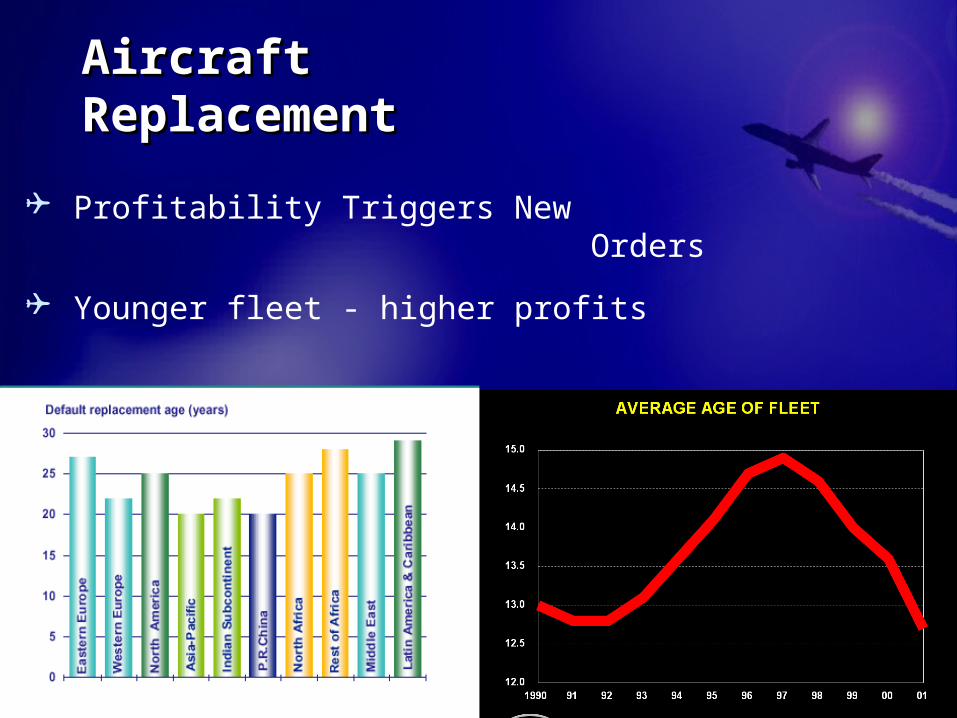
Profitability Triggers New Orders
Younger fleet - higher profits
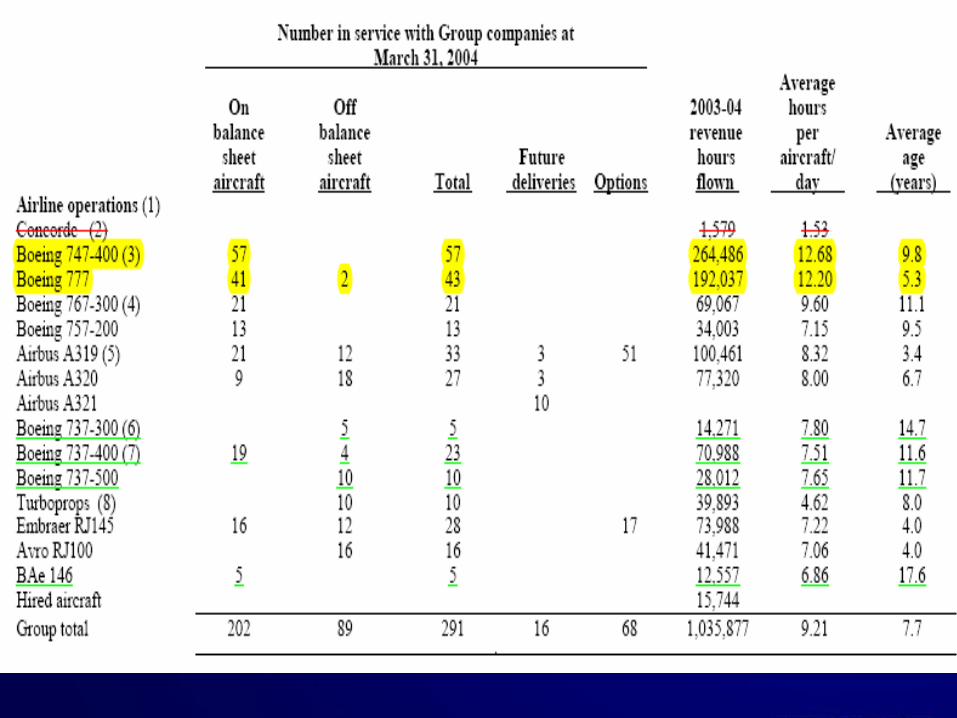
Aircraft Aircraft ReplacementReplacement
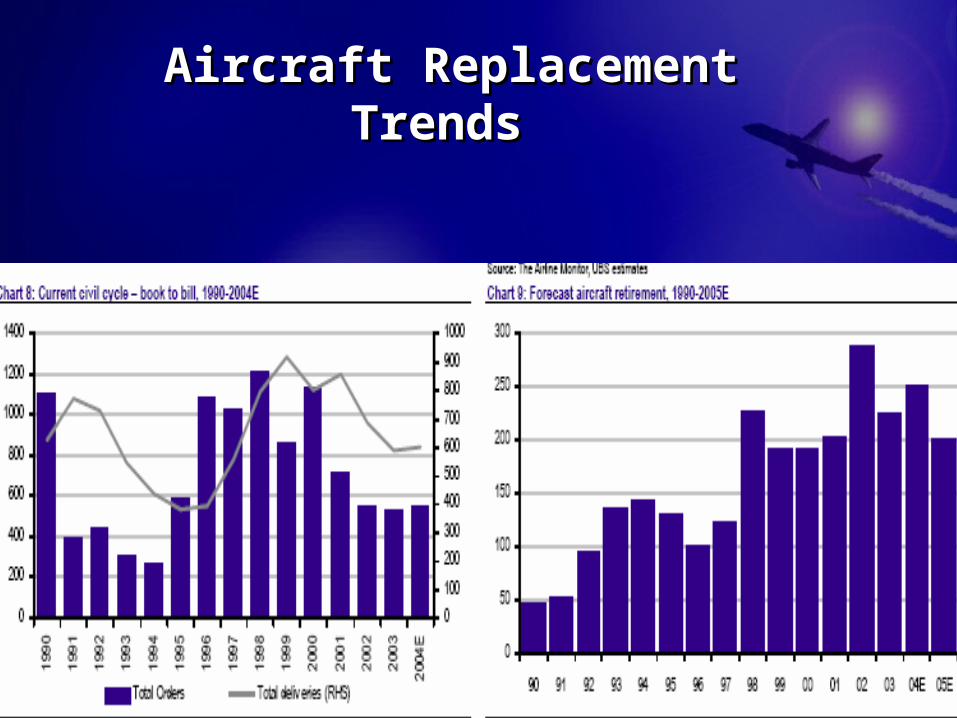
Aircraft Replacement TrendsAircraft Replacement Trends
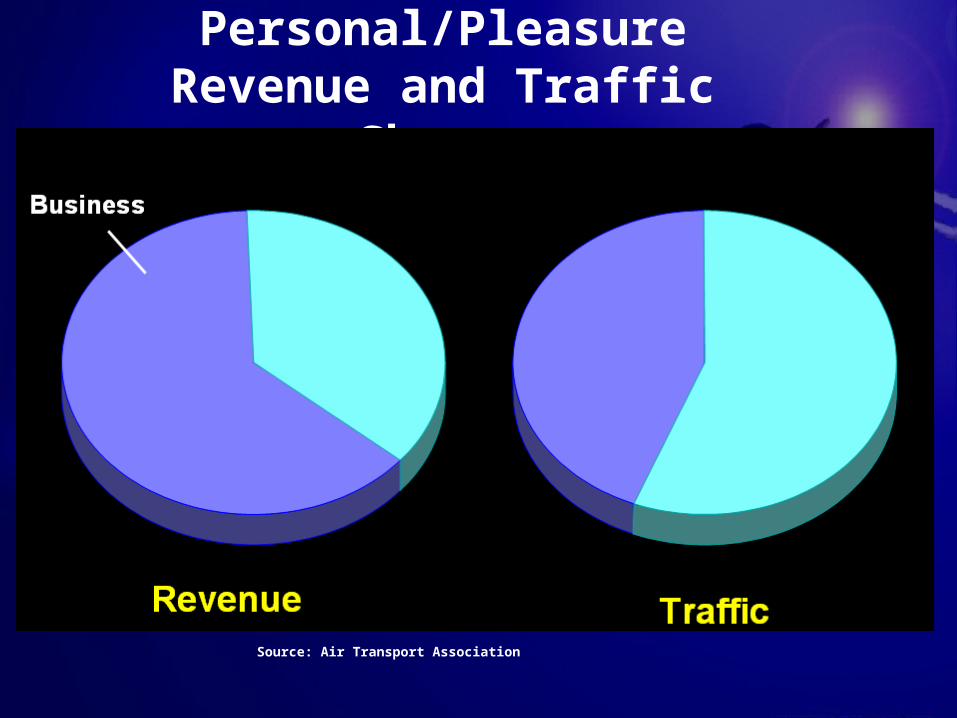
Business vs. Personal/PleasureRevenue and Traffic Shares
Source: Air Transport Association
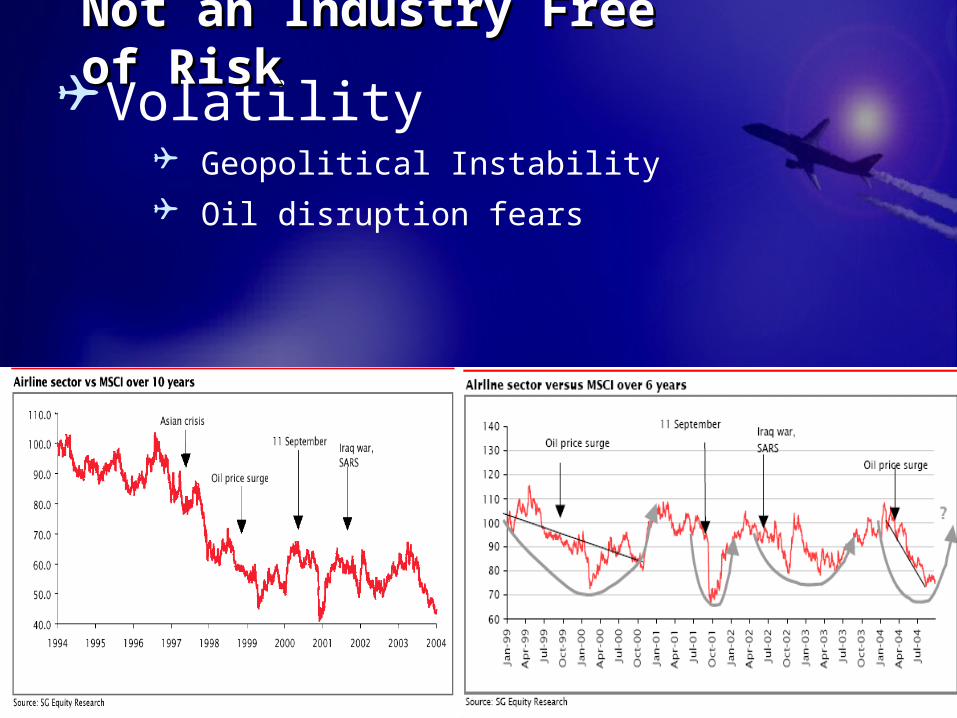
Volatility Geopolitical Instability
Oil disruption fears
Not an Industry Free of RiskNot an Industry Free of Risk
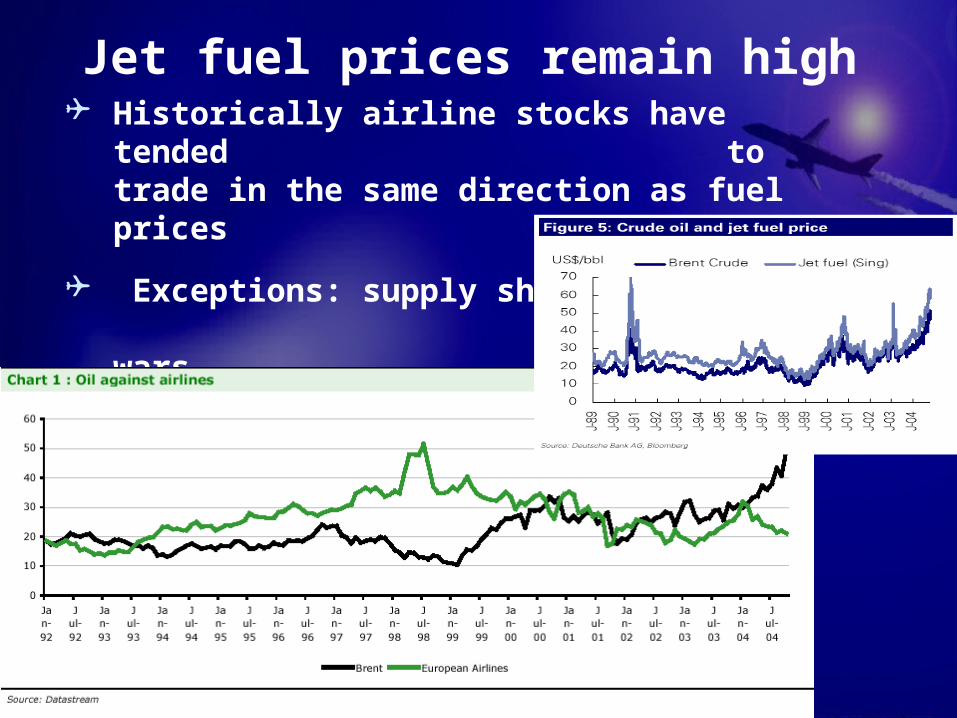
Jet fuel prices remain high Historically airline stocks have tended
to trade in the same direction as fuel prices
Exceptions: supply shocks or wars
Refining margins at $11.9/ bbl
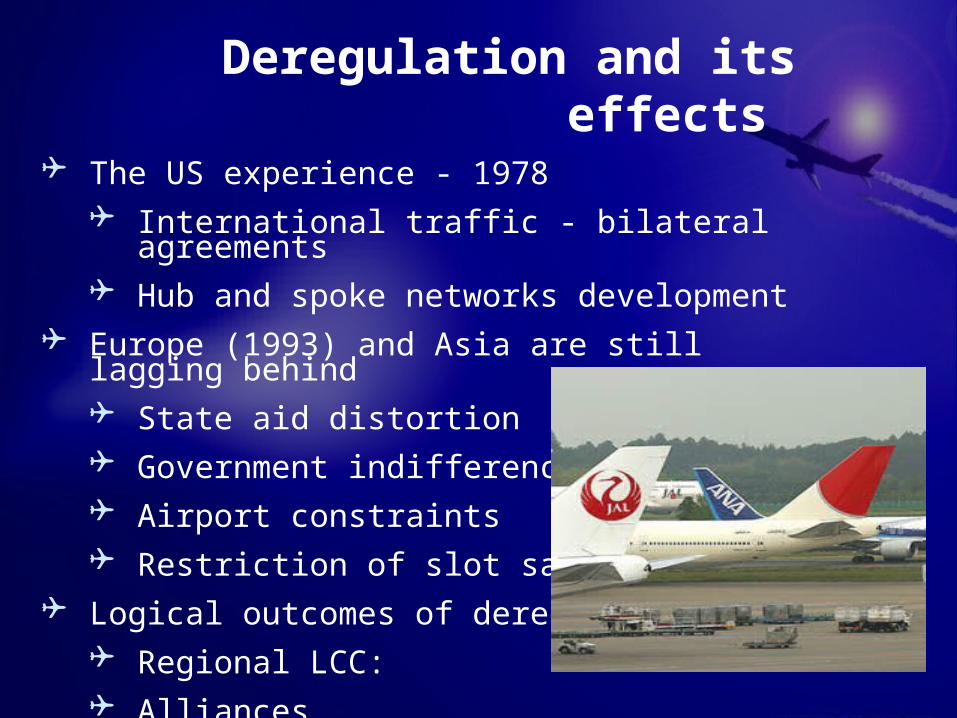
The US experience - 1978 International traffic - bilateral agreements Hub and spoke networks development
Europe (1993) and Asia are still lagging behind State aid distortion Government indifference Airport constraints Restriction of slot sales
Logical outcomes of deregulation: Regional LCC: Alliances
Deregulation and its effects
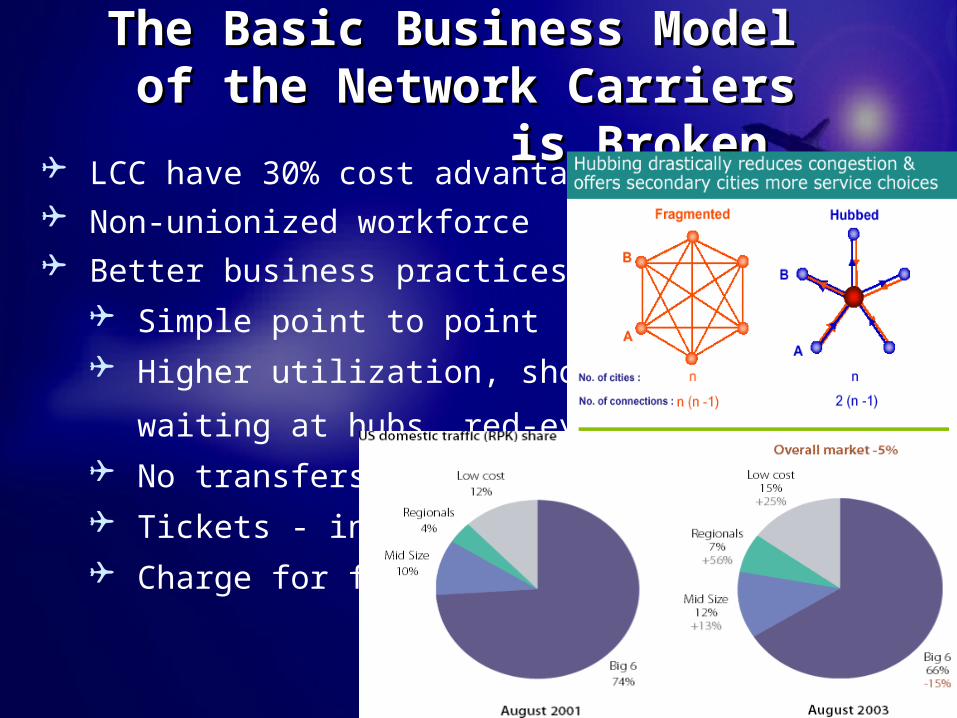
LCC have 30% cost advantage Non-unionized workforce Better business practices:
Simple point to point
Higher utilization, shorter turns, no waiting at hubs, red-eyes
No transfers
Tickets - internet
Charge for food and drink
The Basic Business Model of the The Basic Business Model of the Network Carriers is BrokenNetwork Carriers is Broken
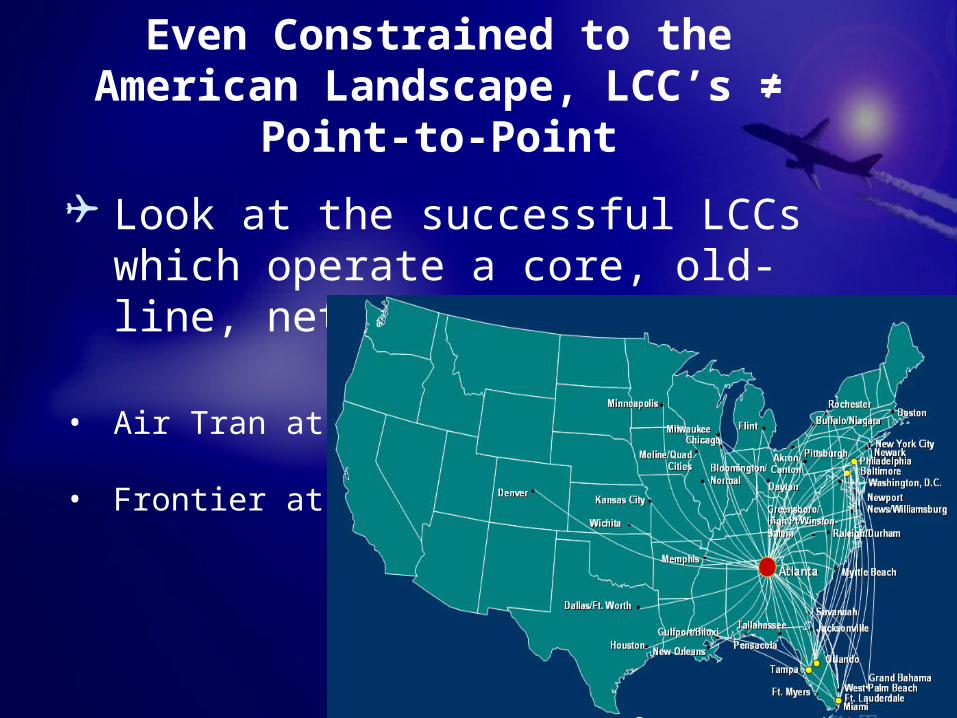
Look at the successful LCCs which operate a core, old-line, network hub operation
• Air Tran at ATL
• Frontier at DEN
Even Constrained to the American Landscape, LCC’s ≠ Point-to-Point
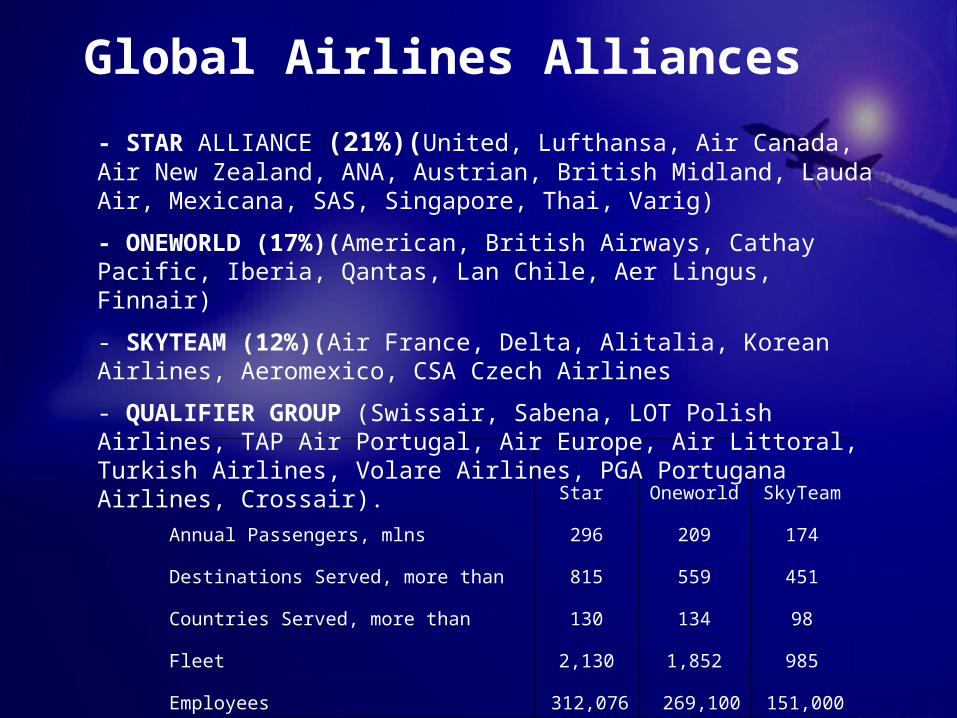
Global Airlines Alliances
Star Oneworld SkyTeam
Annual Passengers, mlns 296 209 174
Destinations Served, more than 815 559 451
Countries Served, more than 130 134 98
Fleet 2,130 1,852 985
Employees 312,076 269,100 151,000
- STAR ALLIANCE (21%)(United, Lufthansa, Air Canada, Air New Zealand, ANA, Austrian, British Midland, Lauda Air, Mexicana, SAS, Singapore, Thai, Varig)
- ONEWORLD (17%)(American, British Airways, Cathay Pacific, Iberia, Qantas, Lan Chile, Aer Lingus, Finnair)
- SKYTEAM (12%)(Air France, Delta, Alitalia, Korean Airlines, Aeromexico, CSA Czech Airlines
- QUALIFIER GROUP (Swissair, Sabena, LOT Polish Airlines, TAP Air Portugal, Air Europe, Air Littoral, Turkish Airlines, Volare Airlines, PGA Portugana Airlines, Crossair).
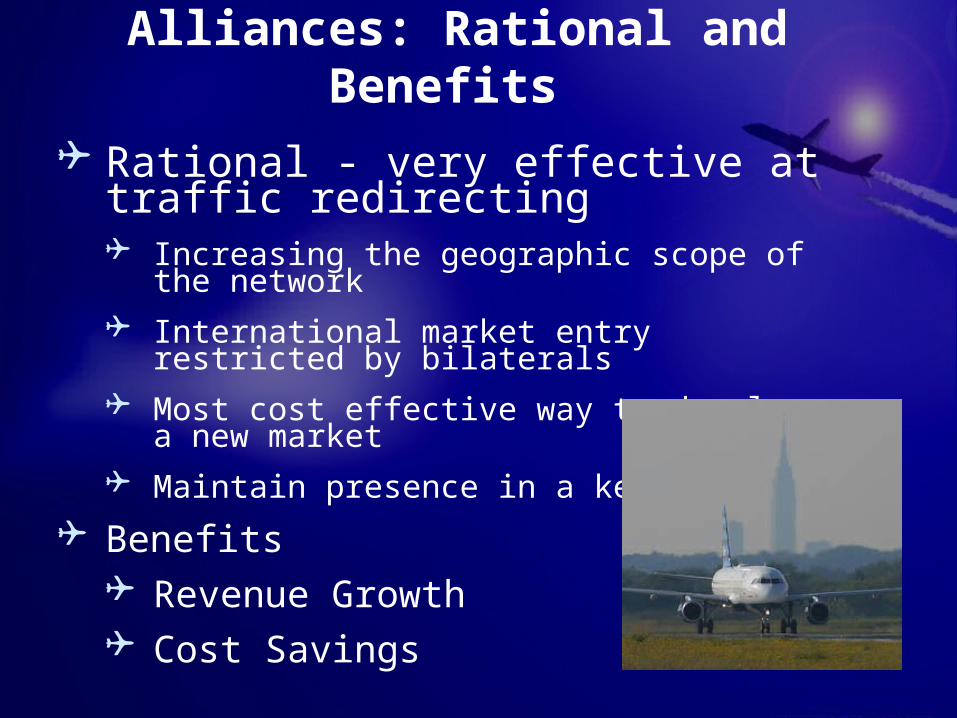
Alliances: Rational and Benefits
Rational - very effective at traffic redirecting Increasing the geographic scope of the network
International market entry restricted by bilaterals
Most cost effective way to develop a new market
Maintain presence in a key market
Benefits Revenue Growth Cost Savings
bbb
ccc
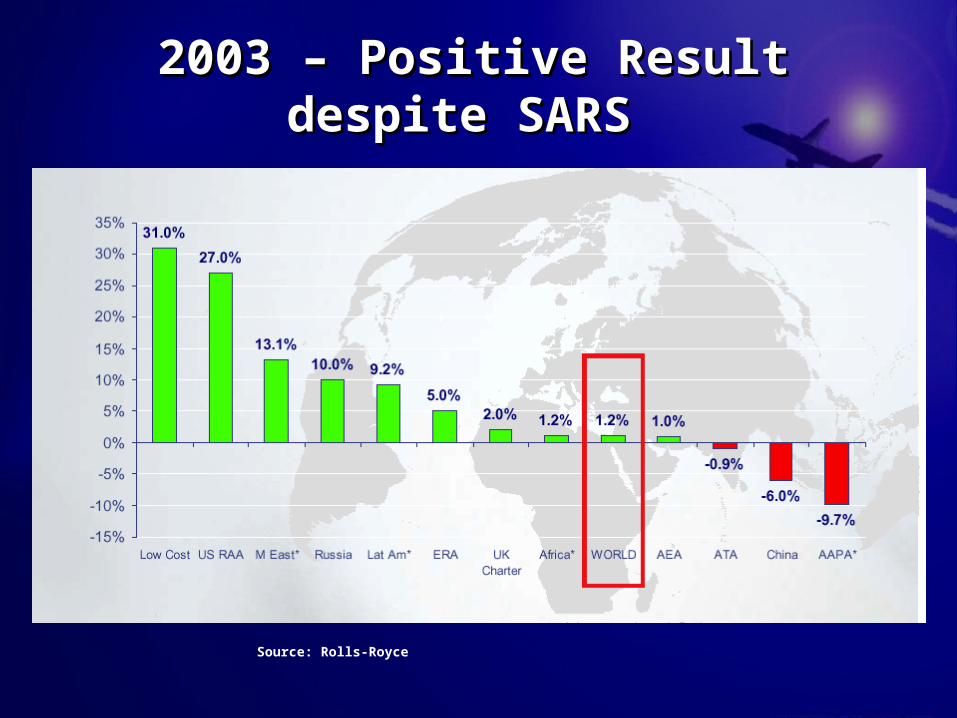
2003 – 2003 – Positive Result Positive Result ddespite SARSespite SARS
Source: Rolls-Royce
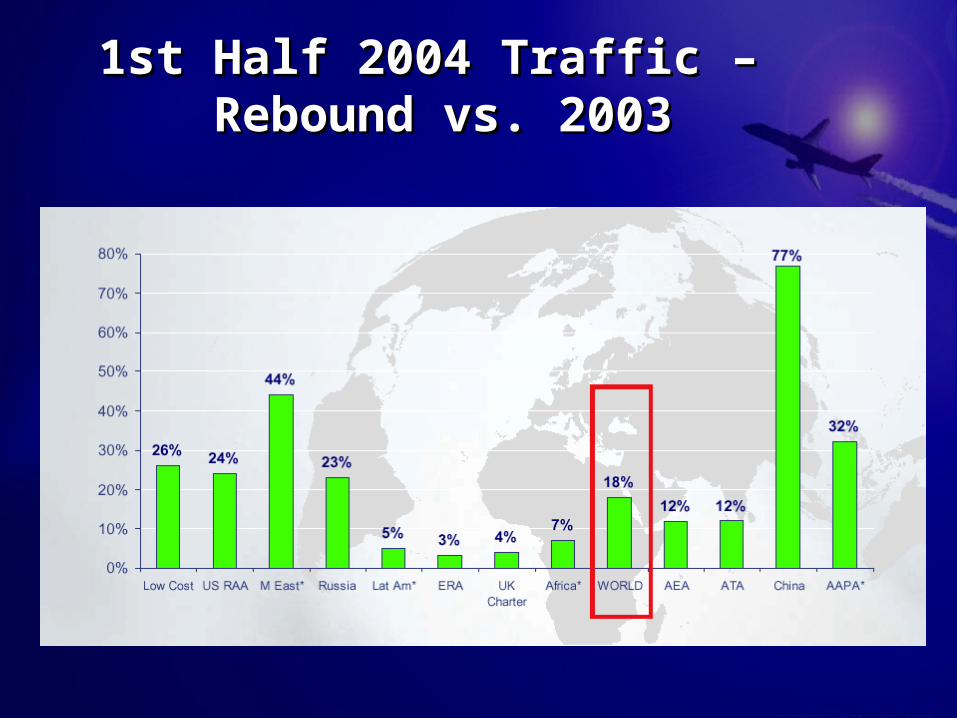
11st st HHalf 2004 alf 2004 TTraffic – raffic – RRebound vs. 2003ebound vs. 2003
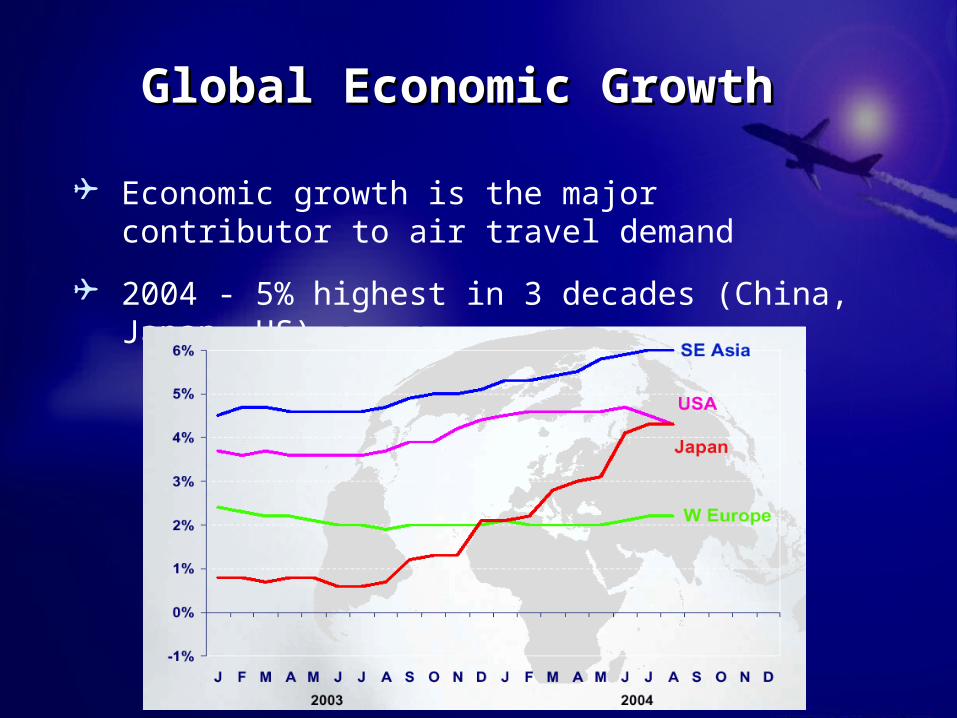
Economic growth is the major contributor to air travel demand
2004 - 5% highest in 3 decades (China, Japan, US)
Global Economic GrowthGlobal Economic Growth
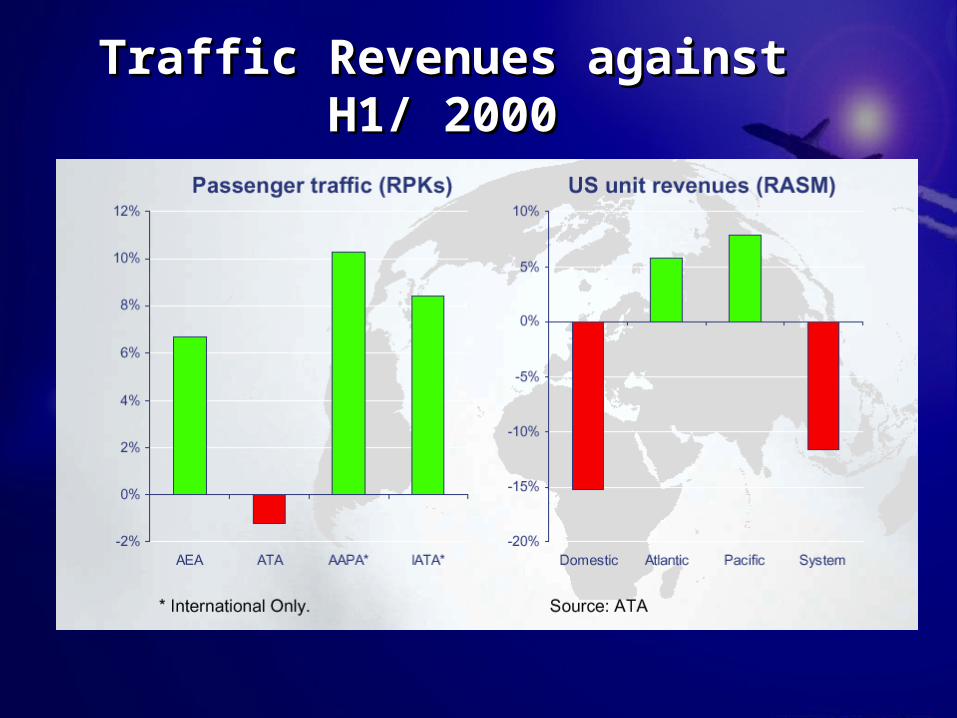
Traffic Revenues against H1/ 2000Traffic Revenues against H1/ 2000
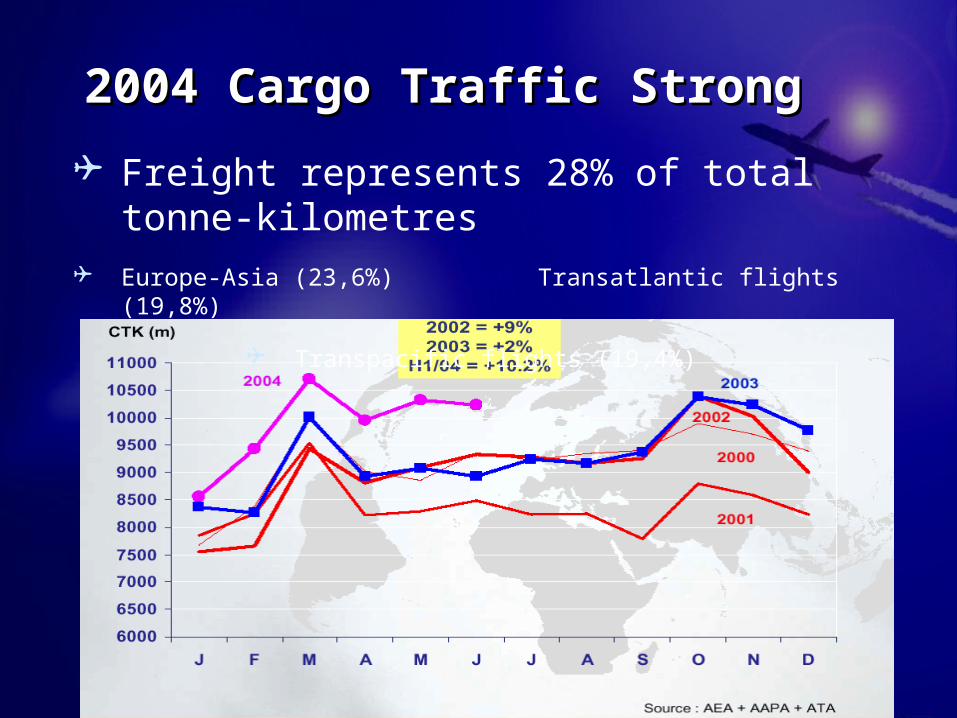
2004 2004 CCargo argo TTraffic raffic SStrongtrong
Freight represents 28% of total tonne-kilometres Europe-Asia (23,6%) Transatlantic flights (19,8%)
Transpacific flights (19,4%)
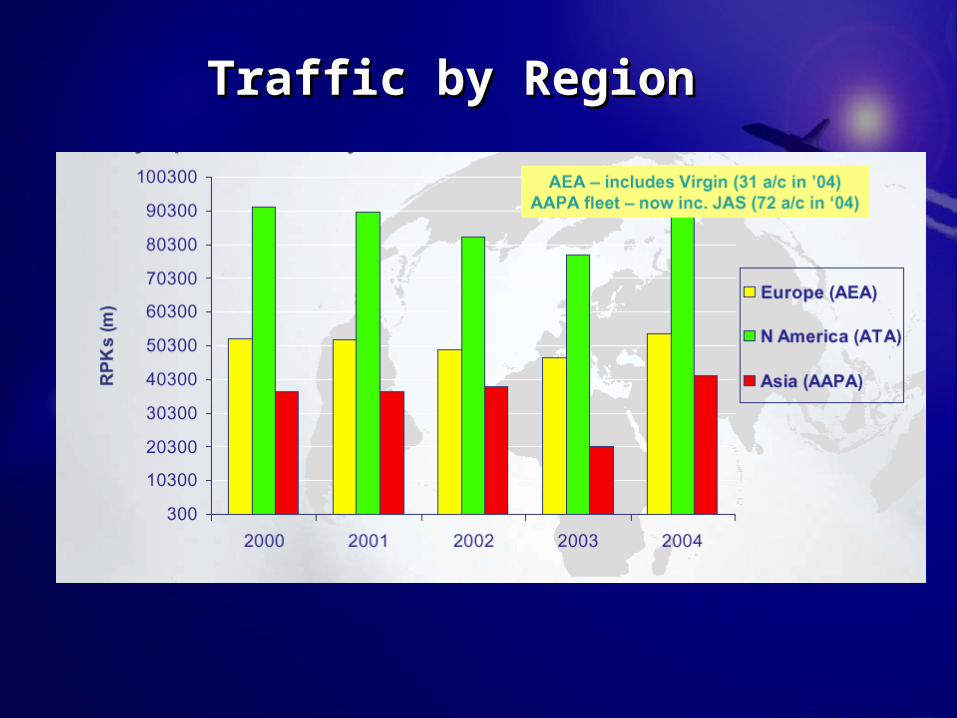
Traffic by RegionTraffic by Region
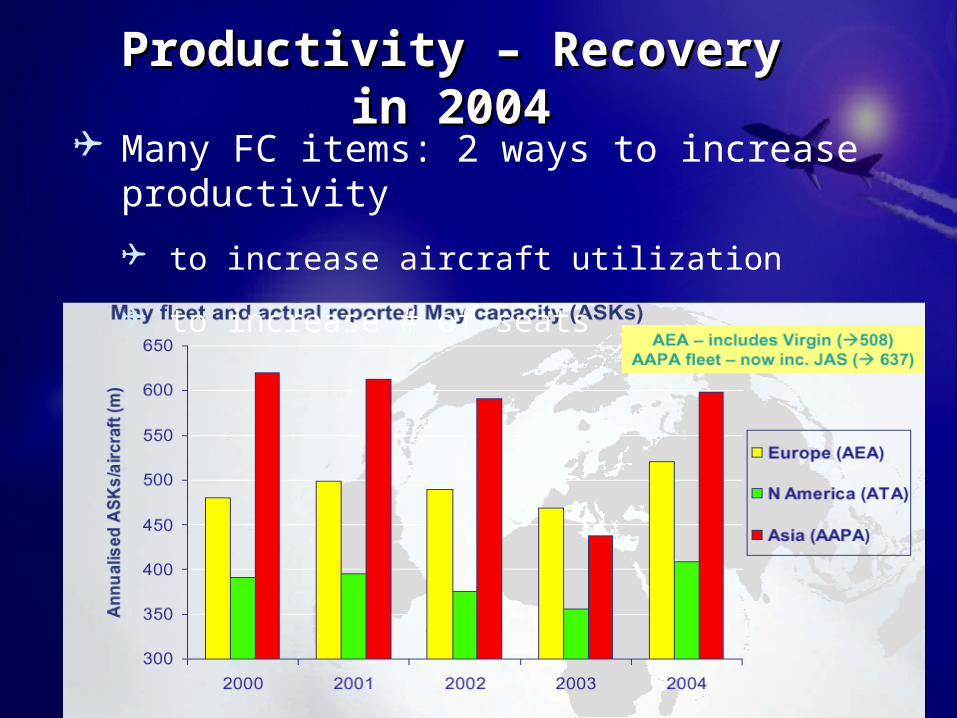
Productivity – Productivity – RRecovery in ecovery in 22004004 Many FC items: 2 ways to increase productivity
to increase aircraft utilization
to increase # of seats
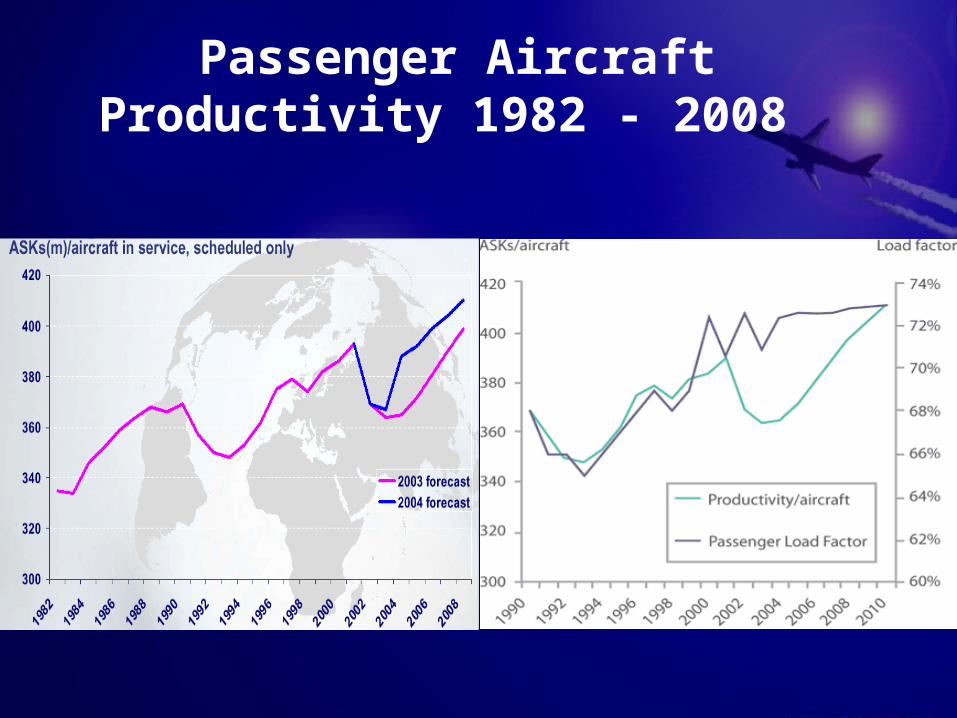
Passenger Aircraft Productivity 1982 - 2008
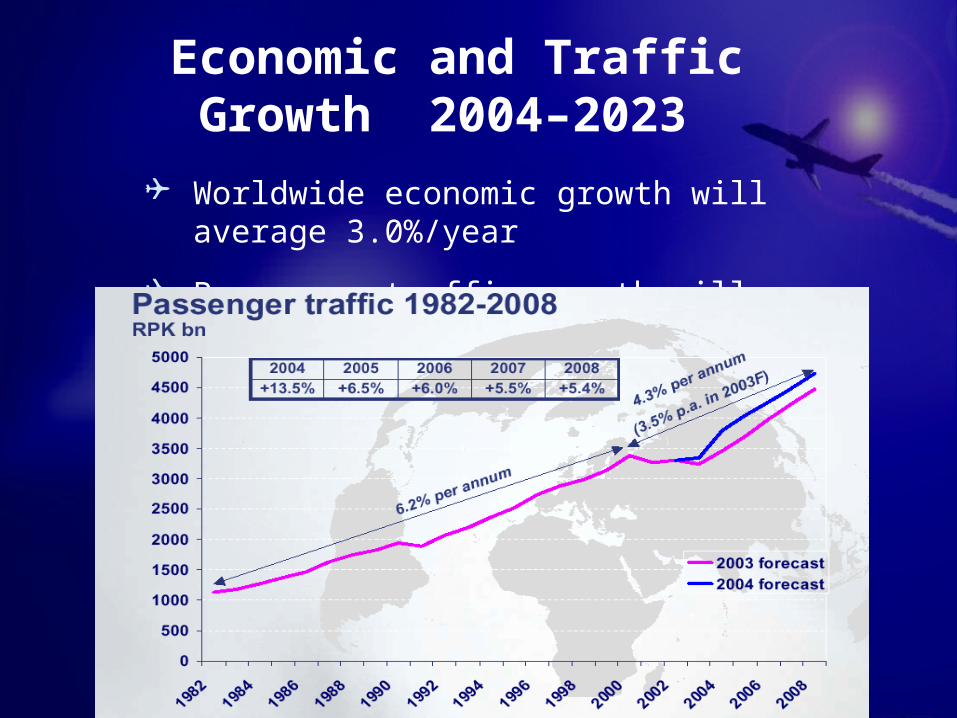
Worldwide economic growth will average 3.0%/year
Passenger traffic growth will average 4-5% per year
Cargo traffic growth will average 6.2% per year
Economic and Traffic Growth 2004–2023
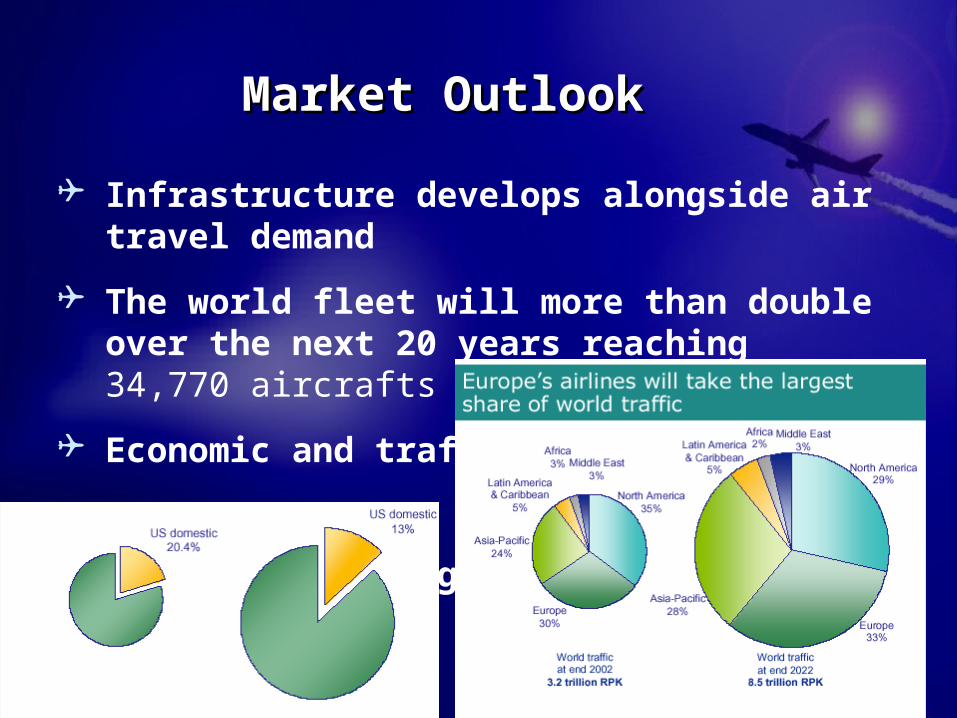
Infrastructure develops alongside air travel demand
The world fleet will more than double over the next 20 years reaching 34,770 aircrafts (25,000 new)
Economic and traffic growth rates vary by region
Market OutlookMarket Outlook
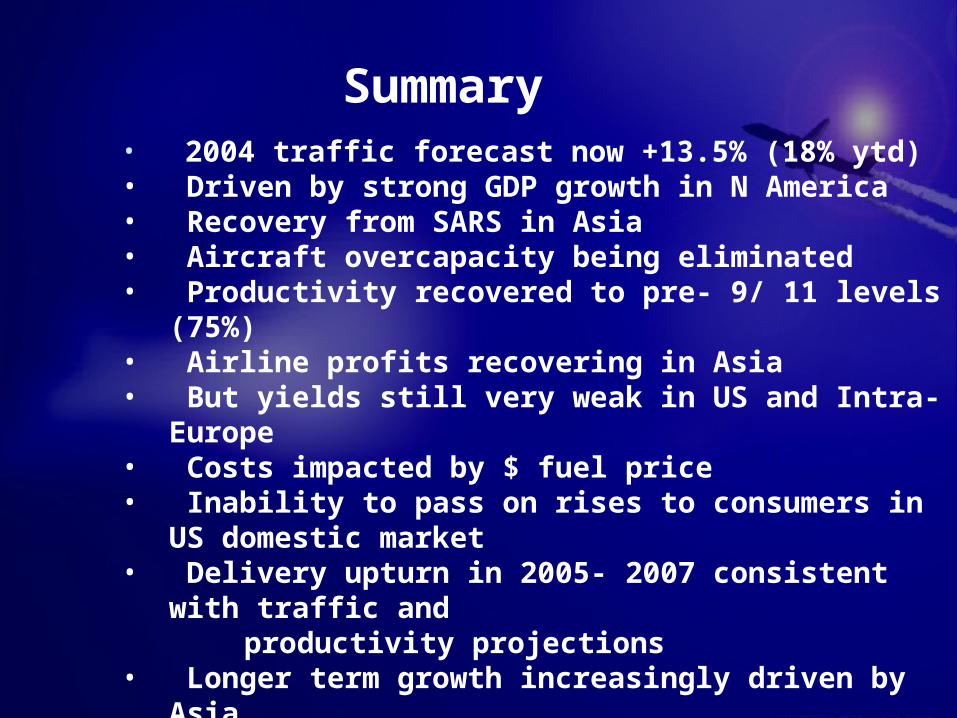
• 2004 traffic forecast now +13.5% (18% ytd)• Driven by strong GDP growth in N America• Recovery from SARS in Asia• Aircraft overcapacity being eliminated• Productivity recovered to pre- 9/ 11 levels (75%)• Airline profits recovering in Asia• But yields still very weak in US and Intra- Europe• Costs impacted by $ fuel price• Inability to pass on rises to consumers in US domestic market• Delivery upturn in 2005- 2007 consistent with traffic and productivity projections• Longer term growth increasingly driven by Asia
Summary
Delta AirlinesDelta Airlines
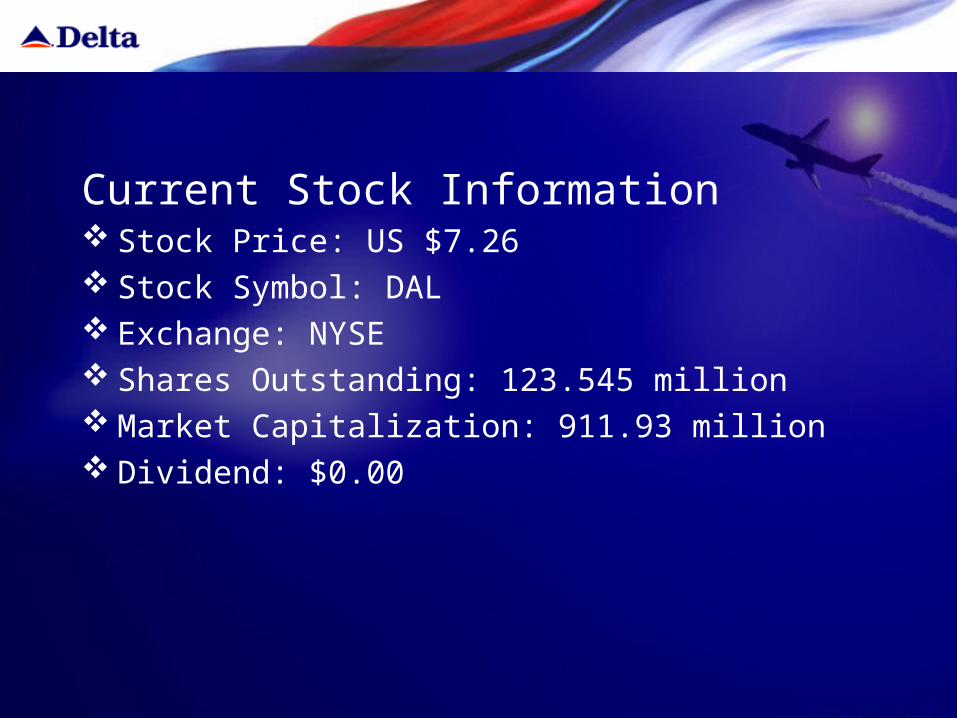
Current Stock Information Stock Price: US $7.26 Stock Symbol: DAL Exchange: NYSE Shares Outstanding: 123.545 million Market Capitalization: 911.93 million Dividend: $0.00
History & Facts Started as crop-dusting operator First flight in 1929 as Delta Airlines Headquarters: Atlanta, Georgia CEO: Gerald Grinstein Employee: 60,000+ Daily flights with partners: 7,500+ Destinations: 496 cities in 88 countries
Management Team Gerald Grinstein
- Chief Executive Officer, 20yrs experience in airline industry
Michael Palumbo- Vice President, Chief Financial Officer, responsible for Trans World
Airlines’ on time performance from worst to first
Joe Kolshark- Chief of Operations, served Delta for 16yrs, 757/767 Captain
Jim Whitehurst- Chief Network and Planning Officer
Curtis Robb- Chief Information Officer, 30yrs information technology
experience
Business Structure Connection carriers
• American Eagle• Atlantic Southeast Airlines• Chautauqua Airlines• Comair• SkyWest
Shuttle• Northeastern States
SkyTeam Alliance• Global Alliance
Song• Low-cost Carrier
Codeshare Partners
Current Situation Losing over $3 billion since 2001 Facing bankruptcy protection, Chapter 11 filing Expecting 2,000 maintenance, 3,000 customer
service and 1,800 management job losses in 2005 Agreed 32.5% pay cut, fewer benefits for pilots,
saving nearly $1 billion
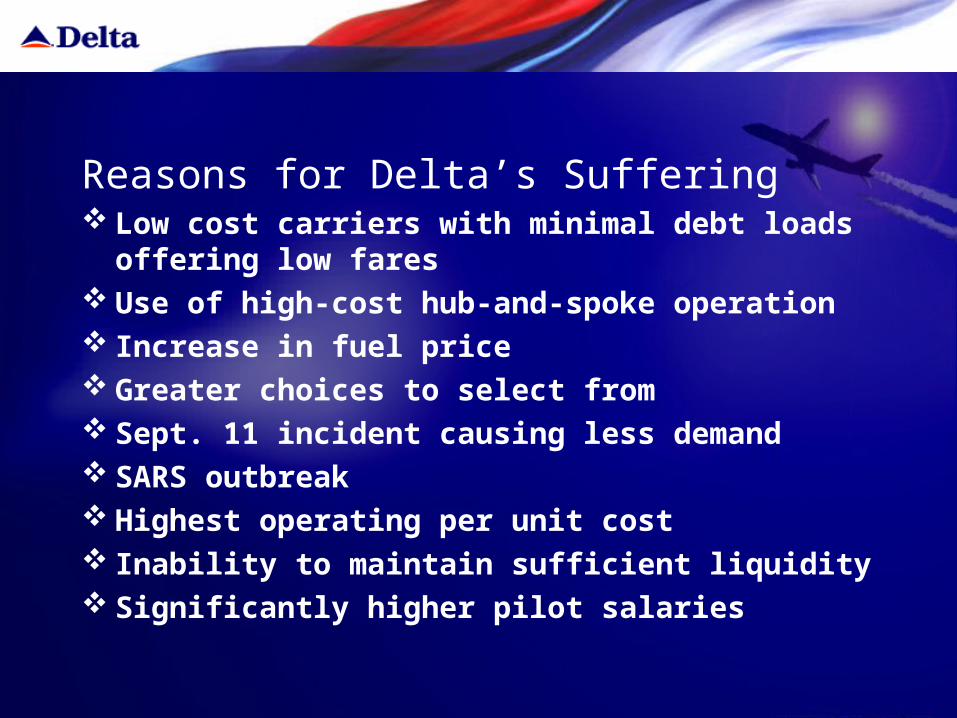
Reasons for Delta’s Suffering Low cost carriers with minimal debt loads
offering low fares Use of high-cost hub-and-spoke operation Increase in fuel price Greater choices to select from Sept. 11 incident causing less demand SARS outbreak Highest operating per unit cost Inability to maintain sufficient liquidity Significantly higher pilot salaries
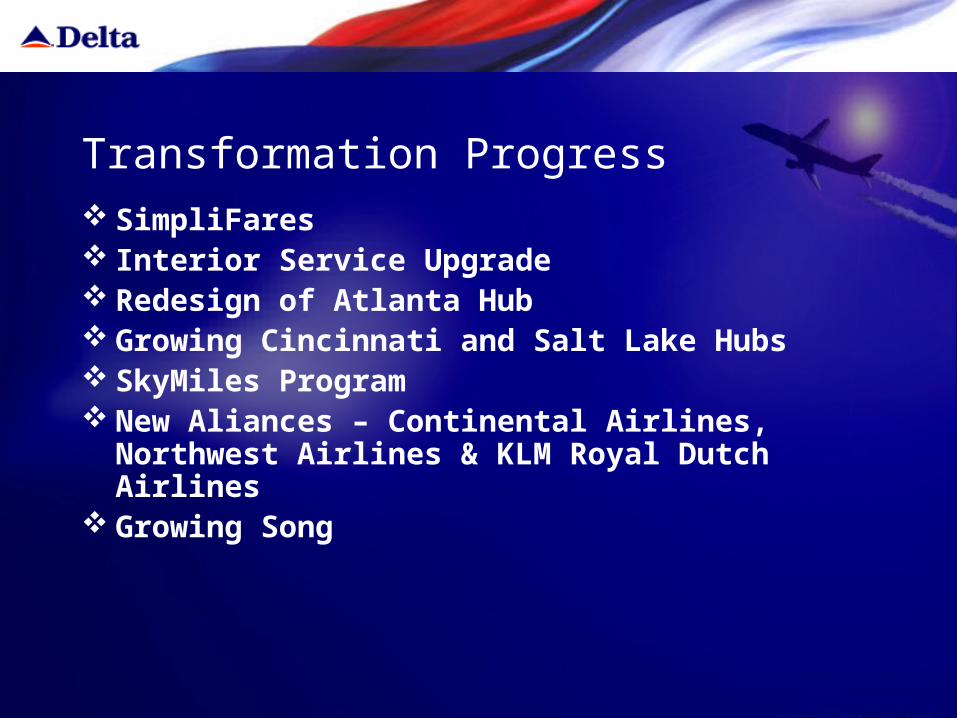
Transformation Progress SimpliFares Interior Service Upgrade Redesign of Atlanta Hub Growing Cincinnati and Salt Lake Hubs SkyMiles Program New Aliances – Continental Airlines, Northwest
Airlines & KLM Royal Dutch Airlines Growing Song
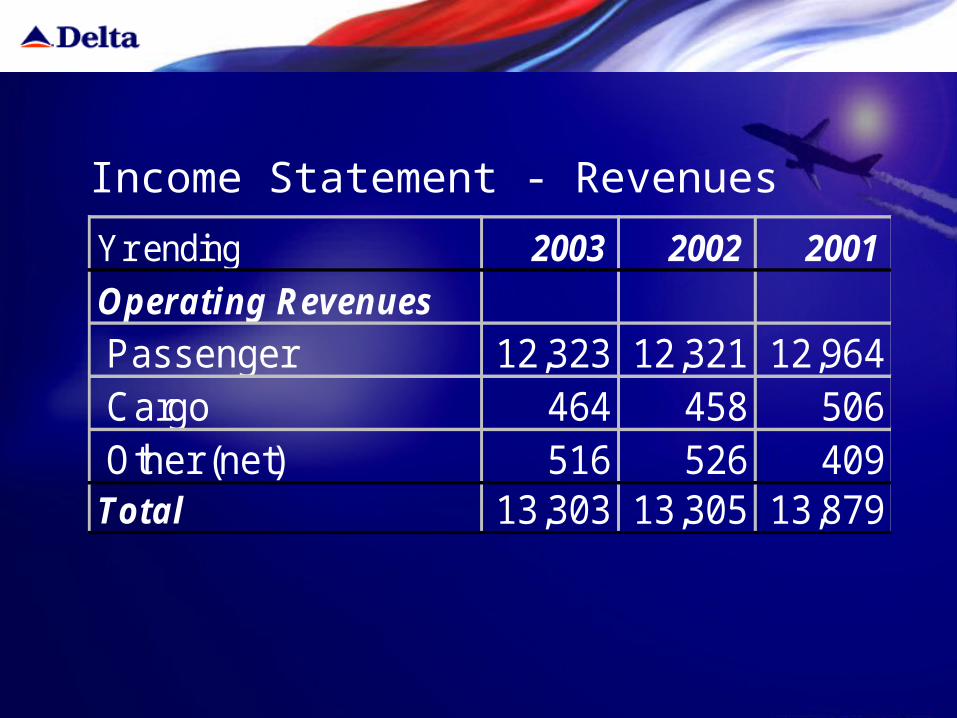
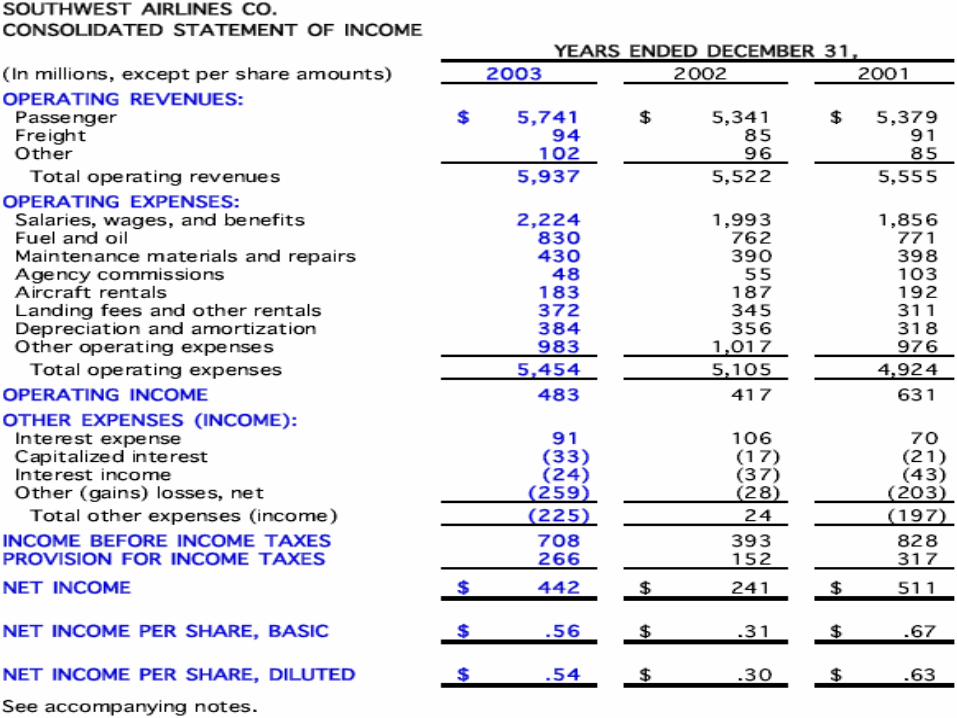
Yr ending 2003 2002 2001
Operating Revenues
Passenger 12,323 12,321 12,964 Cargo 464 458 506 Other (net) 516 526 409Total 13,303 13,305 13,879
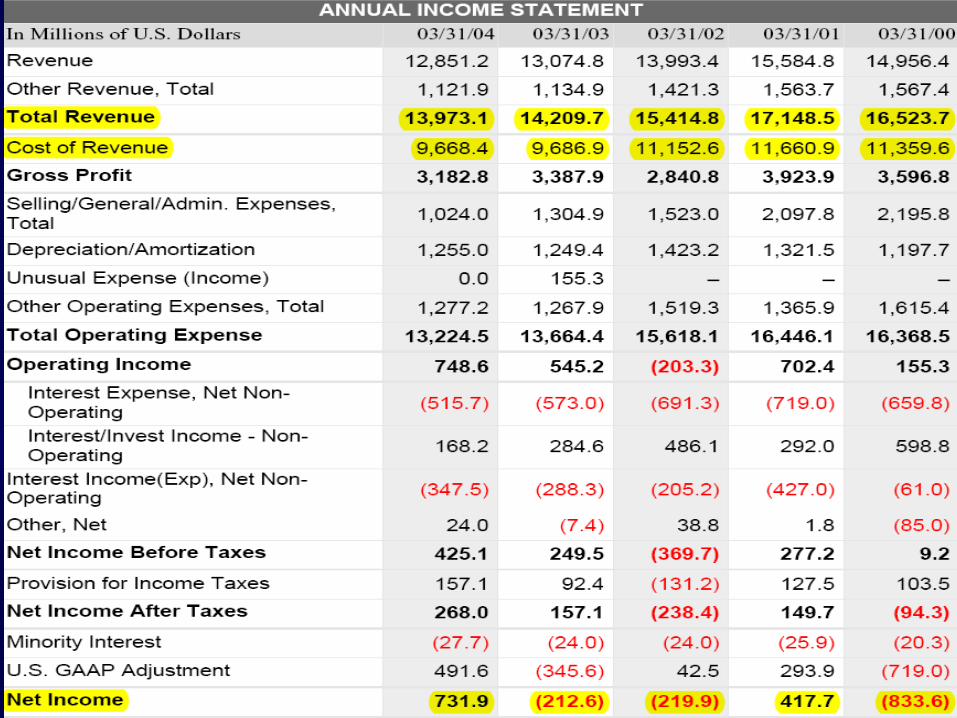
Income Statement - Revenues
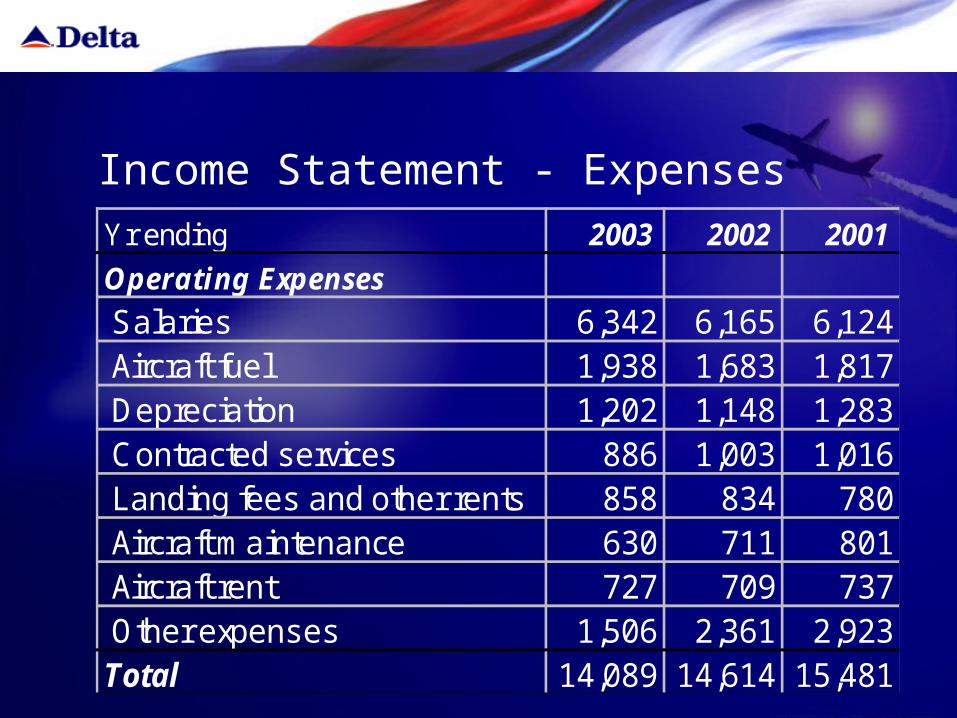
Yr ending 2003 2002 2001
Operating Expenses
Salaries 6,342 6,165 6,124 Aircraft fuel 1,938 1,683 1,817 Depreciation 1,202 1,148 1,283 Contracted services 886 1,003 1,016 Landing fees and other rents 858 834 780 Aircraft maintenance 630 711 801 Aircraft rent 727 709 737 Other expenses 1,506 2,361 2,923Total 14,089 14,614 15,481
Income Statement - Expenses
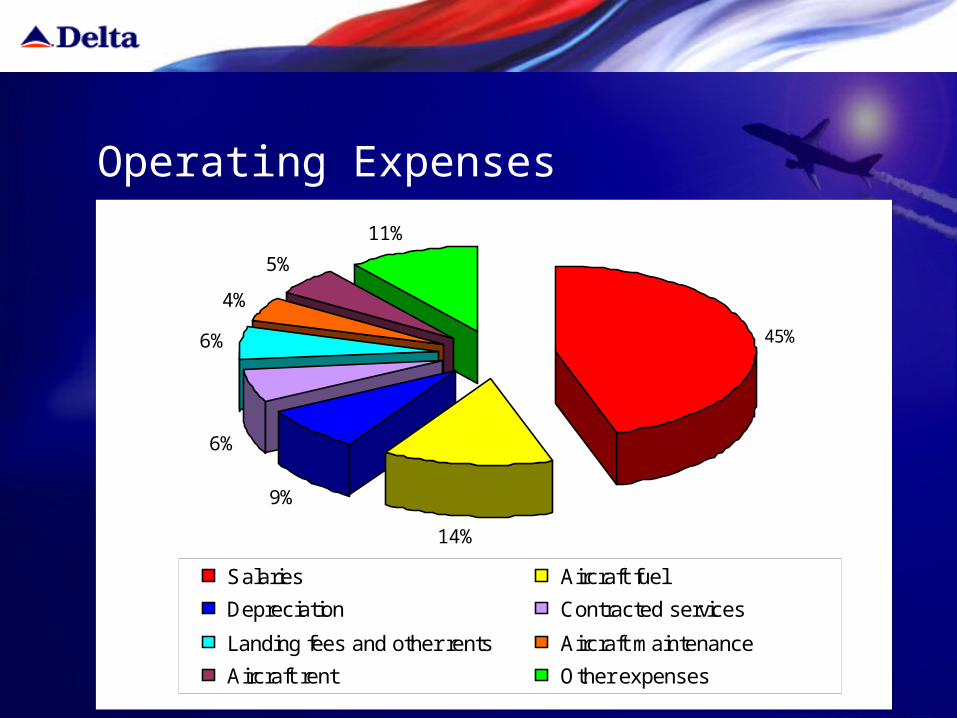
14%
9%
6%
6%
4%
5%
11%
45%
Salaries Aircraft fuel
Depreciation Contracted services
Landing fees and other rents Aircraft maintenance
Aircraft rent Other expenses
Operating Expenses
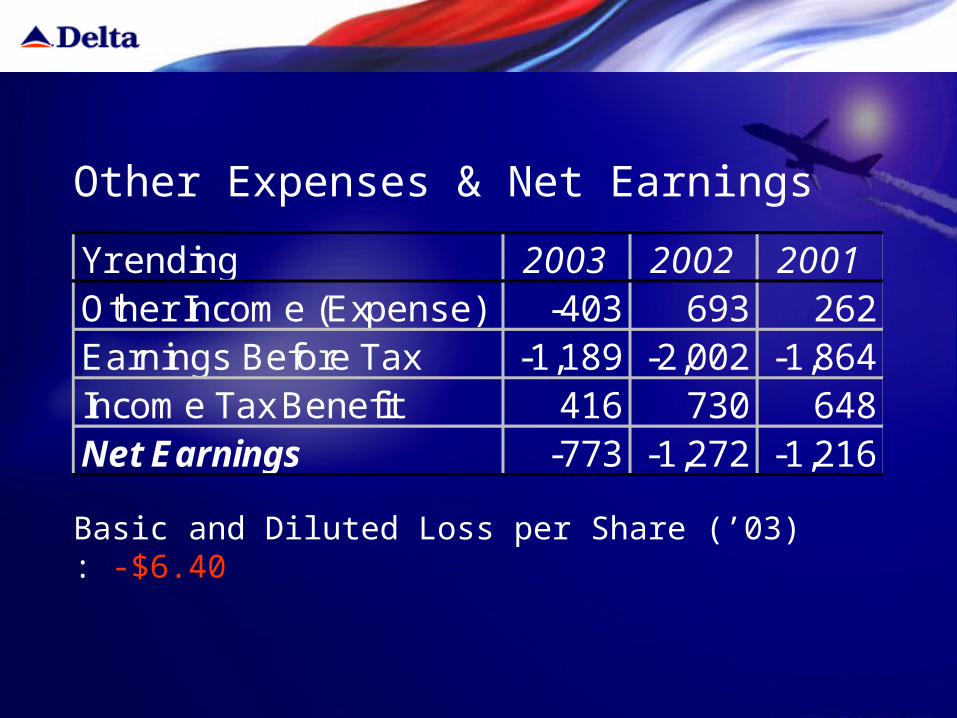
Other Expenses & Net Earnings
Yr ending 2003 2002 2001Other Income (Expense) -403 693 262Earnings Before Tax -1,189 -2,002 -1,864Income Tax Benefit 416 730 648Net Earnings -773 -1,272 -1,216
Basic and Diluted Loss per Share (’03) : -$6.40
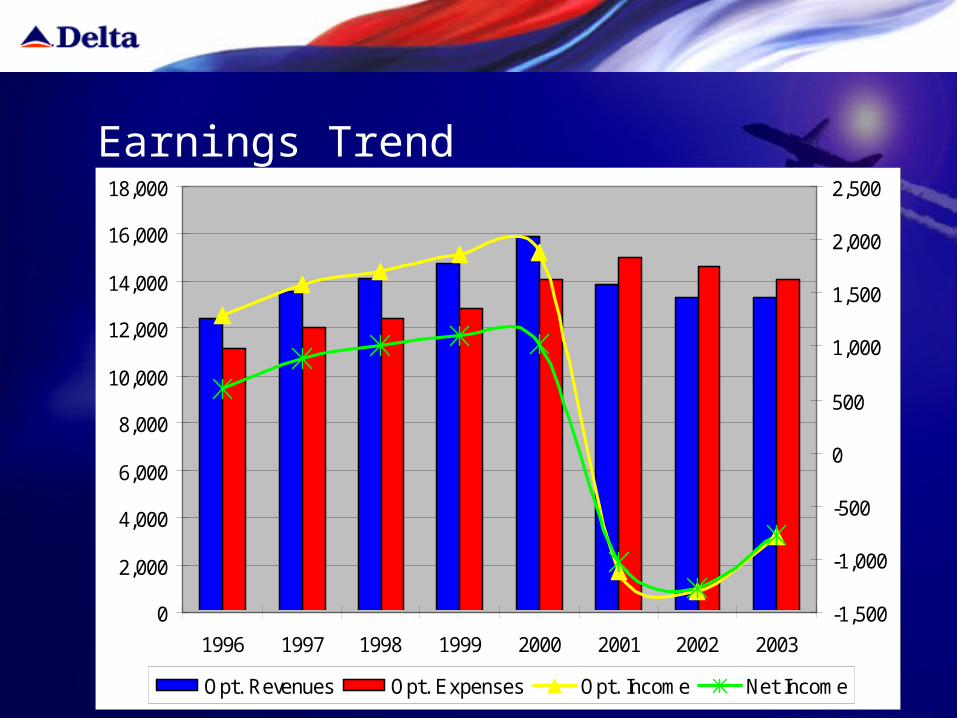
0
2,000
4,000
6,000
8,000
10,000
12,000
14,000
16,000
18,000
1996 1997 1998 1999 2000 2001 2002 2003
-1,500
-1,000
-500
0
500
1,000
1,500
2,000
2,500
Opt. Revenues Opt. Expenses Opt. Income Net Income
Earnings Trend
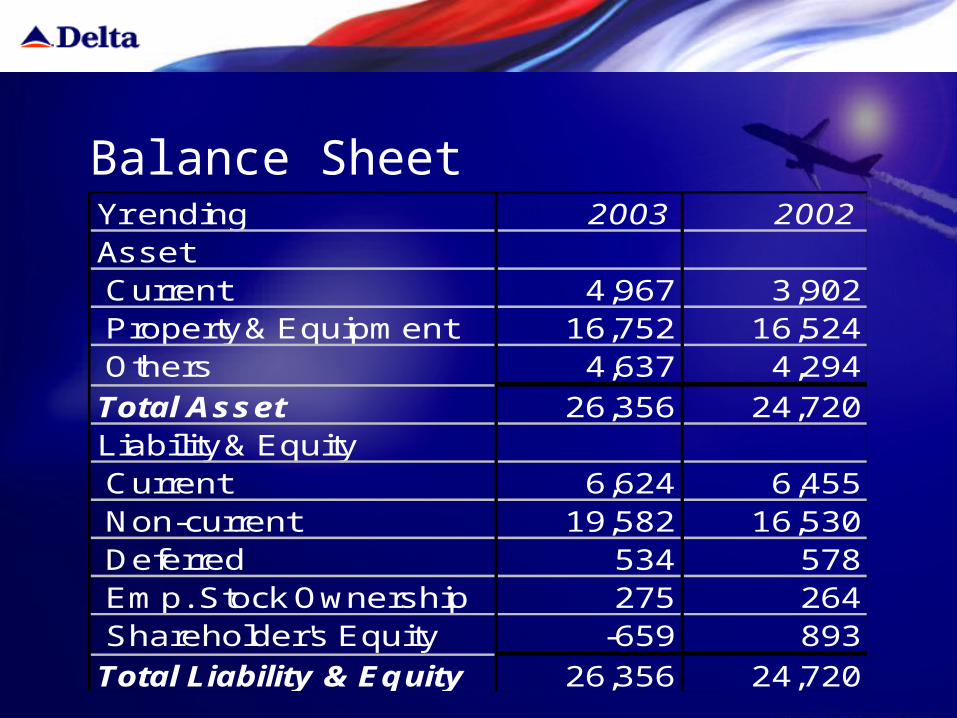
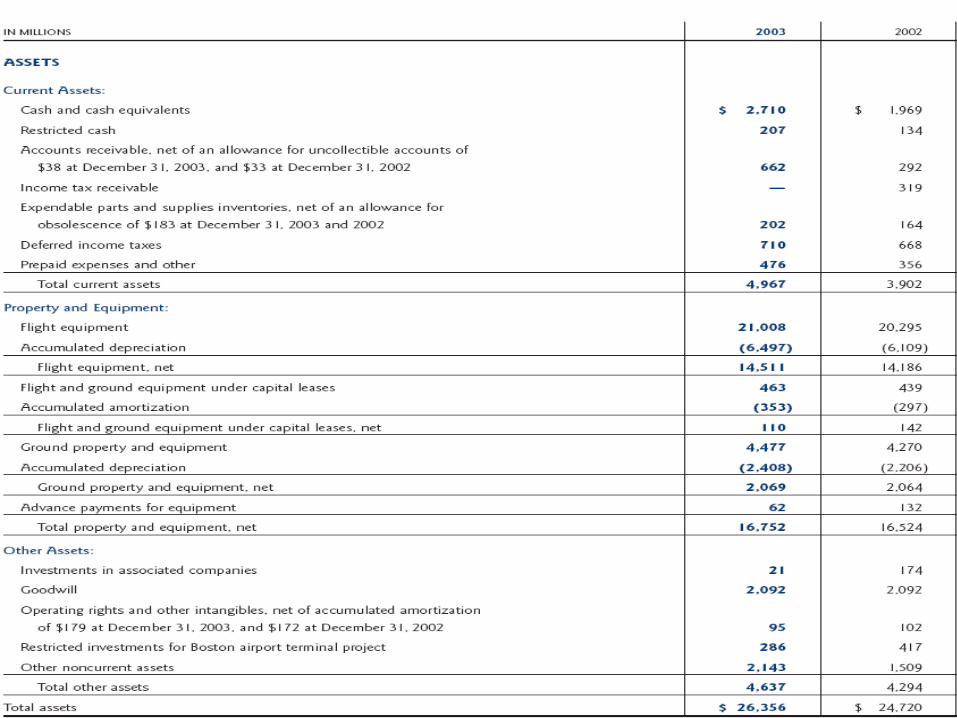
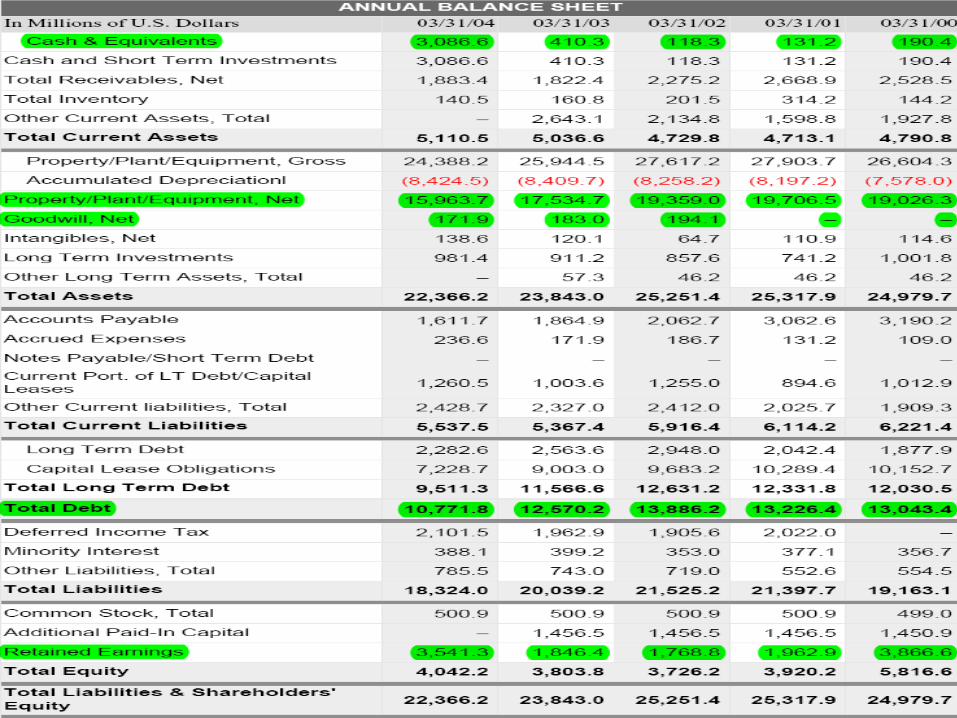
Balance SheetYr ending 2003 2002Asset Current 4,967 3,902 Property & Equipment 16,752 16,524 Others 4,637 4,294
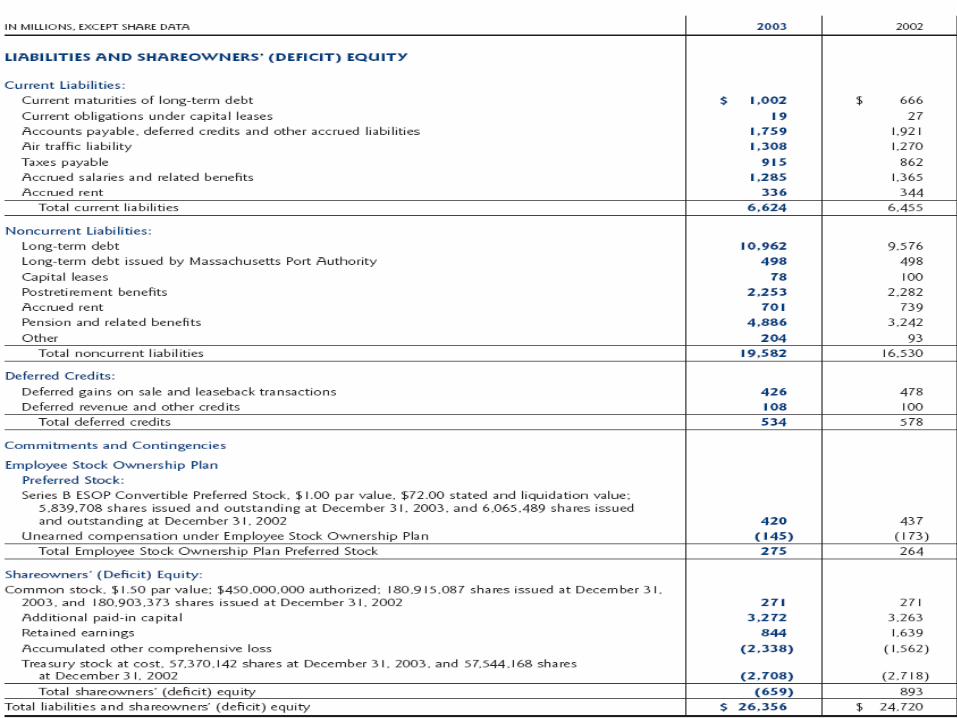
Total Asset 26,356 24,720Liability & Equity Current 6,624 6,455 Non-current 19,582 16,530 Deferred 534 578 Emp. Stock Ownership 275 264 Shareholder's Equity -659 893
Total Liability & Equity 26,356 24,720
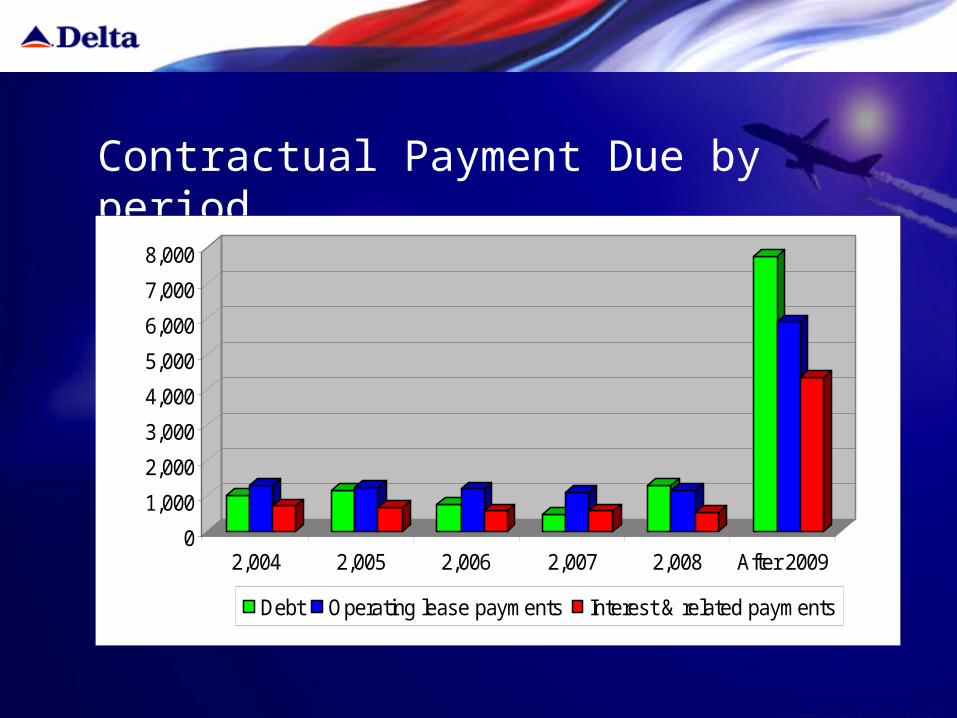
Contractual Payment Due by period
0
1,000
2,000
3,000
4,000
5,000
6,000
7,000
8,000
2,004 2,005 2,006 2,007 2,008 After 2009
Debt Operating lease payments Interest & related payments
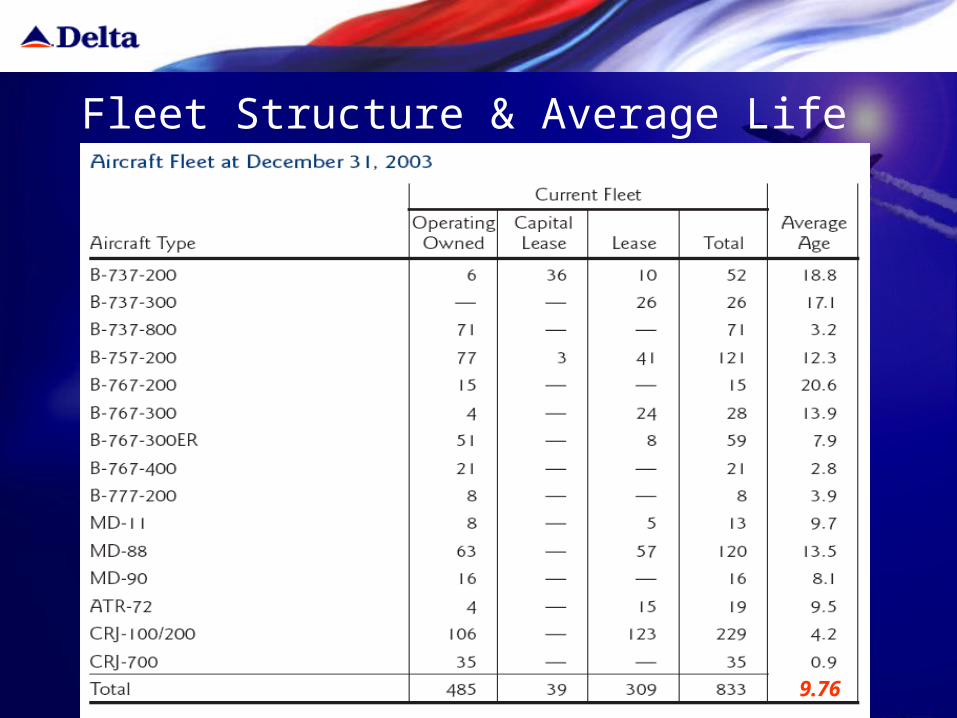
9.76
Fleet Structure & Average Life
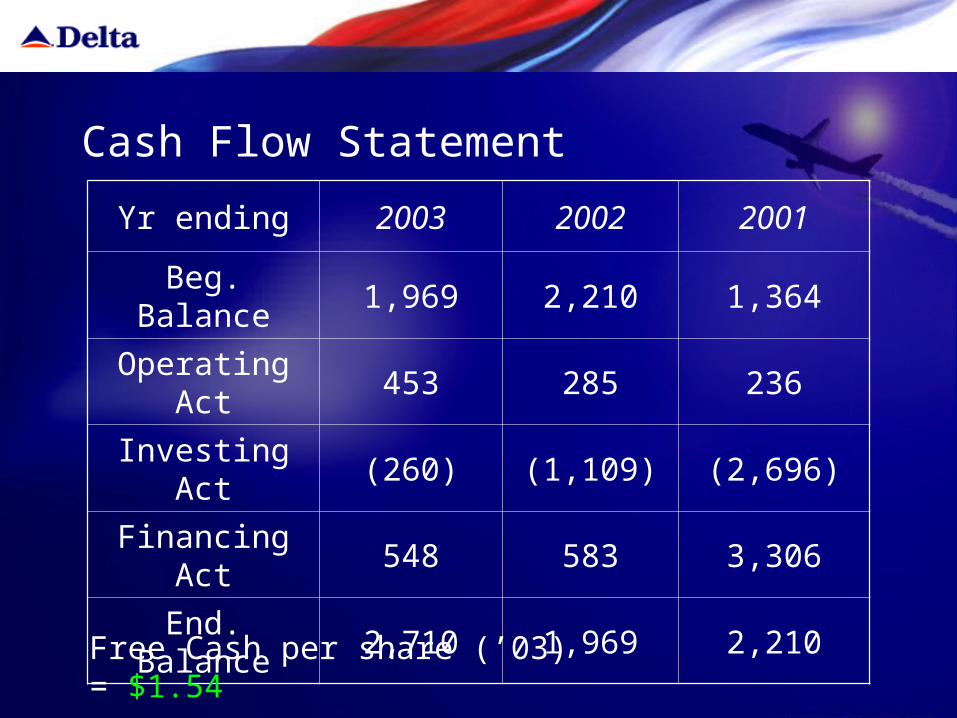
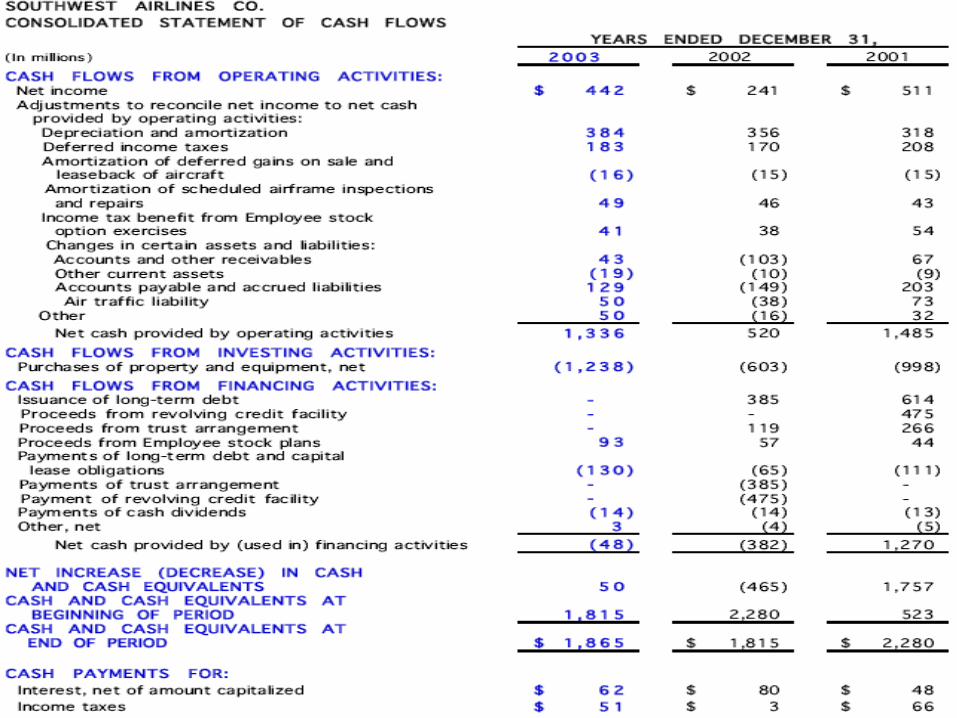
Cash Flow Statement
Yr ending 2003 2002 2001
Beg. Balance 1,969 2,210 1,364
Operating Act 453 285 236
Investing Act (260) (1,109) (2,696)
Financing Act 548 583 3,306
End. Balance 2,710 1,969 2,210
Free Cash per share (’03) = $1.54
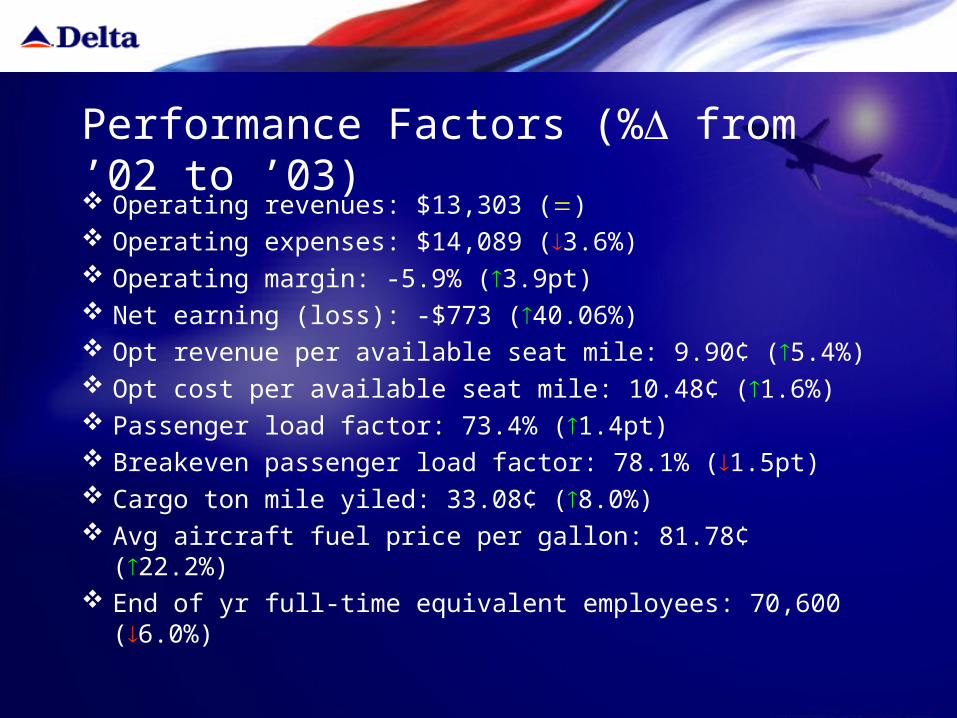
Performance Factors (% from ’02 to ’03) Operating revenues: $13,303 () Operating expenses: $14,089 (3.6%) Operating margin: -5.9% (3.9pt) Net earning (loss): -$773 (40.06%) Opt revenue per available seat mile: 9.90¢ (5.4%) Opt cost per available seat mile: 10.48¢ (1.6%) Passenger load factor: 73.4% (1.4pt) Breakeven passenger load factor: 78.1% (1.5pt) Cargo ton mile yiled: 33.08¢ (8.0%) Avg aircraft fuel price per gallon: 81.78¢ (22.2%) End of yr full-time equivalent employees: 70,600 (6.0%)
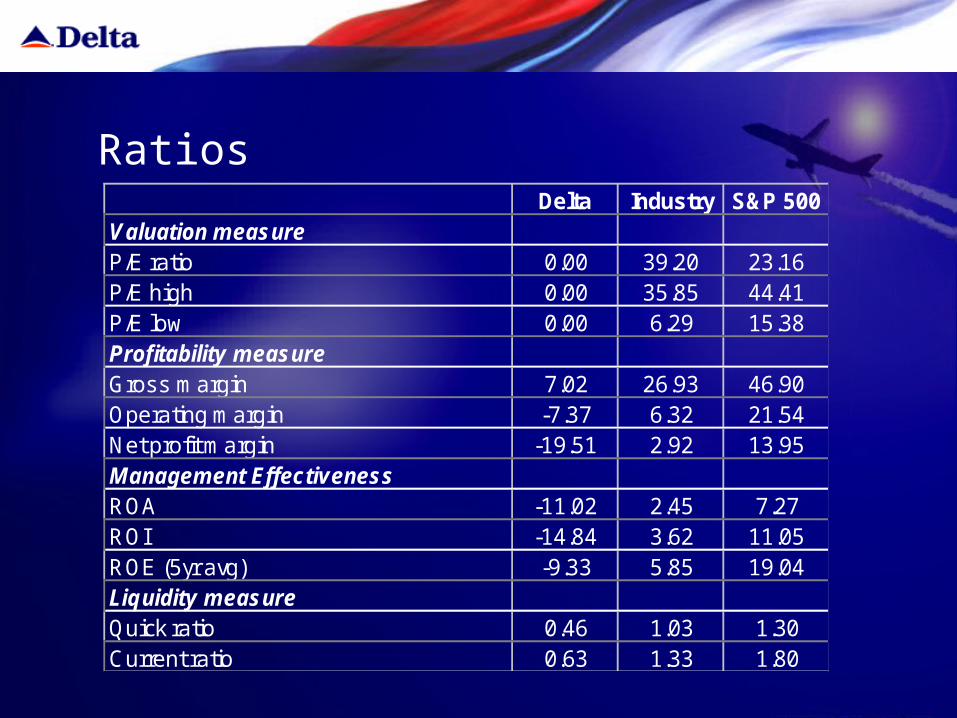
Delta Industry S&P 500Valuation measureP/E ratio 0.00 39.20 23.16P/E high 0.00 35.85 44.41P/E low 0.00 6.29 15.38Profitability measureGross margin 7.02 26.93 46.90Operating margin -7.37 6.32 21.54Net profit margin -19.51 2.92 13.95Management EffectivenessROA -11.02 2.45 7.27ROI -14.84 3.62 11.05ROE (5yr avg) -9.33 5.85 19.04Liquidity measureQuick ratio 0.46 1.03 1.30Current ratio 0.63 1.33 1.80
Ratios
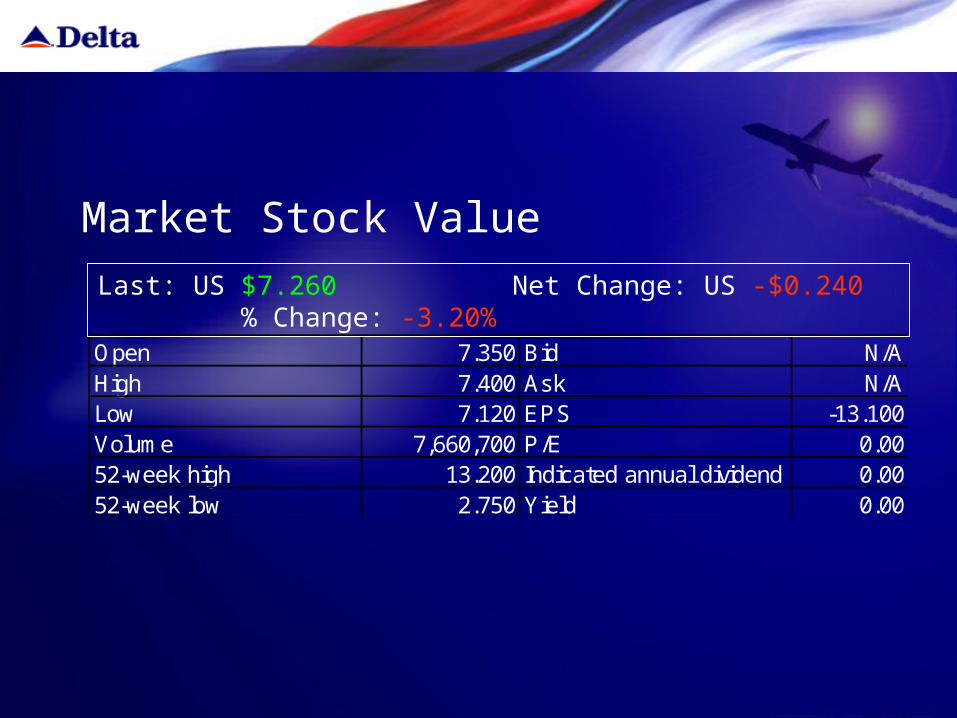
Open 7.350 Bid N/AHigh 7.400 Ask N/ALow 7.120 EPS -13.100Volume 7,660,700 P/E 0.0052-week high 13.200 Indicated annual dividend 0.0052-week low 2.750 Yield 0.00
Last: US $7.260 Net Change: US -$0.240 % Change: -3.20%
Market Stock Value
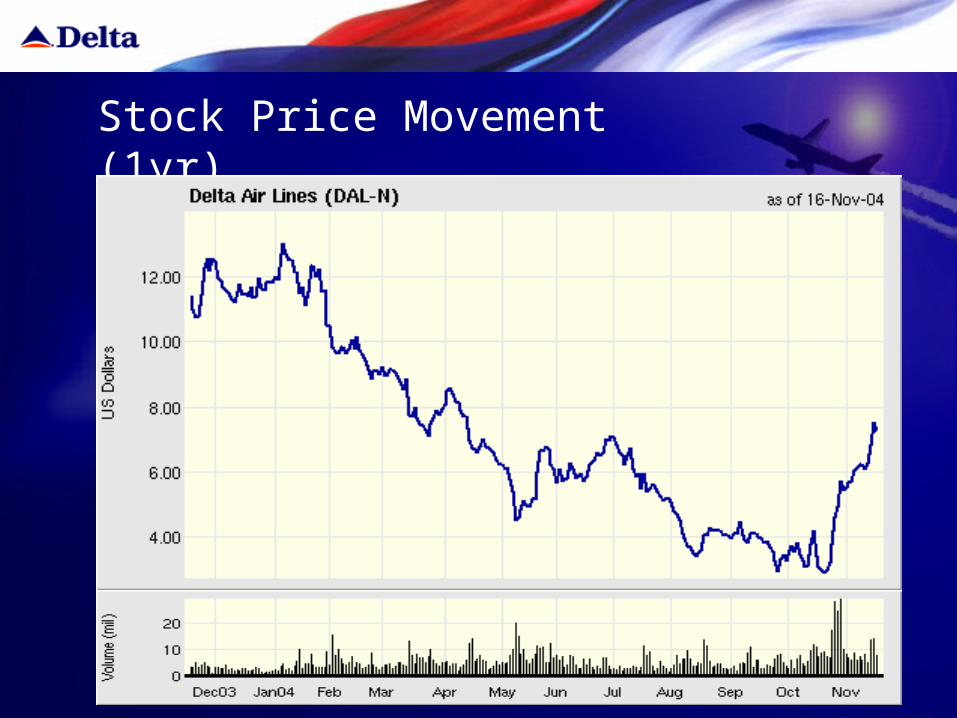
Stock Price Movement (1yr)
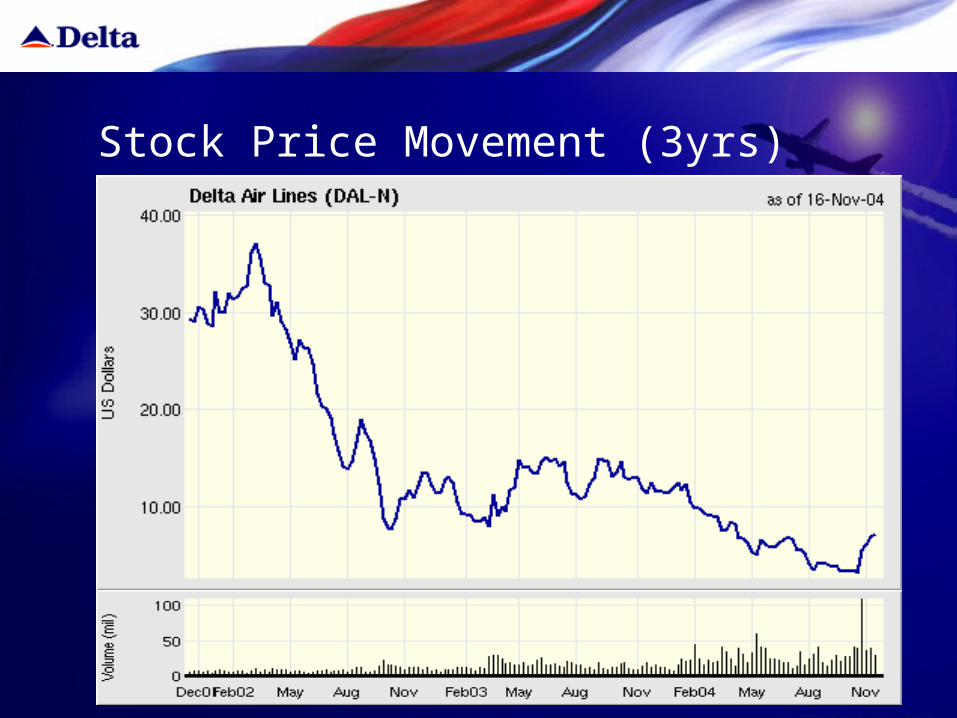
Stock Price Movement (3yrs)
Recommendation
Huge Outstanding LT Debt Extremely Volatile Market Condition No Dividend Payment Continuous Down Stream Stock Movement
- SELL -
Southwest Airlines
Stock Information
Stock Symbol: LUVStock Exchange: NYSE Stock Price: $15.89Shares Outstanding: 793.33 MMarket Cap: 12.606BDividend: $0.018
Company History
Commenced service on June 18, 1971– using 3 Boeing 737 aircraft servicing state of Texas
simple notion: lowest possible fares, on-time delivery, and excellent customer service.
Became a major airline in 1989
2003 was 31st consecutive year of profitability
Corporate Statistics
Offers flights within United States
2900 flights per day
Flies to 59 cities (60 airports) in 31 states
Operates 405 Boeing 737 jets
Awards
Named “Most admired airline” for the second straight year in 2003 by FORTUNE magazine
Ranked in top 5 for “Best companies in America to work for” by FORTUNE magazine
Ranked #1 in fewest customer complaints for 13th consecutive year- Department of Transportation's Consumer Report.
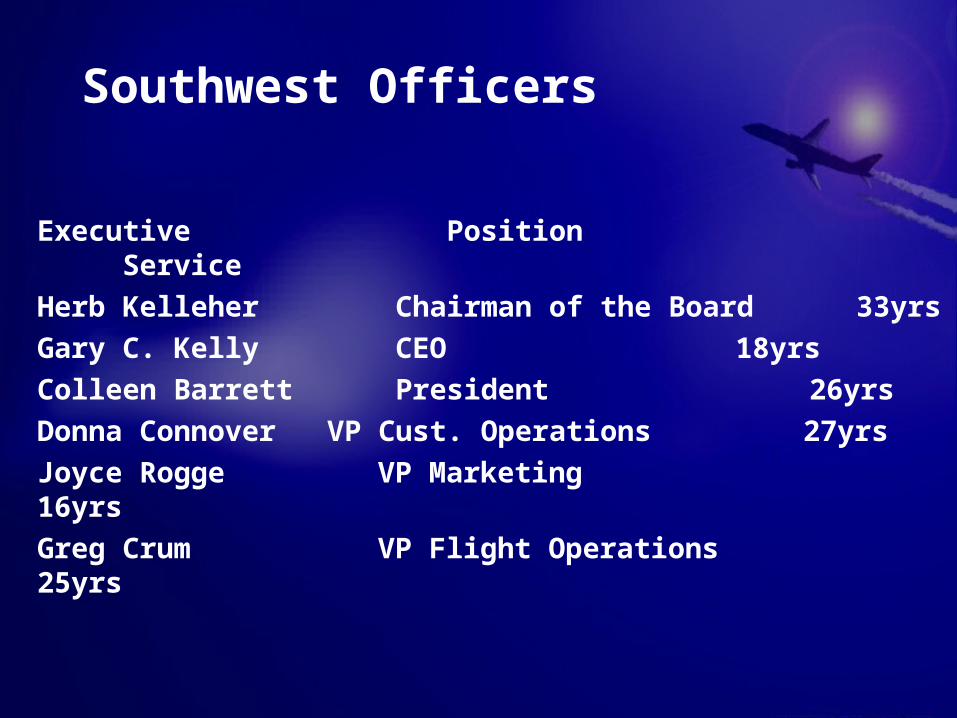
Southwest Officers
Executive Position Service Herb Kelleher Chairman of the Board 33yrs Gary C. Kelly CEO 18yrs Colleen Barrett President 26yrs Donna Connover VP Cust. Operations 27yrs Joyce Rogge VP Marketing 16yrs Greg Crum VP Flight Operations 25yrs
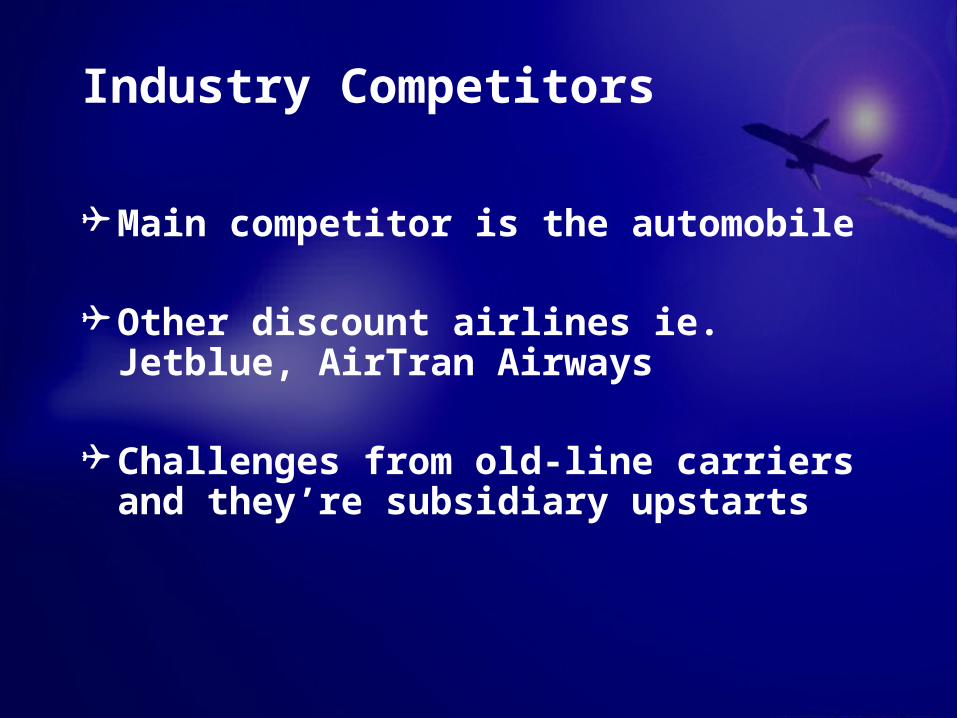
Industry Competitors
Main competitor is the automobile
Other discount airlines ie. Jetblue, AirTran Airways
Challenges from old-line carriers and they’re subsidiary upstarts
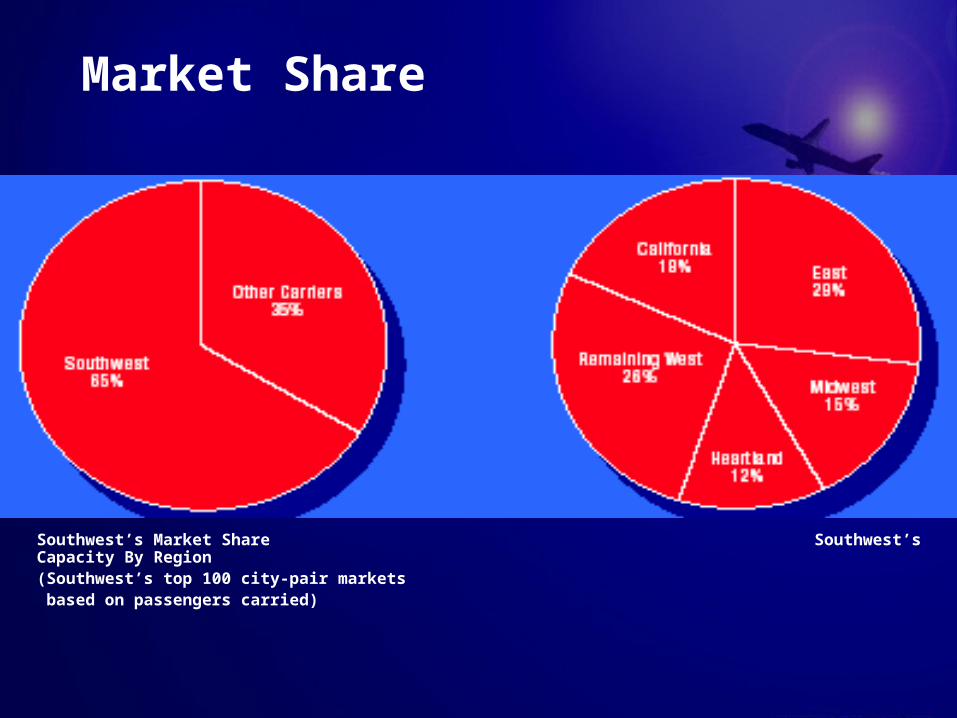
Market Share
Southwest’s Market Share Southwest’s Capacity By Region (Southwest’s top 100 city-pair markets based on passengers carried)
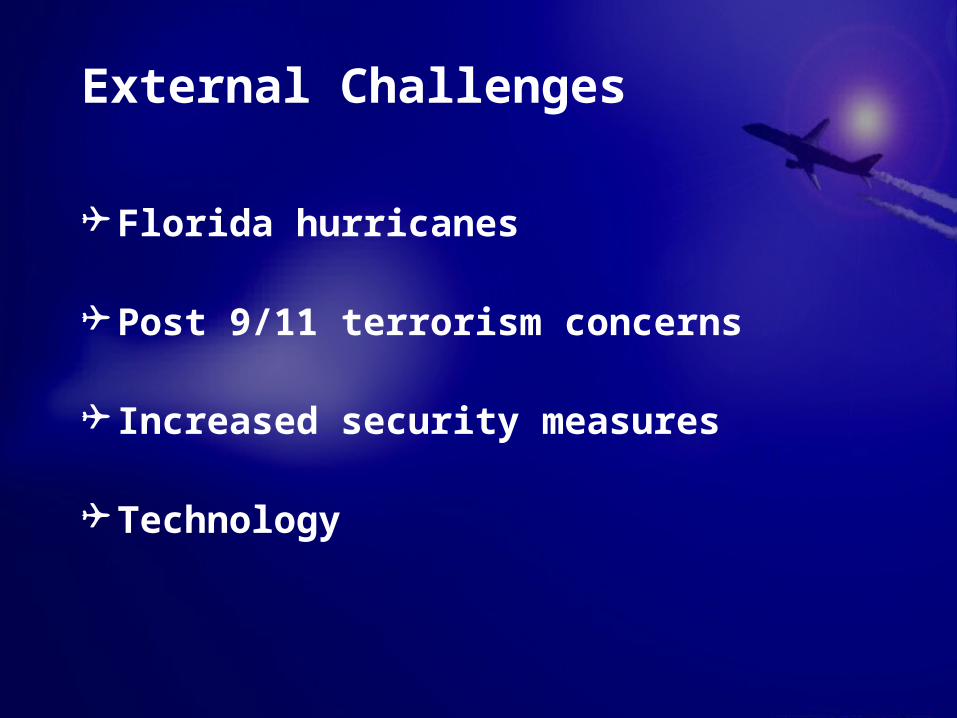
External Challenges
Florida hurricanes
Post 9/11 terrorism concerns
Increased security measures
Technology
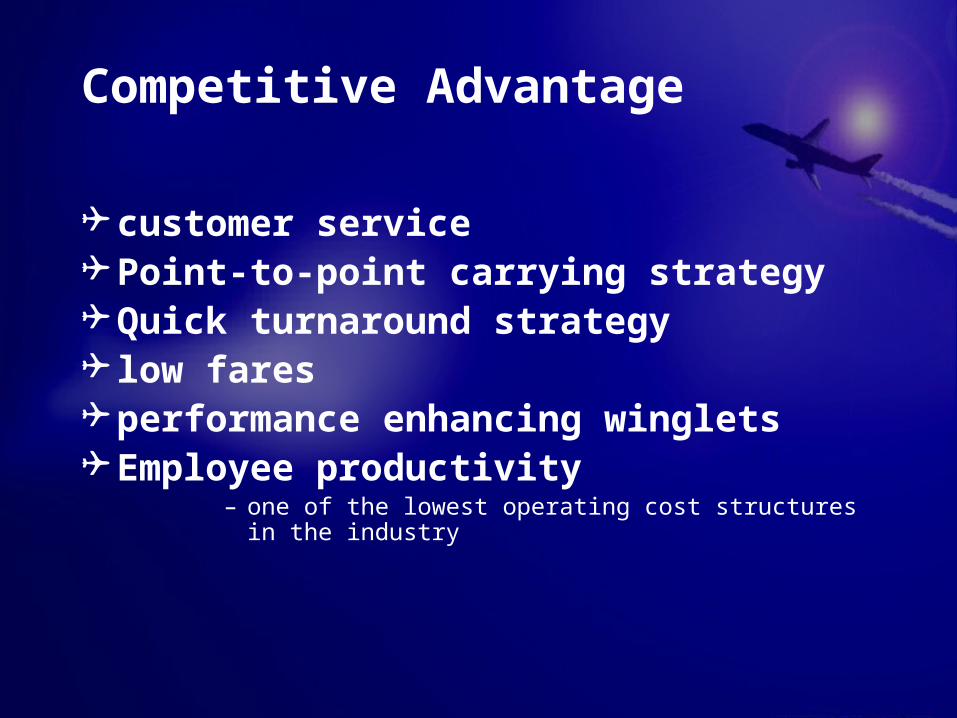
Competitive Advantage
customer service Point-to-point carrying strategy Quick turnaround strategy low fares performance enhancing winglets Employee productivity
– one of the lowest operating cost structures in the industry
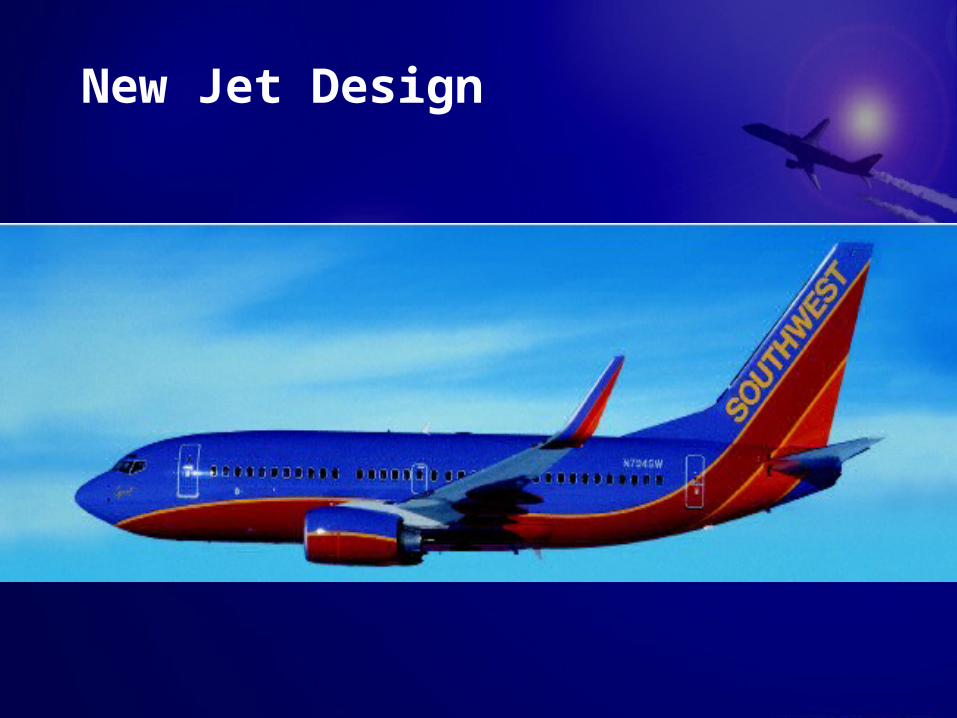
New Jet Design
Present and Future Planning
Recently commenced service from Philadelphia
Installation of RAPID CHECK-IN kiosks in 2004
Plan to increase capacity at an average rate of 8% from 2004-2012
Expansion projects at Fort Lauderdale, Houston Hobby, Las Vegas, Oakland, Tampa
Hedging Program
2004 : over 80% at $24/barrel
2005 : over 80% at $25/barrel
2006 : over 60% at $31/barrel
2007 : over 40% at $30/barrel

Financial Statement Analysis
ROE: 5.45% P/E : 45.85 Price/Book (mrq): 2.28 EP/S : 0.349 Operating Margin (ttm): 7.56% Dividend Yield: 0.11%
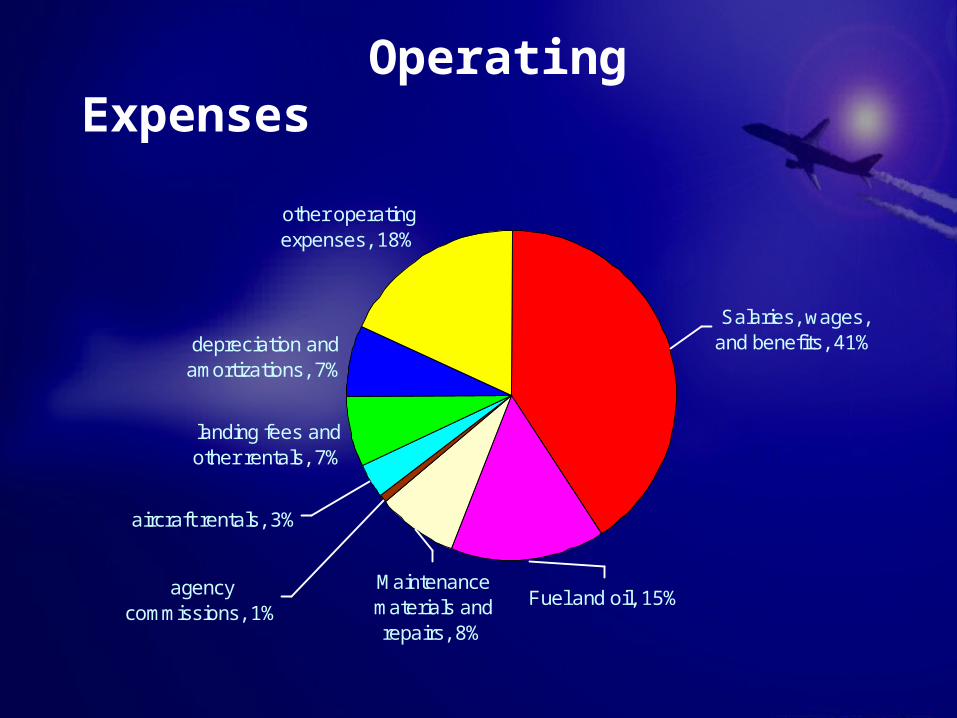
Operating Expenses
landing fees and other rentals, 7%
depreciation and amortizations, 7%
other operating expenses, 18%
Salaries, wages, and benefits, 41%
Fuel and oil, 15%Maintenance materials and repairs, 8%
aircraft rentals, 3%
agency commissions, 1%
Income Statement
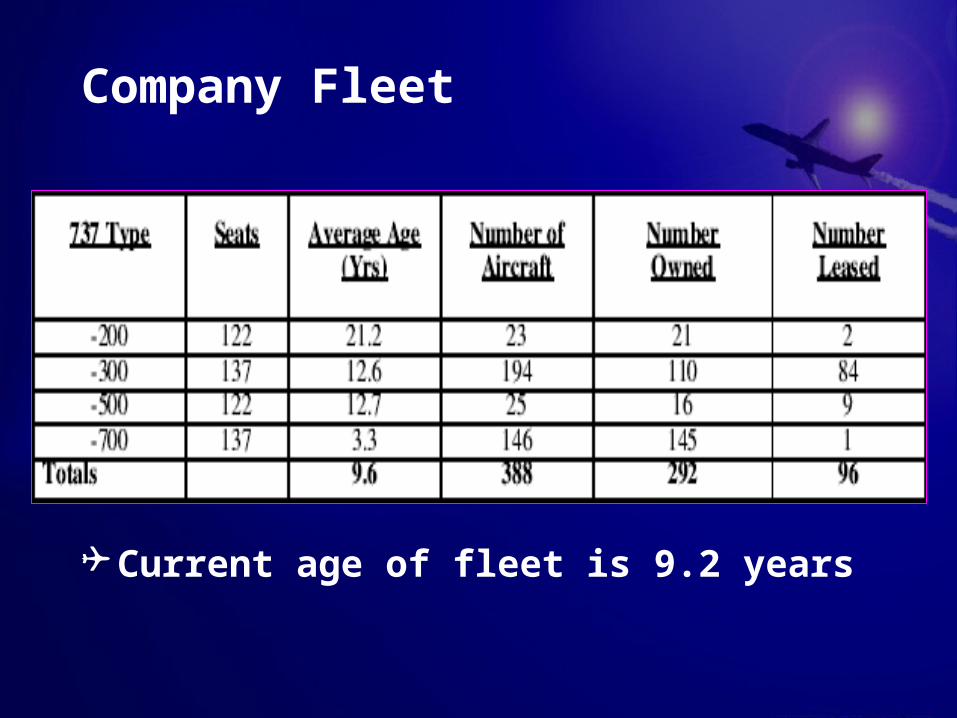
Company Fleet
Current age of fleet is 9.2 years
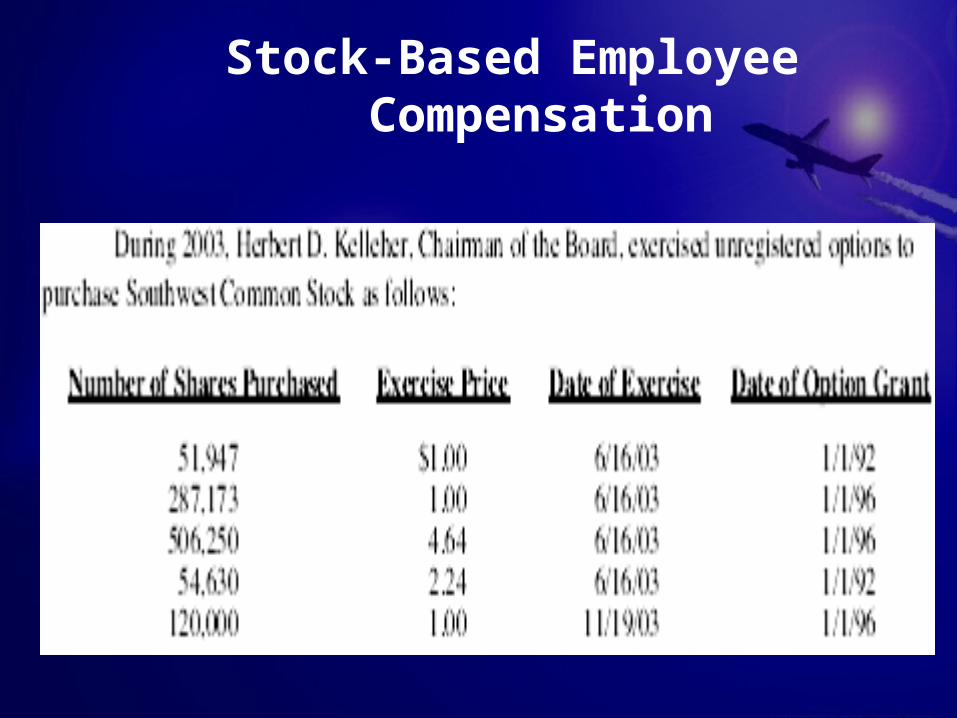
Stock-Based Employee Compensation
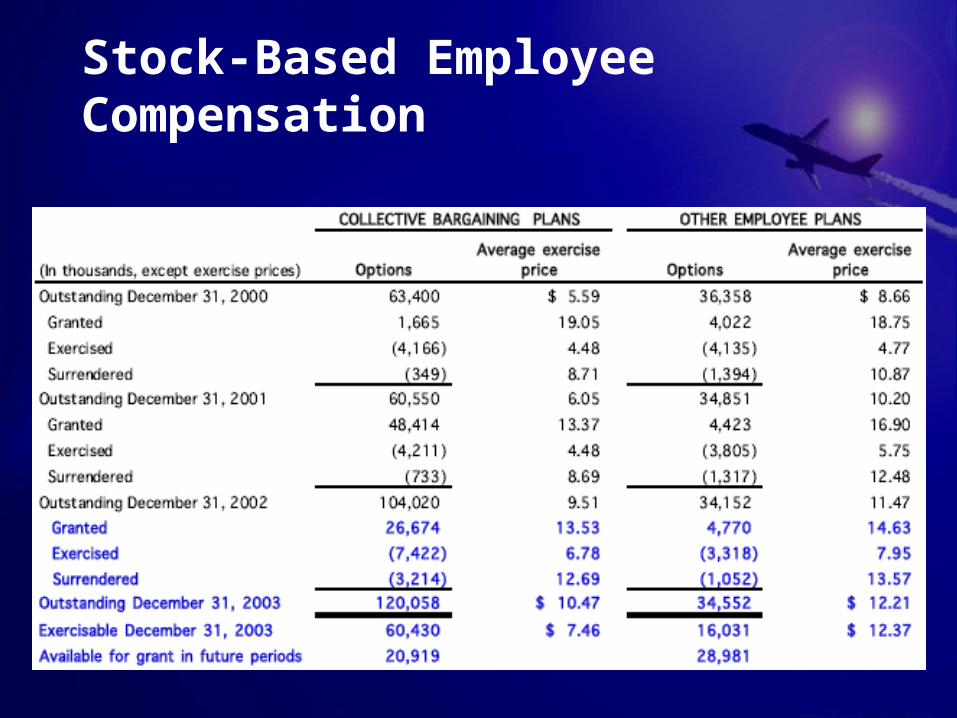
Stock-Based Employee Compensation
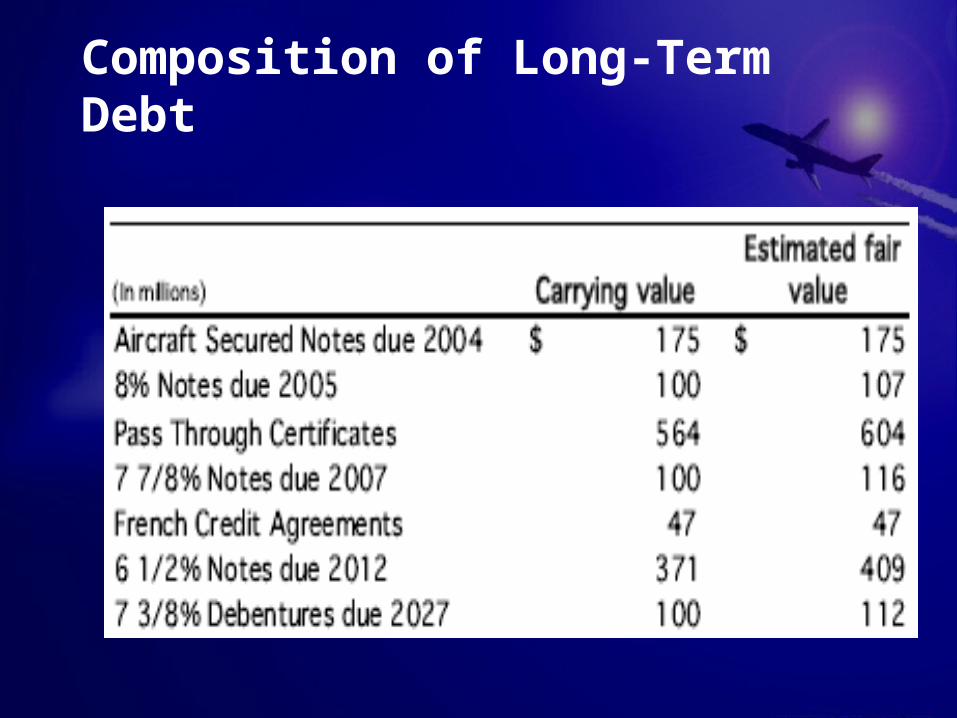
Composition of Long-Term Debt
Important Statistics
Load Factor: 66.8% Industry: 79.0%Break-even Load Factor: 66.75% Available Seat Miles: 71.7 trillionsRevenue Passenger Miles: 47.9 trillions
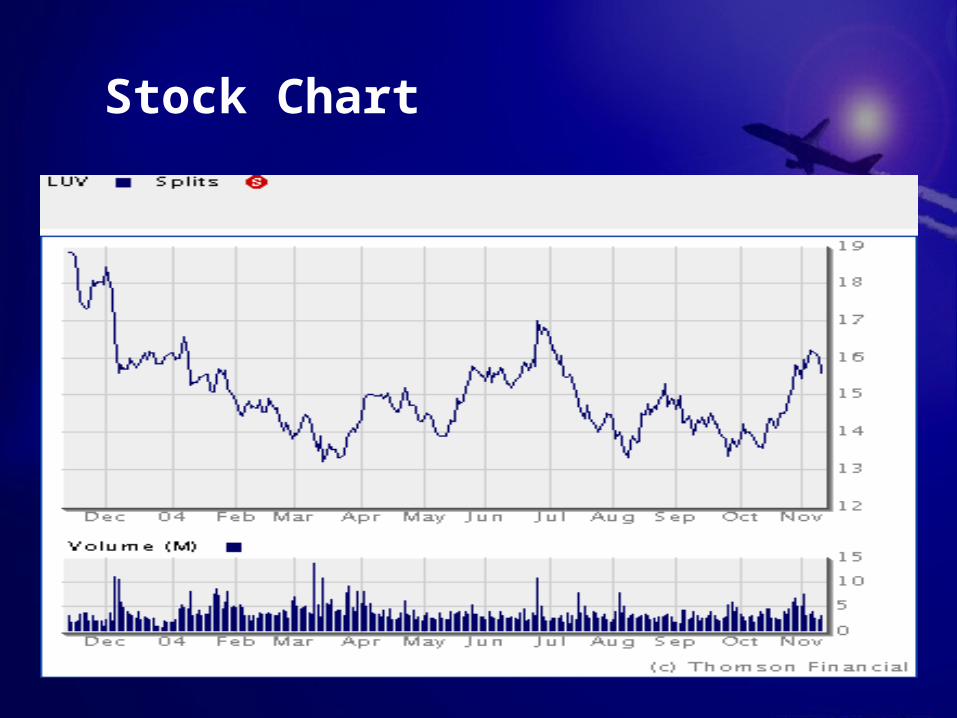
Stock Chart
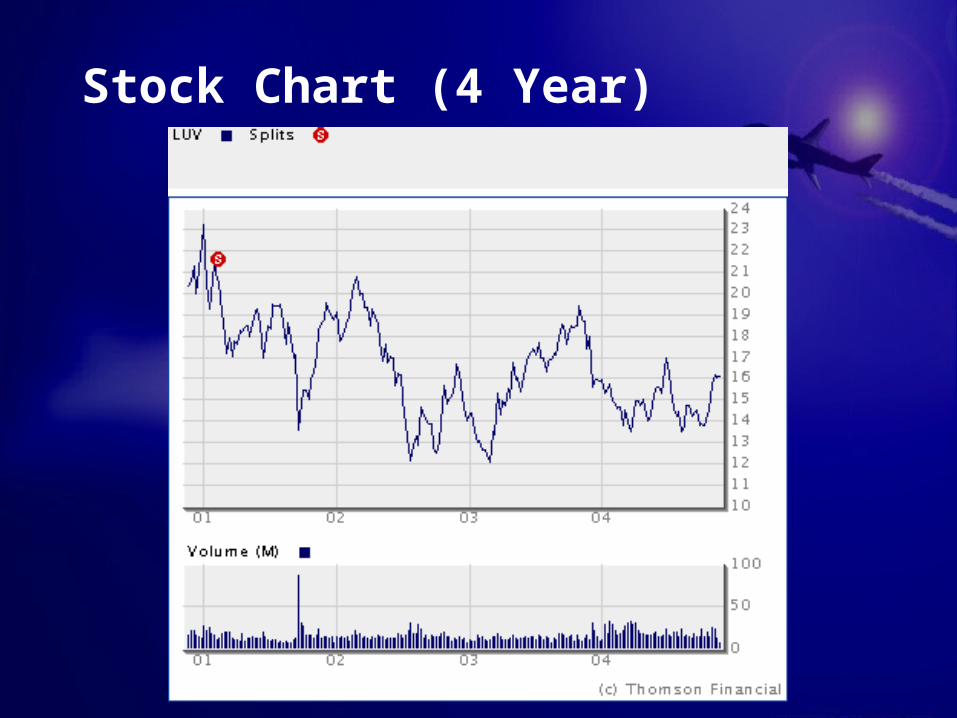
Stock Chart (4 Year)
Recommendataion
Hold
By Alexei
Company History Background
Start as a merger of small UK air companies in early 19th
Nationalized in 1939 (British Overseas Airways Corporation)
In 1979 Government intention to sell BOAC
BA privatised in 1987
Market background
Public company with limited distribution of shares outside UK (in ADR form)
Stocks Traded At London Stock Exchange (BAY) At New York Stock Exchange (ADR: BAB)
Number of shares: 1,082,845,212 Price per share: NYSE: $41.48 Dividends counts in Pounds Debt corporate rating stands at BB+
Stable, backed by fleet 3.3 bn ₤
Service/Products
BA provides scheduled passenger and cargo Airline services 154 destinations in 75 countries (last year 174 destinations in 83 countries) carried more than 36 million passengers last year
Programmes Club World flat bed World Traveller Plus Club loyalty programme
Main base of operation (airports) Airport Heathrow (hub structure) 38% of all passengers Gatwick (new structure point to point) New York John F. Kennedy International Airport (hub)
Alliances Oneworld: Aer Lingus, American Airlines, British Airways, Cathay Pacific, Finnair, Iberia, Lan Chile and Qantas DBA
Franchise Six airways: Loganair, GB Airways, British Mediterranean Airways, Sun Air of Scandinavia, Comair of South
Africa and Regional Air of Kenya
Management
Rod Eddinghton Chief Executive. Executive Board Member since 2000 (in industry since 1979)
John Rishton Chief Financial Officer. Appointed in September 2001. In BA since 1994
Martin George Director Marketing and Communications. Appointed in 1997. In BA since 1987
Mike Street• Director Customer Service and Operations since 1997. Executive Board Member since 2000
Robert Webb QC• General Counsel. Joined British Airways in 1998
Strategy
Reduce costs ( current improvement by $2 billion)
Cut jobs (13,000 people) Sell and lease airplanes to simplify fleet (fleet reduction 39 aircrafts
in 2004) Reduce number of unprofitable routes
Reformation customer service New executive Club loyalty programme New web site service Development of new small routs in UK
Balance Sheet improvement Cutting debt amount (selling Qantas shares) Still ₤3.3billion Achieve 10% operating margin
Opportunities/threats
Opportunities Cargo service in Vietnam New small routs in UK New customer service (web site) New terminal 5 in Heathrow in 2008
Threats Gas prices (overspend $128.8 million) Two Unions (pension programs) Italian government Heathrow charges increased (extra ₤300 million prepayment) UK and EU regulations. Increased insurance, spot regulation (may be an extra
cost of ₤300-400 million)
Competitors
Lufthansa Air FranceSmall domestic and European
carriers Delta United
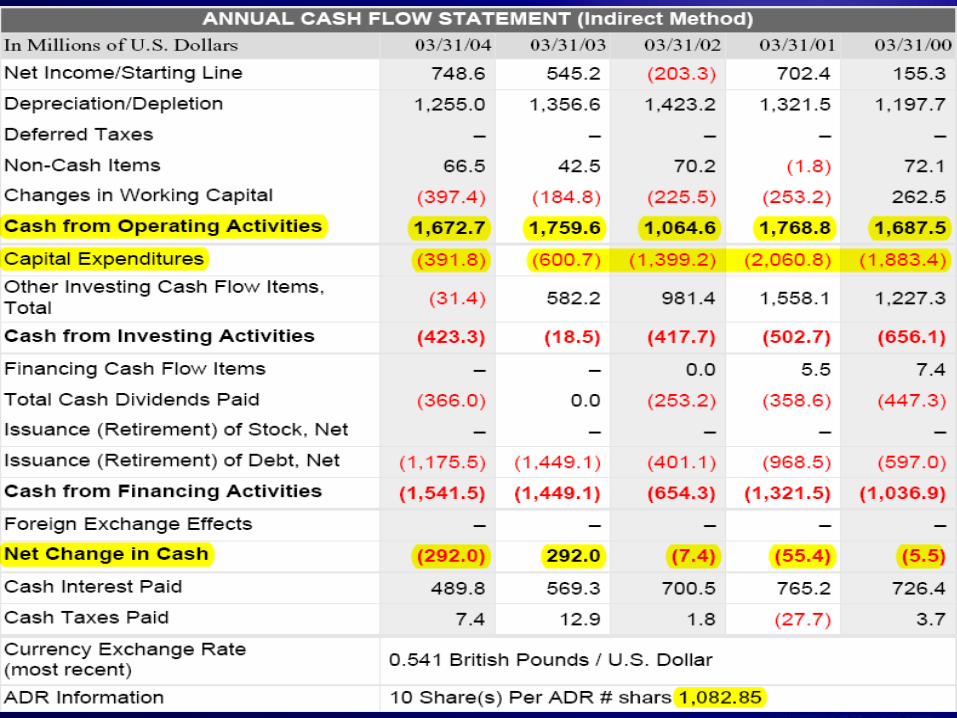
Financial statement analysis
Balance SheetIncome StatementCash flow Statement
Main problem – different standards and currency conversion
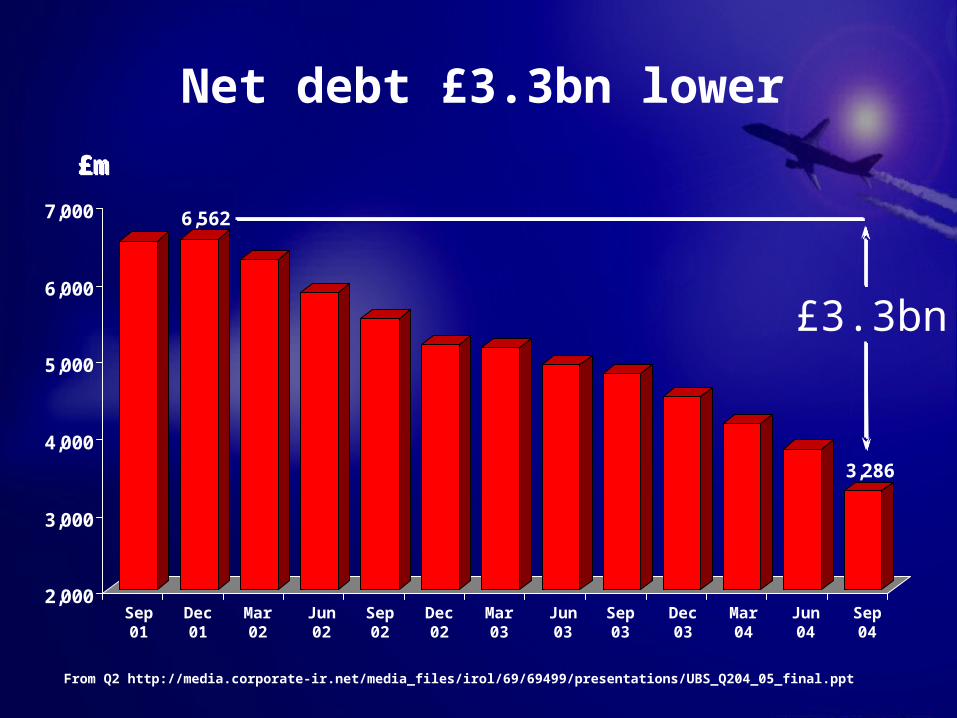
6,562
3,286
2,000
3,000
4,000
5,000
6,000
7,000
Dec01
Mar02
Jun02
Sep02
Dec02
Mar03
£m£m
Jun03
Sep03
Dec03
Mar04
Sep01
Jun04
Sep04
From Q2 http://media.corporate-ir.net/media_files/irol/69/69499/presentations/UBS_Q204_05_final.ppt
Net debt £3.3bn lower
£3.3bn
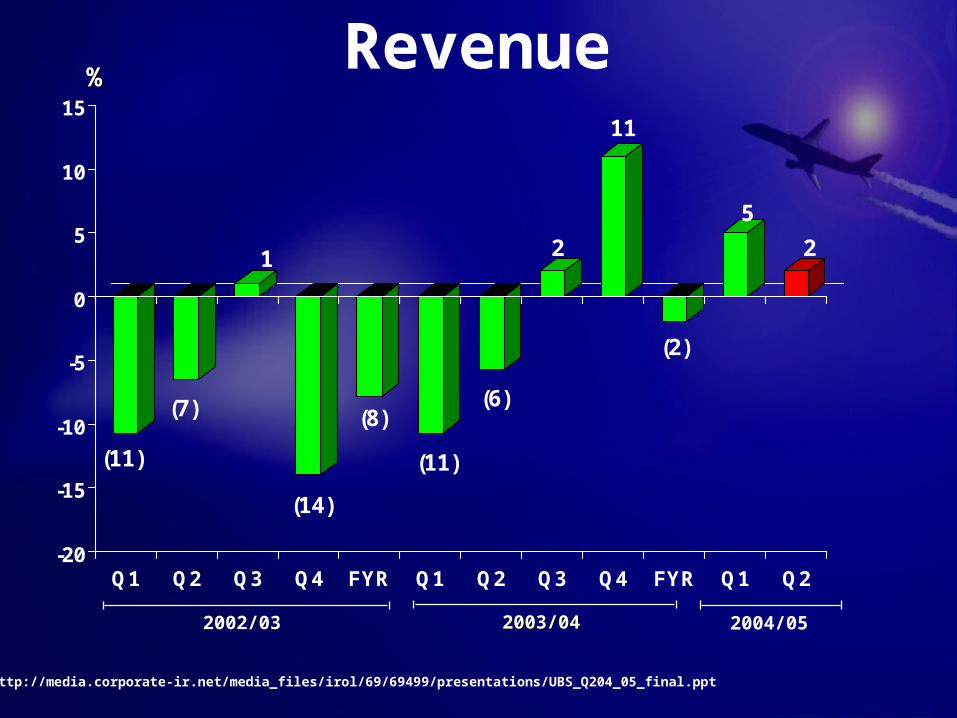
(11)
(7)
1
(14)
(8)
(11)
(6)
2
11
(2)
5
2
-20
-15
-10
-5
0
5
10
15
Q1 Q2 Q3 Q4 FYR Q1 Q2 Q3 Q4 FYR Q1 Q2
%%
2002/03 2003/042003/04 2004/05
http://media.corporate-ir.net/media_files/irol/69/69499/presentations/UBS_Q204_05_final.ppt
Revenue
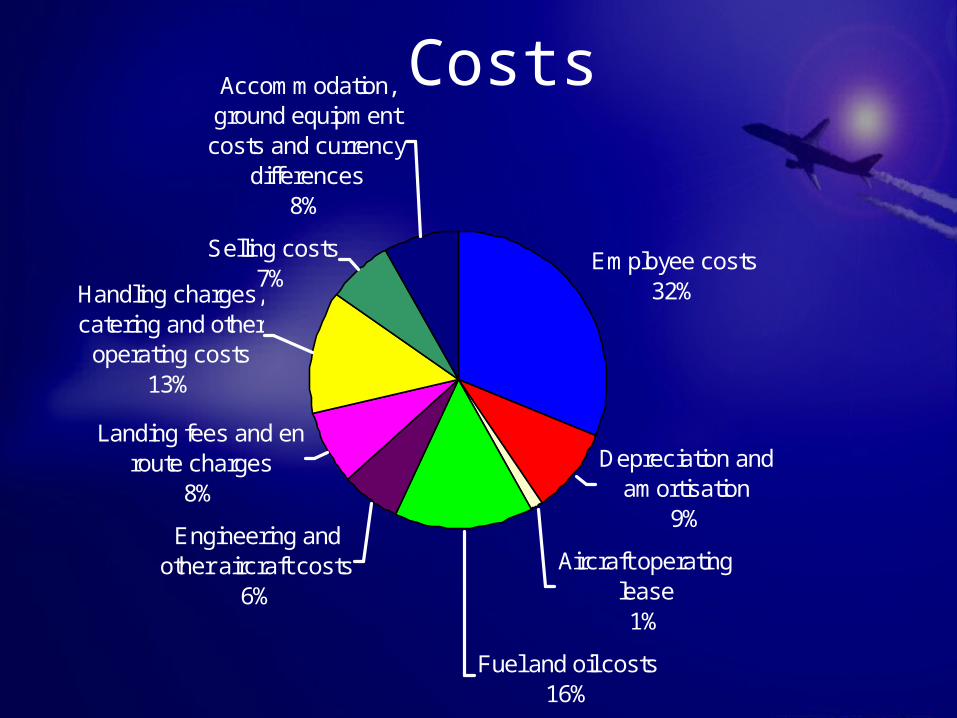
Employee costs32%
Depreciation and amortisation
9%
Aircraft operating lease 1%
Fuel and oil costs16%
Engineering and other aircraft costs
6%
Landing fees and en route charges
8%
Selling costs7%
Accommodation, ground equipment costs and currency
differences8%
Handling charges, catering and other
operating costs13%
Costs
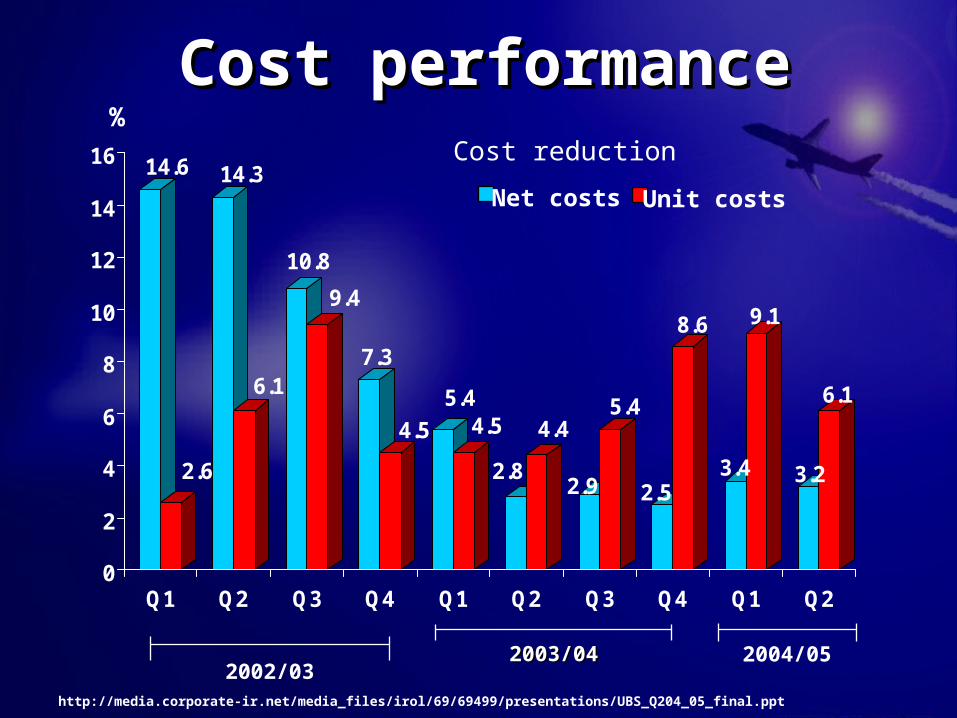
14.6
2.6
14.3
6.1
10.8
9.4
7.3
4.5
5.44.5
2.8
4.4
2.9
5.4
2.5
8.6
3.4
9.1
3.2
6.1
0
2
4
6
8
10
12
14
16
Q1 Q2 Q3 Q4 Q1 Q2 Q3 Q4 Q1 Q2
%
Net costs Unit costs
2003/042003/042002/03
2004/05
http://media.corporate-ir.net/media_files/irol/69/69499/presentations/UBS_Q204_05_final.ppt
Cost performanceCost performanceCost reduction
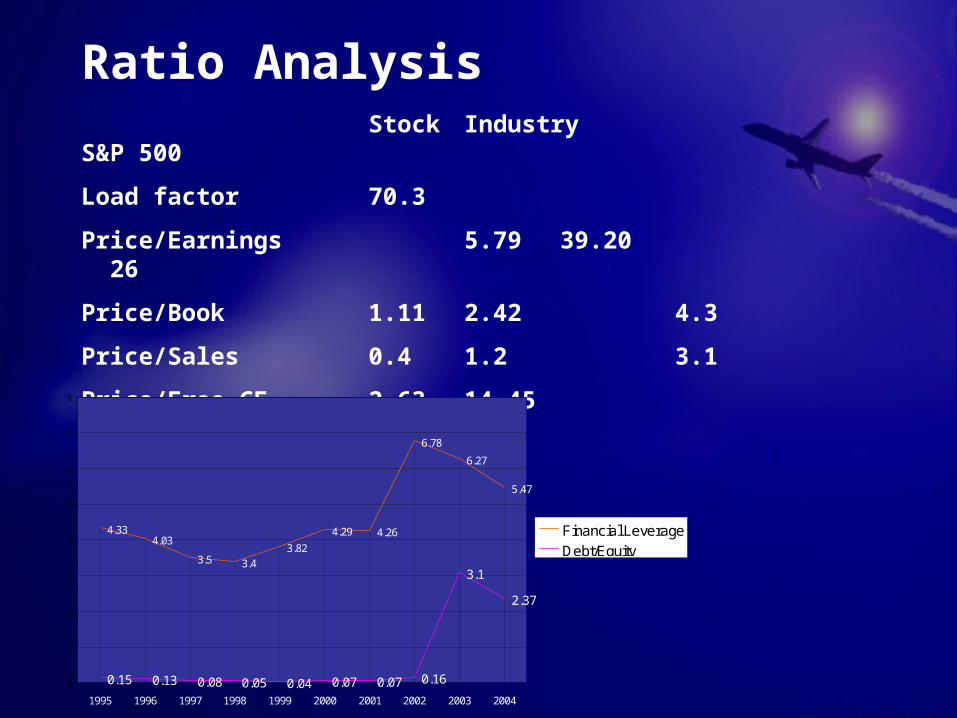
Ratio AnalysisStock Industry S&P 500
Load factor 70.3
Price/Earnings 5.79 39.20 26
Price/Book 1.11 2.42 4.3
Price/Sales 0.4 1.2 3.1
Price/Free CF 2.63 14.45 16.39
Operating Margin 6.73 6.32 18.07
4.334.03
3.5 3.4
3.82
4.29 4.26
6.78
6.27
5.47
0.15 0.13 0.08 0.05 0.04 0.07 0.07 0.16
3.1
2.37
0
1
2
3
4
5
6
7
8
1995 1996 1997 1998 1999 2000 2001 2002 2003 2004
Financial LeverageDebt/Equity
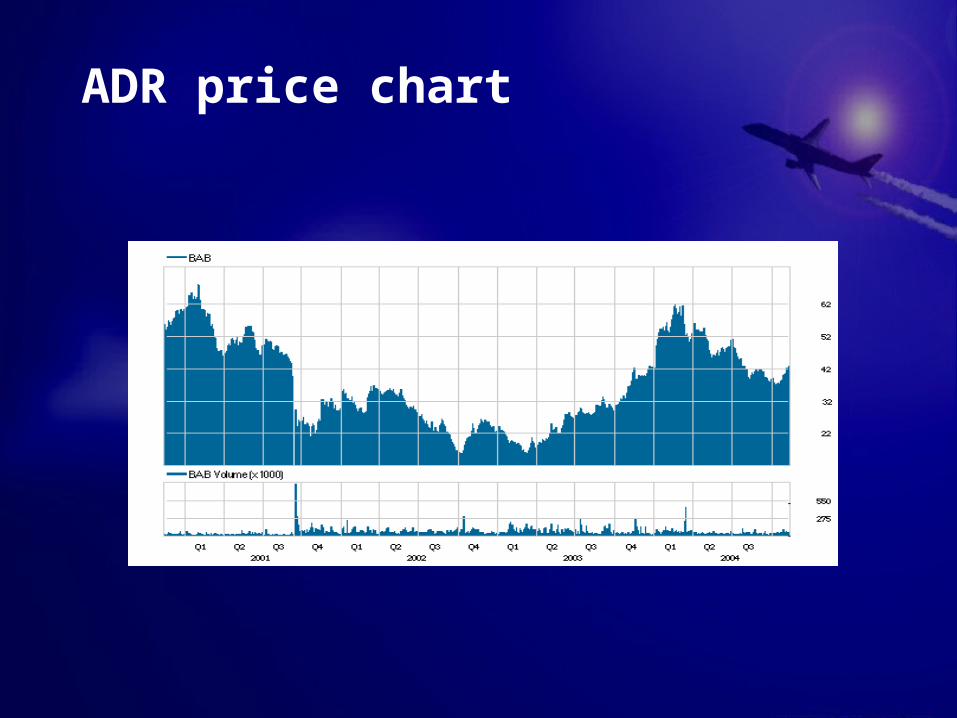
ADR price chart
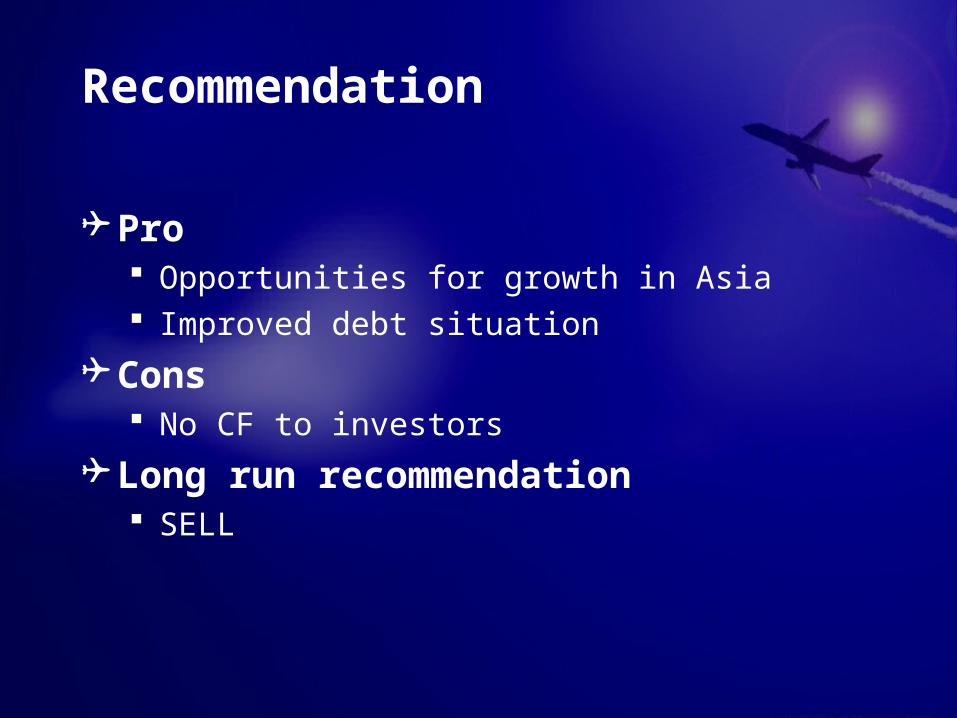
Recommendation
Pro Opportunities for growth in Asia Improved debt situation
Cons No CF to investors
Long run recommendation SELL