Embed Size (px)
Citation preview

Presented at the 9th Stakeholder Meeting
Mike Herrmann,
NCEEP Central Watershed Planner
April 20th, 2010
Ecosystem Enhancement Program (EEP) Intake Stessor Follow-up Study
Preliminary Findings (Phase I)
• High bacteria levels at Cherryville’s drinking water intake are concerning and potential sources for this contamination need to be identified
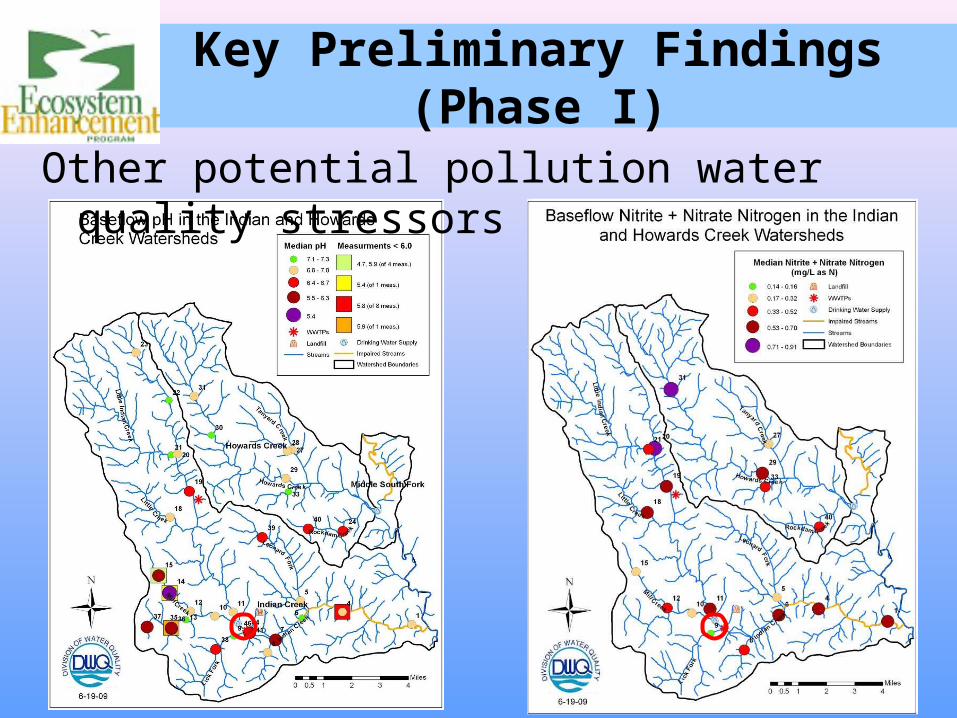
Key Preliminary Findings (Phase I)
Other potential pollution water quality stressors

Study GoalThe study is being conducted to better understand possible water quality stressors, and watersheds from which these stressors originate, to the drinking water intake at Cherryville.
Intake Stressor Study Assessments
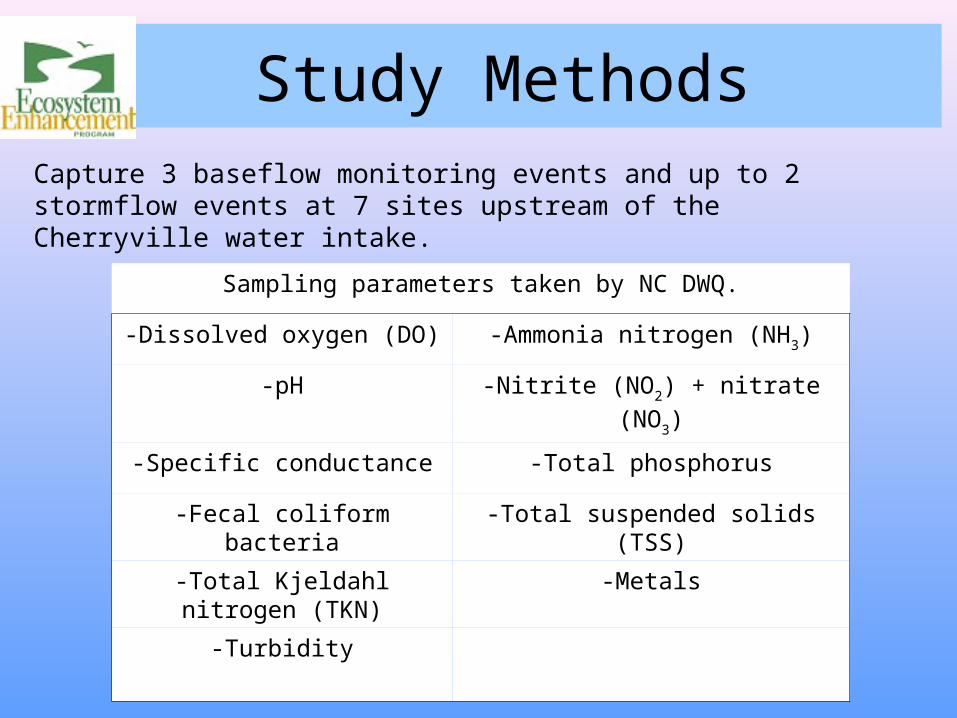
Study Methods
Sampling parameters taken by NC DWQ.
-Dissolved oxygen (DO) -Ammonia nitrogen (NH3)
-pH -Nitrite (NO2) + nitrate (NO3)
-Specific conductance -Total phosphorus
-Fecal coliform bacteria -Total suspended solids (TSS)
-Total Kjeldahl nitrogen (TKN) -Metals
-Turbidity
Capture 3 baseflow monitoring events and up to 2 stormflow events at 7 sites upstream of the Cherryville water intake.
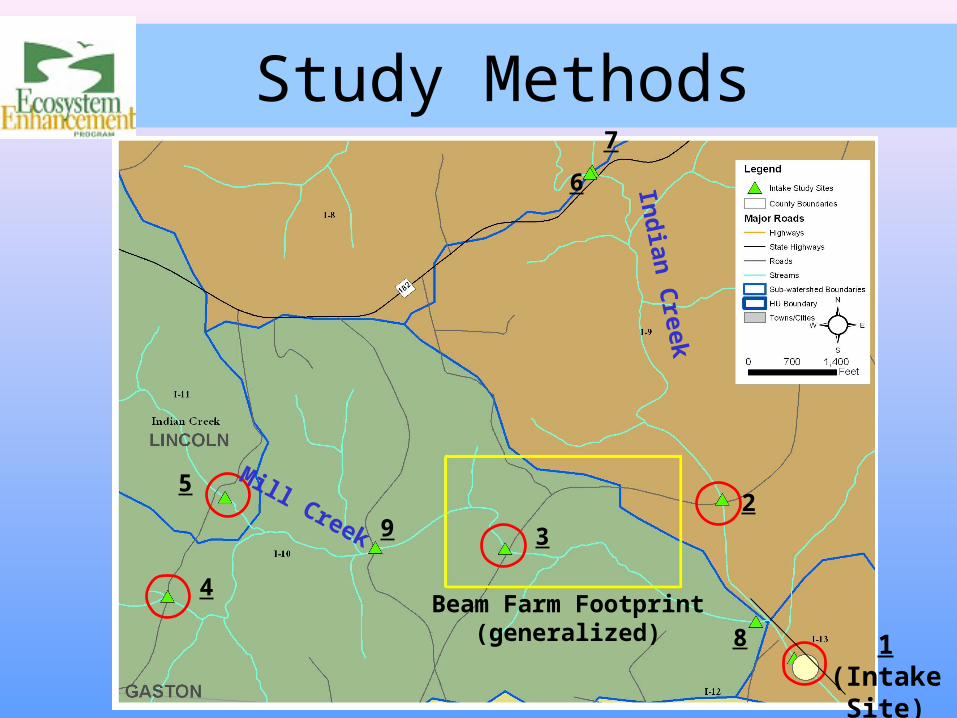
Study Methods
2
8
4
5
39
6
7
Beam Farm Footprint (generalized)
Mill Creek
Ind
ian C
reek
1 (Intake Site)
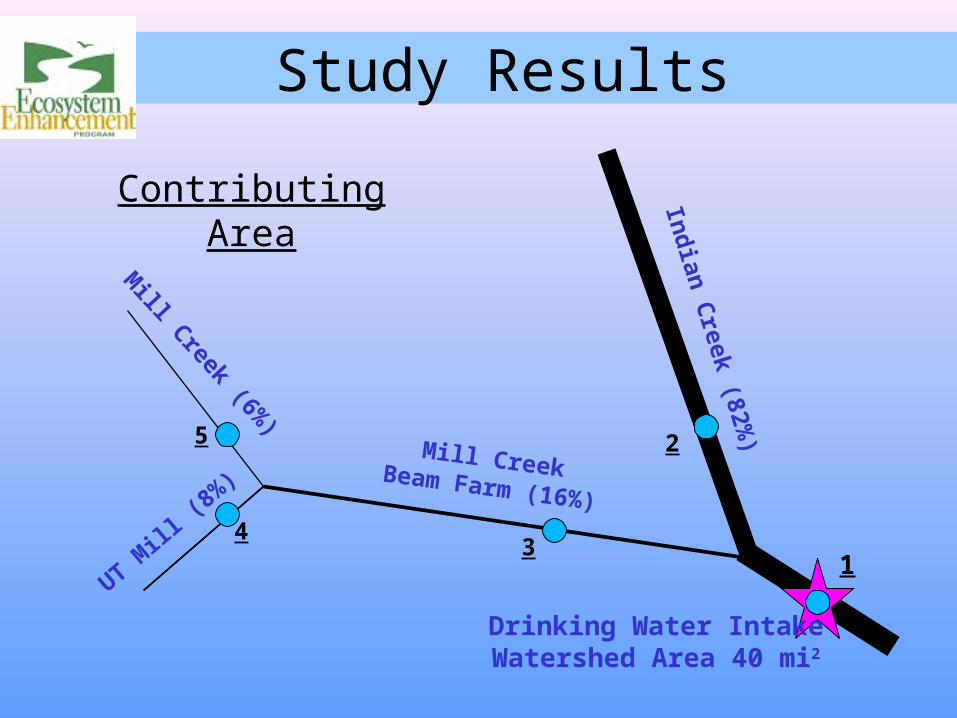
Study Results
Mill Creek (6%
)
Ind
ian C
reek (82%)
UT Mill
(8%
)
Mill CreekBeam Farm (16%)
Drinking Water IntakeWatershed Area 40 mi2
Contributing Area
2
4
5
31
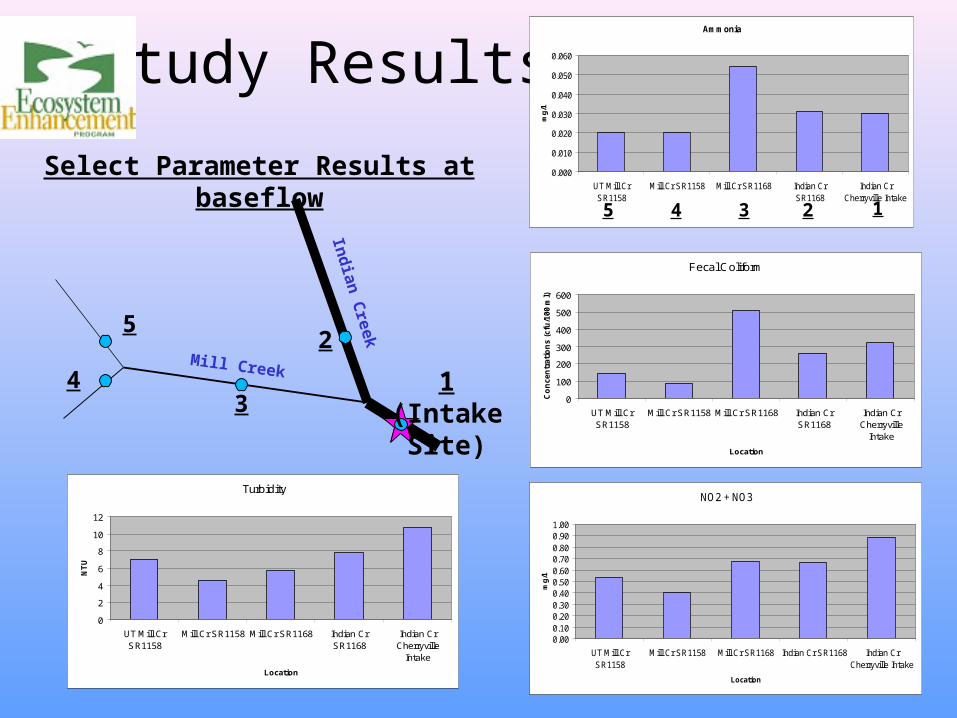
Study ResultsAmmonia
0.000
0.010
0.020
0.030
0.040
0.050
0.060
UT Mill CrSR1158
Mill Cr SR1158 Mill Cr SR1168 Indian CrSR1168
Indian CrCherryville Intake
Location
mg
/l
Fecal Coliform
0
100
200
300
400
500
600
UT Mill CrSR1158
Mill Cr SR1158 Mill Cr SR1168 Indian CrSR1168
Indian CrCherryville
Intake
Location
Co
ncen
trati
on
s (
cfu
/100 m
l)
NO2 + NO3
0.000.100.200.300.400.500.600.700.800.901.00
UT Mill CrSR1158
Mill Cr SR1158 Mill Cr SR1168 Indian Cr SR1168 Indian CrCherryville Intake
Location
mg
/l
Ind
ian C
reek
Mill Creek
2
4
5
31 (Intake
Site)
245 3 1
Turbidity
0
2
4
6
8
10
12
UT Mill CrSR1158
Mill Cr SR1158 Mill Cr SR1168 Indian CrSR1168
Indian CrCherryville
Intake
Location
NT
U
Select Parameter Results at baseflow
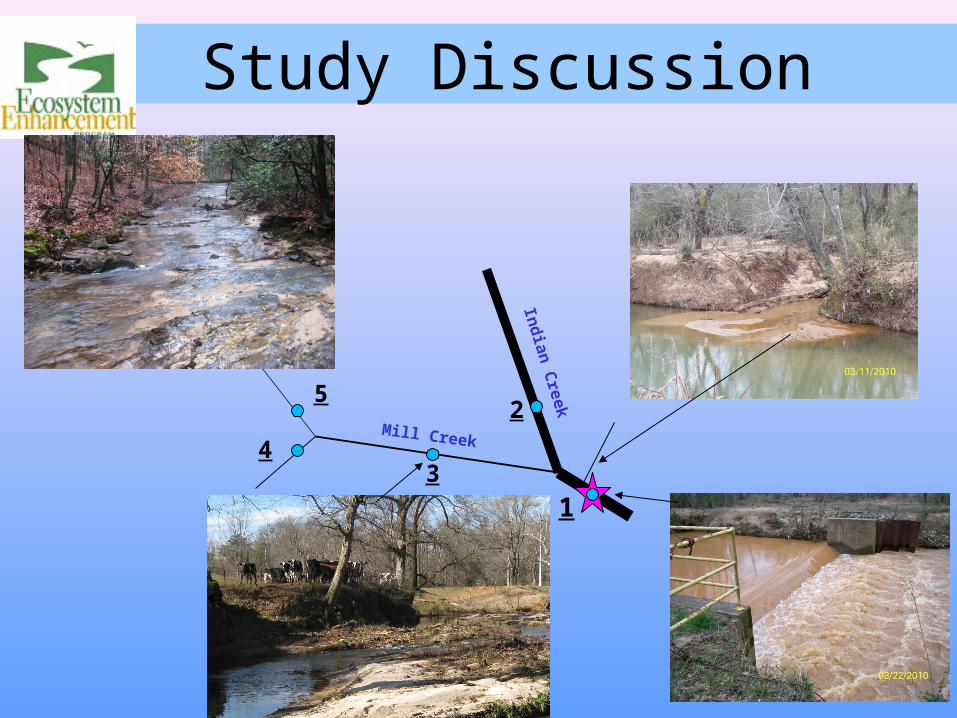
Study Discussion
Ind
ian C
reek
Mill Creek
2
4
5
3
1
In Summary…
• Indicators of stress vary in the watersheds• Indian Creek (Sediment, Turbidity, NO2 + NO3)
• Mill Creek (Cattle, Nutrients)
• Mill Creek Stressors appear to be more directly related land use in the lower portion of its watershed
• Due to its greater size, Indian Creek is contributing a larger volume of nutrients and sediment to the intake
• Both Mill and Indian Creeks contribute to water quality stress at Cherryville’s drinking water intake.
• Improvement activities (e.g., stream and wetland restoration, ag BMPs,…etc.) are needed in both watersheds to reduce water quality stress at the intake.
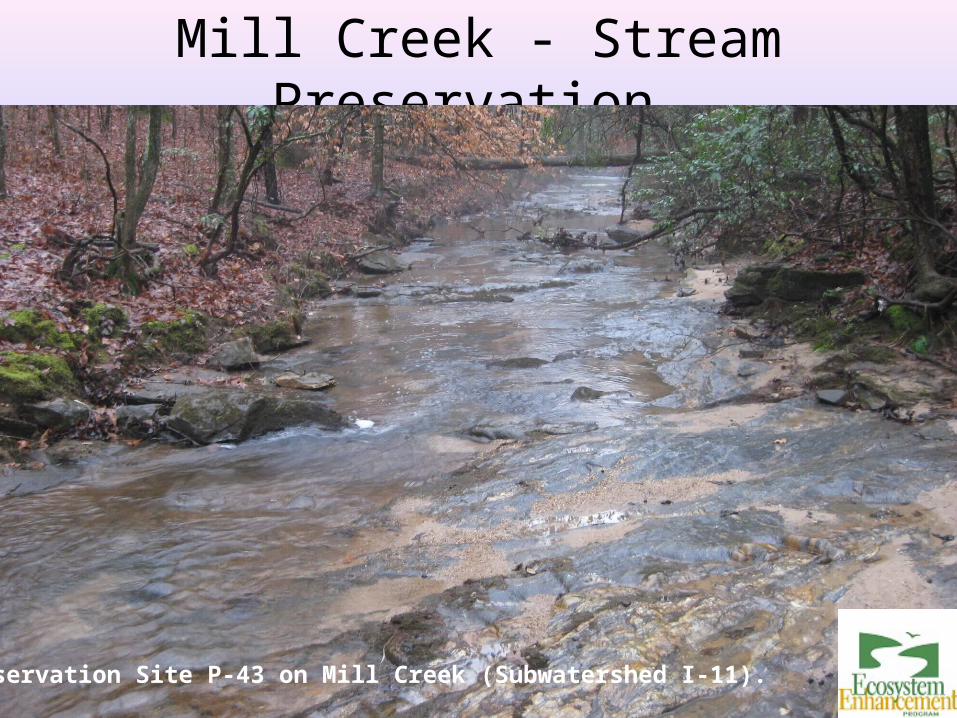
Mill Creek - Stream Preservation
Preservation Site P-43 on Mill Creek (Subwatershed I-11).