Embed Size (px)
Citation preview

University of Applied Sciences
World Conference on Transport Research 2016
Tongji University, Shanghai
Wednesday 13 July 2016 – Session A3-A4 High Speed (II) - Room 503
Jack E. Doomernik
COMPETITION ON CROSS-BORDER HIGH-SPEED RAIL IN EUROPE
The London-Paris case

Competition on cross-border high-speed rail in Europe
• Policy context and motivation
• Methodology
• Case: The cross-border link London – Paris
• Description
• Data collection
• Calibration and simulation results
• Future research

Policy context
• Revitalising railway traffic is one of the aims of the European transport policy.
• One of the goals of the European white paper on transport is the development of
the trans-European high-speed network.
• The legislative framework for liberalising the railway sector (railway packages) is
currently being implemented in the European member states.
• Since 2010, railway operators have free access to the European market and are
free to offer services across national borders and set prices.
• The introduction of High-Speed Rail technology in Europe since the ‘80’s and
changes in the European railway policy create new forces in the railway market
and shifts intramodal competition between airlines, car and train operators.
• It is unclear if the goals of the EU White Paper on Transport will be achieved and
that the European Rail Policy will have the desired outcome.

Western Europe is connected by four large airports …
Rank Airport Passengers
(millions)
1 Atlanta 94
2 Beijing 84
3 London Heathrow 73
4 Tokyo – Haneda 69
5 Chicago O’Hare 67
6 Los Angeles – International 67
7 Dubai 66
8 Paris – Charles de Gaulle 62
9 Dallas – Fort Worth 60
10 Jakarta – Soekarno 60
11 Hong Kong 60
12 Frankfurt 58
13 Singapore 54
14 Denver 53
15 Amsterdam 53
Paris - Orly 28.2
London - Gatwick 35.4
Source: ATW, July 2014, Enac Air Transport Data
348 km
371 km
657 km
352 km
399 km 252 km
158 km
367 km
306 km
451 km
Great Circle Distances calculated on http://www.gcmap.com/

Amsterdam Schiphol
Brussels Midi/Zuid
London St. Pancras Cologne
Hbf
Rotterdam
Antwerp
LilleLiège
Aachen
Frankfurt HbfCDG
(25 km)
Gatwick(44 km)
City (10 km)
Luton (50 km)
Heathrow (24 km)
Stansted(55 km)
Frankfurt Main(10 km)
Zaventem (12 km)
• North-South corridor: Amsterdam – Brussels- Paris• East-West corridor: London-Brussels-Frankfurt
Orly(15 km)
Paris Nord
… and a High-Speed Rail
network with several operators

Transport market characteristics
Oligopolistic market with inter- and intramodel competition on price and service level
with differentiated products with different stakeholders where:
• Travellers choose a transport mode and an operator to travel on a given city-
pair
• Operators strategically decide on product design and set prices for the type of
services they provide
• Regulators set the environment and rules for network access and competition

Competition model
• Application of a demand and supply model based on the theory and discrete-
choice model with differentiated products in an oligopolistic market as described
by Berry (1994)
• Models is applied to the transport market by Ivaldi and Vibes (2008), Rus et al
(2009), Prady and Ulrich (2010), Adler et al. (2010) and Mancuso (2014).
• Aggregation level:
• Supply side: transport modes and operators
• Demand side: business and leisure travellers
• Captures operators strategic behaviour and can incorporate governmental policies
• Can be applied to specific Origin-Destination pairs
• “Limited” data requirements
• Scenario’s can be simulated after the recovery of the equilibrium outcome.
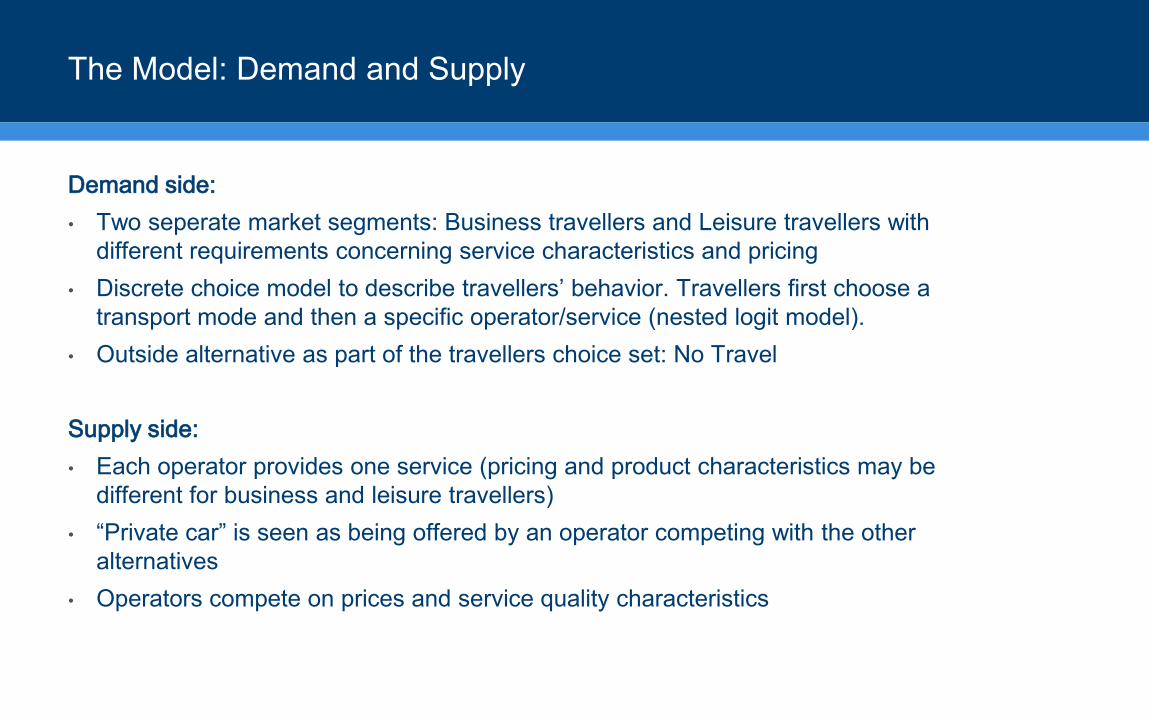
The Model: Demand and Supply
Demand side:
• Two seperate market segments: Business travellers and Leisure travellers with
different requirements concerning service characteristics and pricing
• Discrete choice model to describe travellers’ behavior. Travellers first choose a
transport mode and then a specific operator/service (nested logit model).
• Outside alternative as part of the travellers choice set: No Travel
Supply side:
• Each operator provides one service (pricing and product characteristics may be
different for business and leisure travellers)
• “Private car” is seen as being offered by an operator competing with the other
alternatives
• Operators compete on prices and service quality characteristics

Demand: Nested logit model for traveller behavior
Travellers’ choice
Rail OutsideRoadAirMode
(g = 1 … G)
Operator
(j = 1 … J)O1 Om O1 On Car No Travel

Calibration methodology
• Purpose is to recover the equilibrium parameters of the transport market under study
• Equilibrium is the basis for the market simulations under different scenario’s
• To be recovered are:
• The model parameters h (sensitivity of utility to price) and σ (degree of intragroup
correlation)
• The Quality Indices ψj and the associated coefficients of the quality attributes.
• The equilibrium is recovered for two market segments: business and leisure travellers
• The share of the outside alternative (No Travel) is set to 15% of the population of total
travellers for the Business market and 30% for the Leisure market.
• The model is solved numerically using Excel

Case: The cross-border link: London – Paris
• Connects London area with 5 airports and Paris with 2 airports
• The transport operators:
• British Airways and AirFrance flying between Heathrow and Charles de
Gaulle
• British Airways between Heathrow and Paris Orly
• AirFrance/Cityjet between City Airport and Paris Orly
• Easyjet flying between Luton and Charles de Gaulle
• Eurostar between St Pancras and Paris Nord
• Private car and ferry (DFDS Seaways, P&O Ferries) or tunnel (Eurotunnel
Shuttle) between Dover and Calais
• Inter and intra modal competition:
• Intermodal between airlines, HSR (Eurostar) and car
• Between traditional airlines (British Airways, AirFrance) and LCC (Easyjet)
• Between ferry and Euroshuttle for car users
• For an air distance of 350 km strong competition might be
expected
• Operators target business and leisure travellers in this market

Evolution of passenger flows
0
500.000
1.000.000
1.500.000
2.000.000
2.500.000
3.000.000
2005 2006 2007 2008 2009 2010 2011 2012 2013 2014
Air Traffic London - Paris
LHR-CDG (AF, BA) LHR-ORY (BA) LGW-CDG (EZY)
LTN-CDG (EZY) LCY-CDG (AF, CJ, VLM) LCY-ORY (AF, CJ, VLM)
All airports
0
2000
4000
6000
8000
10000
2005 2006 2007 2008 2009 2010 2011 2012 2013 2014
Passengers London-Paris (Thousands)
Rail Air Air and Rail
• Total market has grown with 20% over the time
period considered
• Rail/Air market share is about 80/20% since
2008
• British Airways and AirFrance have a dominant
market share on the London Heathrow – Paris
Charles de Gaulle connection
• Competition from smaller airports and carriers
is growing

Nested logit model for London-Paris (2012)
Travellers’ choice
London-Paris
Rail OutsideRoadAir FSC
Eurostar LHR-CDG
AirFrance
Car &
Ferry
No TravelCar &
Tunnel
LHR-CDG
British
Airways
LTN-CDG
EasyJet
Euro
Tunnel
Shuttle
P&O
Ferries
/DFDS
Seaways
LHR-ORY
British
Airways
Sg= 15.1%Sg= 69.7% Sg= 9.2%
Sj|g= 100%
Sj = 69.7%
LCY-ORY
CityJet
B/L=66/34%
B/L=24/76%
B/L=42/58%
B/L=2/98% B/L=8/92%
B/L=56/44% B/L=25/75%B/L=49/51%
B/L=28/72%
B/L=24/76% B/L=5/95%B/L=47/53%
100%
Air LCC Sg= 6.0%
B/L=29/71%
0%
Sj|g= 30.4%
Sj = 2.8%
Sj|g= 58.9%
Sj = 5.4%
Sj|g= 10.6%
Sj = 1.0%
Sj|g= 13.6%
Sj = 0.8%
Sj|g= 86.4%
Sj = 5.2%
Sj|g= 44.3%
Sj = 6.7%
Sj|g= 55.7%
Sj = 8.4%

Input data and sources
Data gathered for all operators and Business and Leisure market segments for London-Paris:
• Traffic volume and market shares Eurostat, Civil Aviation Authority (CAA), UK Office for
National Statistics (ONS), Eurotunnel Registration documents
• Service characteristics and attributes:
• Total Travel Time (in-vehicle, transfer to airport/station, check-in time) timetables
(Thomas Cook for rail) , fight schedules and own calculations
• Frequency timetables (Thomas Cook for rail) and flight schedules
• Seat capacity Eurostat, Swan and Adler 2006 (aircraft), UIC HS rolling stock database
(train)
• Delay on arrival (punctuality) CAA (air), press releases Eurostar (rail)
• Load factors Eurostat, International Passenger Survey (IPS) UK ONS
• Prices and fares International Passenger Survey (IPS), ONS, own calculations (car)
• Marginal cost UIC cost model, Froïdh 2006, European Commission 2006, Alvarez 2010 (rail),
Swan and Adler 2006, Givoni 2005 (aircraft), own calculations (car)

Overview of input data (2012)
• Eurostar has achieved a dominant market share on the London-Paris market
• On the London Heathrow to Paris Charles the Gaulle connection AirFrance and BA are competing with
comparable services
• Leisure travellers favour Eurostar and private car, business travellers prefer FSC airlines
Traffic modal Alternatives shares (%) Prices (Euro) Marginal costs Travel time (minutes) Frequency Punctuality Capacity
Mode Connection Carrier shares (%) Business Leisure Business Leisure Business Leisure Business Leisure trips/week (%) (seats)
Rail QQS - XPG Eurostar 69.7 71.1 69.2 117 73 NA 42 177 187 119 92.1 750
Air FSC LHR - CDG British Airways 2.8 5.8 1.9 279 117 NA 43 212 242 48 77.0 166
LHR - CDG Air France 5.4 9.7 4.1 291 123 NA 43 220 250 51 67.4 166
LHR - ORY British Airways 1.0 2.7 0.4 259 123 NA 50 226 256 27 77.6 136
Air LCC LCY - ORY CityJet 0.8 2.0 0.5 202 103 NA 40 227 227 30 90.7 50
LTN - CDG EasyJet 5.2 5.4 5.1 99 64 NA 23 221 221 18 83.4 158
Car LDN - PAR Eurotunnel 8.4 2.7 10.2 127 82 53 28 299 299 252 75.0 5
LDN - PAR P&O/DFDS 6.7 0.6 8.6 105 80 51 24 359 359 221 85.0 5

Equilibrium parameters
• Sensitivity of passenger utility to price is comparable with the results from other studies
• For London-Paris business passengers utility is less sensitive to price (h=0.013) than for
leisure passengers (h=0.025). This is also found in other studies.
• For London-Paris the correlation of alternatives within the same mode is comparable
with the Milan-Rome study.
• Business passengers on the London-Paris route value particular providers to the same
extent as leisure passengers (σ=0.35 for business 15 and σ=0.34 for leisure 30).
Results from Ivaldi (2008) and Mancuso (2014) show clearer differences between
preferences for leisure and business travelers.
Link Business 15 Leisure 15 Source
h σ h σ
Cologne-Berlin 0.023 0.15 0.040 0.20 Ivaldi and Vibes, 2003
Paris-Amsterdam - - - - De Rus et al, 2009
Milan-Rome 0.011 0.41 0.043 0.34 Mancuso, 2014
Paris-London 0.013 0.35 0.025 0.34 Doomernik, 2015

Leisure Market equilibrium (2012)
• Outside alternative: 30% of leisure passengers may decide not to travel
• Parameters of passengers’ utility function:
• Marginal utility of income: h=0.025 (sensitivity of utility to price)
• Coefficient of intragroup correlation: σ=0.34 (degree of intramode correlation)
• Quality Indices ψj: Leisure passengers value Eurostar the best. Private car and flights
with Air France between LHR and CDG are more valued than other flights.
• The quality attributes for the leisure market show the expected signs: longer travel
time has a negative effect, while higher frequency, punctuality and capacity have a
positive effect on quality.
• Consumer surplus (expected value of the maximum of passenger utilities): CS=48.5
Mode Connection Carrier Quality Index ψj
Rail QQS - XPG Eurostar 2.29
Air FSC LHR - CDG British Airways 0.21
LHR - CDG AirFrance 0.86
LHR - ORY British Airways -0.67
Air LCC LCY - ORY CityJet -1.06
LTN - CDG EasyJet -0.51
Road LDN - PAR Car + Eurotunnel Shuttle 0.81
LDN - PAR Car + P&O/DFDS Ferries 0.65
Quality attributes Alfa-Beta
Rail Dummy -5.29
BA Dummy 0.95
AF Dummy -0.55
Car Dummy -1.19
Travel time -0.016
Frequency 0.020
Punctuality 0.024
Capacity 0.008

Leisure Market elasticities (outside alternative 30%)
• Own price elasticity for Eurostar is the lowest which means that Eurostars’ market
share is relatively insensitive to price.
• Price changes from Eurostar have strong effect on market shares of others.
• Eurostars’ market share in most affected by price changes in private car travel
(Eurotunnel and P&O/DFDS) and AirFrance.
Eurostar LHR-CDG BA LHR-CDG AF LHR - ORY BA LCY - ORY WX LTN - CDG U2 Eurotunnel P&O/DFDS
Eurostar -0.93 0.05 0.11 0.01 0.01 0.07 0.18 0.15
LHR-CDG BA 1.07 -3.94 1.13 0.11 0.01 0.07 0.18 0.15
LHR-CDG AF 1.07 0.50 -3.54 0.11 0.01 0.07 0.18 0.15
LHR-ORY BA 1.07 0.50 1.13 -4.55 0.01 0.07 0.18 0.15
LCY-ORY WX 1.07 0.05 0.11 0.01 -3.77 0.83 0.18 0.15
LTN-CDG U2 1.07 0.05 0.11 0.01 0.13 -1.61 0.18 0.15
Eurotunnel 1.07 0.05 0.11 0.01 0.01 0.07 -2.38 0.62
P&O/DFDS 1.07 0.05 0.11 0.01 0.01 0.07 0.76 -2.43
Price elasticities: Own Intramodal Intermodal

Market simulations
1. Increase of infrastructure charges:
• Neutralisation of the 2009 80% charge reduction for HS-1. This implies a cost
increase of approximately €18 per passenger (at 81% load factor, 1.23
Euro/Sterling exchange rate).
2. New Eurostar trains:
• Current TGV trains with 750 seats are replaced by e320 trains with 900 seats.
This results in 20% lower operational costs per available seat.
3. Entrance of a new high-speed rail operator with low-cost trains:
• A new operator with the same quality characteristics (travel time, frequency,
punctuality, capacity), but with marginal costs that are 75% of Eurostar’s cost
level.

Simulation results: Increase of infrastructure charges
Share outside alternative (%) Business 15 Leisure 30
Resulting Change Resulting Change
Connection Carrier Value (%) Value (%)
Prices (€)
Rail QQS - XPG Eurostar 235.2 101.0% 82.8 13.5%
Air FSC LHR - CDG British Airways 280.1 0.4% 117.0 0.0%
LHR - CDG AirFrance 293.5 0.9% 123.1 0.1%
LHR - ORY British Airways 259.4 0.2% 123.0 0.0%
Air LCC LCY - ORY AirFrance/Cityjet/VLM 202.4 0.2% 103.0 0.0%
LTN - CDG Easyjet 100.4 1.4% 64.2 0.2%
Road LDN - PAR Car + Eurotunnel Shuttle 127.6 0.5% 82.3 0.3%
LDN - PAR Car + P&O/DFDS Ferries 105.1 0.1% 80.2 0.2%
Market shares (%)
Rail QQS - XPG Eurostar 43.4 -28.1% 42.4 -12.4%
Air FSC LHR - CDG British Airways 7.0 41.5% 1.5 11.8%
LHR - CDG AirFrance 12.1 46.6% 3.2 11.5%
LHR - ORY British Airways 3.2 40.6% 0.3 11.9%
Air LCC LCY - ORY AirFrance/Cityjet/VLM 2.4 40.5% 0.4 12.0%
LTN - CDG Easyjet 6.6 44.6% 4.0 11.4%
Car LDN - PAR Car + Eurotunnel Shuttle 3.3 43.1% 8.0 11.6%
LDN - PAR Car + P&O/DFDS Ferries 0.7 41.0% 6.7 11.3%
Outside alternative 21.3 41.7% 33.5 11.8%
Consumer surplus 145.9 1.0% 44.0 -9.3%

Simulation results: New Eurostar trains
Share outside alternative (%) Business 15 Leisure 30
Resulting Change Resulting Change
Connection Carrier Value (%) Value (%)
Prices (€)
Rail QQS - XPG Eurostar 108.6 -7.2% 72.4 -0.8%
Air FSC LHR - CDG British Airways 278.9 -0.1% 117.0 0.0%
LHR - CDG AirFrance 290.7 -0.1% 123.0 0.0%
LHR - ORY British Airways 258.9 0.0% 123.0 0.0%
Air LCC LCY - ORY AirFrance/Cityjet/VLM 201.9 0.0% 103.0 0.0%
LTN - CDG Easyjet 98.8 -0.2% 64.0 0.0%
Road LDN - PAR Car + Eurotunnel Shuttle 126.9 -0.1% 82.0 0.0%
LDN - PAR Car + P&O/DFDS Ferries 105.0 0.0% 80.0 0.0%
Market shares (%)
Rail QQS - XPG Eurostar 63.0 4.2% 48.8 0.7%
Air FSC LHR - CDG British Airways 4.6 -6.5% 1.3 -0.7%
LHR - CDG AirFrance 7.7 -6.2% 2.9 -0.7%
LHR - ORY British Airways 2.1 -6.6% 0.3 -0.7%
Air LCC LCY - ORY AirFrance/Cityjet/VLM 1.6 -6.6% 0.3 -0.7%
LTN - CDG Easyjet 4.3 -6.4% 3.5 -0.7%
Car LDN - PAR Car + Eurotunnel Shuttle 2.1 -6.5% 7.1 -0.7%
LDN - PAR Car + P&O/DFDS Ferries 0.5 -6.6% 6.0 -0.7%
Outside alternative 14.0 -6.6% 29.8 -0.7%
Consumer surplus 149.6 3.6% 48.7 0.6%

Simulation results: Entry of a LCC Train operator
Share outside alternative (%) Business 15 Leisure 30
Resulting Change Resulting Change
Connection Carrier Value (%) Value (%)
Prices (€)
Rail QQS - XPG Eurostar 361.1 208.7% 102.9 40.9%
QQS - XPG LCC Train 297.6 0.0% 101.9 0.0%
Air FSC LHR - CDG British Airways 277.3 -0.6% 116.8 -0.1%
LHR - CDG AirFrance 287.9 -1.1% 122.6 -0.3%
LHR - ORY British Airways 258.3 -0.3% 123.0 0.0%
Air LCC LCY - ORY AirFrance/Cityjet/VLM 201.4 -0.3% 102.9 -0.1%
LTN - CDG Easyjet 97.0 -2.0% 63.3 -1.1%
Road LDN - PAR Car + Eurotunnel Shuttle 125.9 -0.8% 75.7 -7.7%
LDN - PAR Car + P&O/DFDS Ferries 104.8 -0.2% 85.1 6.4%
Market shares (%)
Rail QQS - XPG Eurostar 45.4 -24.9% 39.5 -18.4%
QQS - XPG LCC Train 44.2 0.0% 39.3 0.0%
Air FSC LHR - CDG British Airways 1.4 -70.7% 0.6 -54.7%
LHR - CDG AirFrance 2.5 -69.9% 1.3 -54.3%
LHR - ORY British Airways 0.7 -71.3% 0.1 -54.9%
Air LCC LCY - ORY AirFrance/Cityjet/VLM 0.5 -71.2% 0.2 -55.1%
LTN - CDG Easyjet 1.4 -70.4% 1.6 -54.0%
Car LDN - PAR Car + Eurotunnel Shuttle 0.7 -70.8% 0.6 -91.6%
LDN - PAR Car + P&O/DFDS Ferries 0.1 -71.3% 2.9 -51.2%
Outside alternative 4.3 -71.3% 13.6 -54.8%
Consumer surplus 239.4 65.7% 80.4 65.9%

Conclusion
• Eurostar has a dominant market share of about 70% (2012) on the London-Paris
market
• This share is sensitive to changes in infrastructure charges.
• Introduction of new Velaro trainsets with more seat capacity will make Eurostar’s
market position even more dominant.
• A new high-speed rail entrant would completely change the competitive
landscape. With the same pricing and quality characteristics Eurostar’s market
share will be halved.
• If the new entrant is capable to reduce its marginal costs, the effect will even be
bigger and also drive airlines and private out of the market.
• The business market is less sensitive to prices, but more sensitive to the service
level offering.
• The model for oligopolistic markets with differentiated products as used in this
study has proven to be a valuable tool to study competition in transport markets.

Future research
• Fine-tuning of the model and input parameters
• Development of the London-Paris market for subsequent years using the statistical time-
series data available from the UK International Passenger Survey.
• Further application of the methodology on other links to capture the competitive position
of operators in the West European market in more detail.

Copyright © Jack Doomernik 2016
… thank you for your kind attention!
Jack Doomernik
Antwerp University Avans University of Applied Sciences
Faculty of Applied Economics Centre of Expertise for Sustainable Innovation
E [email protected] E [email protected]
W www.uantwerpen.be W www.avans.nl
University of Applied Sciences