Embed Size (px)
Citation preview
Presentation to UC/CSU Energy Managers
Wednesday, April 19, 2023
Energy DivisionCalifornia Public Utilities Commission (CPUC)
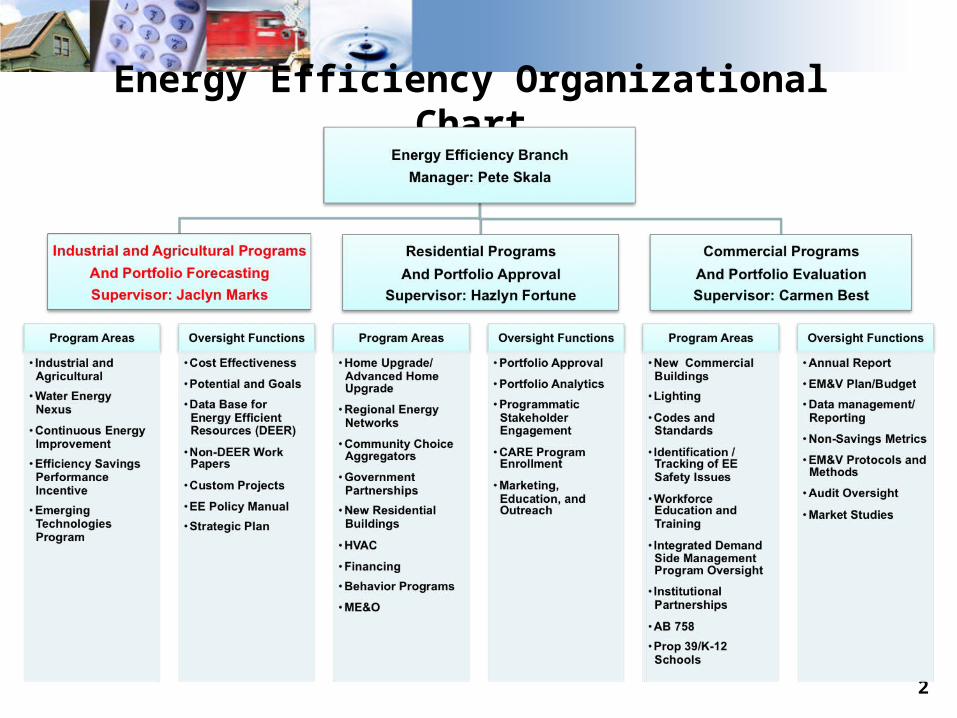
Energy Efficiency Organizational Chart
2
Why am I here today?
• Eric invited me to speak to you about– Rolling Portfolio Cycle– Water Energy– EM&V
• But then he sent me your questions…
3
Why Invest in Energy Efficiency?
• It saves you money
• It can help mitigate climate change
Let’s imagine a future where…
4
So where does energy efficiency fit it?
Source: California Air Resources Board Scoping Plan, December 2008, Table 2. 5
6
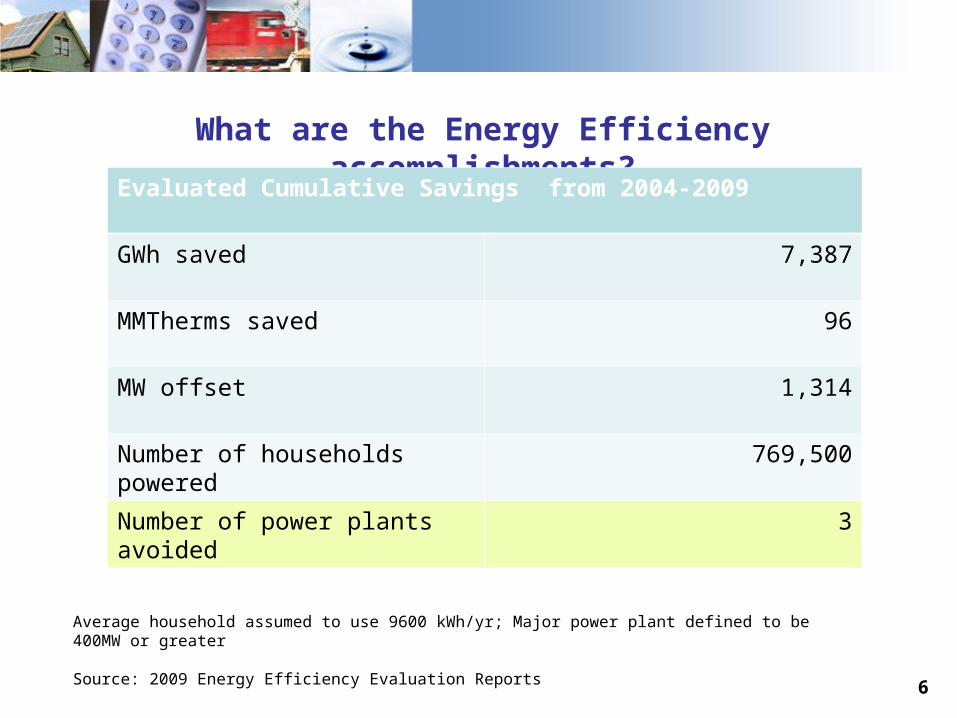
What are the Energy Efficiency accomplishments?
Average household assumed to use 9600 kWh/yr; Major power plant defined to be 400MW or greater
Source: 2009 Energy Efficiency Evaluation Reports
Evaluated Cumulative Savings from 2004-2009
GWh saved 7,387
MMTherms saved 96
MW offset 1,314
Number of households powered 769,500
Number of power plants avoided 3
7
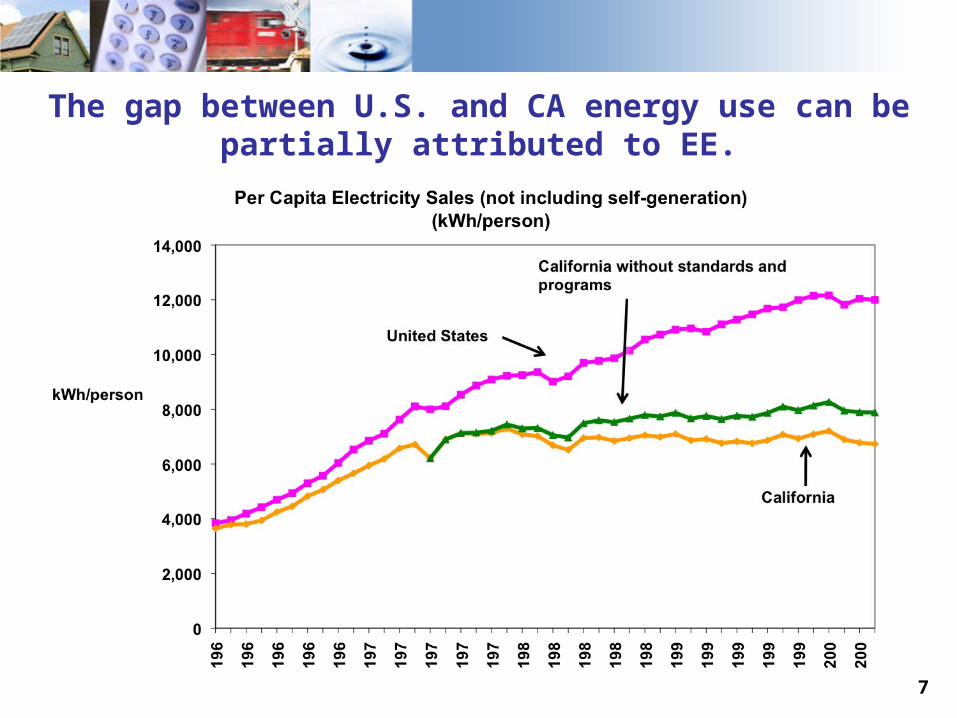
The gap between U.S. and CA energy use can be partially attributed to EE.
8
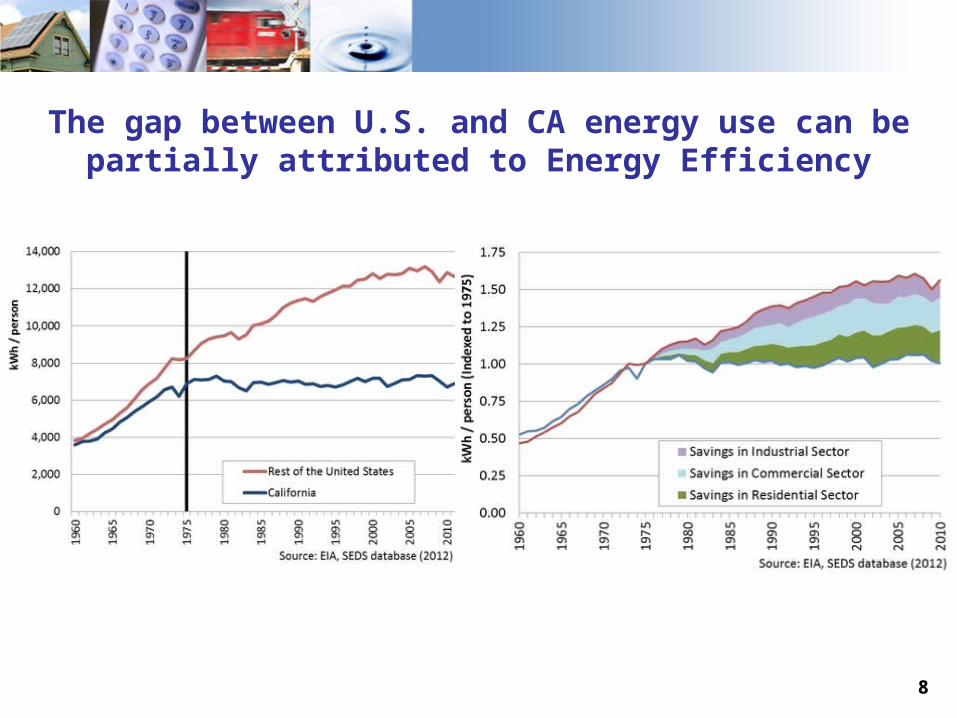
The gap between U.S. and CA energy use can be partially attributed to Energy Efficiency
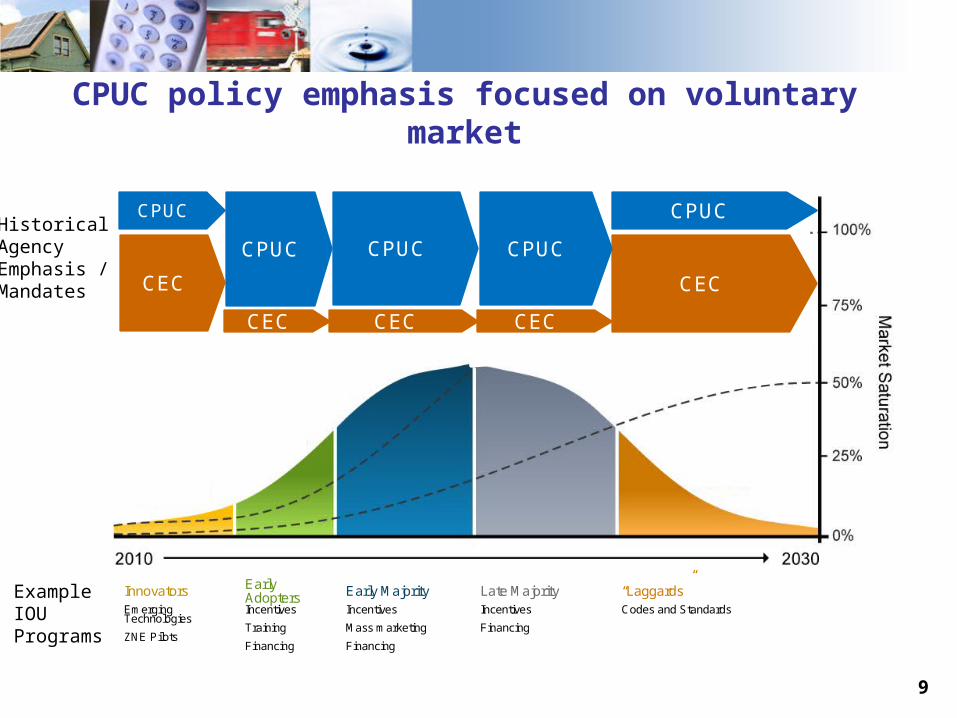
CPUC policy emphasis focused on voluntary market
Innovators Early Adopters Early Majority Late Majority “Laggards”
Emerging Technologies
ZNE Pilots
Incentives
Training
Financing
Incentives
Mass marketing
Financing
Incentives
Financing
Codes and Standards
Ex
am
ple
P
rog
ram
s
CEC CEC
CEC CECCEC
CPUC
CPUC
CPUC
CPUC CPUCHistorical Agency Emphasis / Mandates
ExampleIOU Programs
9
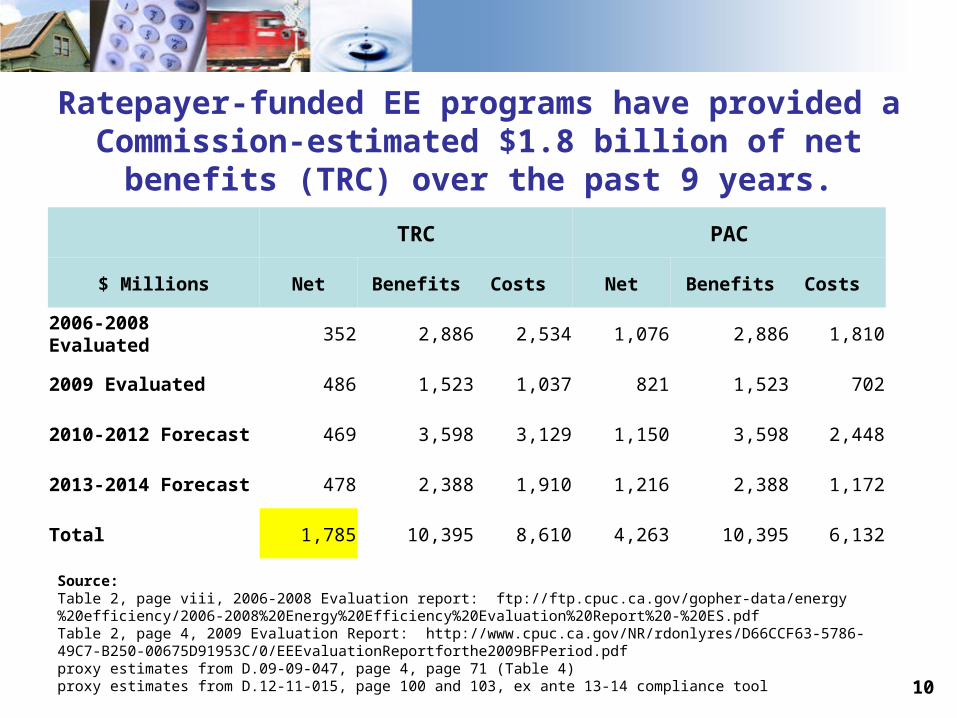
Ratepayer-funded EE programs have provided a Commission-estimated $1.8 billion of net benefits
(TRC) over the past 9 years.
TRC PAC
$ Millions Net Benefits Costs Net Benefits Costs
2006-2008 Evaluated 352 2,886 2,534 1,076 2,886 1,810
2009 Evaluated 486 1,523 1,037 821 1,523 702
2010-2012 Forecast 469 3,598 3,129 1,150 3,598 2,448
2013-2014 Forecast 478 2,388 1,910 1,216 2,388 1,172
Total 1,785 10,395 8,610 4,263 10,395 6,132
10
Source:Table 2, page viii, 2006-2008 Evaluation report: ftp://ftp.cpuc.ca.gov/gopher-data/energy%20efficiency/2006-2008%20Energy%20Efficiency%20Evaluation%20Report%20-%20ES.pdfTable 2, page 4, 2009 Evaluation Report: http://www.cpuc.ca.gov/NR/rdonlyres/D66CCF63-5786-49C7-B250-00675D91953C/0/EEEvaluationReportforthe2009BFPeriod.pdfproxy estimates from D.09-09-047, page 4, page 71 (Table 4)proxy estimates from D.12-11-015, page 100 and 103, ex ante 13-14 compliance tool
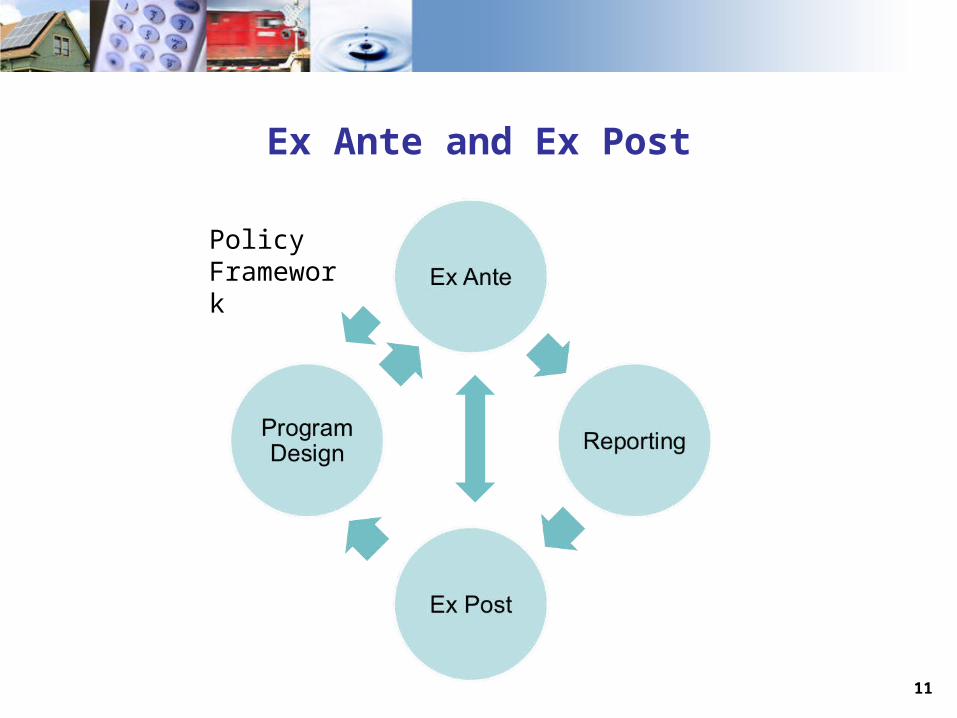
Ex Ante and Ex Post
11
Policy Framework
12
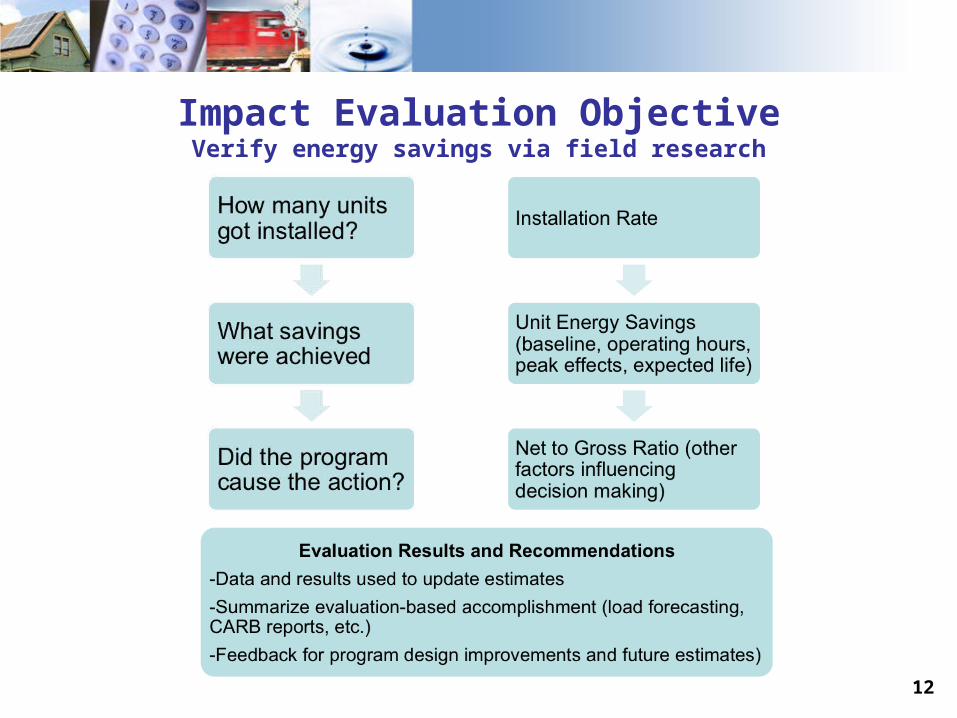
Impact Evaluation ObjectiveVerify energy savings via field research
13
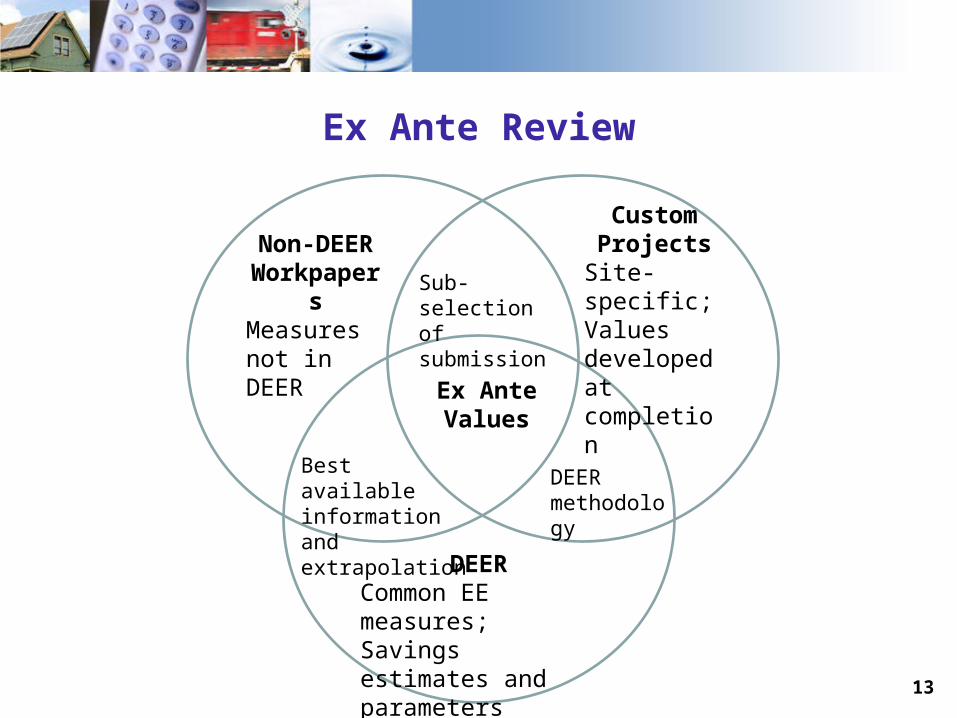
Non-DEER Workpapers
Measures not in DEER
DEERCommon EE measures;Savings estimates and parameters
Custom Projects
Site-specific;Values developed at completion
Ex Ante Values
Best available information and extrapolation
DEER methodology
Sub-selection of submission
Ex Ante Review
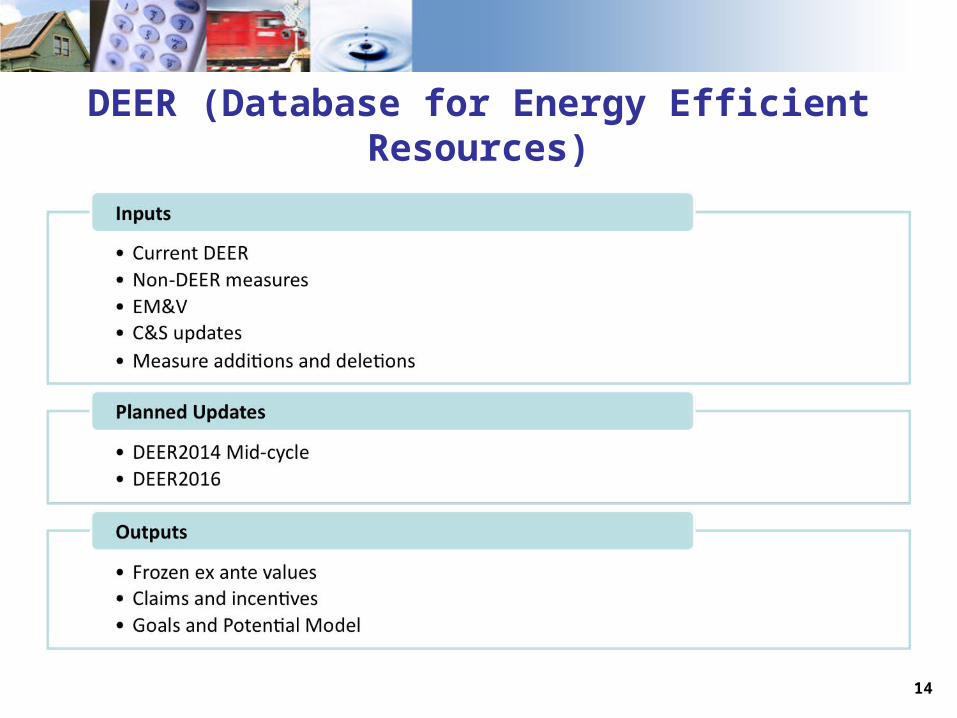
DEER (Database for Energy Efficient Resources)
14
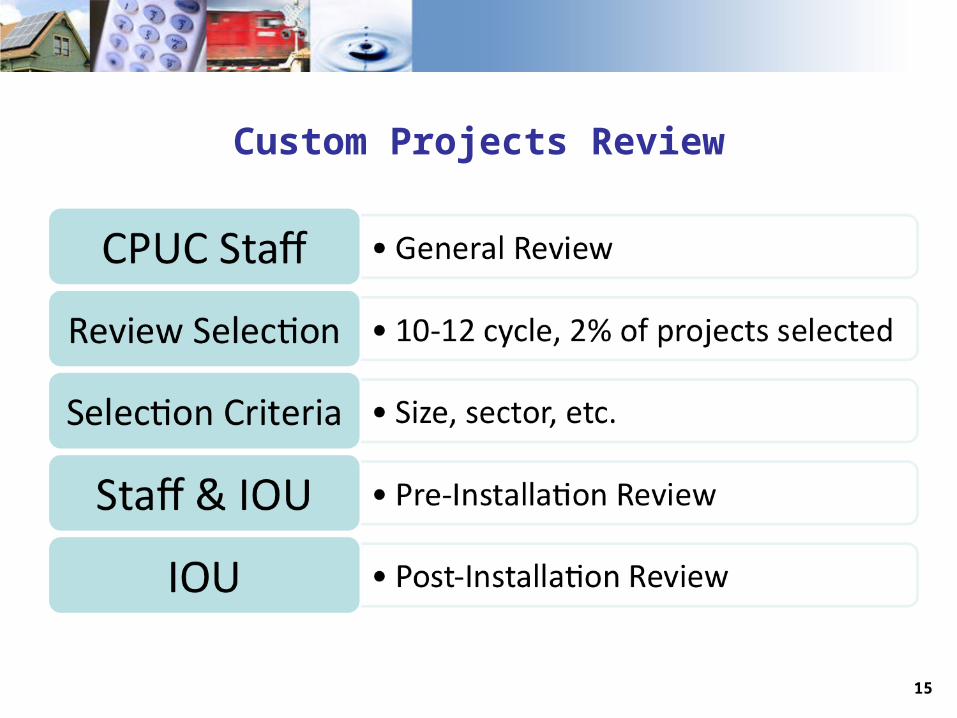
Custom Projects Review
15
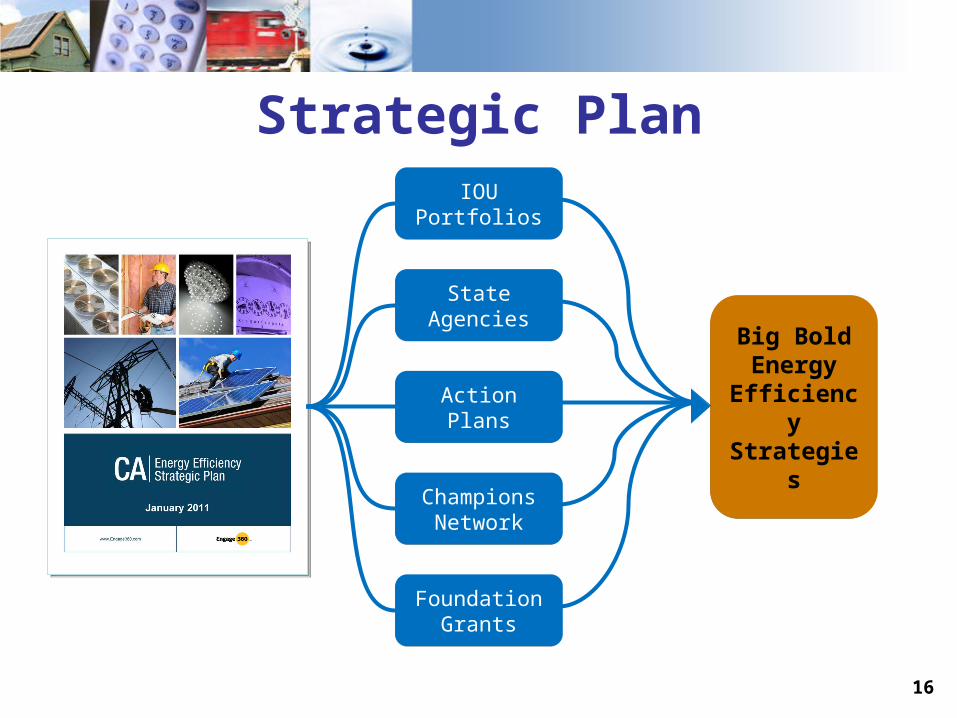
Strategic Plan
IOU PortfoliosIOU Portfolios
State Agencies
State Agencies
Action PlansAction Plans
Champions Network
Champions Network
Foundation Grants
Foundation Grants
Big Bold Energy
Efficiency Strategies
Big Bold Energy
Efficiency Strategies
16
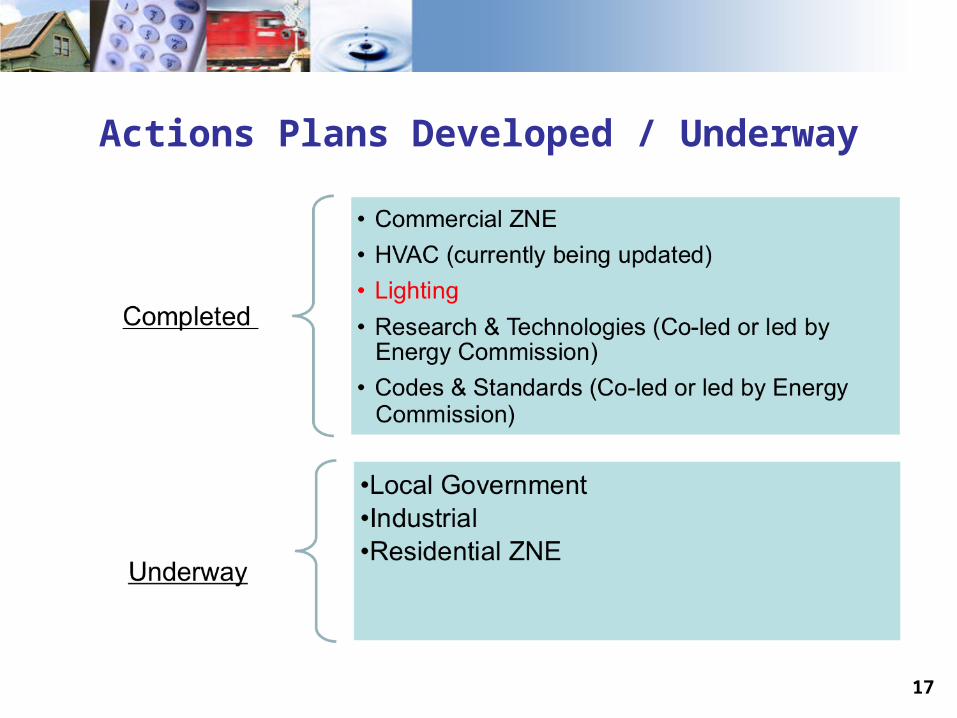
Actions Plans Developed / Underway
17
18
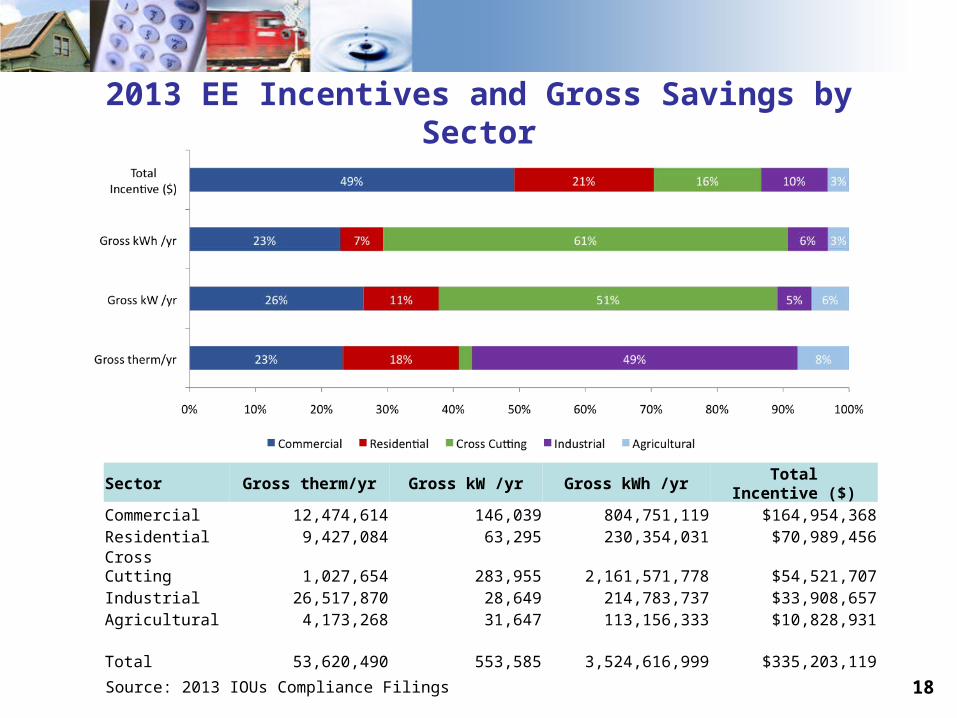
2013 EE Incentives and Gross Savings by Sector
Sector Gross therm/yr Gross kW /yr Gross kWh /yrTotal
Incentive ($)Commercial 12,474,614 146,039 804,751,119 $164,954,368Residential 9,427,084 63,295 230,354,031 $70,989,456Cross Cutting 1,027,654 283,955 2,161,571,778 $54,521,707Industrial 26,517,870 28,649 214,783,737 $33,908,657Agricultural 4,173,268 31,647 113,156,333 $10,828,931
Total 53,620,490 553,585 3,524,616,999 $335,203,119
Source: 2013 IOUs Compliance Filings
19
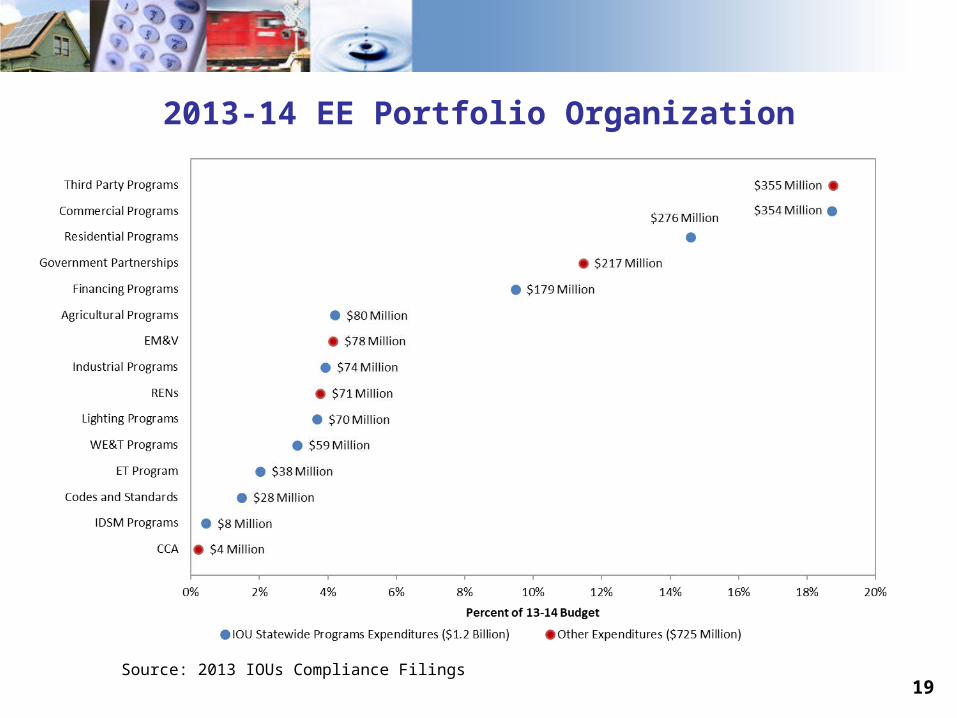
2013-14 EE Portfolio Organization
Source: 2013 IOUs Compliance Filings
20
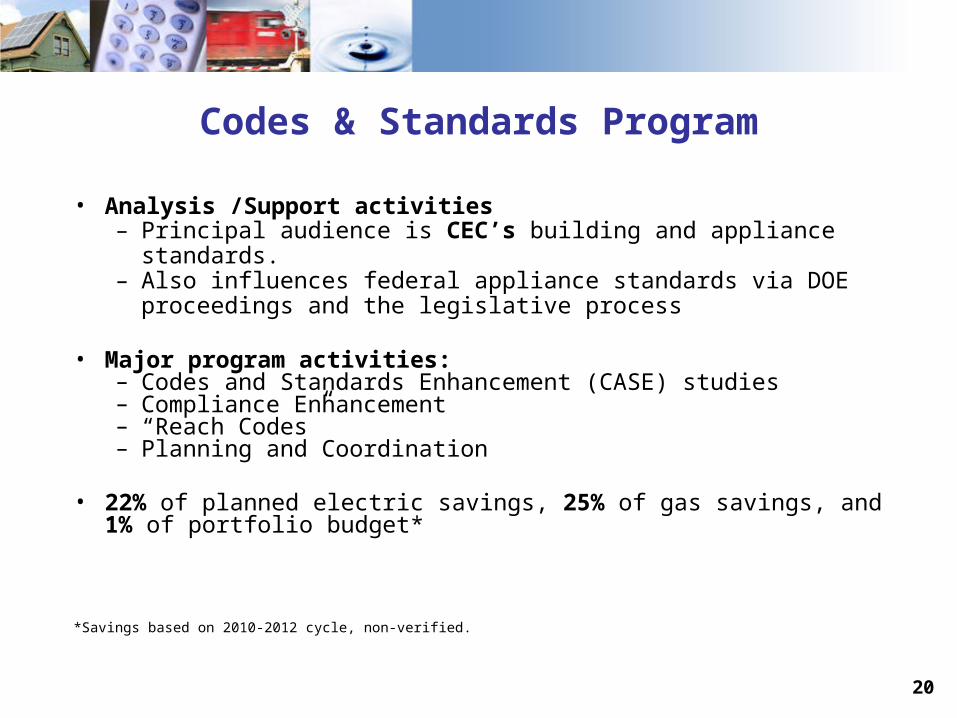
Codes & Standards Program
• Analysis /Support activities– Principal audience is CEC’s building and appliance standards. – Also influences federal appliance standards via DOE
proceedings and the legislative process
• Major program activities:– Codes and Standards Enhancement (CASE) studies – Compliance Enhancement – “Reach Codes” – Planning and Coordination
• 22% of planned electric savings, 25% of gas savings, and 1% of portfolio budget*
*Savings based on 2010-2012 cycle, non-verified.
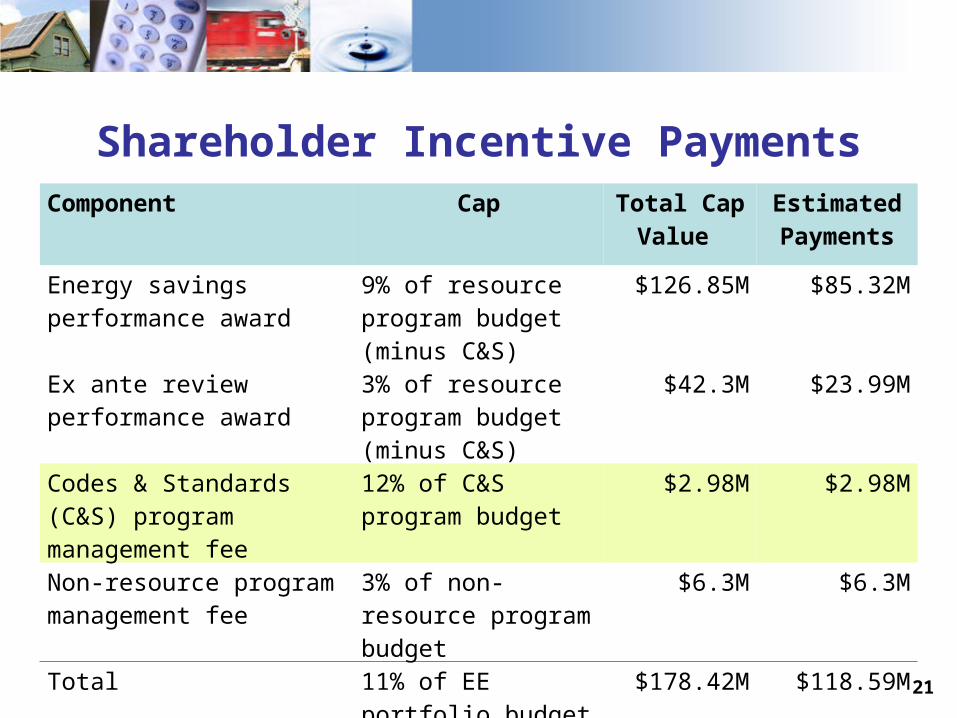
Shareholder Incentive Payments
21
Component Cap Total Cap Value
Estimated Payments
Energy savings performance award
9% of resource program budget (minus C&S)
$126.85M $85.32M
Ex ante review performance award
3% of resource program budget (minus C&S)
$42.3M $23.99M
Codes & Standards (C&S) program management fee
12% of C&S program budget
$2.98M $2.98M
Non-resource program management fee
3% of non-resource program budget
$6.3M $6.3M
Total 11% of EE portfolio budget
$178.42M $118.59M
22
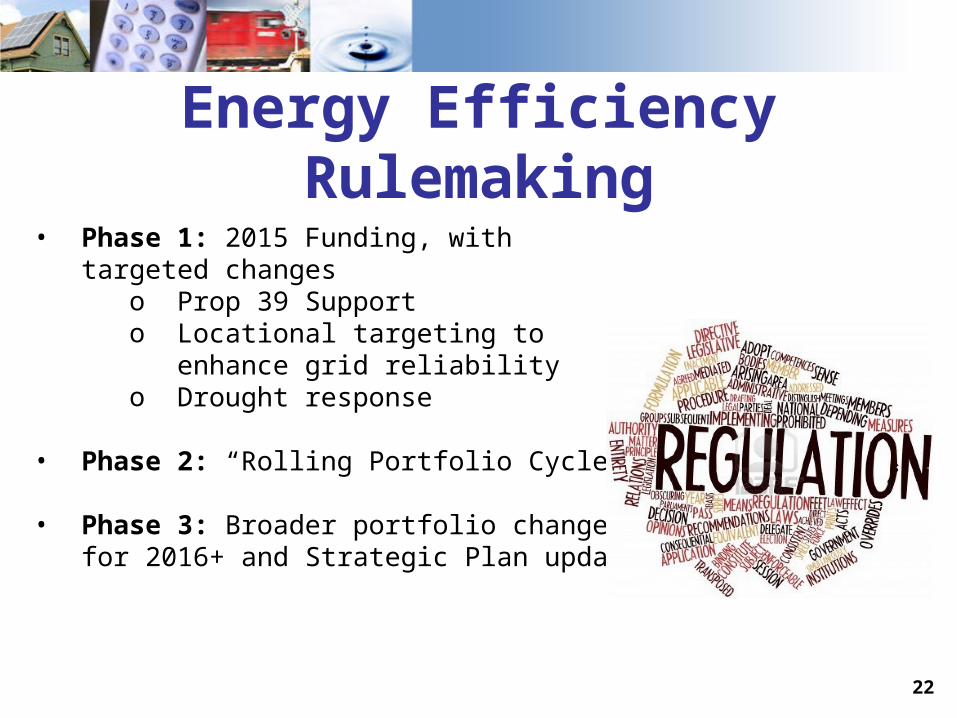
Energy Efficiency Rulemaking
• Phase 1: 2015 Funding, with targeted changes o Prop 39 Supporto Locational targeting to enhance grid
reliability o Drought response
• Phase 2: “Rolling Portfolio Cycles”
• Phase 3: Broader portfolio changes for 2016+ and Strategic Plan update
23
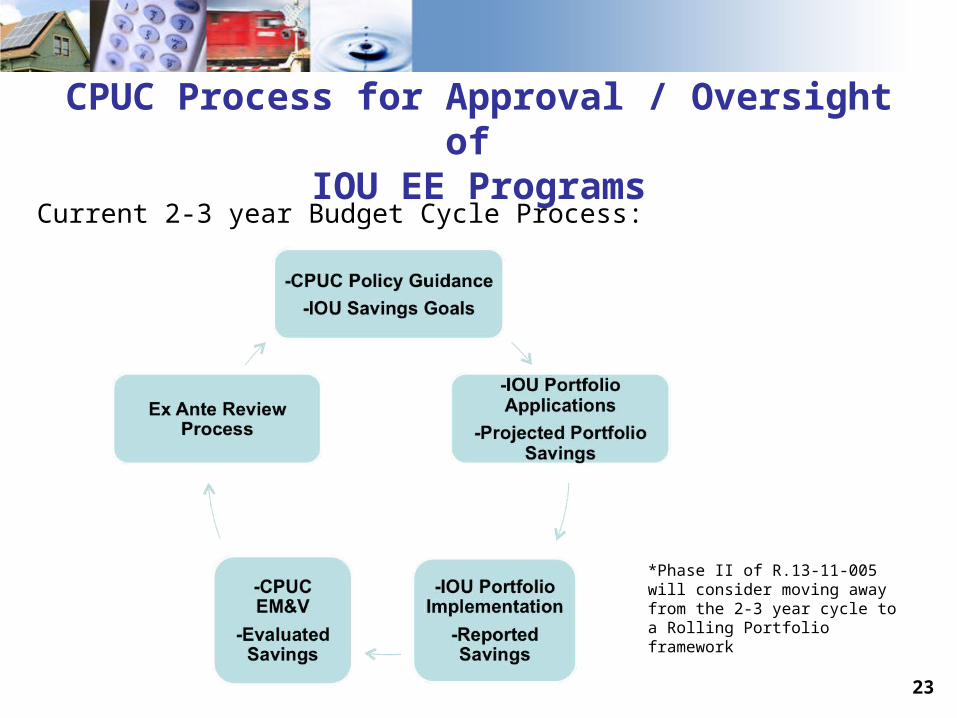
CPUC Process for Approval / Oversight of IOU EE Programs
Current 2-3 year Budget Cycle Process:
*Phase II of R.13-11-005 will consider moving away from the 2-3 year cycle to a Rolling Portfolio framework

24
Rolling Portfolio Cycle
• Stakeholder effort underway to determine the framework. Proposal will be submitted to the proceeding when Phase II launches• The Joint Stakeholders believe that long-term energy
efficiency funding authorization will: • create market stability, • sustain momentum and performance of successful
programs, • improve ability to “count” efficiency for resource
planning, and • enable the “delinking” of the contracting process
from regulatory schedules.
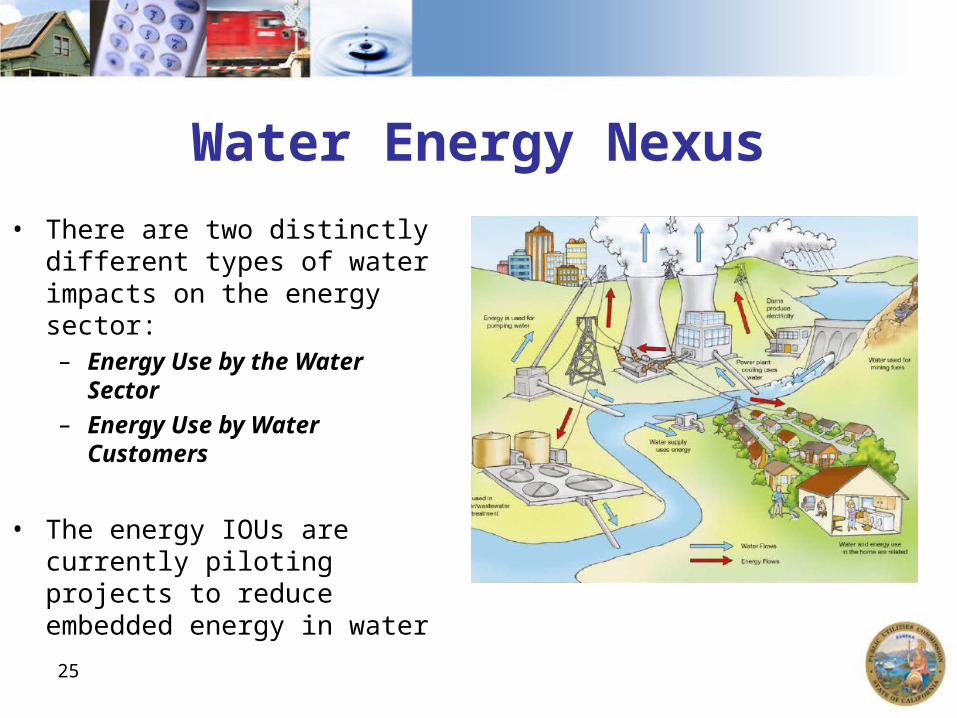
Water Energy Nexus
• There are two distinctly different types of water impacts on the energy sector:– Energy Use by the Water
Sector
– Energy Use by Water Customers
• The energy IOUs are currently piloting projects to reduce embedded energy in water
25
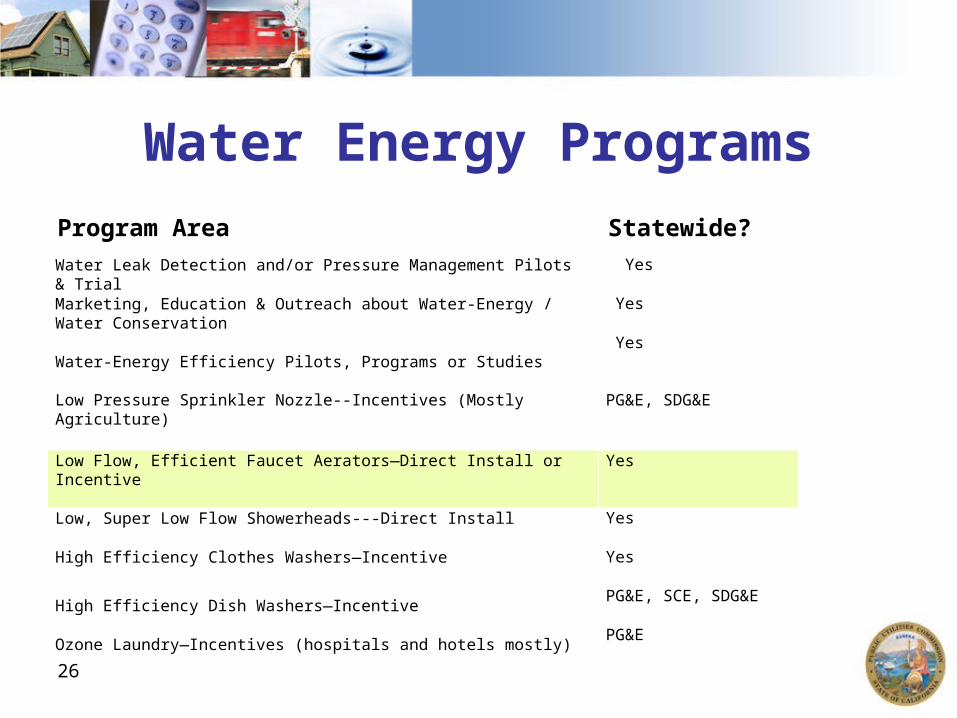
Water Energy Programs
26
Program Area Statewide?
Water Leak Detection and/or Pressure Management Pilots & Trial Yes
Marketing, Education & Outreach about Water-Energy / Water Conservation
Yes
Water-Energy Efficiency Pilots, Programs or Studies
Yes
Low Pressure Sprinkler Nozzle--Incentives (Mostly Agriculture)
PG&E, SDG&E
Low Flow, Efficient Faucet Aerators—Direct Install or Incentive
Yes
Low, Super Low Flow Showerheads---Direct Install
Yes
High Efficiency Clothes Washers—Incentive
Yes
High Efficiency Dish Washers—Incentive PG&E, SCE, SDG&E
Ozone Laundry—Incentives (hospitals and hotels mostly) PG&E
Thank You
Jaclyn Marks, SupervisorCPUC Energy Division
Energy Efficiency Agricultural/Industrial Programs and Portfolio Forecasting Section
More information on the Water Energy Nexus:http://www.cpuc.ca.gov/PUC/energy/Energy+Efficiency/Water-
Energy+Nexus+Programs.htm
27