Embed Size (px)
Citation preview

PRM-TEMP-01-0105
Presentation to the Presentation to the NDIA 6NDIA 6thth Annual Annual
CMMI Technology CMMI Technology ConferenceConference
Ruth T. Buys, Ruth T. Buys, Ph.,DPh.,D..November 13November 13--16, 200616, 2006
2
Agenda
Implementing processes for CMMI® Levels 2 and 3– Approach– Challenges
Measurement – In the Measurement and Analysis Process Area– Estimates and Actuals for projects
Benefits and Similar Observations
3
Implementing Processes for CMMI® Levels 2 and 3

4
Approach
Set up the process improvement activity as a projectEstablished the infrastructure firstSelected documentation formatLeveraged a strong set of existing practicesRolled out defined processes to pilot projects with training for everyone

5
A Project Approach
•Objectives•Monitoring and control strategy•Risks•Resource estimates•Milestones•Quality assurance and configuration management•Schedule
2. Function as a Team
•Regularly scheduled meetings•Delegate activities•Assignment of Action Items•Follow-up
3. Measure and Report
•Establish reasonable performance thresholds•Collect progress data at regular intervals•Analyze results•Take corrective action
+
+
1. Plan
6
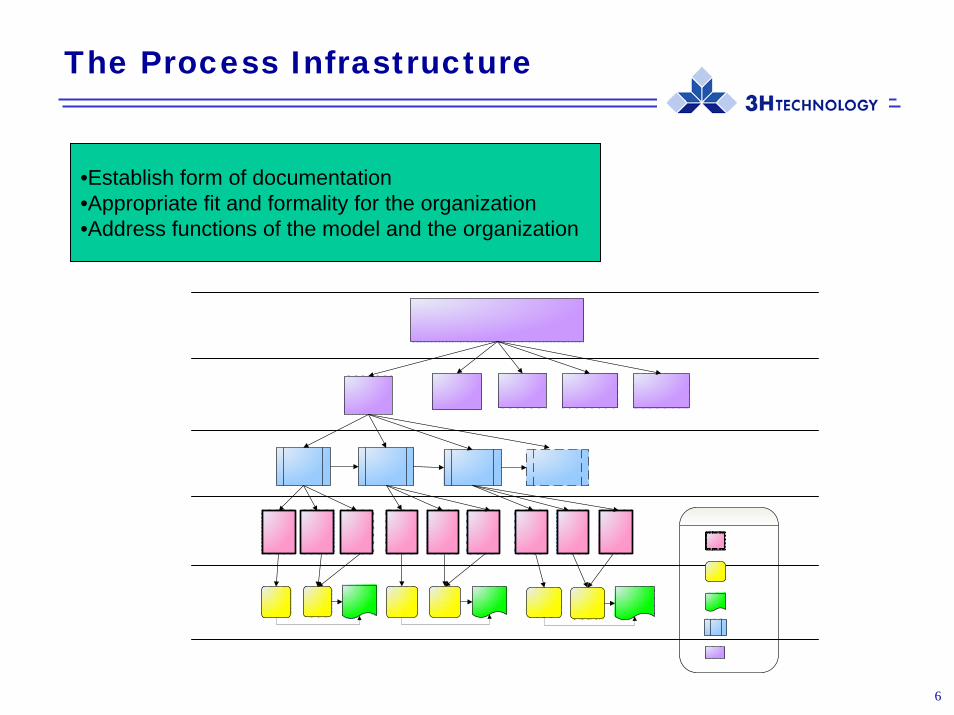
The Process Infrastructure
•Establish form of documentation•Appropriate fit and formality for the organization•Address functions of the model and the organization

7
Documentation Format
PRM-PD-02-1004
3.0 Configuration Management Process
PCR submitted
Determine if Pilot is needed
If yes
1.3 Publish in PAL
Procedure
Determine if Training is
needed
Determine if Pilot is
successful
If successful
If no
If no
If no
If yes
1.2 PCR Workflow
1.2.3 Pilot Implementation
ETVX
1.2.4 Training ETVX
Hand off (OT 5.2.1 ETVX)
1.2.1 Process Change Request ETVX
Legend
Document
Procedure
Process
Decision point
Task
Activity
1.2.2 Implement PCR ETVX
©3H Technology LLC Proprietary and Confidential
Entry Criteria
Task(s) to be Performed Job Aids Exit Criteria
•Approved Process Change Requests
1. EPG CM determines need for a pilot or training.
2. Review Process Change Request and document EPG Implementation Decision.
3. Implement change according to the timeframe documented in the PCR or by the EPG.
4. Once the change is complete notify PCR owner and the EPG.
1. Process Change Request Form and work instructions.
4. Process Hierarchy Architecture
4. ETVX Diagram.
Approved/Declined/Postponed PCR.
Verification Steps
• EPG configuration audits• EPG configuration status reports
Flowcharts and Entry, Task, Verification and eXit (ETVX) tables

8
Existing Practices
Estimating levels of effortProject schedulesVision documentsDefect tracking in an automated toolTest scriptsIndependent quality assurance organizationVersion management for all documents

9
Roll out of Defined Processes
Train pilot projectsInvite everyoneRework as required

10
Challenges
Everyone wanted to be on all the process action teamsNo one wanted to be a process area ownerConstraints on membership in the Management Steering CommitteeMeasuresTailoringCommon practicesLack of well defined chain of command for reporting

11
New Words and Different Meanings
Project Plan is not equal to a project scheduleValidation can have many namesConfiguration audits are not the same as process auditsQuality assurance is not testingProduct integration occurs, even if it is not a distinct procedureTailoring means flexibility, not a waiver

12
Tailoring
Define project size thresholds (value, FTE, or duration?)How to record project tailoring selectionsDocument the guidelines to include roles and responsibilitiesNotations on process or work product, optional, alternative practice or must use as-is

13
Identifying Existing Practices
Confusion: same words, different meaningsConfusion: different words, same meaningsConfusion: new words Existing practices not fully documentedExisting practices not consistently practicedNot all existing practices known across the organization

14
Measures
Benefit hard to seeWe do enough of this alreadyNo time; the contract doesn’t pay for itHow can you estimate these things? (Quality cannot be predicted (estimated))Size does not mean estimated resource or level of effortStaff level of effort is not the entire level of effort

15
Measurement
16
Measurement and Analysis Process Area
Corporate level Measures GuideFour measurement categoriesMeasures worksheetIndustry best practices for thresholdsRepository on SharepointEarned Value
17
Measures Categories
For the Measurement and Analysis Process Area– Level of effort– Size– Quality– Schedule
18
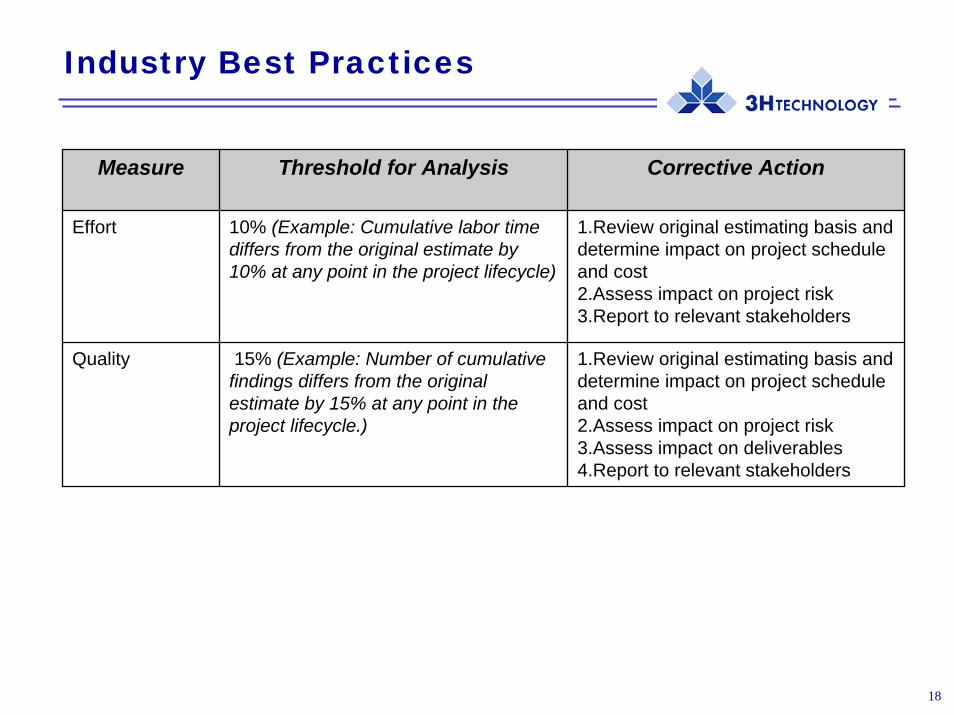
Industry Best Practices
Measure Threshold for Analysis Corrective Action
Effort 10% (Example: Cumulative labor time differs from the original estimate by 10% at any point in the project lifecycle)
1.Review original estimating basis and determine impact on project schedule and cost2.Assess impact on project risk3.Report to relevant stakeholders
Quality 15% (Example: Number of cumulative findings differs from the original estimate by 15% at any point in the project lifecycle.)
1.Review original estimating basis and determine impact on project schedule and cost2.Assess impact on project risk3.Assess impact on deliverables4.Report to relevant stakeholders
19
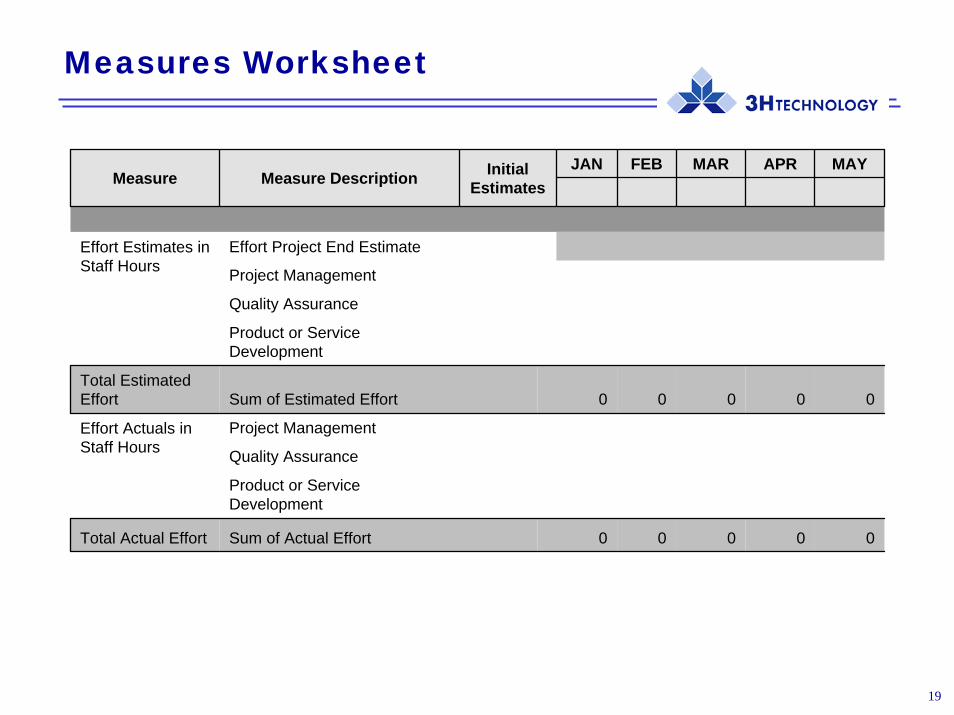
Measures Worksheet
JAN FEB MAR APR MAY
Effort Project End Estimate
Project Management
Quality Assurance
Product or Service Development
Total Estimated Effort Sum of Estimated Effort 0 0 0 0 0
Project Management
Quality Assurance
Product or Service Development
Total Actual Effort Sum of Actual Effort 0 0 0 0 0
Effort Actuals in Staff Hours
Effort Estimates in Staff Hours
Measure Measure Description Initial Estimates

20
Measure: Estimated Effort - Project A
0200400600800
1,0001,2001,4001,6001,800
Jan Feb Mar Apr May Jun Jul
PM QA Dev
21
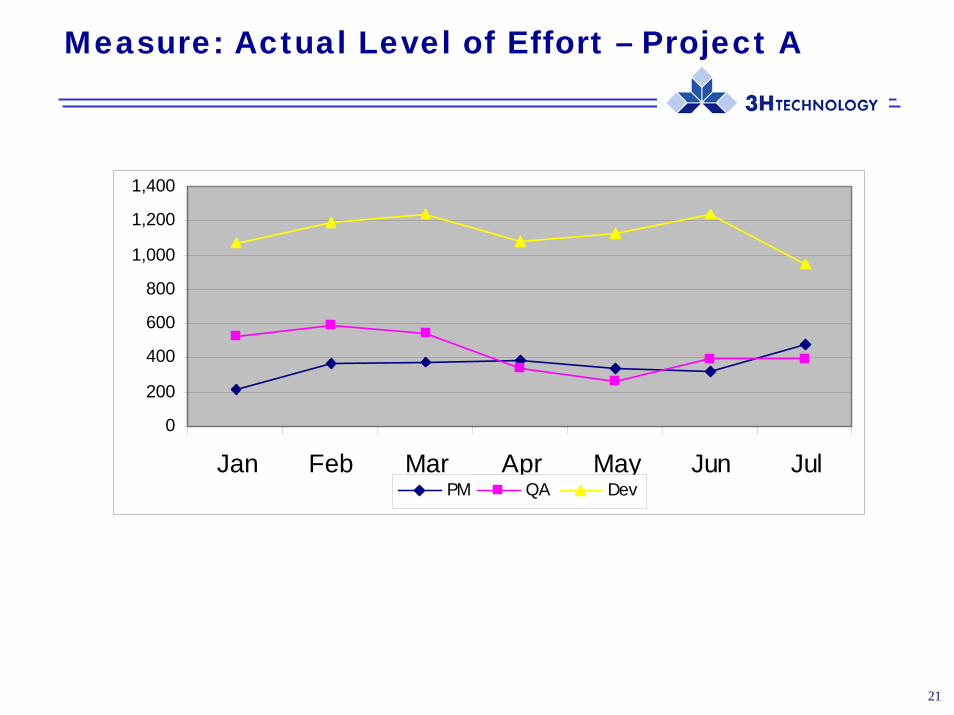
Measure: Actual Level of Effort – Project A
0
200
400
600
800
1,000
1,200
1,400
Jan Feb Mar Apr May Jun JulPM QA Dev

22
Measure: Estimated Effort – Project B
0
1000
2000
3000
4000
5000
6000
JAN FEB MAR APR MAY JUN JUL
PM QA Dev
23
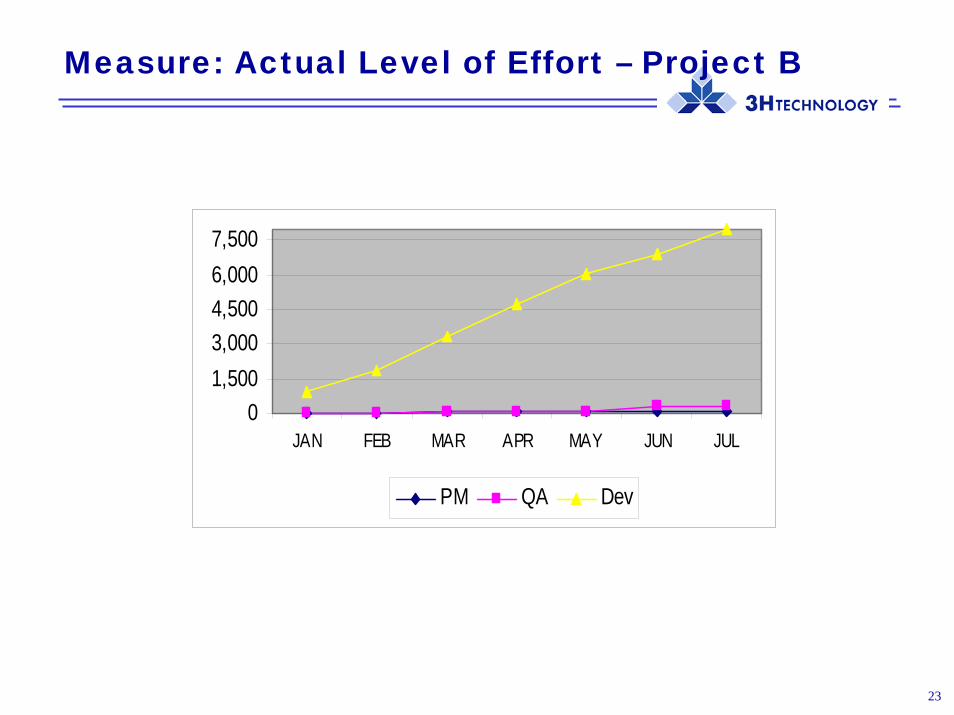
Measure: Actual Level of Effort – Project B
01,5003,0004,5006,0007,500
JAN FEB MAR APR MAY JUN JUL
PM QA Dev

24
Measure: Estimated vs Actual Effort – Project A
010002000300040005000600070008000
JAN FEB MAR APR MAY JUN JULPM - E PM - A QA - E QA - A Dev - E Dev - A
25
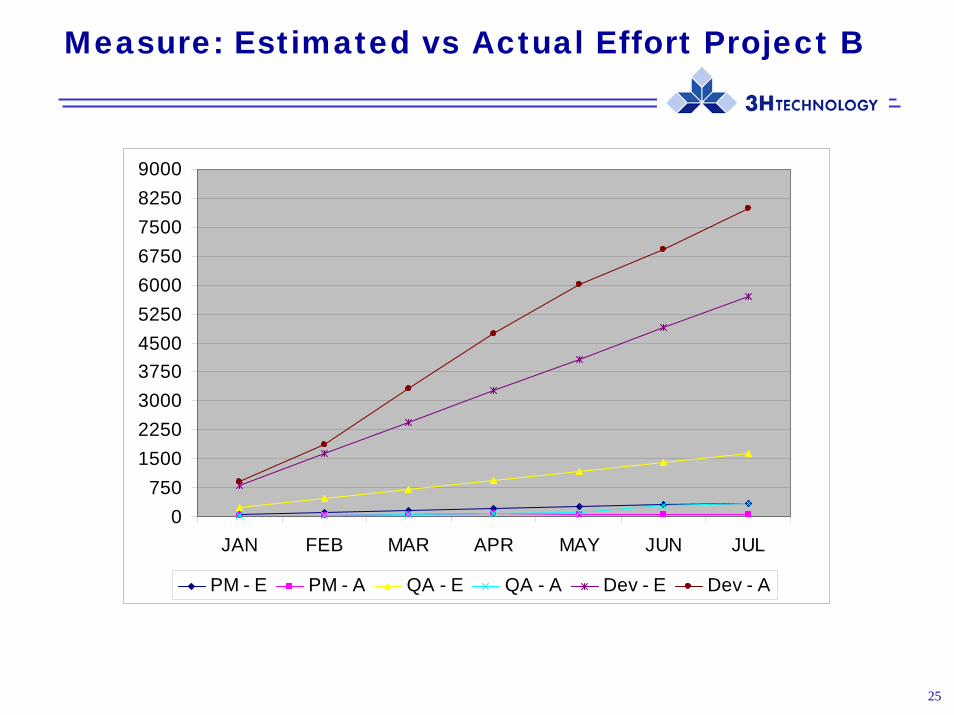
Measure: Estimated vs Actual Effort Project B
0750
15002250300037504500525060006750750082509000
JAN FEB MAR APR MAY JUN JUL
PM - E PM - A QA - E QA - A Dev - E Dev - A

26
Measure: Effort Final Results – Project A
13,646
11,758
9,822
8,030
6,137
4,201
2,313
13,450
11,623
9,672
7,9376,135
3,974
1,8180
1,0002,0003,0004,0005,0006,0007,0008,0009,000
10,00011,00012,00013,00014,00015,000
Jan Feb Mar Apr May Jun Jul
Total Est Total Actual
Project came in under estimated effort by 1.44%
27
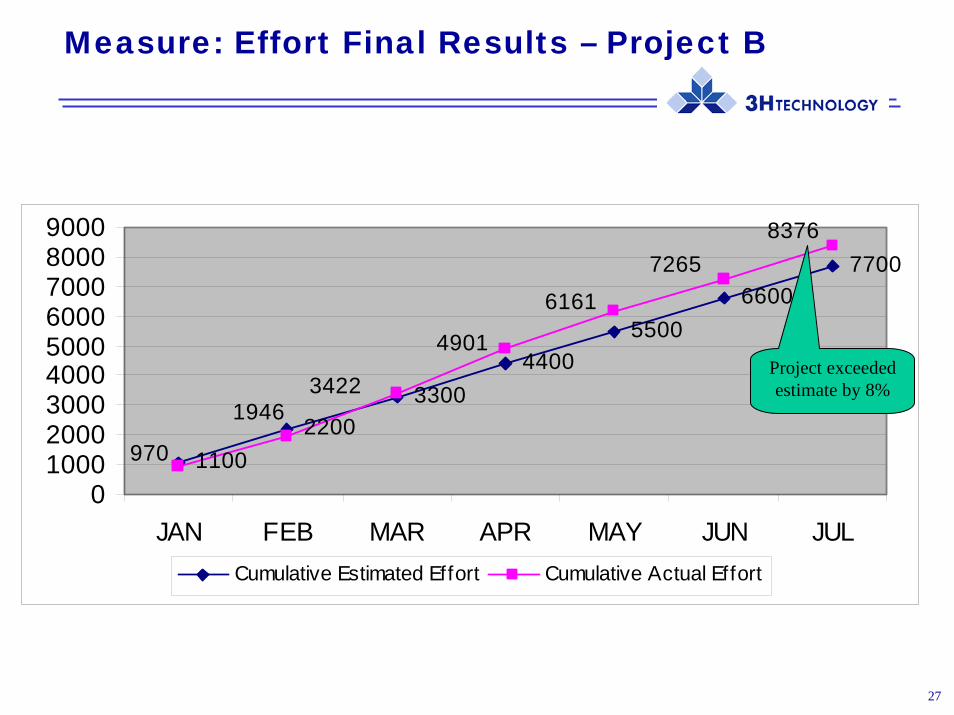
Measure: Effort Final Results – Project B
11002200
33004400
55006600
77008376
7265
6161
4901
34221946
970
0100020003000400050006000700080009000
JAN FEB MAR APR MAY JUN JULCumulative Estimated Effort Cumulative Actual Effort
Project exceeded estimate by 8%

28
Measure: Size
Estimated vs Actual Number of Requirements - Project A
428 441415
402389375362357 360 373 384
417 441 443
0
100
200
300
400
500
Jan. Feb. Mar. Apr. May Jun. Jul
Estimated Requirements Actual Requirements

29
Measure: Quality
Estimated vs Actual Defects (Non-Cumulative) Project A
70
10 20
85100
0 0
61
8 0 0
23
0
50
100
Jan. Feb. Mar. Apr. May Jun.
Estimated Actual
30
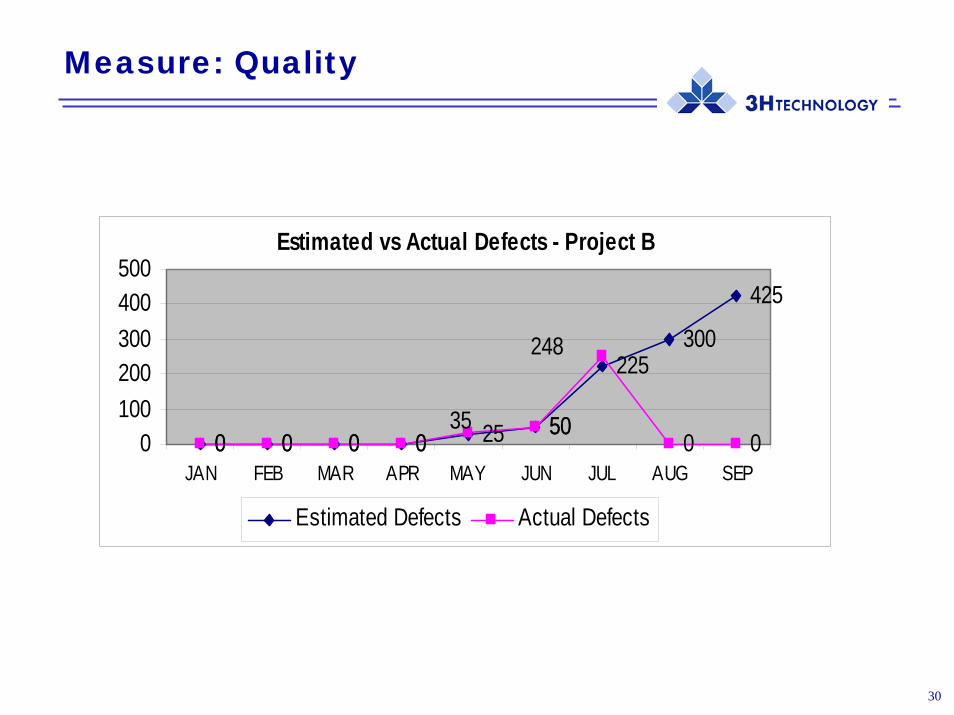
Measure: Quality
Estimated vs Actual Defects - Project B
0 0 0 0 25 50
225300
425
0 0 0 050
0 0
248
350
100200300400500
JAN FEB MAR APR MAY JUN JUL AUG SEP
Estimated Defects Actual Defects

31
Measure: Schedule
Schedule Measures (Deliverables per month) Project A
0
1
2
3
4
5
Jan. Feb. Mar. Apr. May Jun. Jul
Est Completions On-Time CompletionsLate Completions Additional Unplanned Completions

32
PI Measures - Quality
Actual Process Nonconformances (Non-Cumulative) from Audits
0 0 0 0 0 0
4
0
9
0
3
0 0 0
17
9
19
5 5
0 0
13 13
0 0 02
5
14
1
6
0 0
5 55
02468
101214161820
Jan Feb Mar Apr May Jun Jul Aug Sep Oct Nov Dec
Num
ber o
f Non
conf
orm
ance
s
Actual ISO Major Nonconformances Actual ISO Minor NonconformancesActual CMMI Process Major Nonconformances Actual CMMI Process Minor Nonconformances

33
PI Measures - Effort
Effort (Hours - Non-Cumulative) by PI Task
050
100150200250300350400450500550600650700750800850900950
1,0001,050
ProjectManagement
PI Meeting PI Training PI Work PI Appraisal/Audit PI Consulting OT Management
PI Tasks
Jan Feb Mar Apr May Jun Jul Aug Sep Oct Nov Dec

34
PI Measures - Schedule
Deliverable Status (Non-Cumulative)
0
0.5
1
1.5
2
2.5
3
3.5
Jan Feb Mar Apr May Jun Jul Aug Sep Oct Nov Dec
Estimated Completions On-Time Completions Late Completions

35
PI Measures - Size
Number of Items in the PAL (Cumulative)
0
50
100
150
200
250
300
Jan Feb Mar Apr May Jun Jul Aug Sep Oct Nov Dec
Num
ber o
f Ite
ms
Cumulative Estimated Size Cumulative Actual Size

36
Benefits and Similar Observations

37
Benefits and Similar Observations
Implementation perspectivesAlternate Practices and Waived Process AreasThings We Got RightLessons LearnedBenefits

38
Process Decomposition Into Elements
More General
More Detailed
Implementation Perspectives
Implement a Task
A1 PlanA2 Do the WorkA3 DeliverA4 Close out the Task
Procedures
Practices
Process Elements
Organization
Project
Modified from a briefing developed by the Software Productivity Consortium NFP, Inc.

39
Alternate Practices and Waived PAs
SP 3.2 Perform Configuration Audits (CM)Some Verification and most Validation performed by external groupSupplier Agreement ManagementSP 1.3-3 Establish Product Integration Procedures and Criteria (PI)

40
Things We Got Right
Practiced what we preachedSet up the infrastructure before working the detailsLeveraged existing processesEngaged a consultant as objective third partyUsed measures at all stages to determine progress and justify all requests for resources and supportConducted a Class C, then a Class B before the Class A (with variation)

41
Lessons Learned
Focusing on measures is worth the effortIncluding infrastructure early pays offManual works, but automated is much better (action items, change management, version control)Consistent documentation standards make a difference in creating, documenting, tailoring, referencing and using processes

42
Benefits
Quality control improvementsInformation sharing and communication among team membersClarification of roles and responsibilitiesImproved use of measures to make decisionsSignificant additional business opportunities

43
Quality Control Improvements
25
2
01020
3040
Pre QC Post QC
Average Number of Defects found in IV&V Before (Pre QC) and After (Post QC) Implementation of Quality
Control Procedures

44
Information Sharing
Diversity on the process action teamsCross-organization membership on the Engineering Process Group including ISO organizationsCross-organization membership on the internal process audit teams

45
Clarification of Roles and Responsibilities
Roles and Responsibilities defined in a matrixCombined separate tasks by process/lifecycle phase, roles and process tailoring by sizeCreated summary cards for certain roles
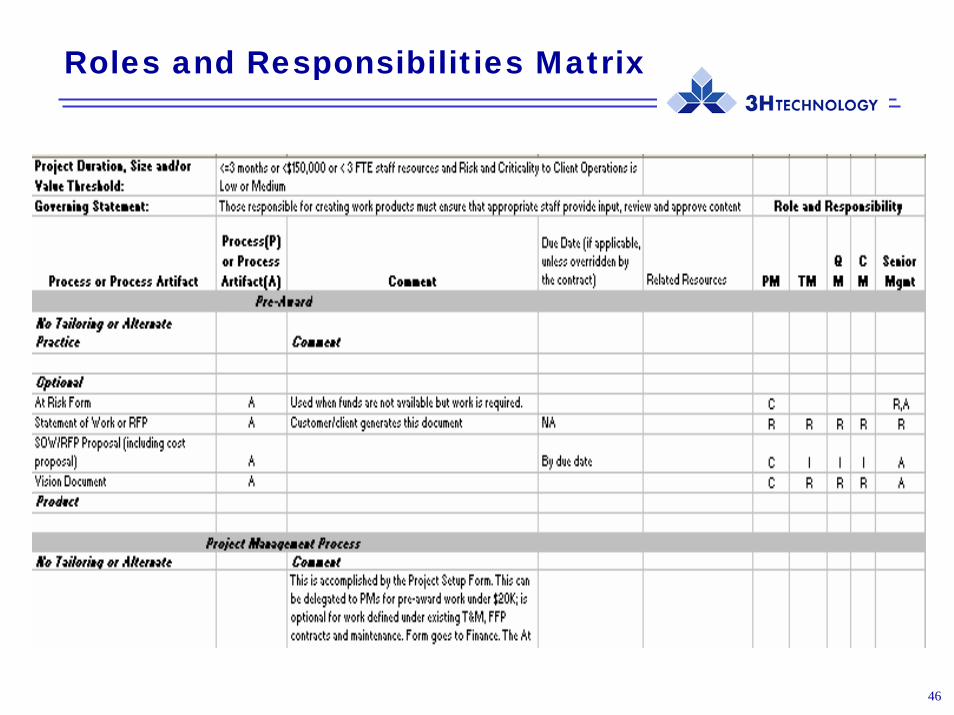
46
Roles and Responsibilities Matrix

47
Improved Use of Measures to Make Decisions
Decision Analysis for selecting technical implementation options, pilots and training for process change requestsSetting measurement goals to guide analysis effortsRisk managementEscalation of process audit results

48
Questions