Embed Size (px)
Citation preview

Morgan Keegan
Morgan Keegan & Company, Inc.1100 Ridgeway Loop Road, Suite 550
Memphis, Tennessee 38120
Mortgage Portfolio Analysis

Morgan Keegan2 |
Mortgage Portfolio Analysis
Residential & Consumer Loan GroupFixed Income Capital Markets
Morgan Keegan3 |
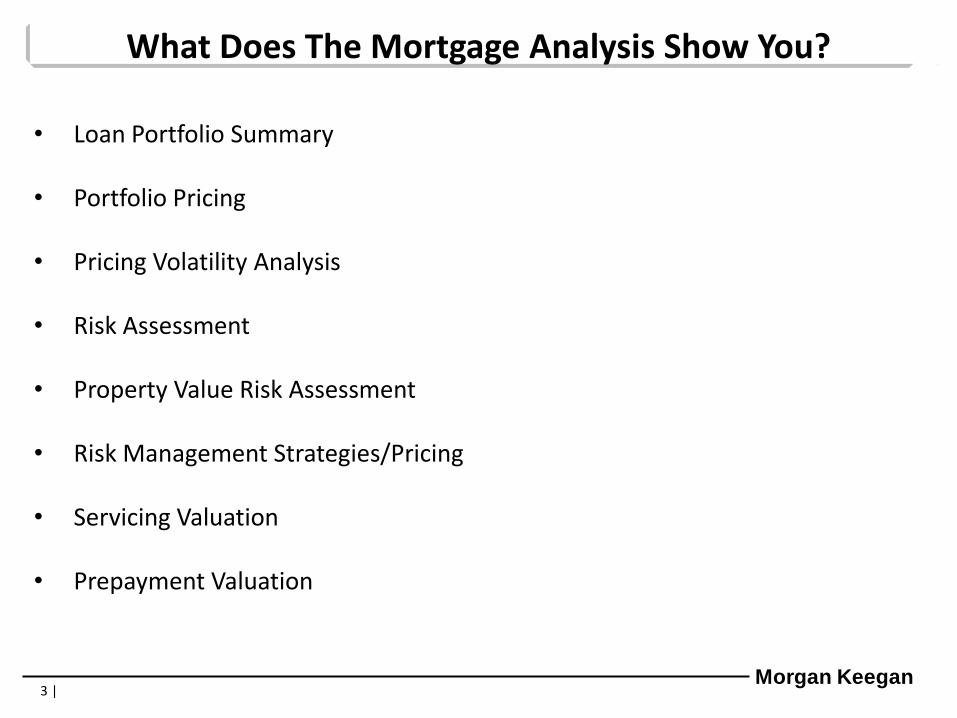
• Loan Portfolio Summary
• Portfolio Pricing
• Pricing Volatility Analysis
• Risk Assessment
• Property Value Risk Assessment
• Risk Management Strategies/Pricing
• Servicing Valuation
• Prepayment Valuation
What Does The Mortgage Analysis Show You?

Morgan Keegan4 |
• What is my portfolio worth? Is it profitable?
• Risk Assessment for ALCO and Regulators
• Evaluate Current Lending Criteria
– Credit tier pricing
– Term pricing
– Non-conforming pricing
• Portfolio Summary Information
• Understanding of Sale or Securitization Options
Why Analyze Your Portfolio?

Morgan Keegan5 |
Mortgage Portfolio Analysis Example
Residential & Consumer Loan GroupFixed Income Capital Markets

Morgan Keegan6 |
Total Portfolio
81%
19%
Fixed Arms
Loan Portfolio Summary Example
• Balances by Product
• WAC (Weighted Average Coupon)
• WAM (Weighted Average Maturity)
• Original & Current Loan-to-Value Ratio
• Weighted Average FICO Scores
# Current Orig Orig Curr Months
PRODUCT Loans Balance % WAC Term WAM FICO LTV LTV Margin to Roll
15YR FIXED 357 36,946,700 9.6% 4.913 180 110 695 48 33
15YR FIXED JUMBO 22 12,921,332 3.4% 5.084 180 137 710 56 43
30YR FIXED 673 121,289,087 31.5% 5.526 358 303 691 64 59
30YR FIXED JUMBO 201 132,585,715 34.4% 5.609 354 315 698 66 61
FIXED IO JUMBO 88 8,194,501 2.1% 5.090 360 194 675 67 48 2.85 7
1/1 ARMS 4 4,185,048 1.1% 4.234 360 362 702 74 72 2.88 7
1/1 ARMS JUMBO 32 7,045,659 1.8% 4.953 360 314 680 68 62 2.85 8
3/1 ARMS 13 16,052,298 4.2% 4.908 357 324 648 68 64 2.75 11
3/1 ARMS JUMBO 77 15,243,736 4.0% 4.980 360 311 669 61 56 2.79 18
5/1 ARMS 24 17,163,576 4.5% 5.069 355 323 686 69 63 2.78 26
5/1 ARMS JUMBO 13 3,288,078 0.9% 4.862 360 291 680 59 53 2.75 25
7/1 ARMS 3 5,247,189 1.4% 5.454 352 296 655 53 62 2.75 42
7/1 ARMS JUMBO 7 1,350,299 0.4% 4.920 379 303 722 55 51 2.75 58
10/1 ARMS 7 3,919,537 1.0% 5.347 360 311 735 63 59 2.75 72
TOTAL LOANS 1,521 385,432,755 100.0% 5.369 333 284 691 63 57
Morgan Keegan7 |
72.7%1.5%
0.9%
10.2%
14.8%
<NONE NOTED> CURRENTLY DELQ HIGH LTV (> 95)
LOW FICO (< 680) * PROPERTY VALUE **
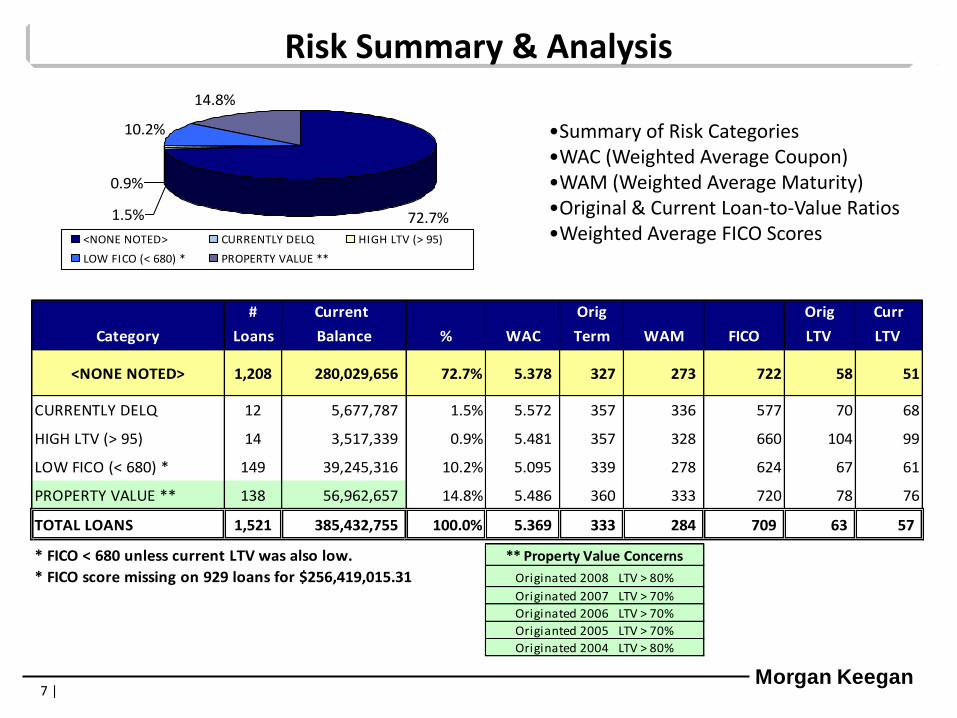
•Summary of Risk Categories•WAC (Weighted Average Coupon)•WAM (Weighted Average Maturity)•Original & Current Loan-to-Value Ratios•Weighted Average FICO Scores
Risk Summary & Analysis
# Current Orig Orig Curr
Category Loans Balance % WAC Term WAM FICO LTV LTV
<NONE NOTED> 1,208 280,029,656 72.7% 5.378 327 273 722 58 51
CURRENTLY DELQ 12 5,677,787 1.5% 5.572 357 336 577 70 68
HIGH LTV (> 95) 14 3,517,339 0.9% 5.481 357 328 660 104 99
LOW FICO (< 680) * 149 39,245,316 10.2% 5.095 339 278 624 67 61
PROPERTY VALUE ** 138 56,962,657 14.8% 5.486 360 333 720 78 76
TOTAL LOANS 1,521 385,432,755 100.0% 5.369 333 284 709 63 57
* FICO < 680 unless current LTV was also low.
* FICO score missing on 929 loans for $256,419,015.31
Origianted 2005 LTV > 70%
Originated 2007 LTV > 70%
Originated 2004 LTV > 80%
** Property Value Concerns
Originated 2008 LTV > 80%
Originated 2006 LTV > 70%
Morgan Keegan8 |
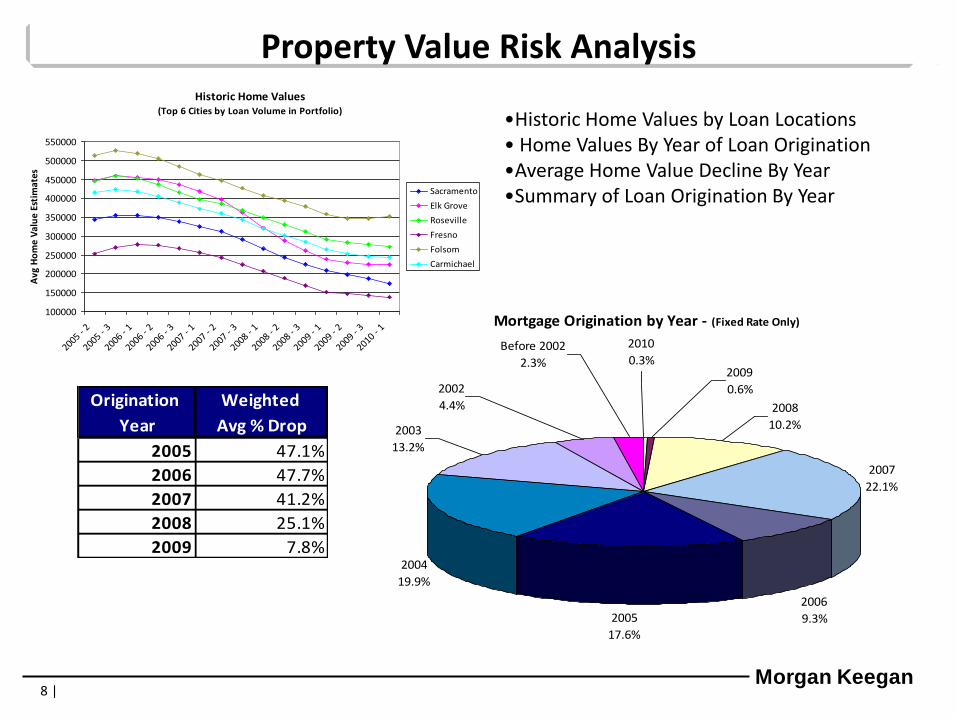
Mortgage Origination by Year - (Fixed Rate Only)
2007
22.1%
2006
9.3%2005
17.6%
2004
19.9%
2003
13.2%
Before 2002
2.3%
2010
0.3%2009
0.6%
2008
10.2%
2002
4.4%
•Historic Home Values by Loan Locations• Home Values By Year of Loan Origination•Average Home Value Decline By Year•Summary of Loan Origination By Year
Property Value Risk AnalysisHistoric Home Values
(Top 6 Cities by Loan Volume in Portfolio)
100000
150000
200000
250000
300000
350000
400000
450000
500000
550000
2005 - 2
2005 - 3
2006 - 1
2006 - 2
2006 - 3
2007 - 1
2007 - 2
2007 - 3
2008 - 1
2008 - 2
2008 - 3
2009 - 1
2009 - 2
2009 - 3
2010 - 1
Avg
Ho
me
Val
ue
Esti
mat
es
Sacramento
Elk Grove
Roseville
Fresno
Folsom
Carmichael
Origination Weighted
Year Avg % Drop
2005 47.1%
2006 47.7%
2007 41.2%
2008 25.1%
2009 7.8%

Morgan Keegan9 |
Fixed Rate
16%
84%
15 Year
30 Year
Loan Pricing Example (Fixed Rate)
• Fixed Rate Loan Summary
• Pricing by Product Type
• Gain/Loss Summary
• Servicing Valuation
Fixed Rate # Average Gross Net Cash Servicing Total
Product Type Loans Balance Balance WAC Servicing WAC WAM Price Value Value * Percent Amount
15YR FIXED 330 33,028,571 100,087 4.900 0.250 4.650 109 101.456 0.523 101.978 1.978 653,336
30YR FIXED 519 88,404,266 170,336 5.553 0.250 5.303 296 101.922 0.786 102.707 2.707 2,393,384
Total - FIXED 849 121,432,838 143,030 5.375 0.250 5.125 245 101.795 0.714 102.509 2.509 3,046,721
* Assumes loans held at PAR value. Pricing as of June 2, 2010 for Illustration Purposes Only.
Gain / (Loss) *
Morgan Keegan10 |
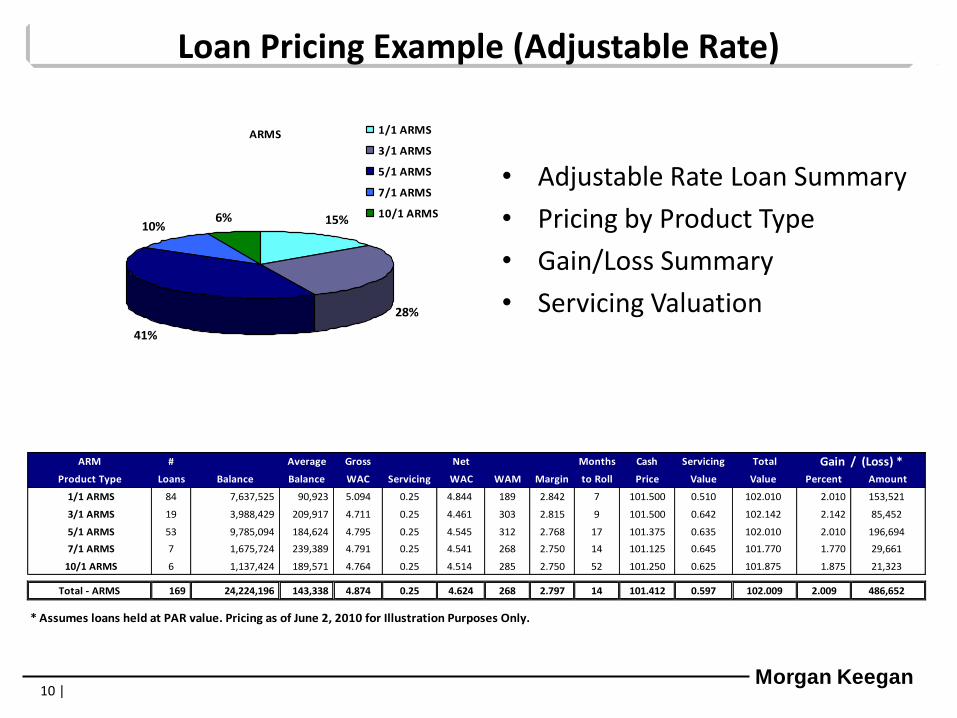
ARMS
15%
28%
41%
10%6%
1/1 ARMS
3/1 ARMS
5/1 ARMS
7/1 ARMS
10/1 ARMS
Loan Pricing Example (Adjustable Rate)
• Adjustable Rate Loan Summary
• Pricing by Product Type
• Gain/Loss Summary
• Servicing Valuation
ARM # Average Gross Net Months Cash Servicing Total
Product Type Loans Balance Balance WAC Servicing WAC WAM Margin to Roll Price Value Value Percent Amount
1/1 ARMS 84 7,637,525 90,923 5.094 0.25 4.844 189 2.842 7 101.500 0.510 102.010 2.010 153,521
3/1 ARMS 19 3,988,429 209,917 4.711 0.25 4.461 303 2.815 9 101.500 0.642 102.142 2.142 85,452
5/1 ARMS 53 9,785,094 184,624 4.795 0.25 4.545 312 2.768 17 101.375 0.635 102.010 2.010 196,694
7/1 ARMS 7 1,675,724 239,389 4.791 0.25 4.541 268 2.750 14 101.125 0.645 101.770 1.770 29,661
10/1 ARMS 6 1,137,424 189,571 4.764 0.25 4.514 285 2.750 52 101.250 0.625 101.875 1.875 21,323
Total - ARMS 169 24,224,196 143,338 4.874 0.25 4.624 268 2.797 14 101.412 0.597 102.009 2.009 486,652
* Assumes loans held at PAR value. Pricing as of June 2, 2010 for Illustration Purposes Only.
Gain / (Loss) *
Morgan Keegan11 |
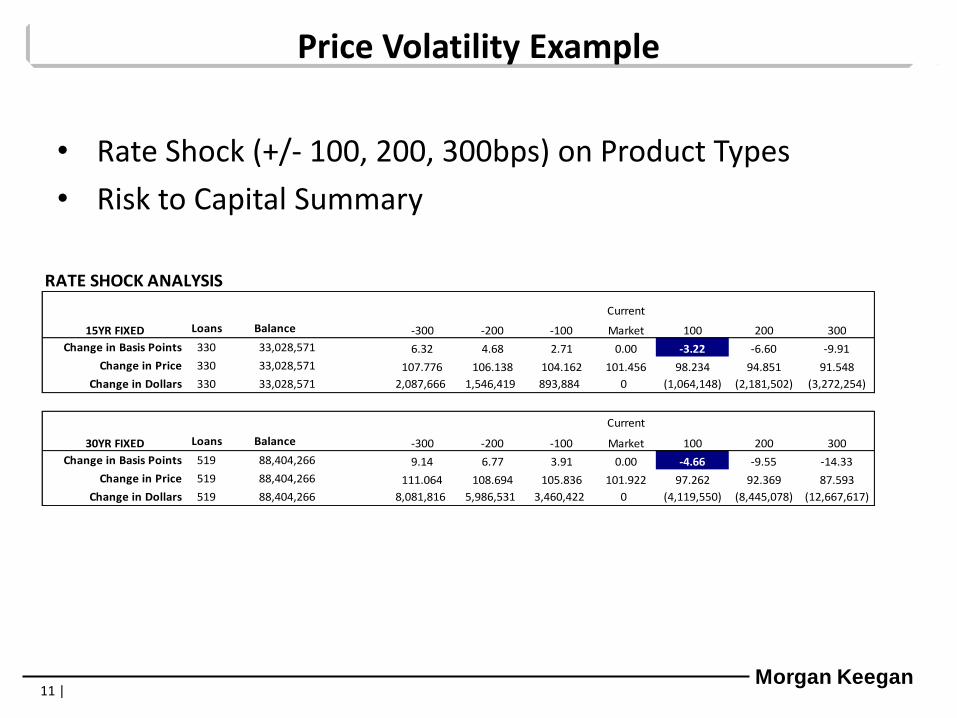
Price Volatility Example
• Rate Shock (+/- 100, 200, 300bps) on Product Types
• Risk to Capital Summary
RATE SHOCK ANALYSIS
Current
15YR FIXED Loans Balance -300 -200 -100 Market 100 200 300
Change in Basis Points 330 33,028,571 6.32 4.68 2.71 0.00 -3.22 -6.60 -9.91
Change in Price 330 33,028,571 107.776 106.138 104.162 101.456 98.234 94.851 91.548
Change in Dollars 330 33,028,571 2,087,666 1,546,419 893,884 0 (1,064,148) (2,181,502) (3,272,254)
Current
30YR FIXED Loans Balance -300 -200 -100 Market 100 200 300
Change in Basis Points 519 88,404,266 9.14 6.77 3.91 0.00 -4.66 -9.55 -14.33
Change in Price 519 88,404,266 111.064 108.694 105.836 101.922 97.262 92.369 87.593
Change in Dollars 519 88,404,266 8,081,816 5,986,531 3,460,422 0 (4,119,550) (8,445,078) (12,667,617)

Morgan Keegan12 |
WAC UPB 4,459,567 UPB 25,166,025 UPB 17,248,991 UPB 46,874,583
< 6.00% COUNT 35 COUNT 144 COUNT 80 COUNT 259
WAC 5.000% WAC 5.012% WAC 5.124% WAC 5.052%
WAM 201 WAM 283 WAM 322
WAC UPB 3,751,406 UPB 7,823,021 UPB 11,875,000 UPB 23,449,427
6.00% - 6.50% COUNT 31 COUNT 53 COUNT 49 COUNT 133
WAC 5.699% WAC 5.689% WAC 5.731% WAC 5.712%
WAM 211 WAM 282 WAM 333
WAC UPB 4,847,754 UPB 5,213,067 UPB 8,019,436 UPB 18,080,257
> 6.50% COUNT 56 COUNT 35 COUNT 36 COUNT 127
WAC 6.730% WAC 6.587% WAC 6.635% WAC 6.647%
WAM 206 WAM 267 WAM 344
UPB 13,058,727 UPB 38,202,113 UPB 37,143,427 UPB 88,404,266
TOTALS COUNT 122 COUNT 232 COUNT 165 COUNT 519
WAC 5.843% WAC 5.366% WAC 5.644% WAC 5.553%
WAM 206 WAM 281 WAM 330 WAM 290
TOTALSSHORT WAM MOD WAM LONG WAM
HIGHEST RISK LOW WAC
MOD WAC
HIGH WACLOWEST RISK
WAM < 240 WAM 240 - 300 WAM > 300 TOTALS
Interest Rate Segmentation Example
• Sorts Coupon and Term
• Segments Interest Rate Risk• Example: 30 Year Fixed Rate

Morgan Keegan13 |
0
2,000,000
4,000,000
6,000,000
8,000,000
10,000,000
12,000,000
14,000,000
16,000,000
18,000,000
20,000,000
22,000,000
2010 2011 2012 2013 2014 2015 2017 2018
Roll Schedule - Balance
Adjustable Rate Roll Strategy
•Roll Balance by Year•WAC (Weighted Average Coupon)
by Year
4.250
4.500
4.750
5.000
5.250
5.500
5.750
6.000
2010 2011 2012 2013 2014 2015 2017 2018
Roll Schedule - Coupon

Morgan Keegan14 |
Adjustable Rate Roll Strategy
•Roll Schedule by Year•Roll Balance •WAC (Weighted Average Coupon) •Weighted Average Margin•Weighted Average Months to Roll
ARM # Average Gross Net Months Cash Servicing Total
Product Type Loans Balance Balance WAC Servicing WAC WAM Margin to Roll Price Value Value Percent Amount
1/1 ARMS 69 6,084,773 88,185 5.083 0.25 4.833 195 2.87 8 101.625 0.486 102.111 2.111 128,466
3/1 ARMS 15 3,161,918 210,795 4.748 0.25 4.498 299 2.80 8 101.250 0.660 101.910 1.910 60,401
5/1 ARMS 39 6,457,854 165,586 4.533 0.25 4.283 294 2.78 7 101.000 0.650 101.650 1.650 106,573
Total - ARMS 123 15,704,544 127,679 4.789 0.25 4.539 256 2.82 8 101.292 0.589 101.881 1.881 295,440
* Assumes loans held at PAR value. Pricing as of June 2, 2010 for Illustration Purposes Only.
Gain / (Loss) *
Year # Loans Balance Avg Balance WAC Margin Months
to Roll
% of
ARMS
2010 134 23,697,849 176,850 4.821 2.805 7 47.16%
2011 36 12,165,483 337,930 5.056 2.765 14 24.21%
2012 5 2,275,948 455,190 5.369 2.750 29 4.53%
2013 10 3,718,358 371,836 5.889 2.813 44 7.40%
2014 11 7,328,061 666,187 5.403 2.750 53 14.58%
2015 1 308,469 308,469 4.500 2.750 64 0.61%
2017 1 268,828 268,828 5.375 2.750 2 0.53%
2018 1 487,239 487,239 5.375 2.750 98 0.97%

Morgan Keegan15 |
Servicing Valuation Example
• Summary by Loan Product
• Values Servicing as Dollars, Percent, and Multiple
• Allows Input Assumptions
PRODUCT UPB LOANS AVG BAL WAC SER FEE WAOM WARM DEL ESC % CPR DISC LATE SER COST DOLLARS * PERCENT SFM
1 15YR FIXED 33,028,571 330 100,087 4.90% 0.250% 180 109 0.00% 0.00% 13.10% 12.00% 29.12 50.00 172,595 0.5226% 2.09
2 30YR FIXED 88,404,266 519 170,336 5.55% 0.250% 358 290 0.00% 0.00% 13.80% 12.00% 27.22 50.00 694,443 0.7855% 3.14
3 1/1 ARMS 7,637,525 84 90,923 5.09% 0.250% 361 190 0.00% 0.00% 20.00% 12.00% 14.71 50.00 38,958 0.5101% 2.04
4 3/1 ARMS 3,988,429 19 209,917 4.71% 0.250% 360 294 0.00% 0.00% 20.00% 12.00% 30.72 50.00 25,625 0.6425% 2.57
5 5/1 ARMS 9,785,094 53 184,624 4.80% 0.250% 360 306 0.00% 0.00% 20.00% 12.00% 27.85 50.00 62,149 0.6351% 2.54
6 7/1 ARMS 1,675,724 7 239,389 4.79% 0.250% 360 257 0.00% 0.00% 20.00% 12.00% 36.34 50.00 10,809 0.6451% 2.58
7 10/1 ARMS 1,137,424 6 189,571 4.76% 0.250% 360 283 0.00% 0.00% 20.00% 12.00% 27.23 50.00 7,106 0.6247% 2.50
145,657,033 1,018 153,231 5.29% 0.250% 318 245 0.00% 0.00% 14.67% 12.00% 27.24 50.00 1,011,686 0.6946% 2.78
PRESENT VALUE OF CASH FLOW
Weighted Average Service Fee Projected loan prepayment percent per year Yield Required
Servicing cost per loan per year
Weighted Average Interest Rate
Weighted Average Original Term
Weighted Average Remaining Term
Average escrow balance as a percentage of current
Late charge collected per loan
Present value of cashflow in dollars, yield of 12.00%
Present value dollars divided by total current
Service Fee Multiplier ( .6946% divided by weighted
Average Service Fee)

Morgan Keegan16 |
How to Have Your Portfolio Analyzed
Residential & Consumer Loan GroupFixed Income Capital Markets

Morgan Keegan17 |
Data Requirements for Portfolio AnalysisFor FIXED RATE mortgages please include the following:
-Loan number-Original loan amount-Current loan balance-Interest rate-Original term-Monthly P & I and Monthly Escrow Payment-Loan Date, First Payment, and Maturity Dates-Original LTV ratio and appraised value-FICO score (if available)-Occupancy type (owner, second, investor)-Purpose (Purchase, Refi-cash out, Refi-no cash, etc.)-Property type (1 to 4 family, multi-family, commercial, condo, etc.)-Mortgage type (Conv, FHA, VA, etc.)-State-Next due date, 12 month payhistory (Times 30, 60, 90 Last 12 Months)
(Times 30, 60, 90 life counters are acceptable)
In addition for ARMS please include the following:-Index (CMT, COFI, LIBOR, etc.)-Margin-Period and Life Caps -Floor and Ceiling-Convertible (Yes or No)-Adjustment Interval (12 months, 3 year, etc.)-First and Next rate adjustment dates

Morgan Keegan18 |
Analysis Timeline
• Receive an Excel Spreadsheet to populate with loan data
• Once a file is received:
– Data is scrubbed for accuracy
– Work with IT to clarify questions
– Process loan data
• 2-3 business days to complete
• Schedule a call to discuss the results
• You receive the analysis in a PDF format

Morgan Keegan19 |
Transaction Timeline
Week 6Week 1 Week 2
Loan Data /
Analysis
LTV Valuation
Week 4
Aggregate Data
Insurer Approval
Week 3
Morgan Keegan
Underwrite
Week 5
Collateral
Delivery
Legal Documents
Funding & Closing
Price Locked