Embed Size (px)
DESCRIPTION
iocc
Citation preview

PRESENTATION ON MACROS & PIVOT TABLE
Submitted in partial fulfilment of Information Technology Training
Rajat Gupta NRO0275616

INTRODUCTION ABOUT M.S. EXCEL
Microsoft Excel is a spreadsheet application developed by Microsoft for Microsoft Windows and Mac OS X.
It is a powerful tool to create and format spreadsheets and to analyze and share information to make more informed decisions.
It has been a very widely applied spreadsheet for these platforms, especially since version 5 in 1993, and it has replaced Lotus 1-2-3 as the industry standard for spreadsheets.
Excel forms part of Microsoft Office.

It features calculation, graphing tools, pivot tables, and a macro programming language called Visual Basic for Applications.
Microsoft Excel has the basic features of all spreadsheets. Using a grid of cells arranged in numbered rows and letter-named columns to organize data manipulations like arithmetic operations.
It has a battery of supplied functions to answer statistical, engineering and financial needs.
It allows sectioning of data to view its dependencies on various factors for different perspectives (using pivot tables and the scenario manager)

It has a programming aspect, Visual Basic for Applications, allowing the user to employ a wide variety of numerical methods.
Excel is all about numbers There’s almost no limit to what you can do with numbers in Excel, including sorting, advanced calculations, and graphing.
In addition, Excel’s formatting options mean that whatever you do with your numbers, the result will always look professional.
Data files created with Excel are called workbooks, Excel files by default contain three blank worksheets.
More worksheets can be added, and others deleted, as required.

TYPICAL SPREADSHEET SHOWING DIFFERENT AREAS

INTRODUCTION TO MACROS
What is a Macro?• A macro is a way to automate a task that is to be performed repeatedly or on a regular basis. It is a series of commands or actions that can be stored or run whenever we need to perform a task. We cam record or build a macro, and then play the macro to automatically repeat the series of commands or actions.
Are macros a type of programming?
• Macros are programming, but you do not need to be a developer or even have programming knowledge to use them. Most macros you can create in the Office programs are written in a language called Microsoft Visual Basic for Applications, usually referred to as VBA.•A macro can be simple and consist of only a few commands, or be quite complex.

When and why should you use macros?
• Macros save time and expand the capabilities of the programs you use every day.•They can be used to automate repetitive document production tasks, streamline cumbersome tasks, or create solutions such as automating the creation of documents that you and your colleagues use regularly.
Where are macros saved?
• Macros can be saved with the workbook in which they where created, or they can be saved in a separate personal macro workbook where they are more accessible.•For macros stored in personal macro workbook, excel creates a hidden personal macro workbook, if it doesn’t automatically exists, and saves the macro in this workbook. Macros saved in personal macro workbooks can be used later on in other workbooks also.

How to record a macro?• Macros can be saved with the workbook in which they where created, or they can be saved in a separate personal macro workbook where they are more accessible.•For macros stored in personal macro workbook, excel creates a hidden personal macro workbook, if it doesn’t automatically exists, and saves the macro in this workbook. Macros saved in personal macro workbooks can be used later on in other workbooks also.

STEPS TO RECORD A MACRO
Verify that Excel preferences allows the run of macros. This setting is in the "Security" section, in most versions of Excel.
Open the workbook that contains or will contain the macro.
Step 1
•On the Developer Tab, in the Code group, click Record Macro. The Record Macro dialog box appears.
Step 2
•In the Macro Name box, enter a name for the macro.
Step 3
•To assign a CTRL key combination shortcut key to run the macro, in the Shortcut key box, type any letter that you want to use.

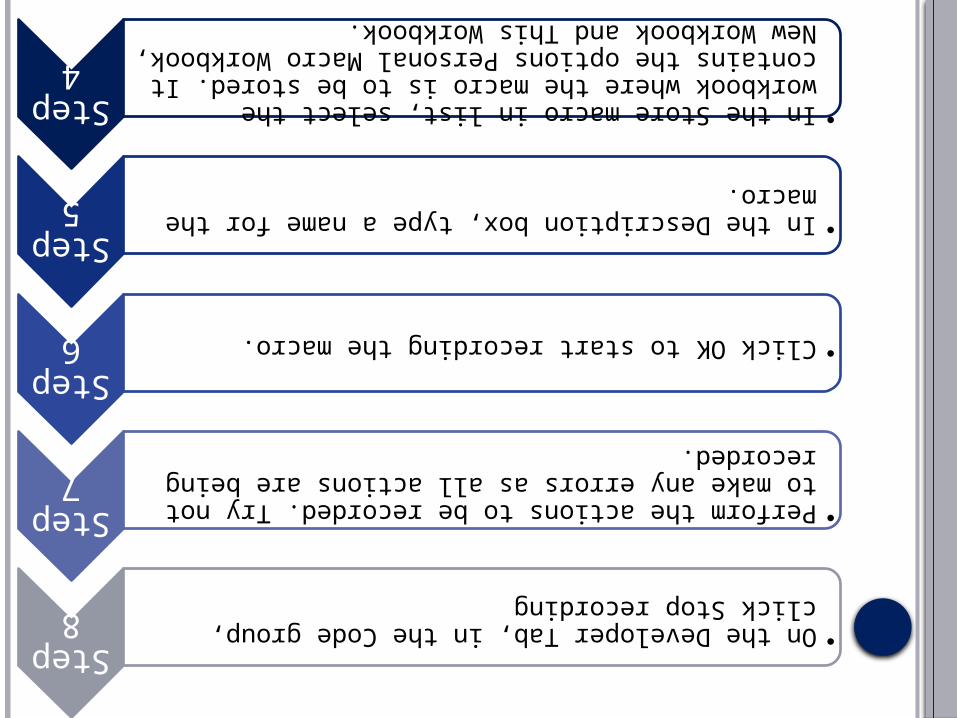
Step 4
•In the Store macro in list, select the workbook where the macro is to be stored. It contains the options Personal Macro Workbook, New Workbook and This Workbook.
Step 5
•In the Description box, type a name for the macro.
Step 6
•Click OK to start recording the macro.
Step 7
•Perform the actions to be recorded. Try not to make any errors as all actions are being recorded.
Step 8
•On the Developer Tab, in the Code group, click Stop recording


RUNNING A MACRO
Step 1
•On the Developer Tab, in the Code Group, click Macro. The macro dialog box appears.
Step 2
•Select the required macro.
Step 3
•Click Run.


INTRODUCTION TO PIVOTTABLE
Pivot tables are powerful tools for data analysis. A PivotTable report is useful to summarize, analyze, explore, and present summary data.
The graphical equivalent of a pivot table, PivotChart report can help user visualize PivotTable report summary data so that the user can easily see comparisons, patterns, and trends.

A PivotTable is specially designed for:
Querying large amounts of data in many user-friendly ways.
• Subtotalling and aggregating numeric data, summarizing data by categories and subcategories, and creating custom calculations and formulas.
Expanding and collapsing levels of data to focus your results, and drilling down to details from the summary data for areas that are of interest to you.
• Moving rows to columns and column to rows to see different summaries of the source data.
Filtering, sorting, grouping and conditionally formatting the most useful and interesting subset of data to enable you to focus on the information that you want.
• Presenting concise, attractive, and annotated online or printed reports.

CREATING A PIVOTTABLE FROM WORKSHEET DATA
Step1
Select any cell in the database. Make sure that the database has column headings.
On the Insert Tab in the Tables group, click PivotTable. The following dialog box appears:
Step2

Step3
Under Choose the data that you want to analyze, make sure that Select a table or Range is selected, & then in the Table/Range box, verify the range of cells that the user wants to use as the underlying data.
For data in another worksheet, include the workbook and sheet name.
Step4
Under Choose where you want the PivotTable report to be placed, specify the location.
Step5 Click OK

EXPLANATION OF A PIVOT TABLE For typical data entry and storage, data usually appear
in flat tables, meaning that it consists of only columns and rows, as in the following example showing data on shirt types:

While tables such as these can contain a lot of data, it can be difficult to get summarized information from them. A pivot table can help quickly summarize the data and highlight the desired information.
In the example here, let us ask, "How many Units did we sell in each Region for every Ship Date?"
A pivot table usually consists of row, column and data (or fact) fields. In this case, the column is Ship Date, the row is Region and the datum we would like to see is (sum of) Units. These fields allow several kinds of aggregations including: sum, average, standard deviation, count etc. In this case, the total number of units shipped is displayed here using a sum aggregation.