Embed Size (px)
Citation preview

July 2021
MORITO CO.,LTD
1st section of TSE : 9837
Presentation Materials
for the Second Quarter of Fiscal Year Ended
November 30, 2021 Financial Results

1
1. FY2021.11 2Q Financial Results
2. FY2021.11 2Q Business Overview
3. Business Topics
4. Shareholder Returns
2
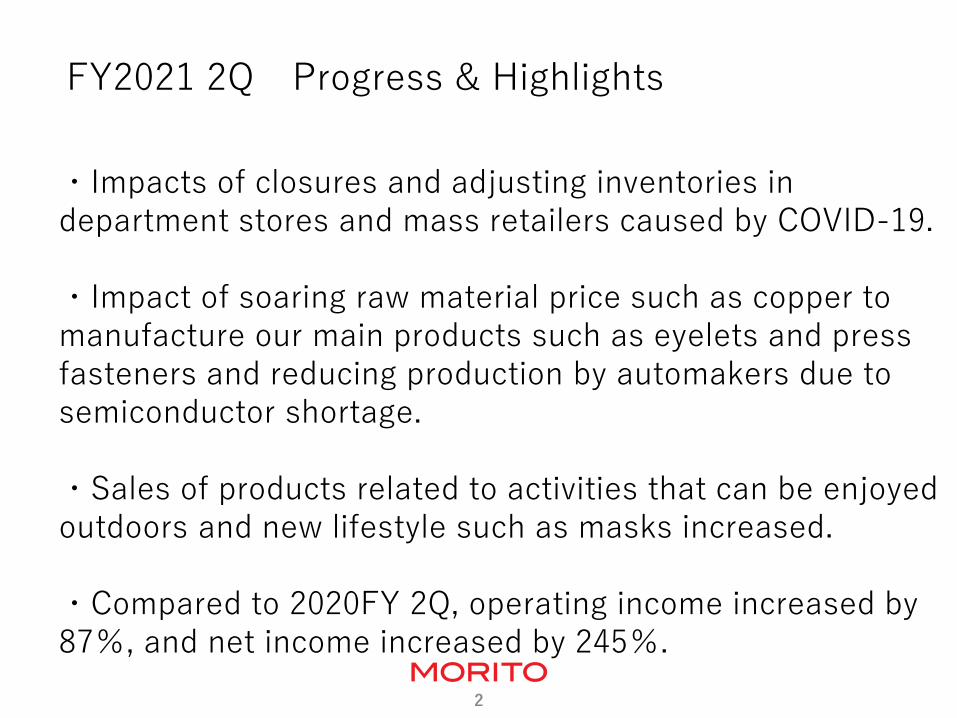
FY2021 2Q Progress & Highlights
・Impacts of closures and adjusting inventories in department stores and mass retailers caused by COVID-19. ・Impact of soaring raw material price such as copper to manufacture our main products such as eyelets and press fasteners and reducing production by automakers due to semiconductor shortage. ・Sales of products related to activities that can be enjoyed outdoors and new lifestyle such as masks increased. ・Compared to 2020FY 2Q, operating income increased by 87%, and net income increased by 245%.
3
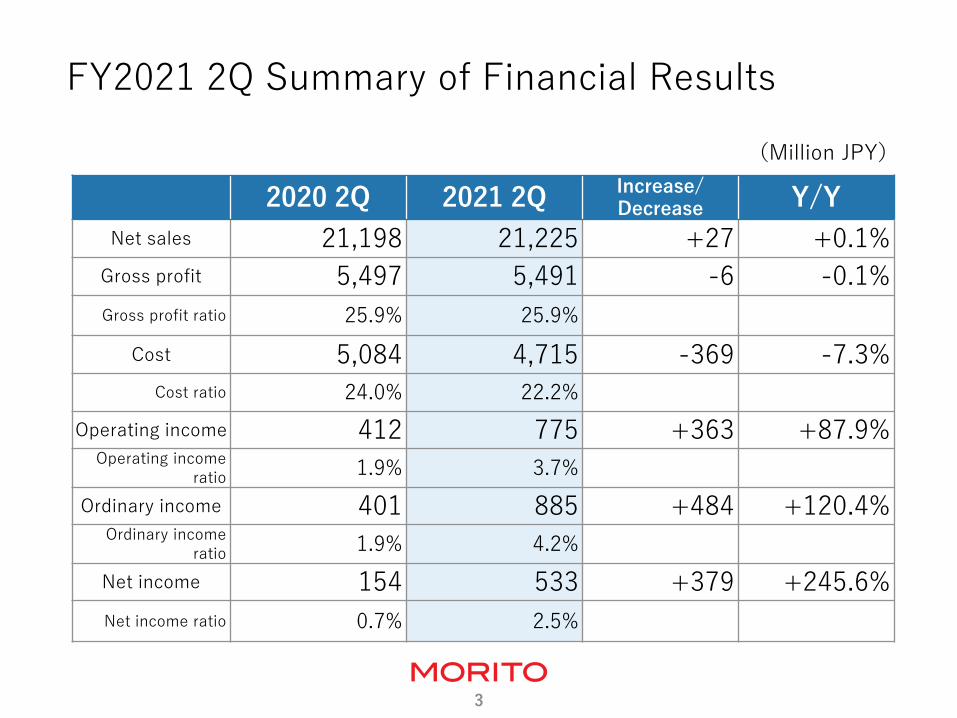
FY2021 2Q Summary of Financial Results
(Million JPY)
2020 2Q 2021 2Q Increase/ Decrease Y/Y
Net sales 21,198 21,225 +27 +0.1%
Gross profit 5,497 5,491 -6 -0.1%
Gross profit ratio 25.9% 25.9%
Cost 5,084 4,715 -369 -7.3%
Cost ratio 24.0% 22.2%
Operating income 412 775 +363 +87.9% Operating income
ratio 1.9% 3.7%
Ordinary income 401 885 +484 +120.4% Ordinary income
ratio 1.9% 4.2%
Net income 154 533 +379 +245.6%
Net income ratio 0.7% 2.5%
4
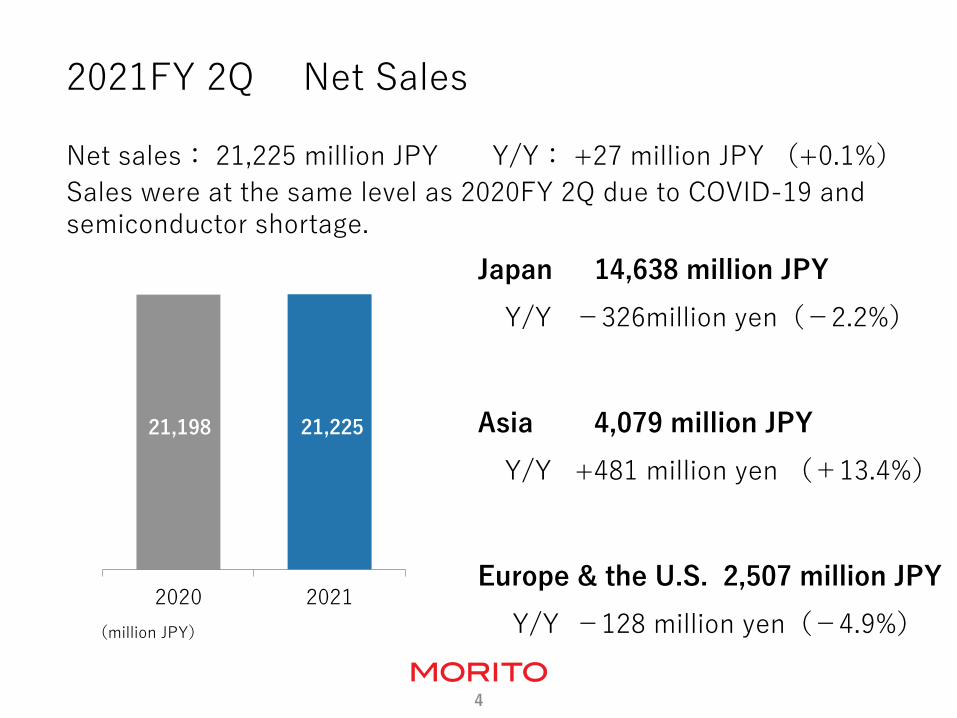
2021FY 2Q Net Sales
(million JPY)
Net sales: 21,225 million JPY Y/Y: +27 million JPY (+0.1%)
Sales were at the same level as 2020FY 2Q due to COVID-19 and semiconductor shortage.
Japan 14,638 million JPY
Y/Y −326million yen(−2.2%)
Asia 4,079 million JPY
Y/Y +481 million yen (+13.4%)
Europe & the U.S. 2,507 million JPY
Y/Y −128 million yen(−4.9%)
21,198 21,225
2020 2021
5
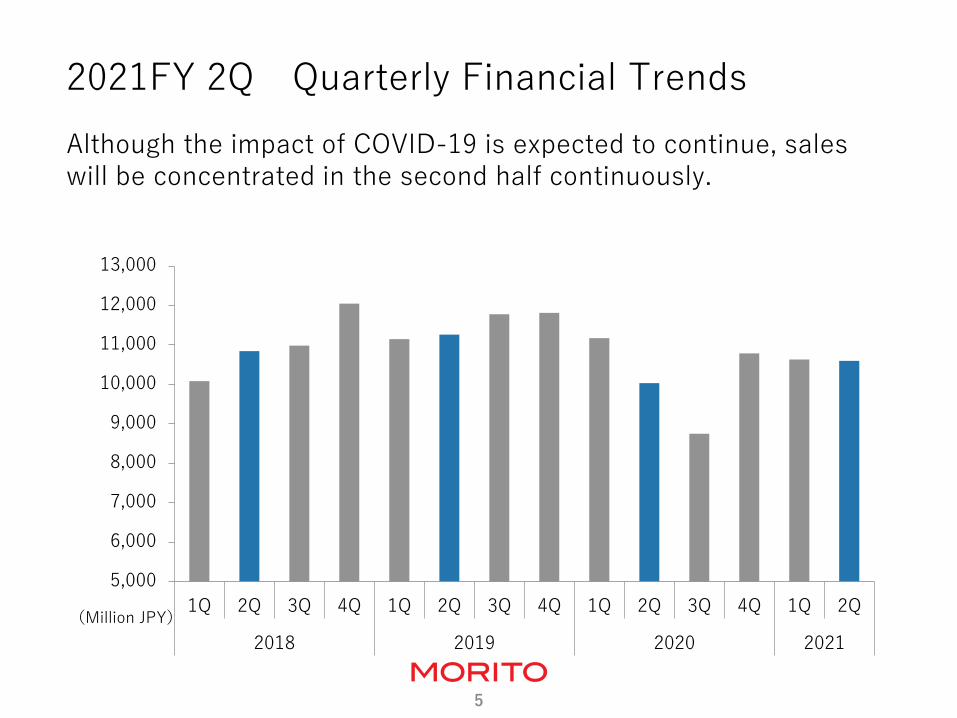
2021FY 2Q Quarterly Financial Trends
(Million JPY)
5,000
6,000
7,000
8,000
9,000
10,000
11,000
12,000
13,000
1Q 2Q 3Q 4Q 1Q 2Q 3Q 4Q 1Q 2Q 3Q 4Q 1Q 2Q
2018 2019 2020 2021
Although the impact of COVID-19 is expected to continue, sales will be concentrated in the second half continuously.
6
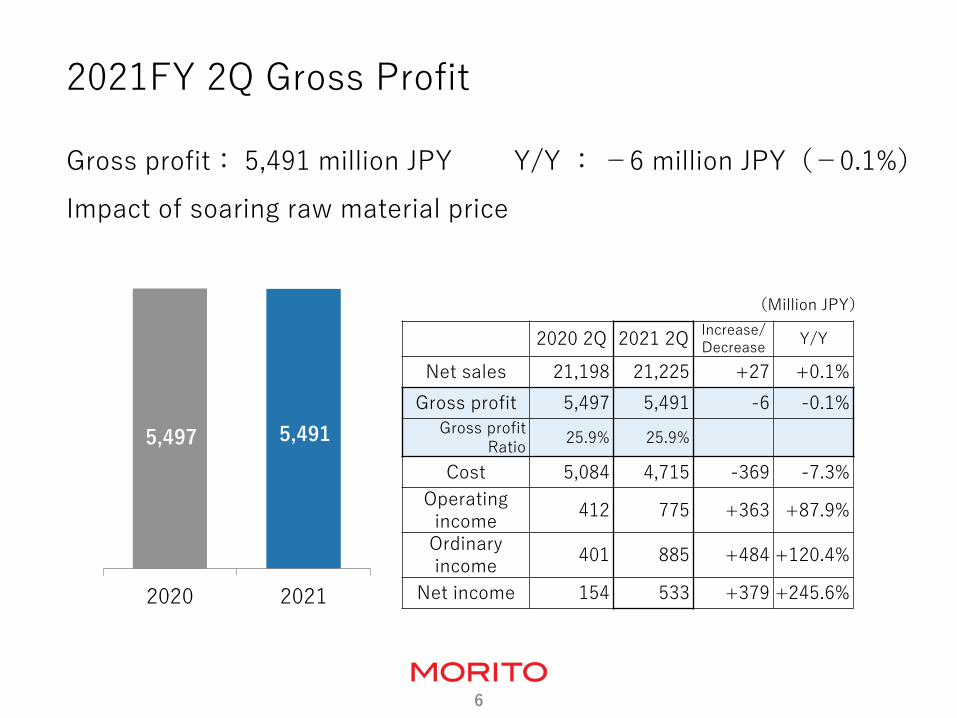
2021FY 2Q Gross Profit
(Million JPY)
Gross profit: 5,491 million JPY Y/Y : −6 million JPY(−0.1%)
Impact of soaring raw material price
2020 2Q 2021 2Q Increase/ Decrease
Y/Y
Net sales 21,198 21,225 +27 +0.1%
Gross profit 5,497 5,491 -6 -0.1%
Gross profit Ratio
25.9% 25.9%
Cost 5,084 4,715 -369 -7.3%
Operating income
412 775 +363 +87.9%
Ordinary income
401 885 +484 +120.4%
Net income 154 533 +379 +245.6%
5,497 5,491
2020 2021
7
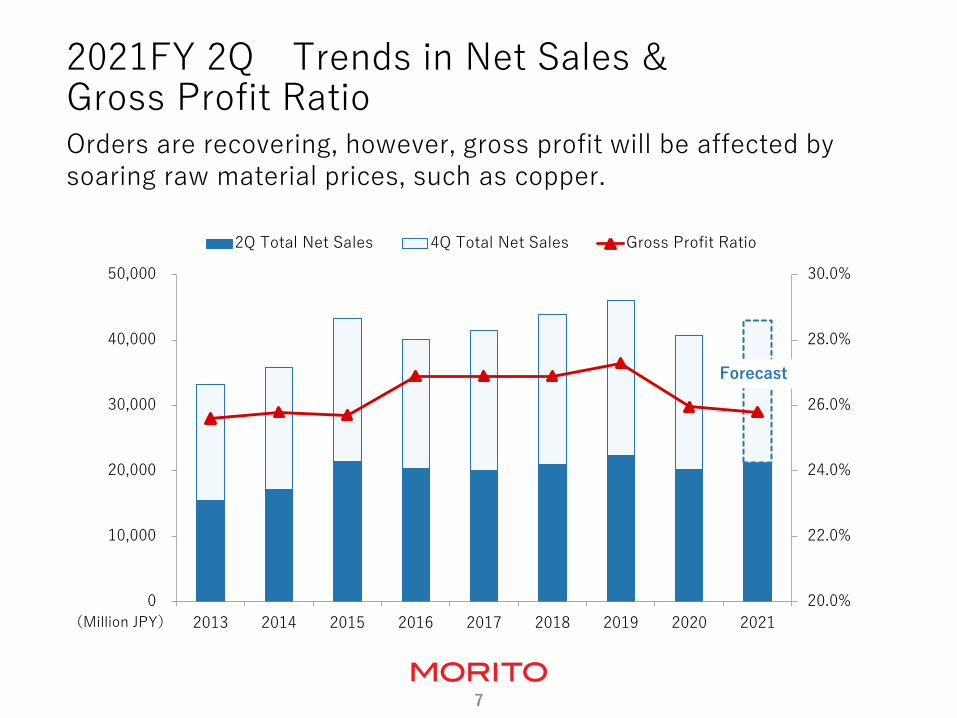
2021FY 2Q Trends in Net Sales & Gross Profit Ratio Orders are recovering, however, gross profit will be affected by soaring raw material prices, such as copper.
(Million JPY)
20.0%
22.0%
24.0%
26.0%
28.0%
30.0%
0
10,000
20,000
30,000
40,000
50,000
2013 2014 2015 2016 2017 2018 2019 2020 2021
2Q Total Net Sales 4Q Total Net Sales Gross Profit Ratio
Forecast
8
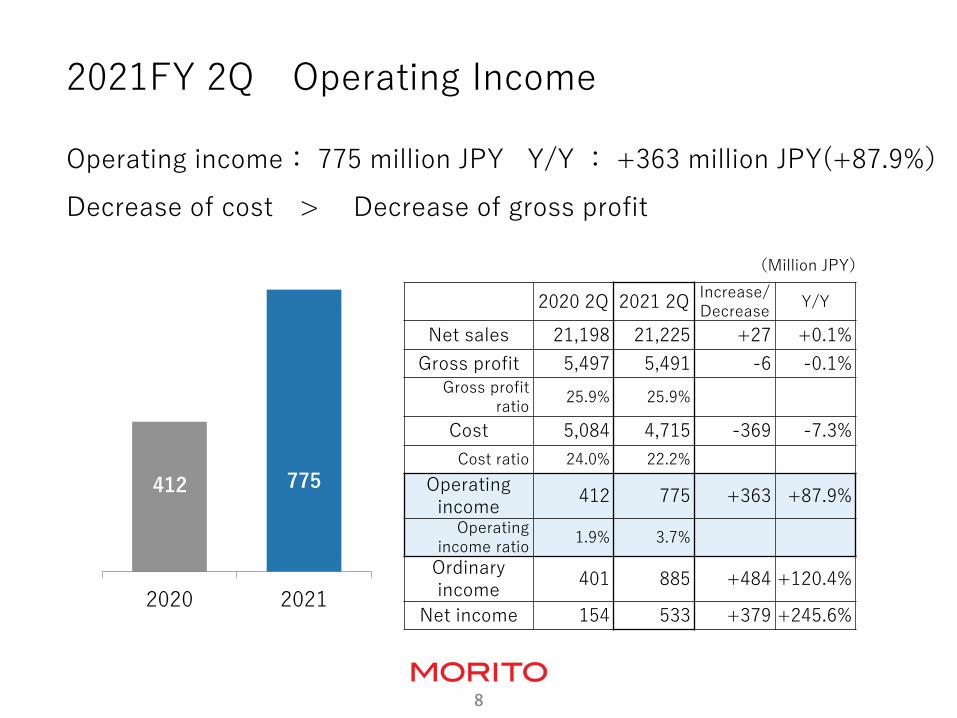
2021FY 2Q Operating Income
Operating income: 775 million JPY Y/Y : +363 million JPY(+87.9%)
Decrease of cost > Decrease of gross profit
2020 2Q 2021 2Q Increase/ Decrease
Y/Y
Net sales 21,198 21,225 +27 +0.1%
Gross profit 5,497 5,491 -6 -0.1% Gross profit
ratio 25.9% 25.9%
Cost 5,084 4,715 -369 -7.3%
Cost ratio 24.0% 22.2%
Operating income
412 775 +363 +87.9%
Operating income ratio
1.9% 3.7%
Ordinary income
401 885 +484 +120.4%
Net income 154 533 +379 +245.6%
(Million JPY)
412 775
2020 2021
9
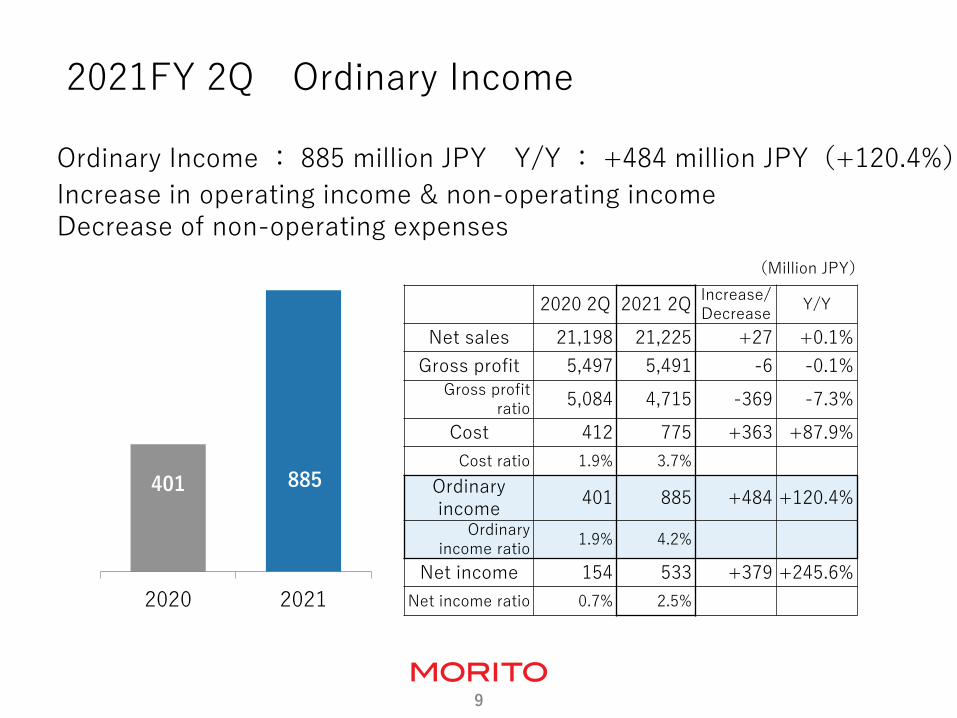
2021FY 2Q Ordinary Income
(Million JPY)
Ordinary Income : 885 million JPY Y/Y : +484 million JPY(+120.4%)
Increase in operating income & non-operating income Decrease of non-operating expenses
2020 2Q 2021 2Q Increase/ Decrease
Y/Y
Net sales 21,198 21,225 +27 +0.1%
Gross profit 5,497 5,491 -6 -0.1% Gross profit
ratio 5,084 4,715 -369 -7.3%
Cost 412 775 +363 +87.9%
Cost ratio 1.9% 3.7%
Ordinary income
401 885 +484 +120.4%
Ordinary income ratio
1.9% 4.2%
Net income 154 533 +379 +245.6%
Net income ratio 0.7% 2.5%
401 885
2020 2021
10
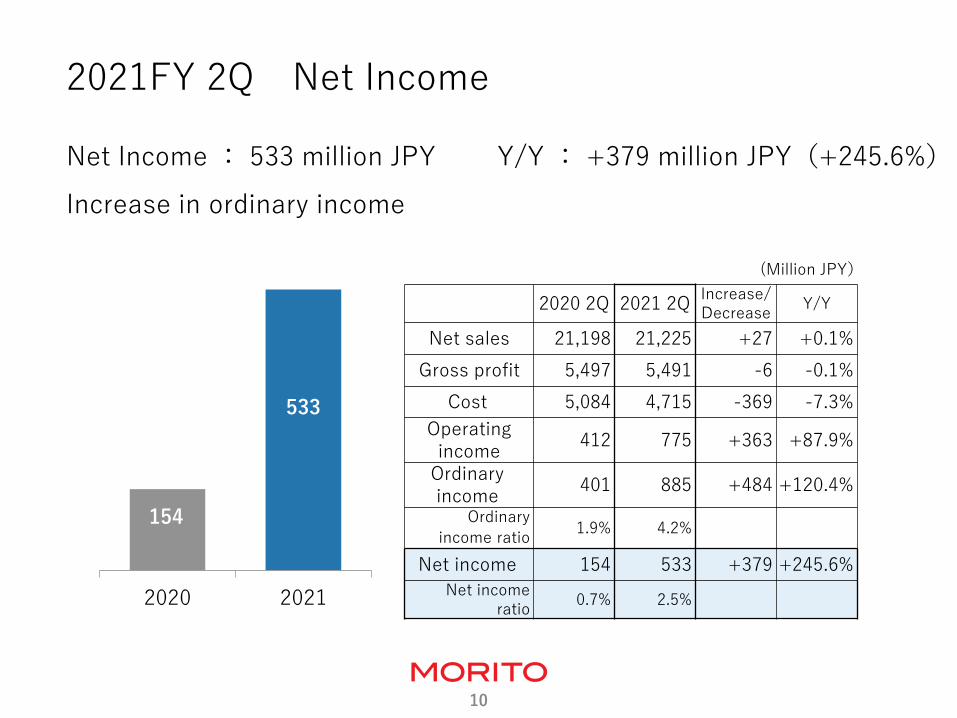
2021FY 2Q Net Income
(Million JPY)
Net Income : 533 million JPY Y/Y : +379 million JPY(+245.6%)
Increase in ordinary income
2020 2Q 2021 2Q Increase/ Decrease
Y/Y
Net sales 21,198 21,225 +27 +0.1%
Gross profit 5,497 5,491 -6 -0.1%
Cost 5,084 4,715 -369 -7.3%
Operating income
412 775 +363 +87.9%
Ordinary income
401 885 +484 +120.4%
Ordinary
income ratio 1.9% 4.2%
Net income 154 533 +379 +245.6%
Net income ratio
0.7% 2.5%
154
533
2020 2021
11
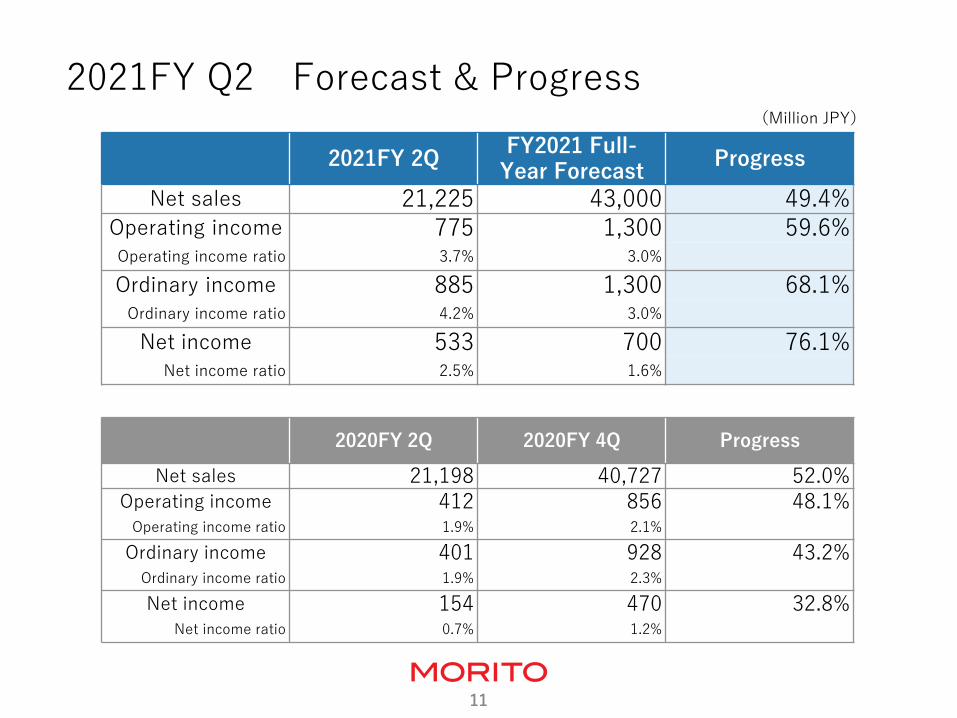
2021FY Q2 Forecast & Progress
2021FY 2Q FY2021 Full-
Year Forecast Progress
Net sales 21,225 43,000 49.4% Operating income 775 1,300 59.6% Operating income ratio 3.7% 3.0%
Ordinary income 885 1,300 68.1% Ordinary income ratio 4.2% 3.0%
Net income 533 700 76.1% Net income ratio 2.5% 1.6%
2020FY 2Q 2020FY 4Q Progress
Net sales 21,198 40,727 52.0% Operating income 412 856 48.1%
Operating income ratio 1.9% 2.1% Ordinary income 401 928 43.2%
Ordinary income ratio 1.9% 2.3% Net income 154 470 32.8%
Net income ratio 0.7% 1.2%
(Million JPY)
12
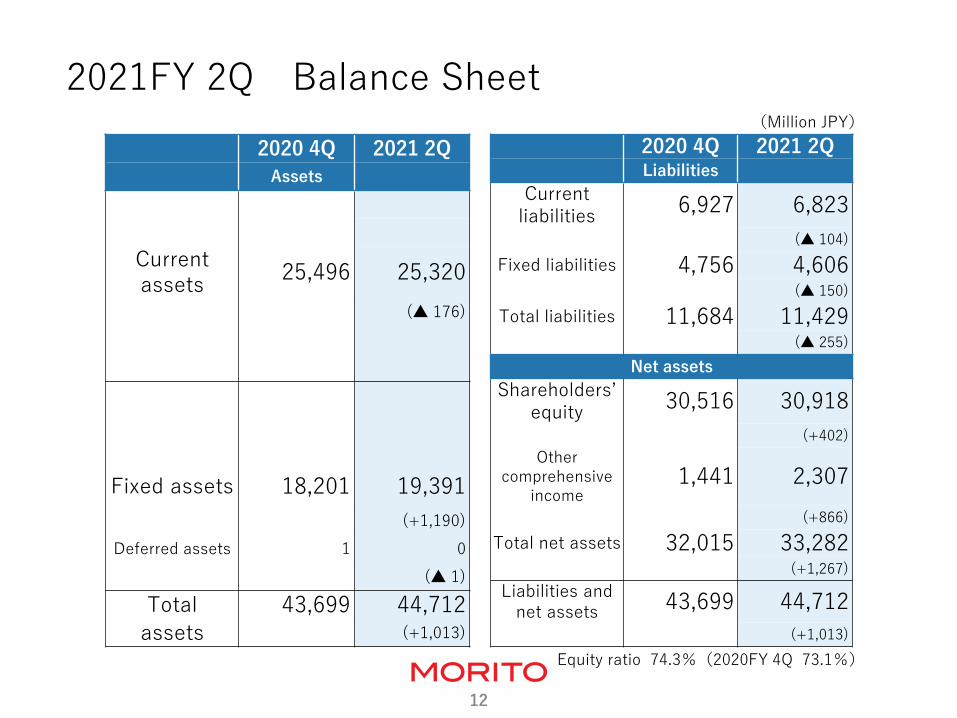
2021FY 2Q Balance Sheet (Million JPY)
Equity ratio 74.3%(2020FY 4Q 73.1%)
2020 4Q 2021 2Q Liabilities
Current liabilities
6,927 6,823
(▲ 104)
Fixed liabilities 4,756 4,606 (▲ 150)
Total liabilities 11,684 11,429 (▲ 255)
Net assets
Shareholders’ equity
30,516 30,918
(+402)
Other comprehensive
income 1,441 2,307
(+866)
Total net assets 32,015 33,282 (+1,267)
Liabilities and net assets 43,699 44,712
(+1,013)
2020 4Q 2021 2Q
Assets
Current assets
25,496 25,320
(▲ 176)
Fixed assets 18,201 19,391
(+1,190)
Deferred assets 1 0
(▲ 1)
Total 43,699 44,712 assets (+1,013)
13
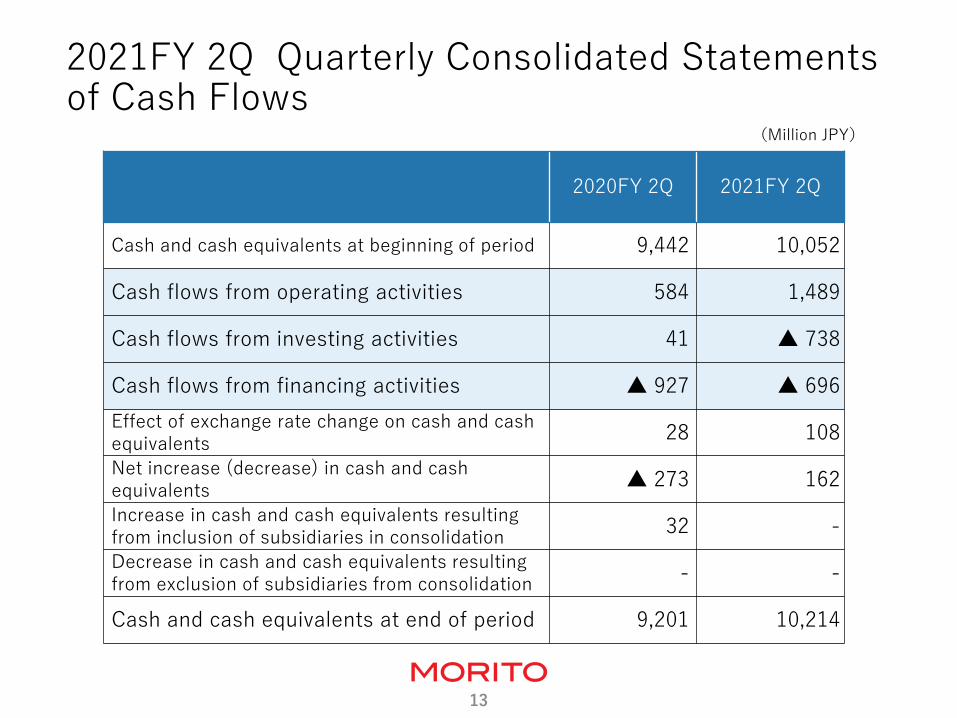
2021FY 2Q Quarterly Consolidated Statements of Cash Flows
2020FY 2Q 2021FY 2Q
Cash and cash equivalents at beginning of period 9,442 10,052
Cash flows from operating activities 584 1,489
Cash flows from investing activities 41 ▲ 738
Cash flows from financing activities ▲ 927 ▲ 696
Effect of exchange rate change on cash and cash equivalents
28 108
Net increase (decrease) in cash and cash equivalents
▲ 273 162
Increase in cash and cash equivalents resulting from inclusion of subsidiaries in consolidation
32 -
Decrease in cash and cash equivalents resulting from exclusion of subsidiaries from consolidation
- -
Cash and cash equivalents at end of period 9,201 10,214
(Million JPY)

14
1. FY2021.11 2Q Financial Results
2. FY2021.11 2Q Business Overview
3. Business Topics
4. Shareholder Returns
15
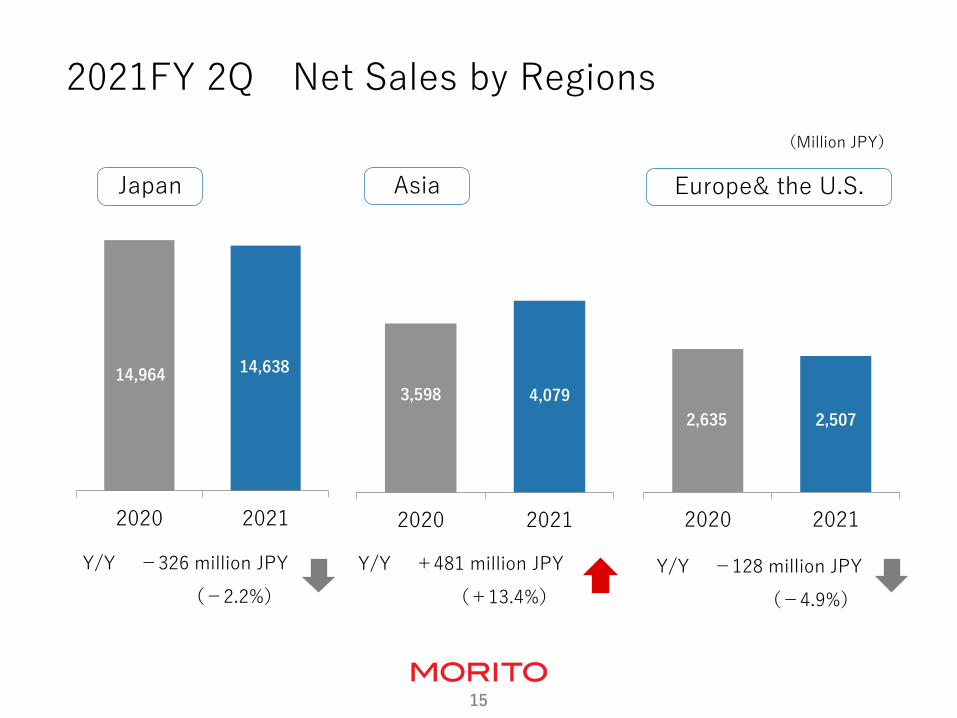
2021FY 2Q Net Sales by Regions
(Million JPY)
Japan Asia
Europe& the U.S.
Y/Y −128 million JPY
(−4.9%)
Y/Y +481 million JPY
(+13.4%)
Y/Y −326 million JPY
(−2.2%)
14,964 14,638
2020 2021
3,598 4,079
2020 2021
2,635 2,507
2020 2021
16
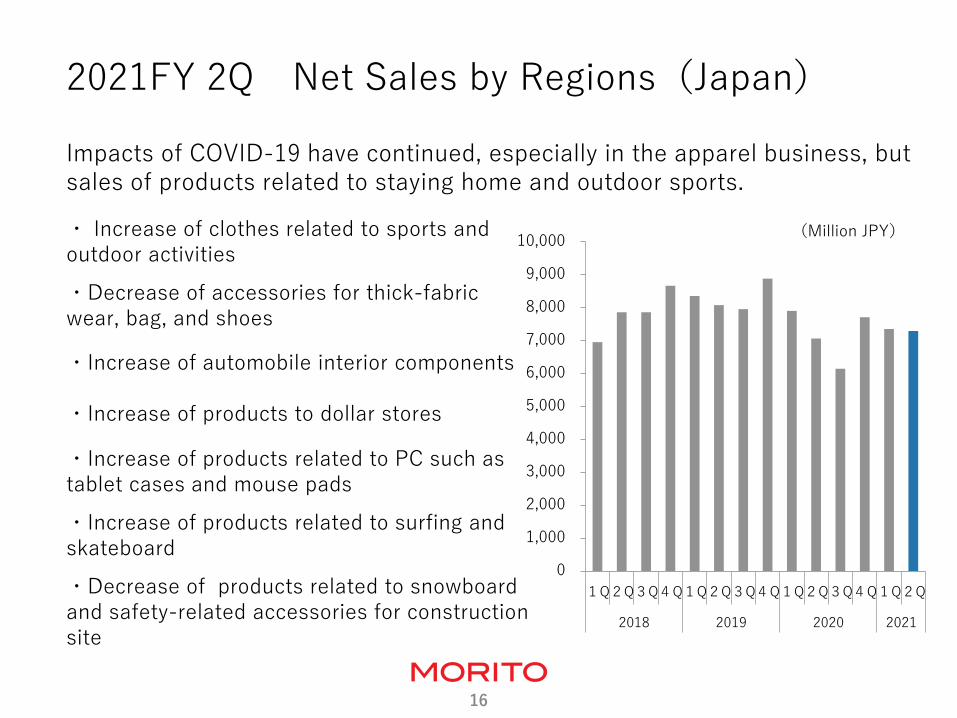
2021FY 2Q Net Sales by Regions(Japan)
・ Increase of clothes related to sports and outdoor activities
・Decrease of accessories for thick-fabric wear, bag, and shoes
・Increase of automobile interior components
・Increase of products to dollar stores
・Increase of products related to PC such as tablet cases and mouse pads
・Increase of products related to surfing and skateboard
・Decrease of products related to snowboard and safety-related accessories for construction site
Impacts of COVID-19 have continued, especially in the apparel business, but sales of products related to staying home and outdoor sports.
(Million JPY)
0
1,000
2,000
3,000
4,000
5,000
6,000
7,000
8,000
9,000
10,000
1Q 2Q 3Q 4Q 1Q 2Q 3Q 4Q 1Q 2Q 3Q 4Q 1Q 2Q
2018 2019 2020 2021
17
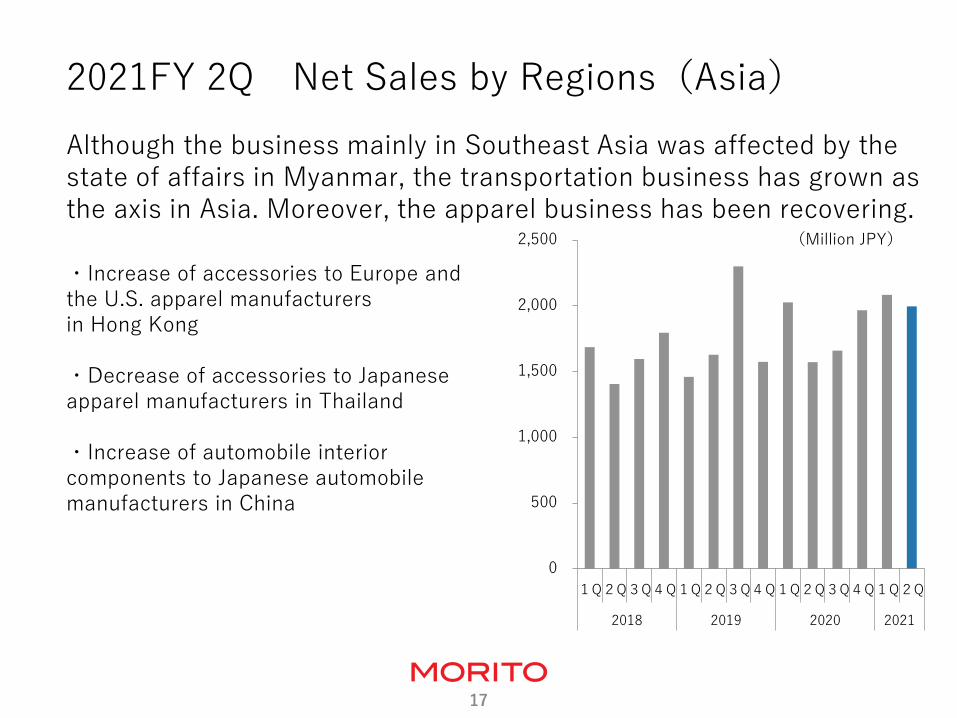
2021FY 2Q Net Sales by Regions(Asia)
・Increase of accessories to Europe and the U.S. apparel manufacturers in Hong Kong ・Decrease of accessories to Japanese apparel manufacturers in Thailand ・Increase of automobile interior components to Japanese automobile manufacturers in China
Although the business mainly in Southeast Asia was affected by the state of affairs in Myanmar, the transportation business has grown as the axis in Asia. Moreover, the apparel business has been recovering.
(Million JPY)
0
500
1,000
1,500
2,000
2,500
1Q 2Q 3Q 4Q 1Q 2Q 3Q 4Q 1Q 2Q 3Q 4Q 1Q 2Q
2018 2019 2020 2021
18
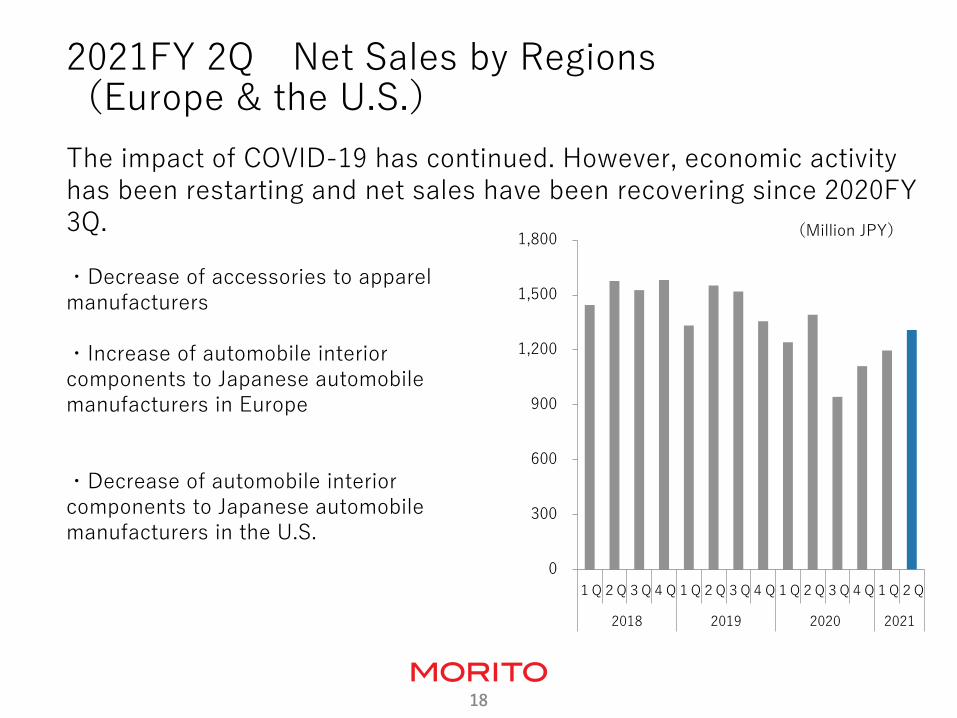
2021FY 2Q Net Sales by Regions (Europe & the U.S.)
The impact of COVID-19 has continued. However, economic activity has been restarting and net sales have been recovering since 2020FY 3Q.
・Decrease of accessories to apparel manufacturers ・Increase of automobile interior components to Japanese automobile manufacturers in Europe
・Decrease of automobile interior components to Japanese automobile manufacturers in the U.S.
(Million JPY)
0
300
600
900
1,200
1,500
1,800
1Q 2Q 3Q 4Q 1Q 2Q 3Q 4Q 1Q 2Q 3Q 4Q 1Q 2Q
2018 2019 2020 2021
19
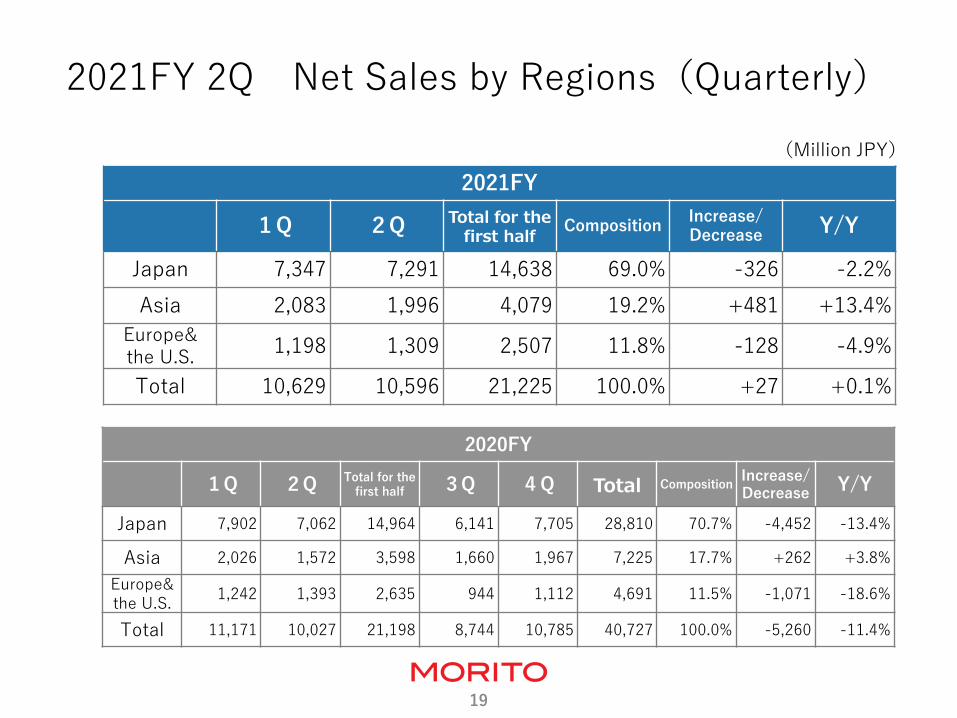
2021FY 2Q Net Sales by Regions(Quarterly)
(Million JPY)
2021FY
1Q 2Q Total for the
first half Composition
Increase/ Decrease Y/Y
Japan 7,347 7,291 14,638 69.0% -326 -2.2%
Asia 2,083 1,996 4,079 19.2% +481 +13.4%
Europe& the U.S.
1,198 1,309 2,507 11.8% -128 -4.9%
Total 10,629 10,596 21,225 100.0% +27 +0.1%
2020FY
1Q 2Q Total for the
first half 3Q 4Q Total Composition Increase/ Decrease
Y/Y
Japan 7,902 7,062 14,964 6,141 7,705 28,810 70.7% -4,452 -13.4%
Asia 2,026 1,572 3,598 1,660 1,967 7,225 17.7% +262 +3.8%
Europe& the U.S.
1,242 1,393 2,635 944 1,112 4,691 11.5% -1,071 -18.6%
Total 11,171 10,027 21,198 8,744 10,785 40,727 100.0% -5,260 -11.4%
20
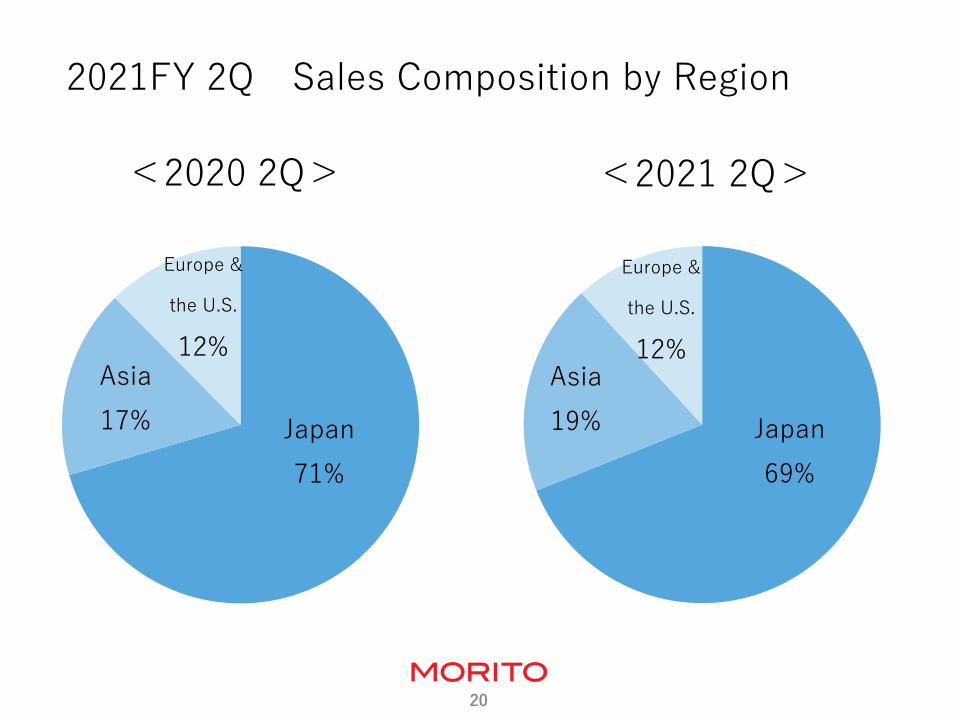
2021FY 2Q Sales Composition by Region
<2020 2Q> <2021 2Q>
Japan
71%
Asia
17%
Europe &
the U.S.
12%
Japan
69%
Asia
19%
Europe &
the U.S.
12%
21
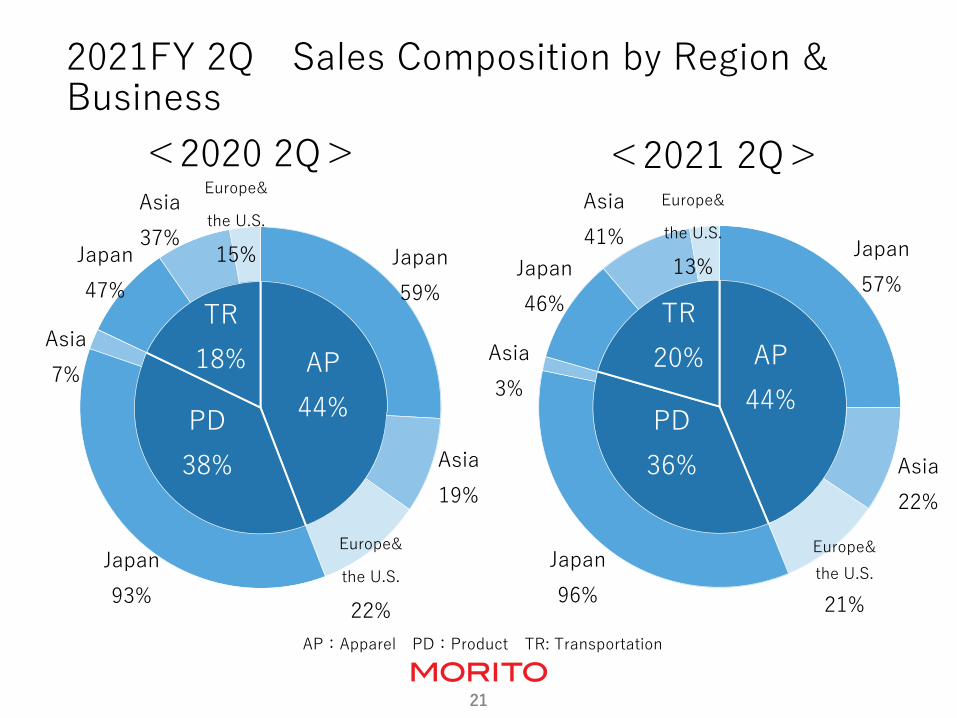
2021FY 2Q Sales Composition by Region & Business
AP
44% PD
38%
TR
18%
Japan
59%
Asia
19%
Europe&
the U.S.
22%
Japan
93%
Asia
7%
Japan
47%
Asia
37%
Europe&
the U.S.
15%
<2020 2Q> <2021 2Q>
AP
44% PD
36%
TR
20%
Japan
57%
Asia
22%
Europe&
the U.S.
21%
Japan
96%
Asia
3%
Japan
46%
Asia
41%
Europe&
the U.S.
13%
AP:Apparel PD:Product TR: Transportation

22
1. FY2021.11 2Q Financial Results
2. FY2021.11 2Q Business Overview
3. Business Topics
4. Shareholder Returns
23
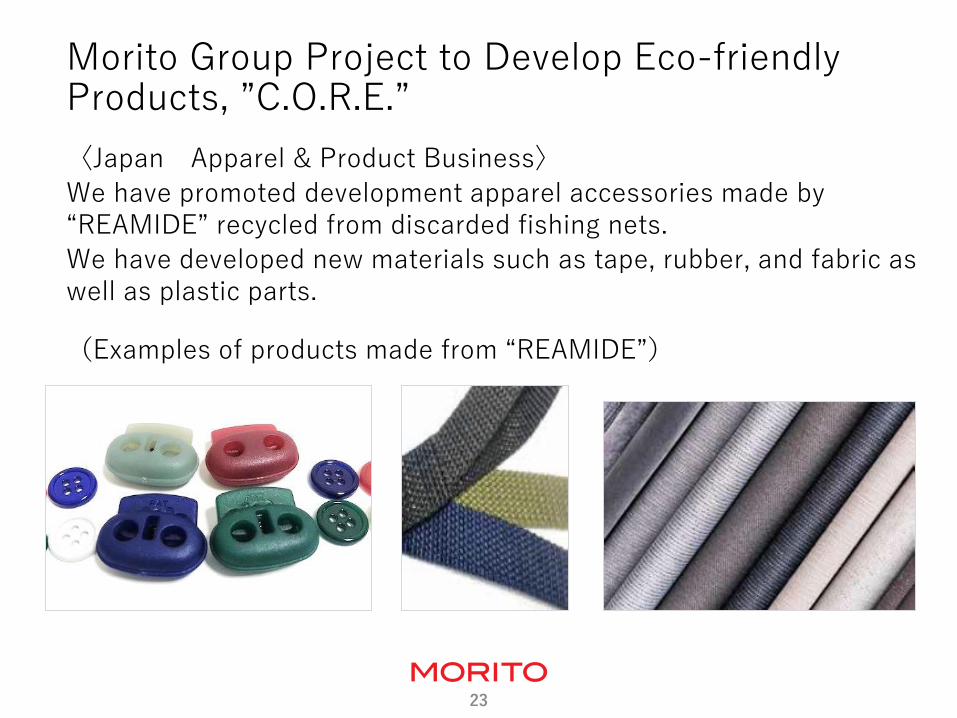
Morito Group Project to Develop Eco-friendly Products, ”C.O.R.E.”
〈Japan Apparel & Product Business〉
We have promoted development apparel accessories made by “REAMIDE” recycled from discarded fishing nets.
We have developed new materials such as tape, rubber, and fabric as well as plastic parts.
(Examples of products made from “REAMIDE”)
24
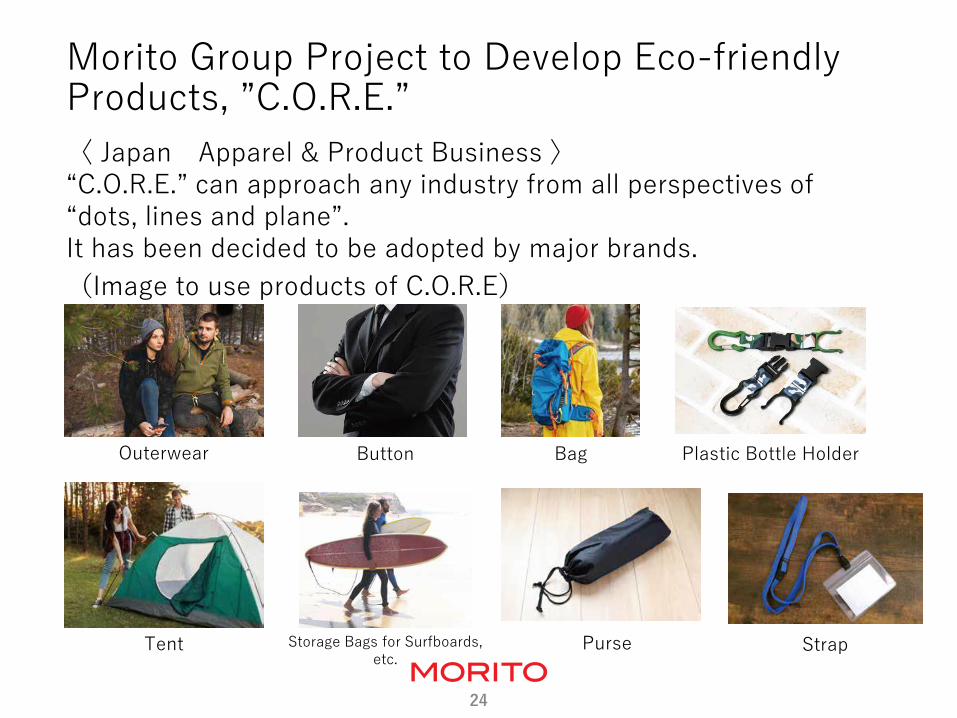
Morito Group Project to Develop Eco-friendly Products, ”C.O.R.E.”
〈 Japan Apparel & Product Business 〉 “C.O.R.E.” can approach any industry from all perspectives of “dots, lines and plane”. It has been decided to be adopted by major brands.
(Image to use products of C.O.R.E)
Outerwear Button Bag Plastic Bottle Holder
Tent Storage Bags for Surfboards, etc.
Purse Strap
25
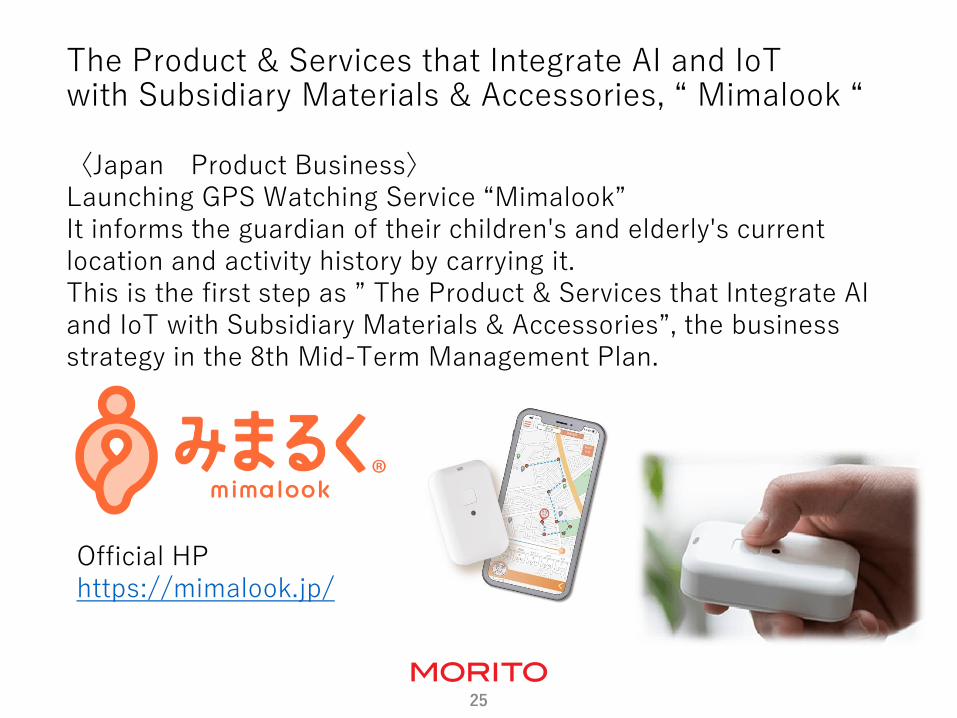
The Product & Services that Integrate AI and IoT with Subsidiary Materials & Accessories, “ Mimalook “
〈Japan Product Business〉 Launching GPS Watching Service “Mimalook” It informs the guardian of their children's and elderly's current location and activity history by carrying it. This is the first step as ” The Product & Services that Integrate AI and IoT with Subsidiary Materials & Accessories”, the business strategy in the 8th Mid-Term Management Plan.
Official HP https://mimalook.jp/
26
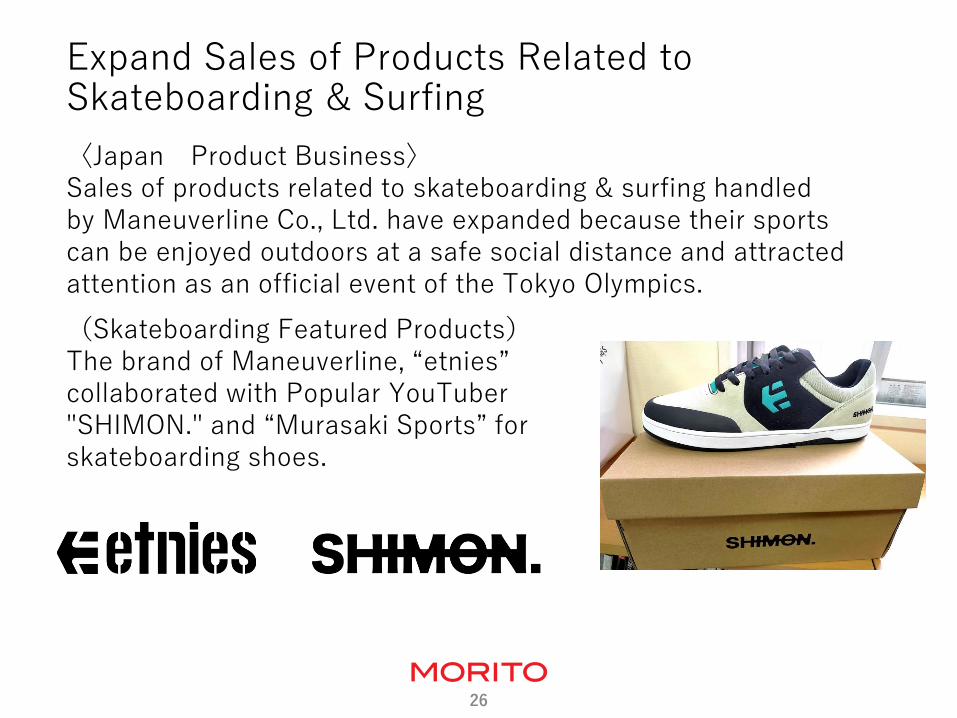
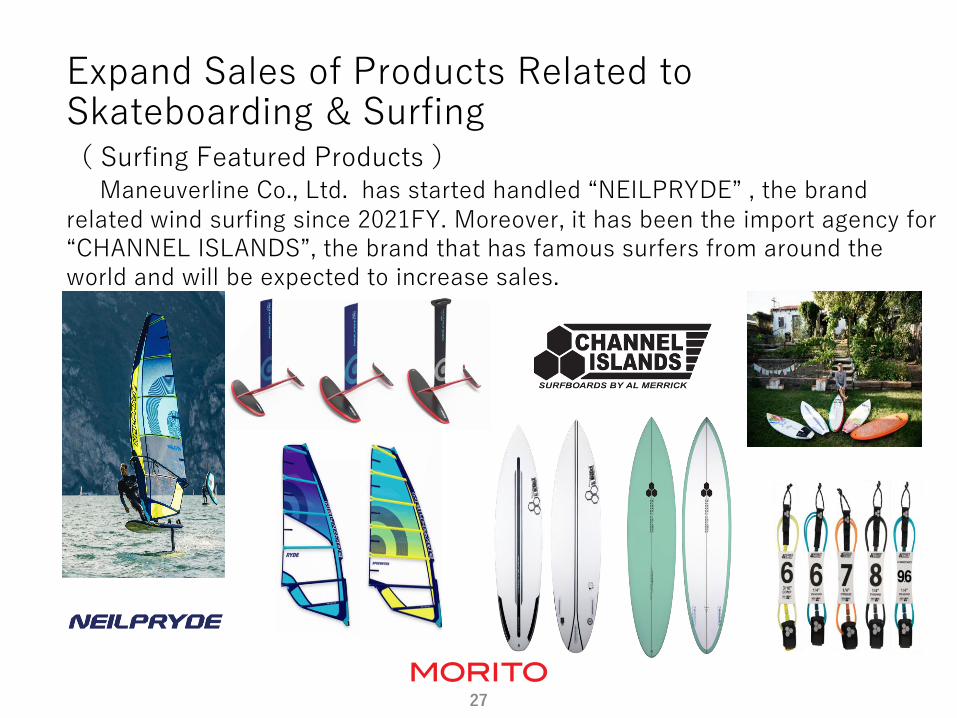
Expand Sales of Products Related to Skateboarding & Surfing
〈Japan Product Business〉 Sales of products related to skateboarding & surfing handled by Maneuverline Co., Ltd. have expanded because their sports can be enjoyed outdoors at a safe social distance and attracted attention as an official event of the Tokyo Olympics.
(Skateboarding Featured Products) The brand of Maneuverline, “etnies” collaborated with Popular YouTuber "SHIMON." and “Murasaki Sports” for skateboarding shoes.
27
Expand Sales of Products Related to Skateboarding & Surfing ( Surfing Featured Products ) Maneuverline Co., Ltd. has started handled “NEILPRYDE” , the brand related wind surfing since 2021FY. Moreover, it has been the import agency for “CHANNEL ISLANDS”, the brand that has famous surfers from around the world and will be expected to increase sales.
28
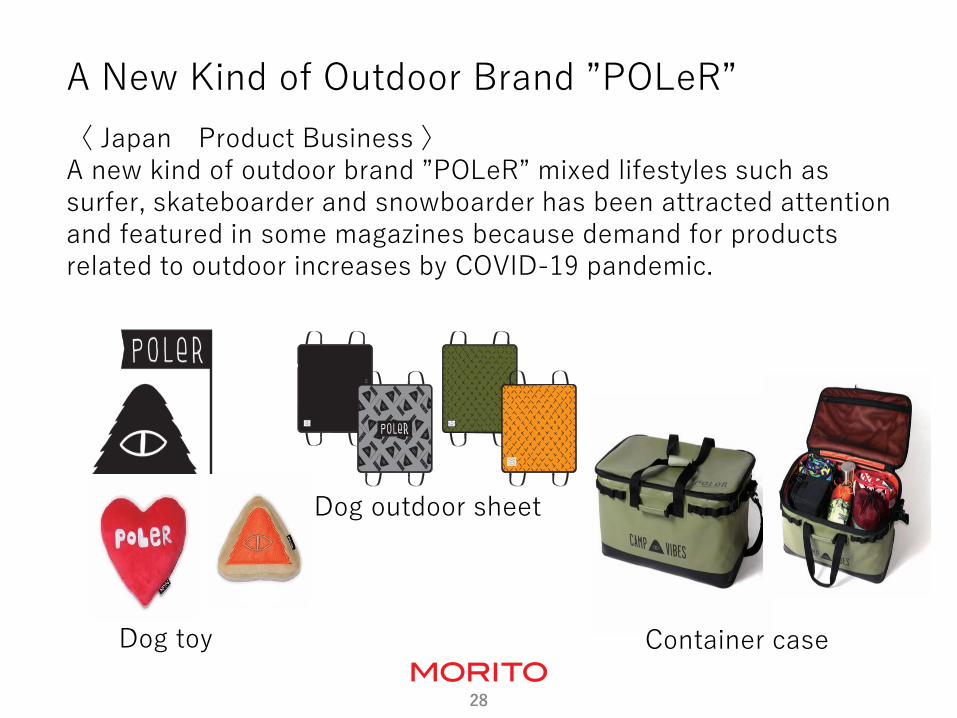
A New Kind of Outdoor Brand ”POLeR”
〈 Japan Product Business 〉 A new kind of outdoor brand ”POLeR” mixed lifestyles such as surfer, skateboarder and snowboarder has been attracted attention and featured in some magazines because demand for products related to outdoor increases by COVID-19 pandemic.
Dog toy Container case
Dog outdoor sheet
29
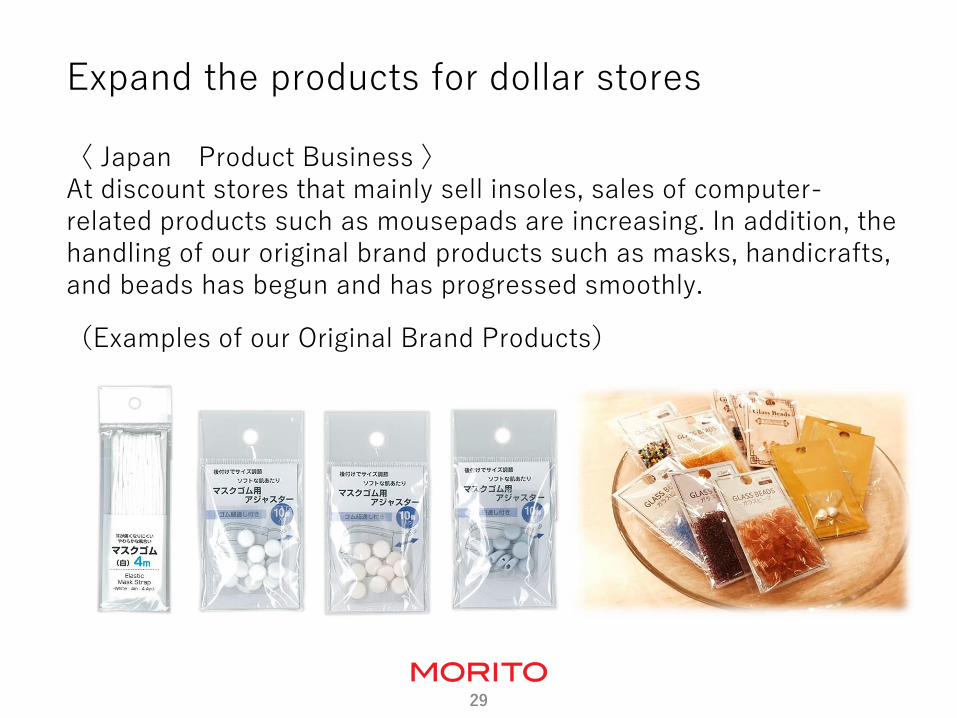
Expand the products for dollar stores
〈 Japan Product Business 〉 At discount stores that mainly sell insoles, sales of computer-related products such as mousepads are increasing. In addition, the handling of our original brand products such as masks, handicrafts, and beads has begun and has progressed smoothly.
(Examples of our Original Brand Products)
30
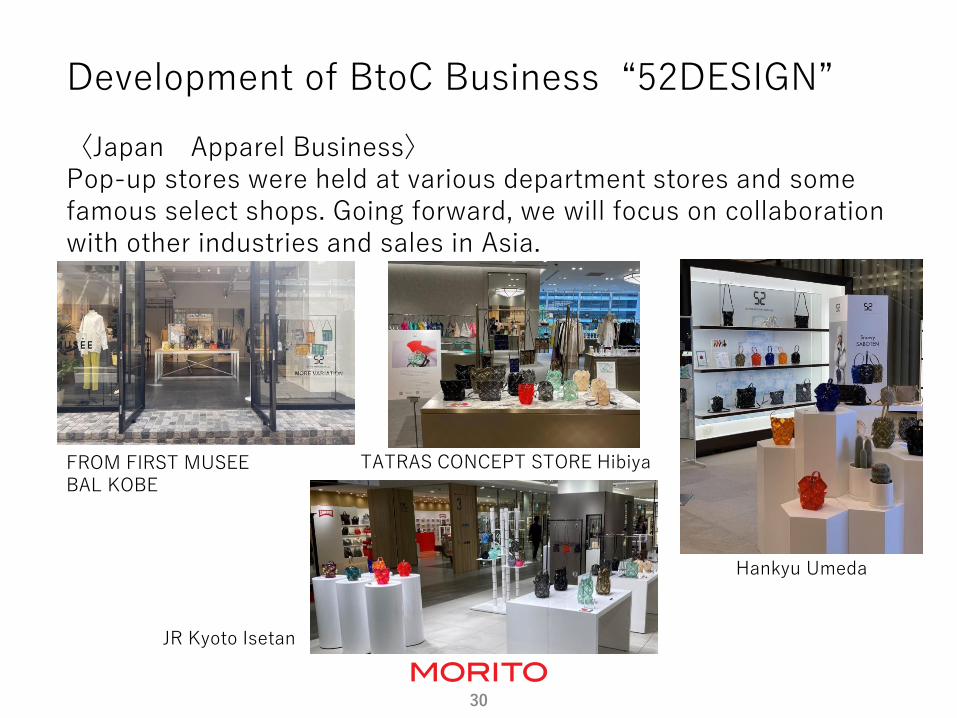
Development of BtoC Business “52DESIGN”
〈Japan Apparel Business〉 Pop-up stores were held at various department stores and some famous select shops. Going forward, we will focus on collaboration with other industries and sales in Asia.
FROM FIRST MUSEE BAL KOBE
TATRAS CONCEPT STORE Hibiya
JR Kyoto Isetan
Hankyu Umeda
31
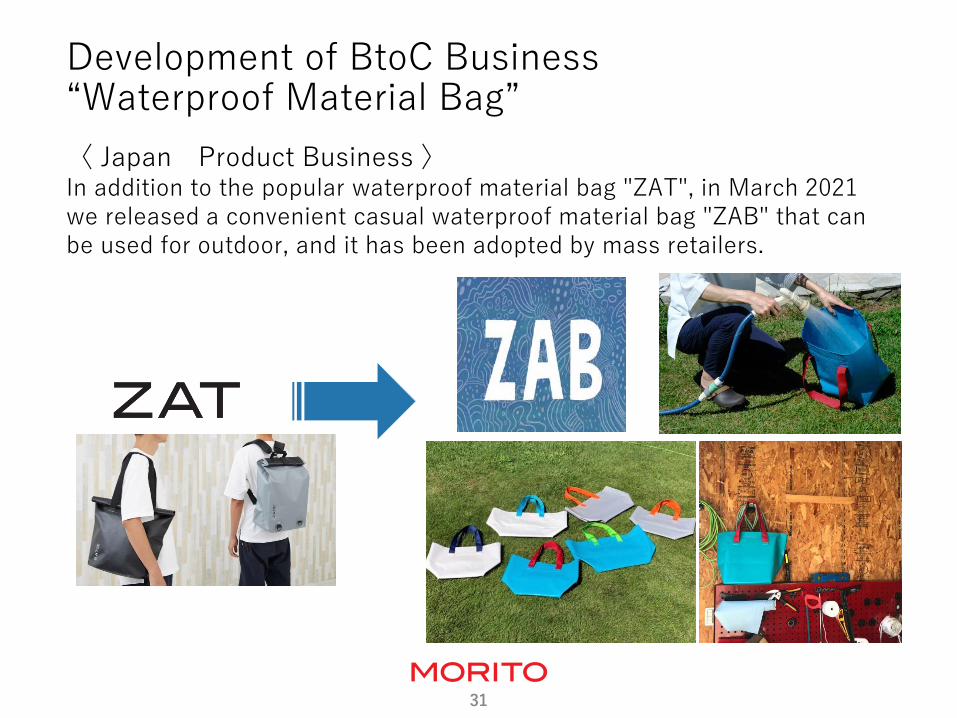
Development of BtoC Business “Waterproof Material Bag”
〈 Japan Product Business 〉 In addition to the popular waterproof material bag "ZAT", in March 2021 we released a convenient casual waterproof material bag "ZAB" that can be used for outdoor, and it has been adopted by mass retailers.
32
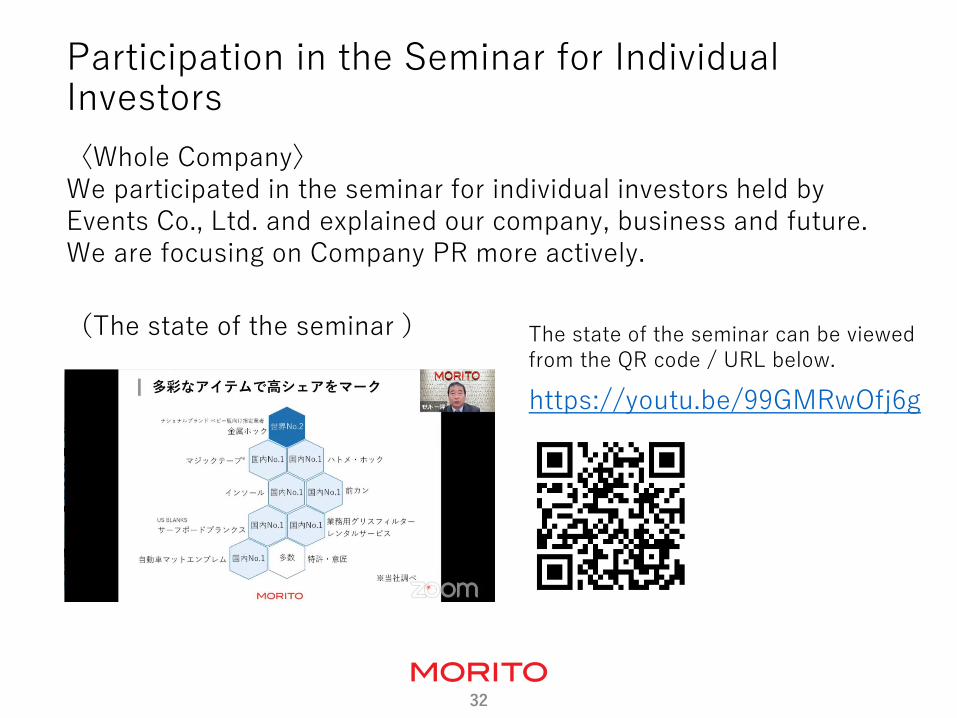
Participation in the Seminar for Individual Investors
〈Whole Company〉 We participated in the seminar for individual investors held by Events Co., Ltd. and explained our company, business and future. We are focusing on Company PR more actively.
https://youtu.be/99GMRwOfj6g
The state of the seminar can be viewed from the QR code / URL below.
(The state of the seminar )

33
1. FY2021.11 2Q Financial Results
2. FY2021.11 2Q Business Overview
3. Business Topics
4. Shareholder Returns
34
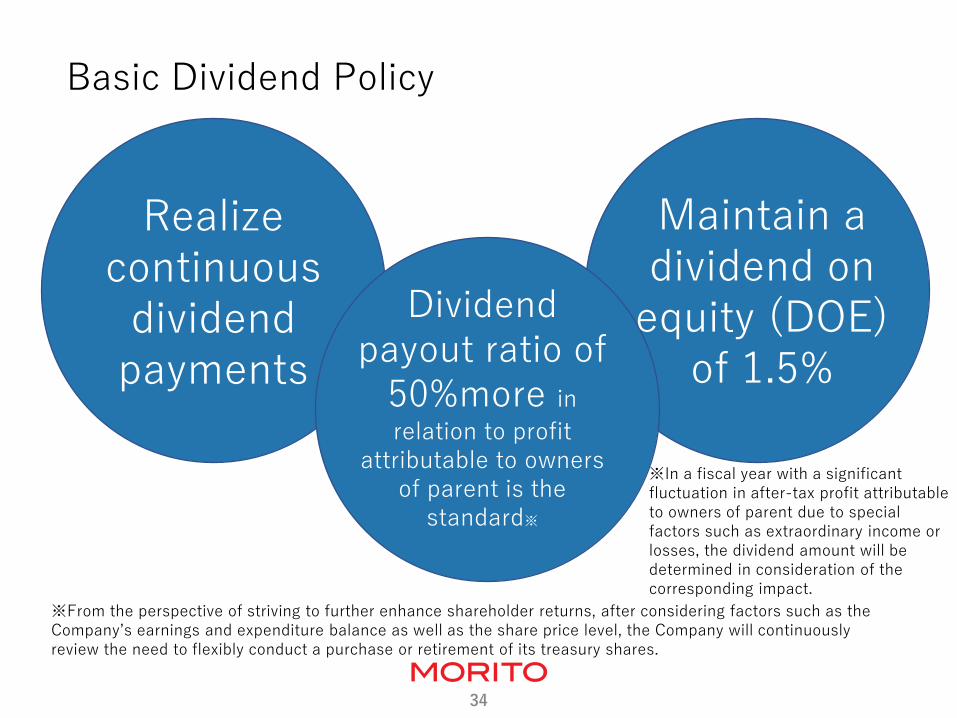
Dividend payout ratio of
50%more in
relation to profit attributable to owners
of parent is the standard※
※In a fiscal year with a significant fluctuation in after-tax profit attributable to owners of parent due to special factors such as extraordinary income or losses, the dividend amount will be determined in consideration of the corresponding impact.
※From the perspective of striving to further enhance shareholder returns, after considering factors such as the Company’s earnings and expenditure balance as well as the share price level, the Company will continuously review the need to flexibly conduct a purchase or retirement of its treasury shares.
Realize continuous
dividend payments
Maintain a dividend on
equity (DOE) of 1.5%
Basic Dividend Policy
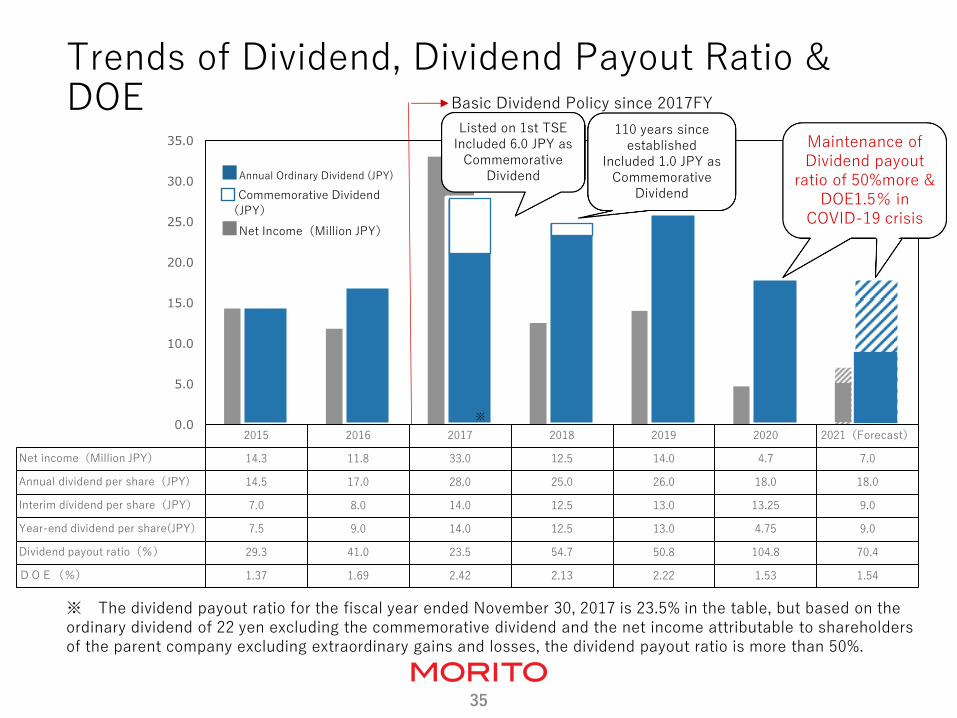
2015 2016 2017 2018 2019 2020 2021(Forecast)
Net income(Million JPY) 14.3 11.8 33.0 12.5 14.0 4.7 7.0
Annual dividend per share(JPY) 14.5 17.0 28.0 25.0 26.0 18.0 18.0
Interim dividend per share(JPY) 7.0 8.0 14.0 12.5 13.0 13.25 9.0
Year-end dividend per share(JPY) 7.5 9.0 14.0 12.5 13.0 4.75 9.0
Dividend payout ratio(%) 29.3 41.0 23.5 54.7 50.8 104.8 70.4
DOE(%) 1.37 1.69 2.42 2.13 2.22 1.53 1.54
0.0
5.0
10.0
15.0
20.0
25.0
30.0
35.0
35
Trends of Dividend, Dividend Payout Ratio & DOE
※ The dividend payout ratio for the fiscal year ended November 30, 2017 is 23.5% in the table, but based on the ordinary dividend of 22 yen excluding the commemorative dividend and the net income attributable to shareholders of the parent company excluding extraordinary gains and losses, the dividend payout ratio is more than 50%.
※
Basic Dividend Policy since 2017FY
Listed on 1st TSE Included 6.0 JPY as
Commemorative Dividend
110 years since established
Included 1.0 JPY as Commemorative
Dividend
Maintenance of Dividend payout
ratio of 50%more & DOE1.5% in
COVID-19 crisis
■Annual Ordinary Dividend (JPY)
Commemorative Dividend
(JPY)
■Net Income(Million JPY)
36
Disclaimer
This handout has been prepared for only information purposes and made not intended to solicit investment.
Although this handout is made with extreme care, its completeness cannot be guaranteed.
We assume no responsibility whatsoever for any damages resulting from the contents.
The financial results forecasts and forward-looking in this presentation are judged by information known as of the day of presentation and contains some potential risks and uncertainties.
Therefore, please be aware that the content of the forecast may differ significantly from actual results, due to various factors such as change of business environment.
Contact MORITO CO.‚ LTD. General Affairs Dept. IR & Stock Sect.
4-2-4,MINAMI HOMMACHI, CHUO-KU, OSAKA 541-0054 JAPAN
E-mail:[email protected]