Embed Size (px)
Citation preview

THE SURVEY OF GARMENT WORKERS 2020
ASIAN CENTER FOR DEVELOPMENT
INTRODUCTION
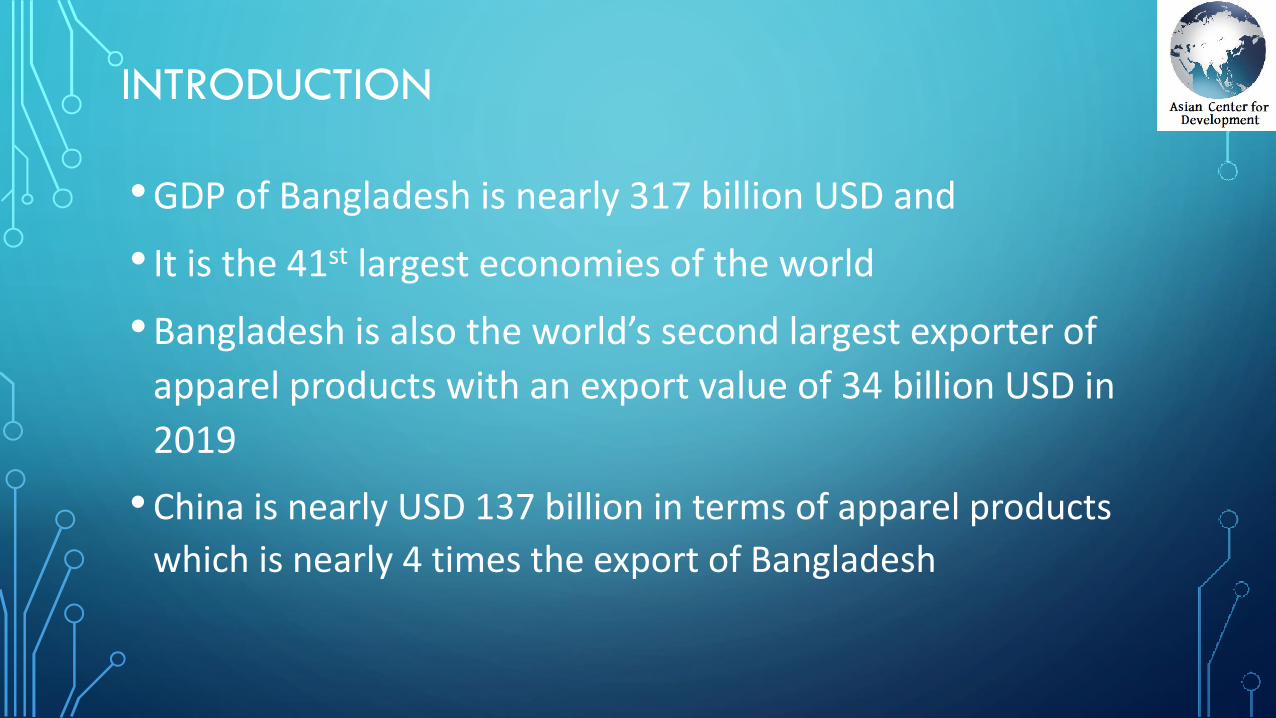
•GDP of Bangladesh is nearly 317 billion USD and
• It is the 41st largest economies of the world
•Bangladesh is also the world’s second largest exporter of
apparel products with an export value of 34 billion USD in
2019
• China is nearly USD 137 billion in terms of apparel products
which is nearly 4 times the export of Bangladesh
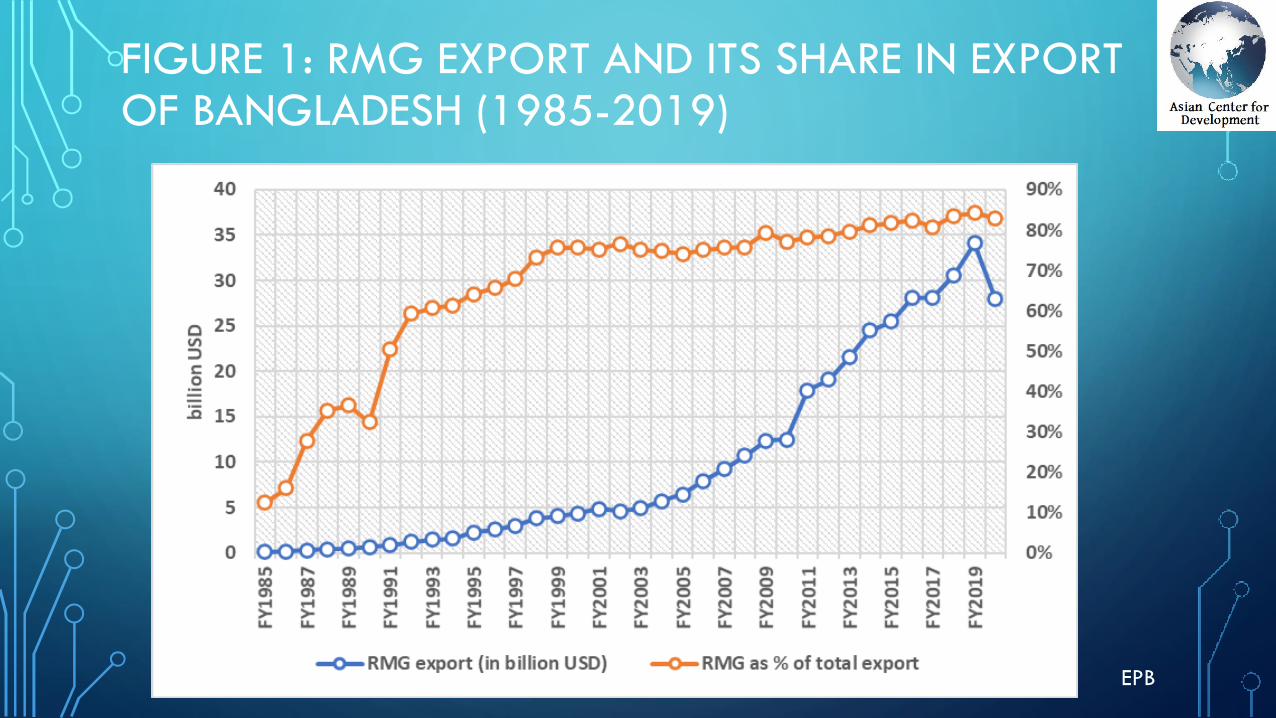
FIGURE 1: RMG EXPORT AND ITS SHARE IN EXPORT OF BANGLADESH (1985-2019)
EPB
HISTORY OF THE SURVEY
• Asian Center for Development completed the first
comprehensive survey on workers of the garment
industries in Bangladesh in 2014
• 7 out of worlds’ 10 most green RMG factories are
in Bangladesh (New Age: March 1, 2018) .
• 15% of the factories were either closed or merged
with others to comply with the regulations (CPD)
Amazon.com
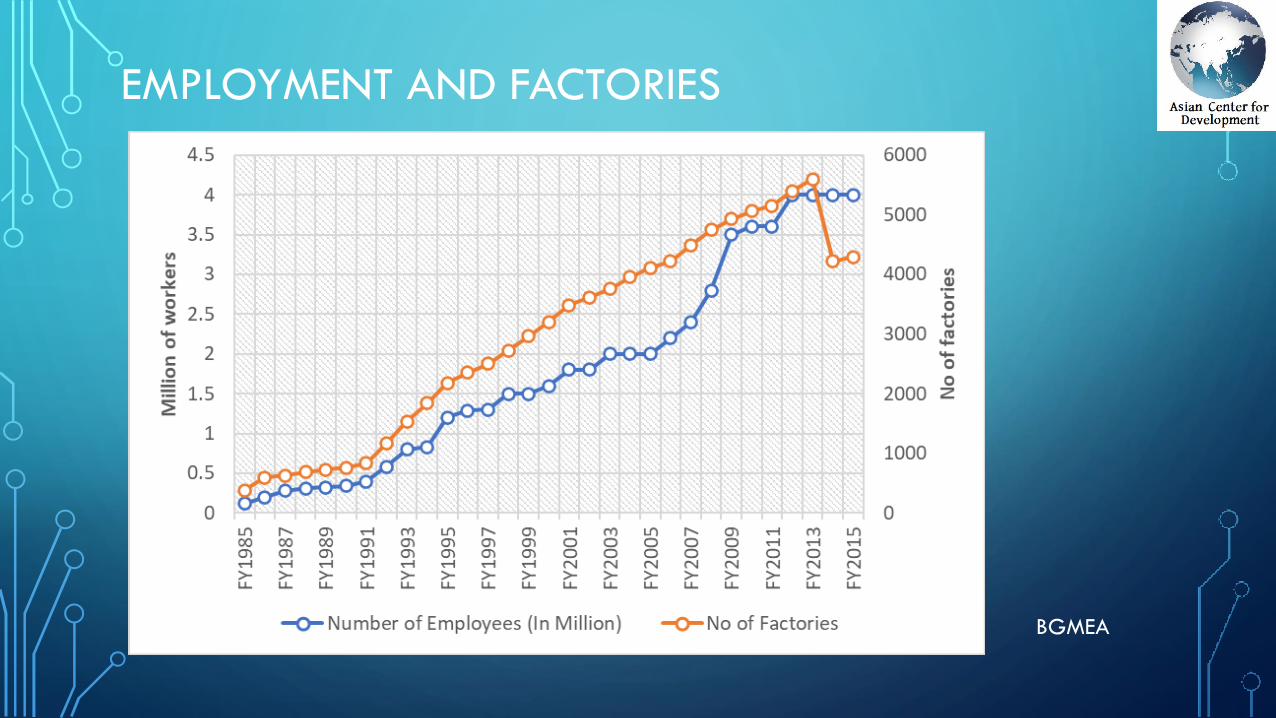
EMPLOYMENT AND FACTORIES
BGMEA
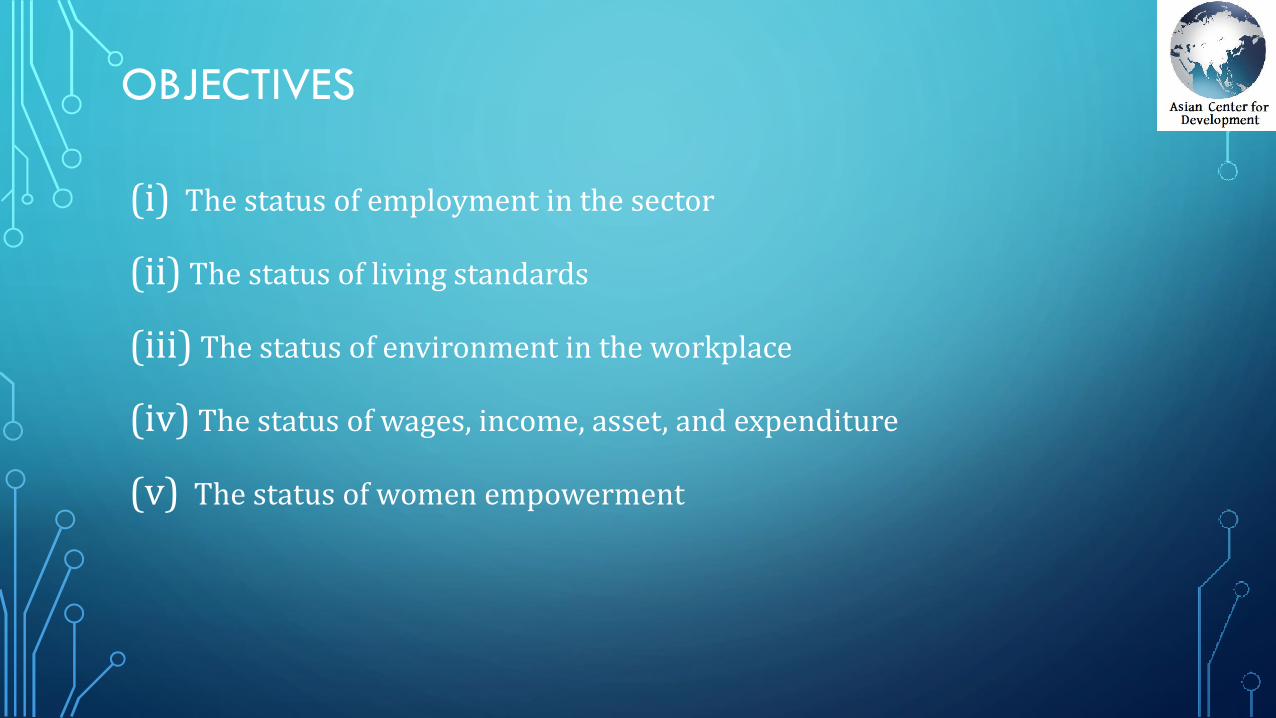
OBJECTIVES
(i) The status of employment in the sector
(ii) The status of living standards
(iii) The status of environment in the workplace
(iv) The status of wages, income, asset, and expenditure
(v) The status of women empowerment
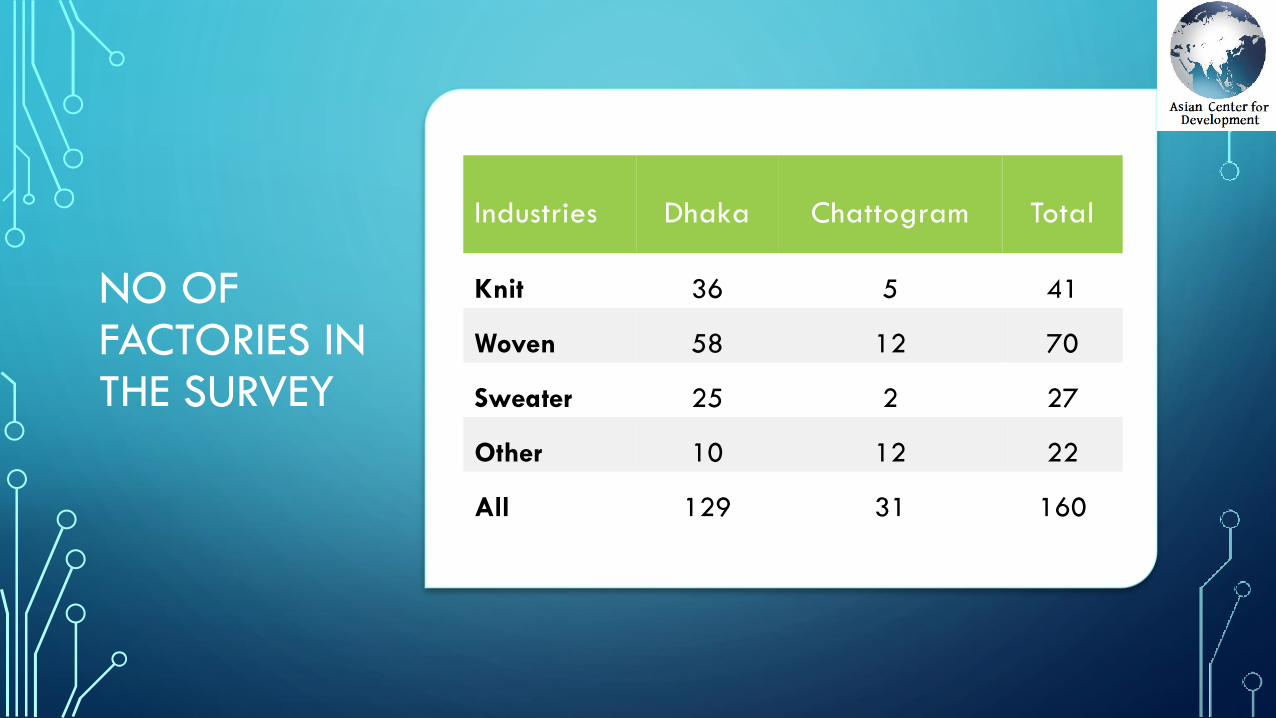
NO OF FACTORIES IN THE SURVEY
Industries Dhaka Chattogram Total
Knit 36 5 41
Woven 58 12 70
Sweater 25 2 27
Other 10 12 22
All 129 31 160
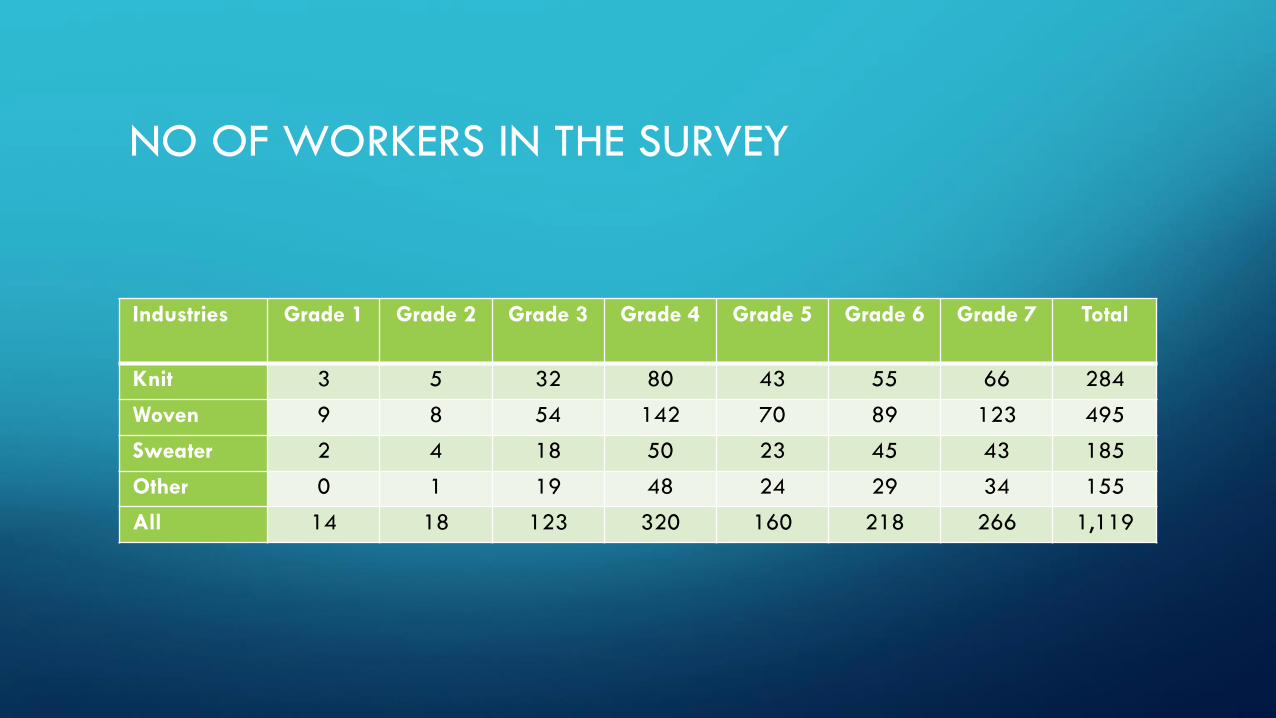
NO OF WORKERS IN THE SURVEY
Industries Grade 1 Grade 2 Grade 3 Grade 4 Grade 5 Grade 6 Grade 7 Total
Knit 3 5 32 80 43 55 66 284
Woven 9 8 54 142 70 89 123 495
Sweater 2 4 18 50 23 45 43 185
Other 0 1 19 48 24 29 34 155
All 14 18 123 320 160 218 266 1,119
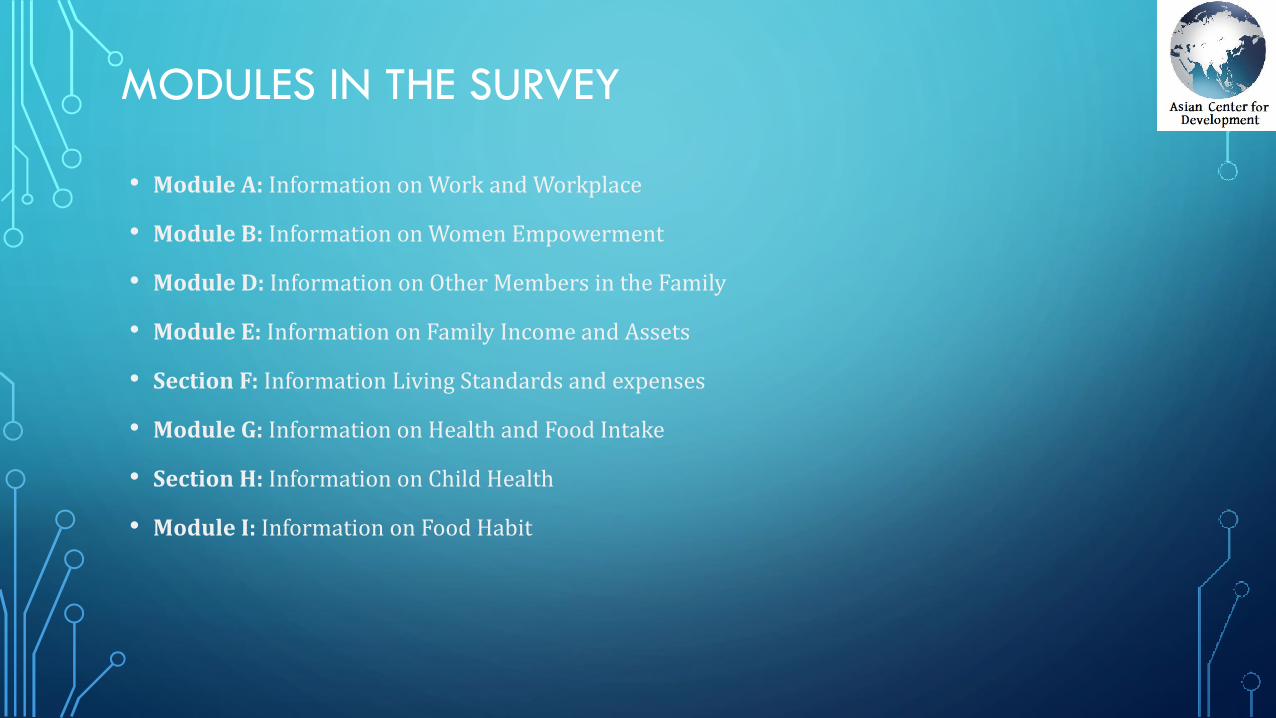
MODULES IN THE SURVEY
• Module A: Information on Work and Workplace
• Module B: Information on Women Empowerment
• Module D: Information on Other Members in the Family
• Module E: Information on Family Income and Assets
• Section F: Information Living Standards and expenses
• Module G: Information on Health and Food Intake
• Section H: Information on Child Health
• Module I: Information on Food Habit
RESULTS
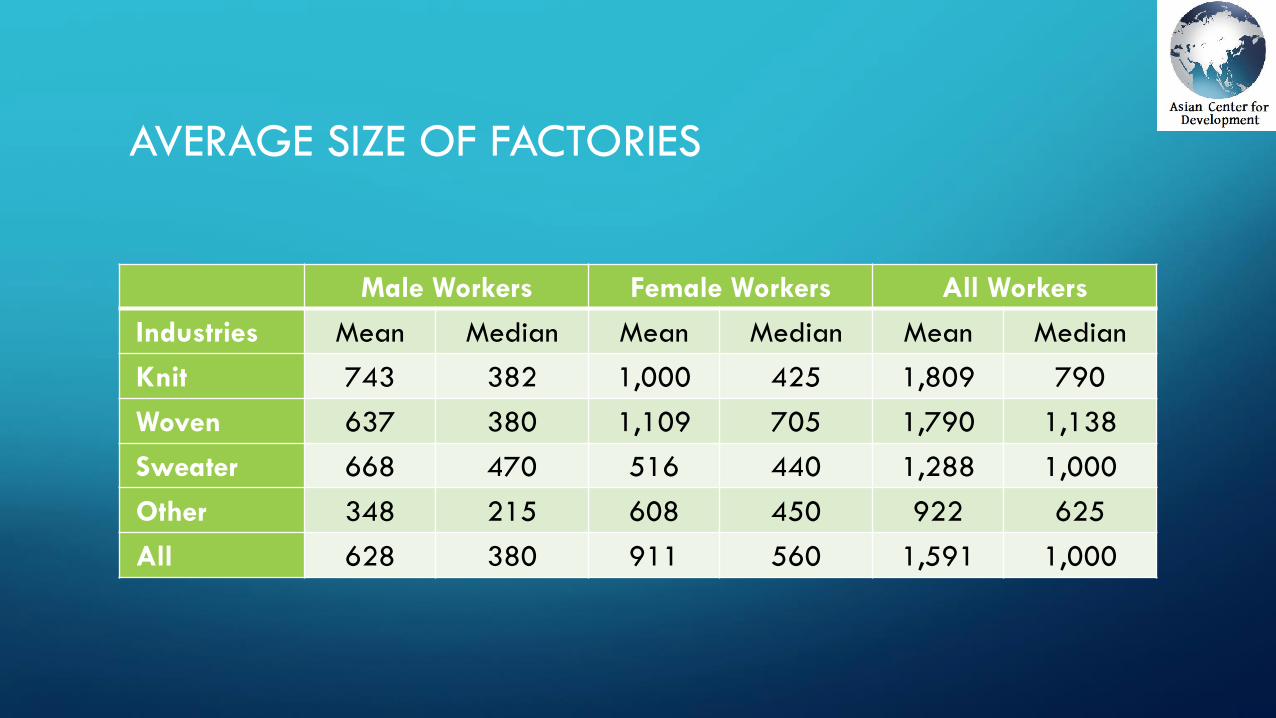
AVERAGE SIZE OF FACTORIES
Male Workers Female Workers All Workers
Industries Mean Median Mean Median Mean Median
Knit 743 382 1,000 425 1,809 790
Woven 637 380 1,109 705 1,790 1,138
Sweater 668 470 516 440 1,288 1,000
Other 348 215 608 450 922 625
All 628 380 911 560 1,591 1,000
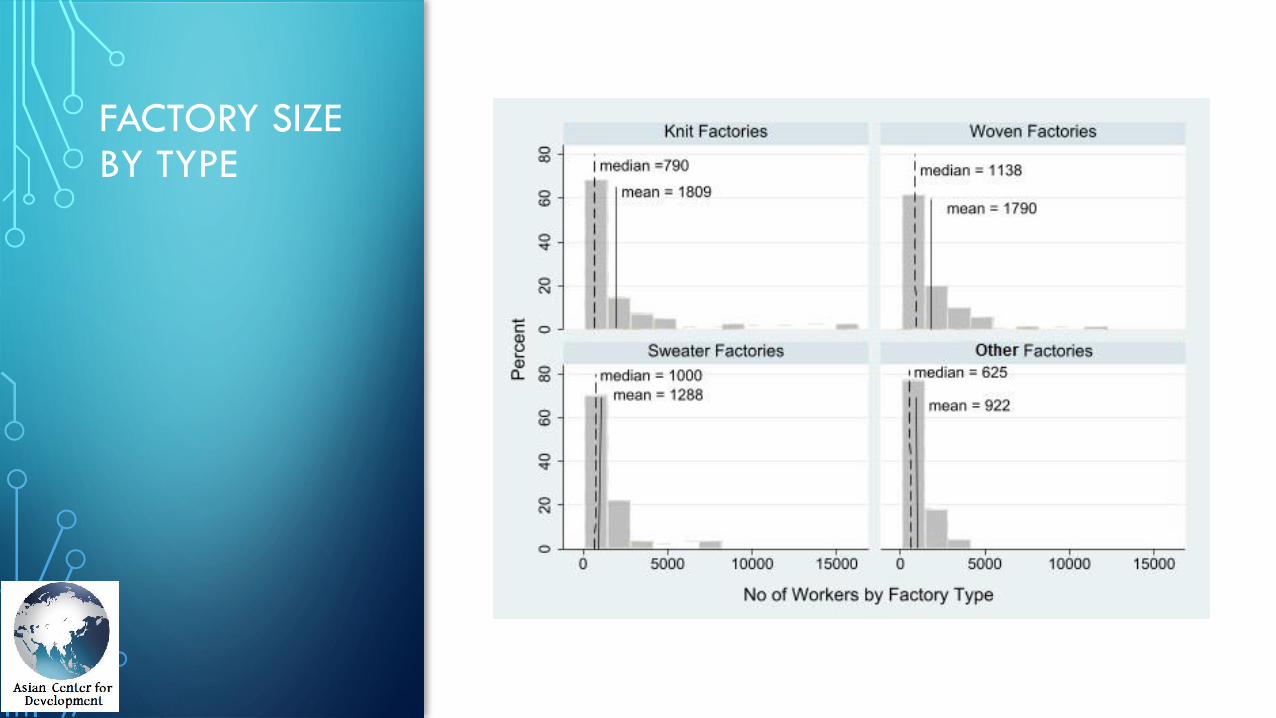
FACTORY SIZE BY TYPE
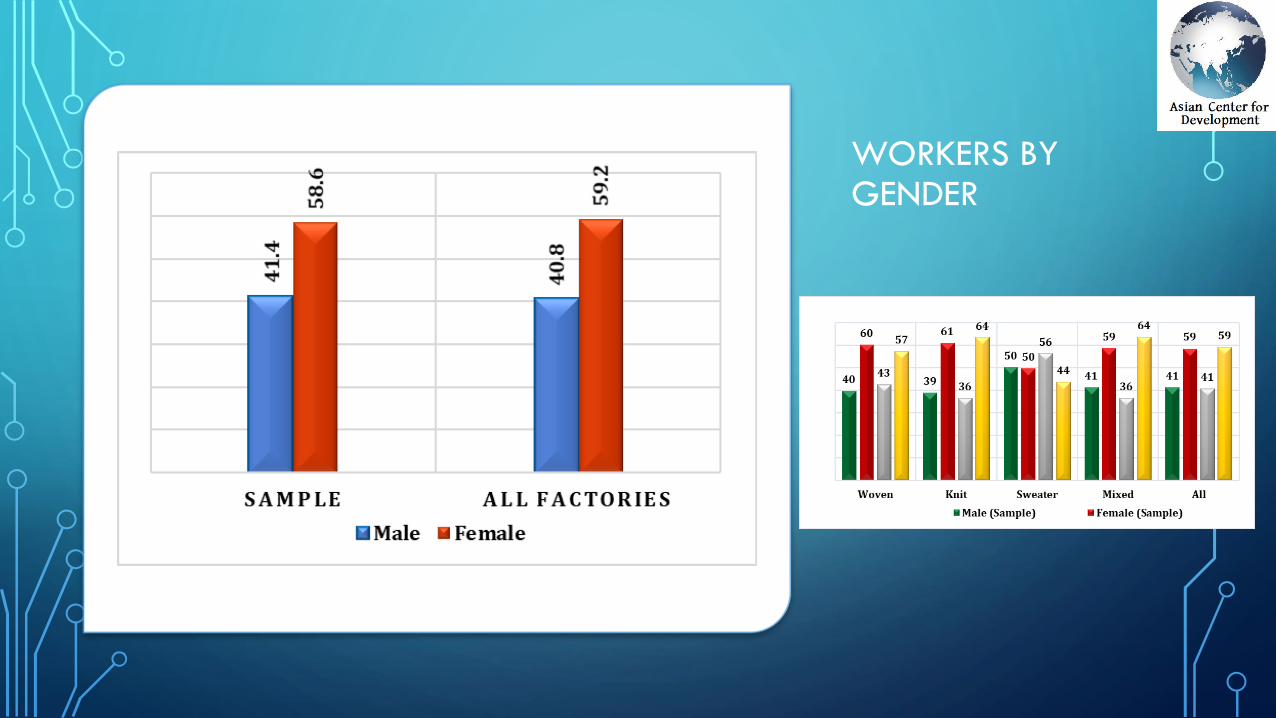
WORKERS BY GENDER
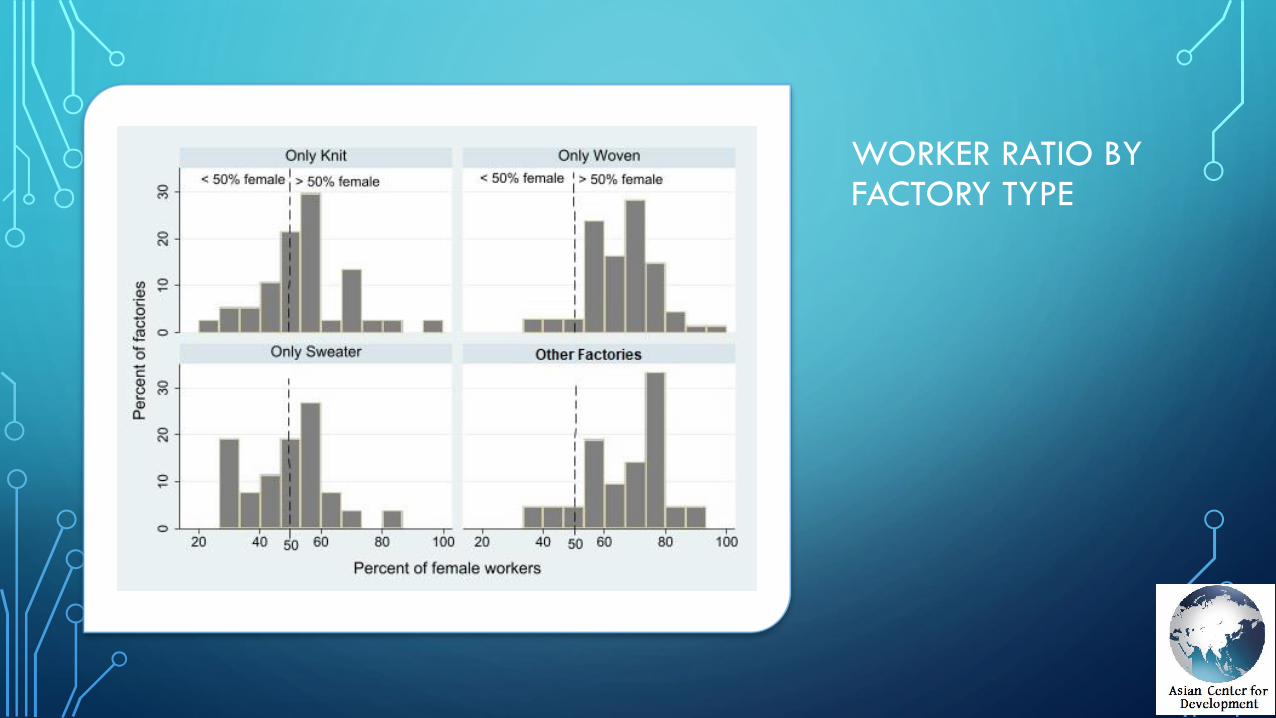
WORKER RATIO BY FACTORY TYPE
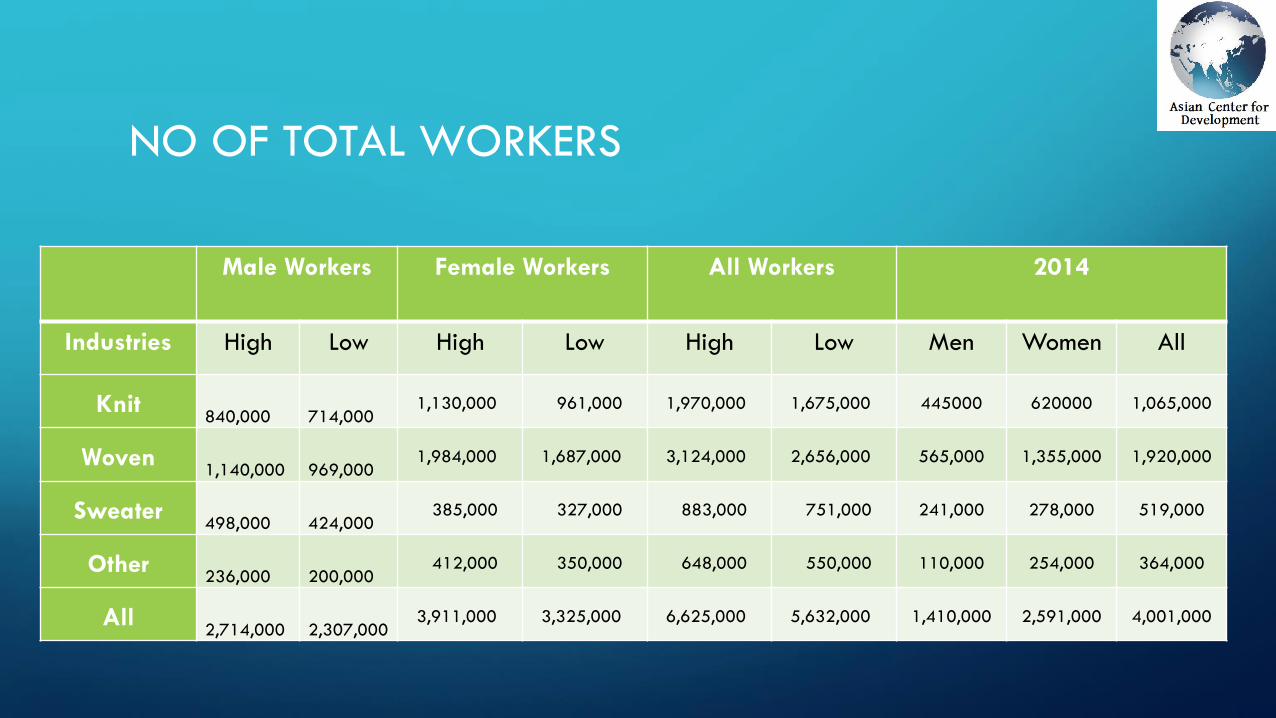
NO OF TOTAL WORKERS
Male Workers Female Workers All Workers 2014
Industries High Low High Low High Low Men Women All
Knit840,000 714,000
1,130,000 961,000 1,970,000 1,675,000 445000 620000 1,065,000
Woven1,140,000 969,000
1,984,000 1,687,000 3,124,000 2,656,000 565,000 1,355,000 1,920,000
Sweater498,000 424,000
385,000 327,000 883,000 751,000 241,000 278,000 519,000
Other236,000 200,000
412,000 350,000 648,000 550,000 110,000 254,000 364,000
All2,714,000 2,307,000
3,911,000 3,325,000 6,625,000 5,632,000 1,410,000 2,591,000 4,001,000
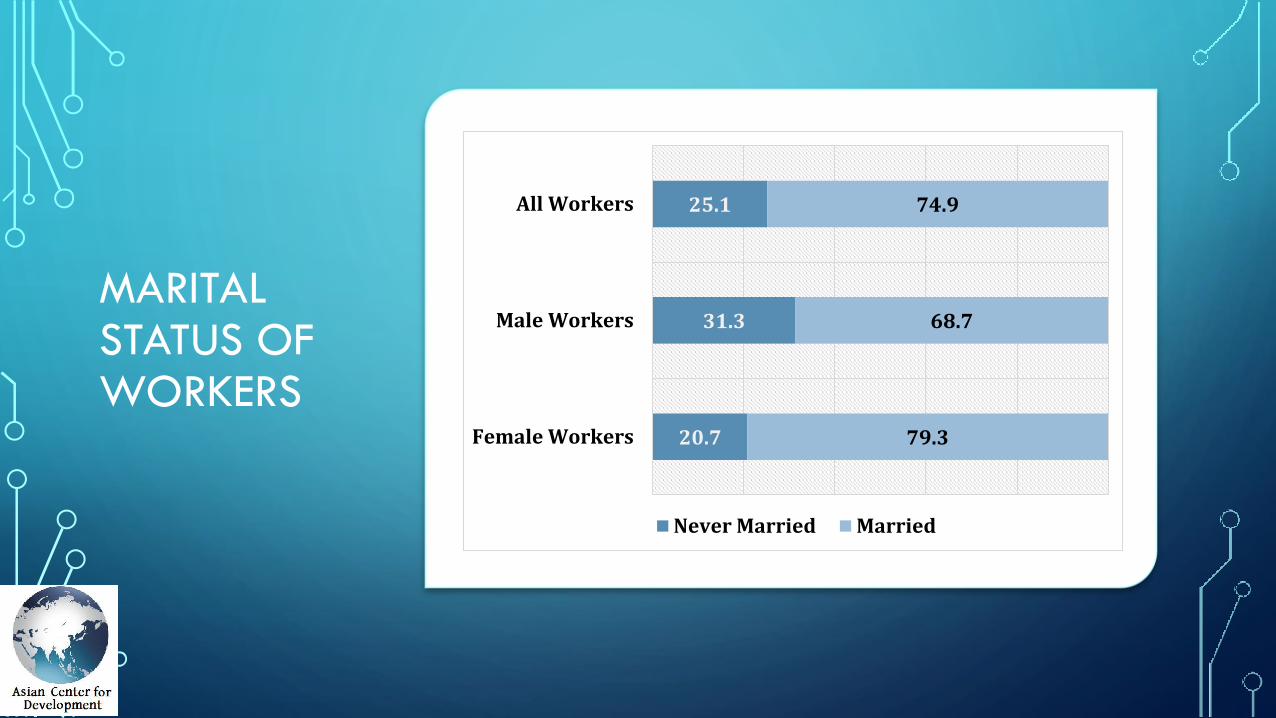
MARITAL STATUS OF WORKERS
20.7
31.3
25.1
79.3
68.7
74.9
Female Workers
Male Workers
All Workers
Never Married Married
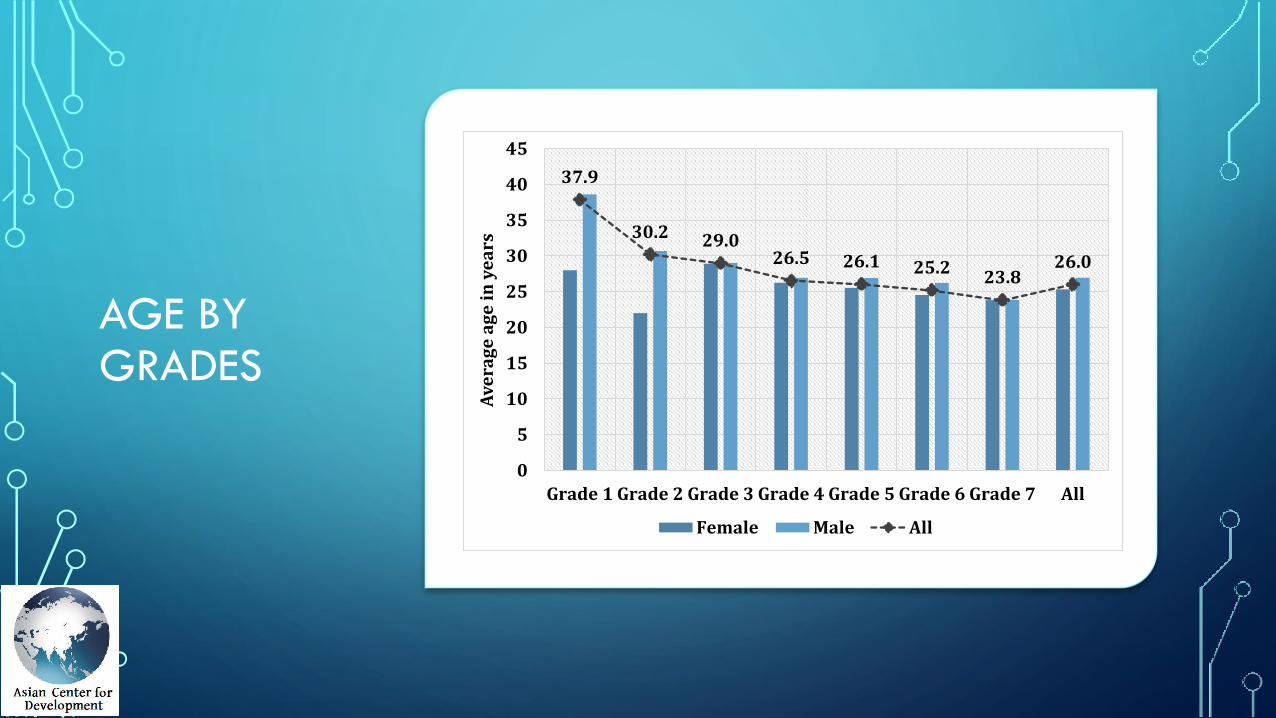
AGE BY GRADES
37.9
30.2 29.026.5 26.1 25.2
23.826.0
0
5
10
15
20
25
30
35
40
45
Grade 1 Grade 2 Grade 3 Grade 4 Grade 5 Grade 6 Grade 7 AllA
ve
rag
e a
ge
in
ye
ars
Female Male All
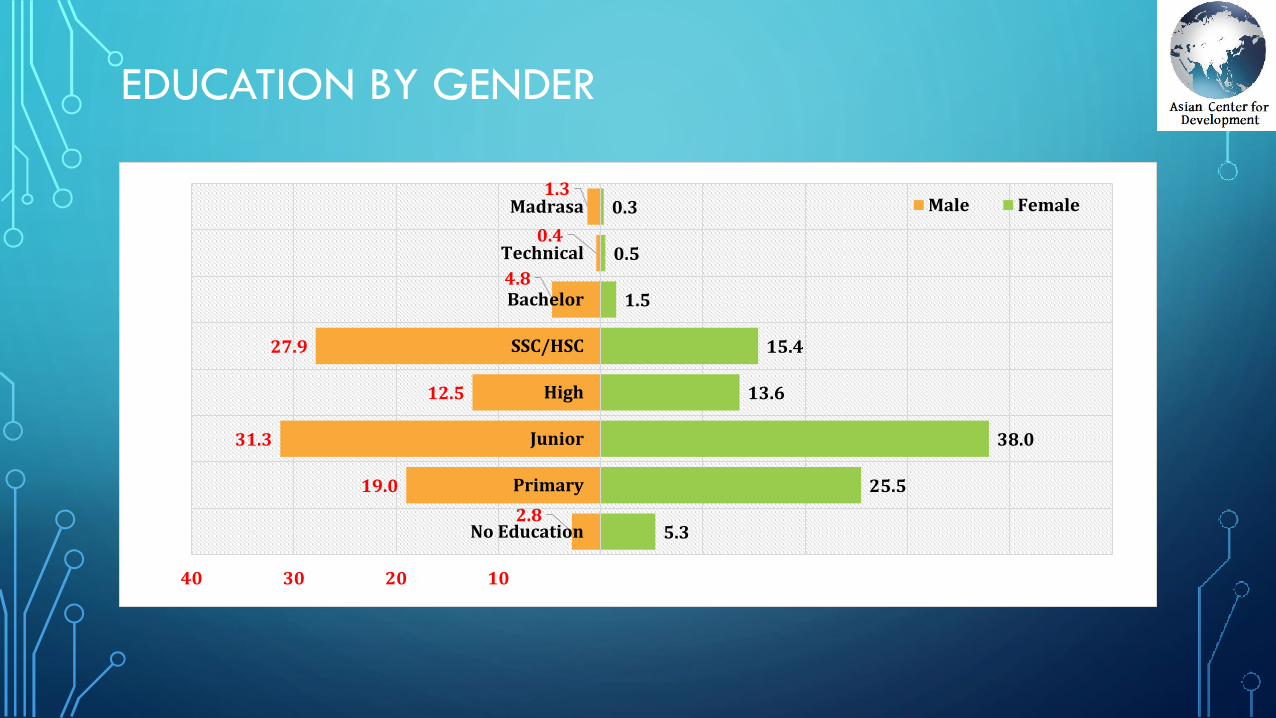
EDUCATION BY GENDER
5.3
25.5
38.0
13.6
15.4
1.5
0.5
0.3
2.8
19.0
31.3
12.5
27.9
4.8
0.4
1.3
40 30 20 10 0 10 20 30 40 50
No Education
Primary
Junior
High
SSC/HSC
Bachelor
Technical
Madrasa
Percent
Ed
uca
tio
n C
ate
go
ry
Male Female
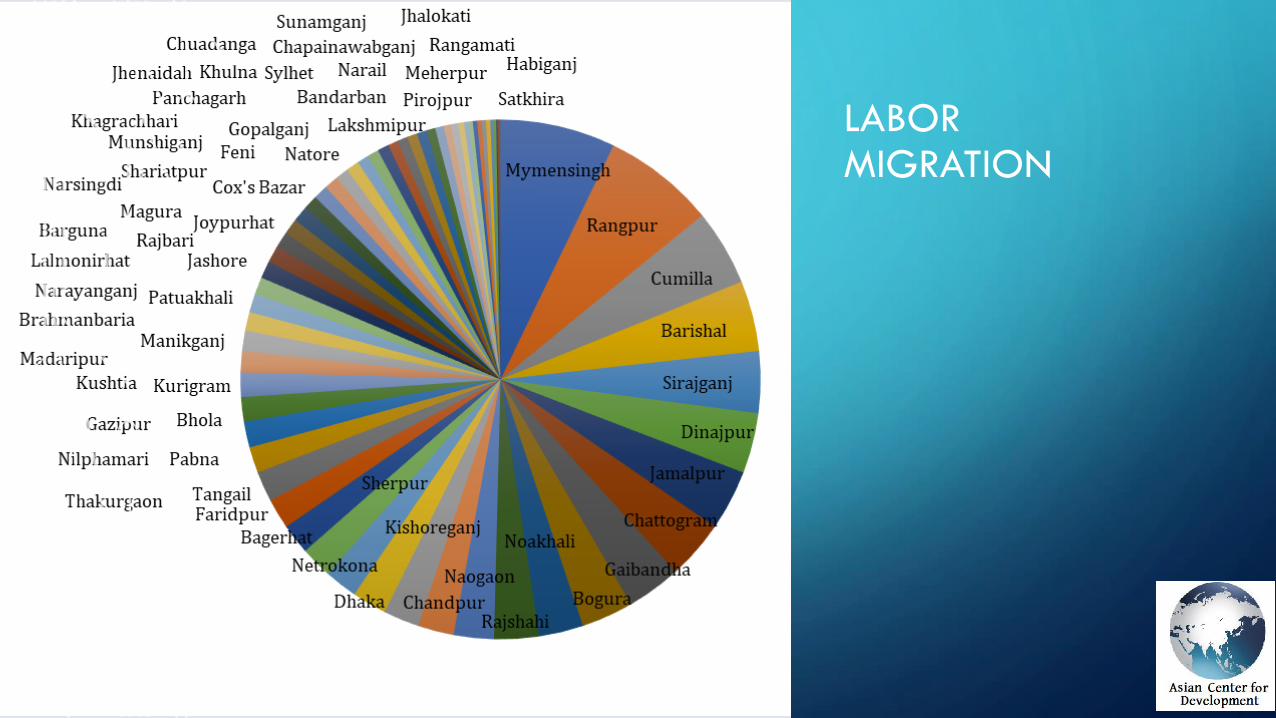
LABOR MIGRATION
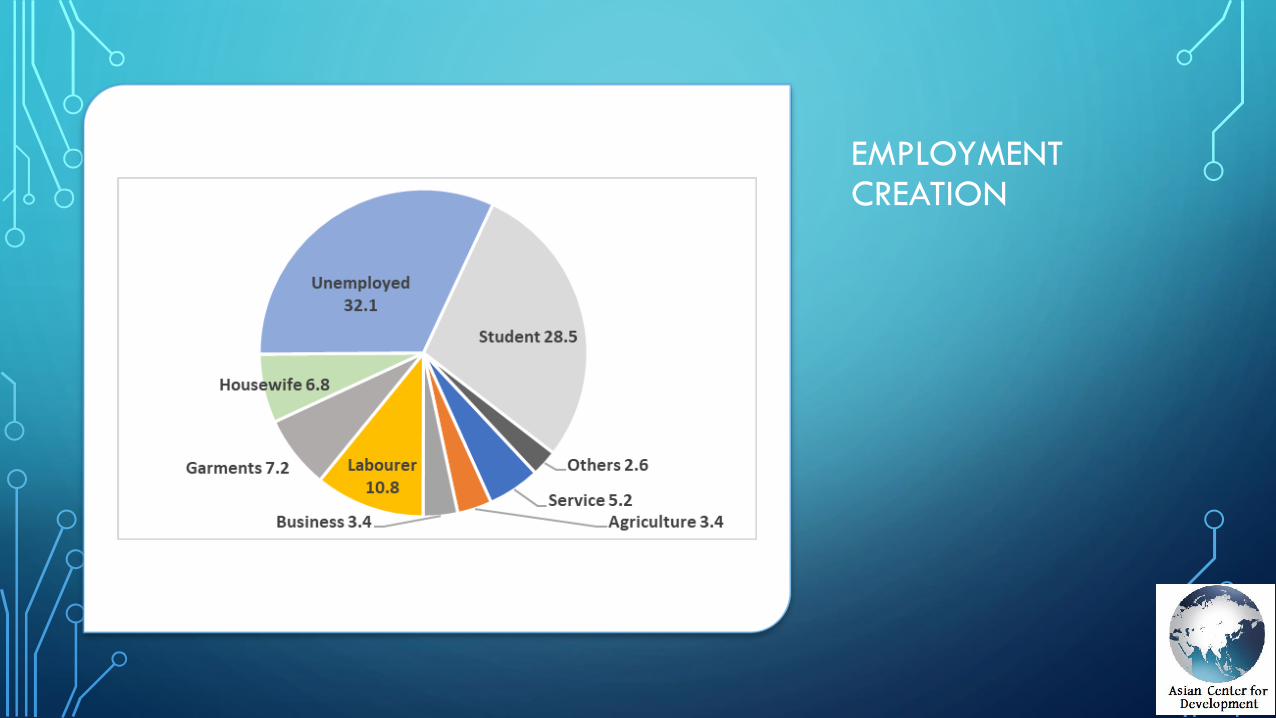
EMPLOYMENT CREATION
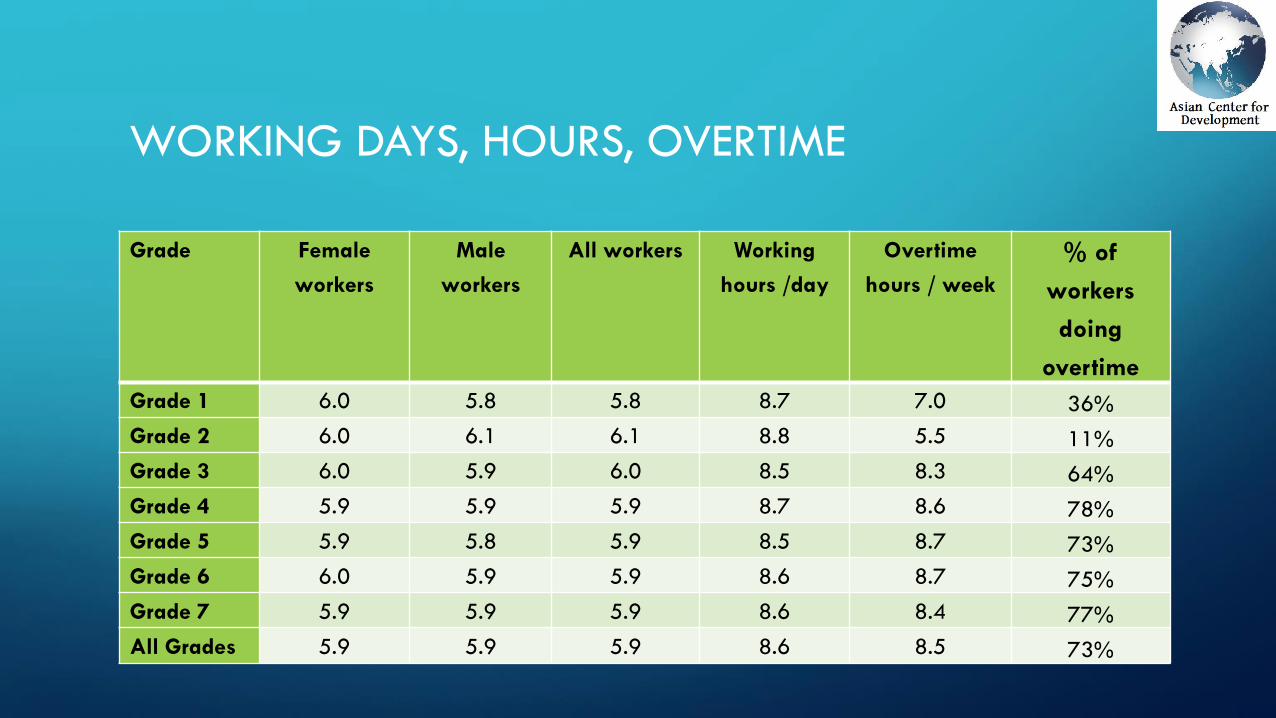
WORKING DAYS, HOURS, OVERTIME
Grade Female
workers
Male
workers
All workers Working
hours /day
Overtime
hours / week
% of
workers
doing
overtime
Grade 1 6.0 5.8 5.8 8.7 7.0 36%
Grade 2 6.0 6.1 6.1 8.8 5.5 11%
Grade 3 6.0 5.9 6.0 8.5 8.3 64%
Grade 4 5.9 5.9 5.9 8.7 8.6 78%
Grade 5 5.9 5.8 5.9 8.5 8.7 73%
Grade 6 6.0 5.9 5.9 8.6 8.7 75%
Grade 7 5.9 5.9 5.9 8.6 8.4 77%
All Grades 5.9 5.9 5.9 8.6 8.5 73%
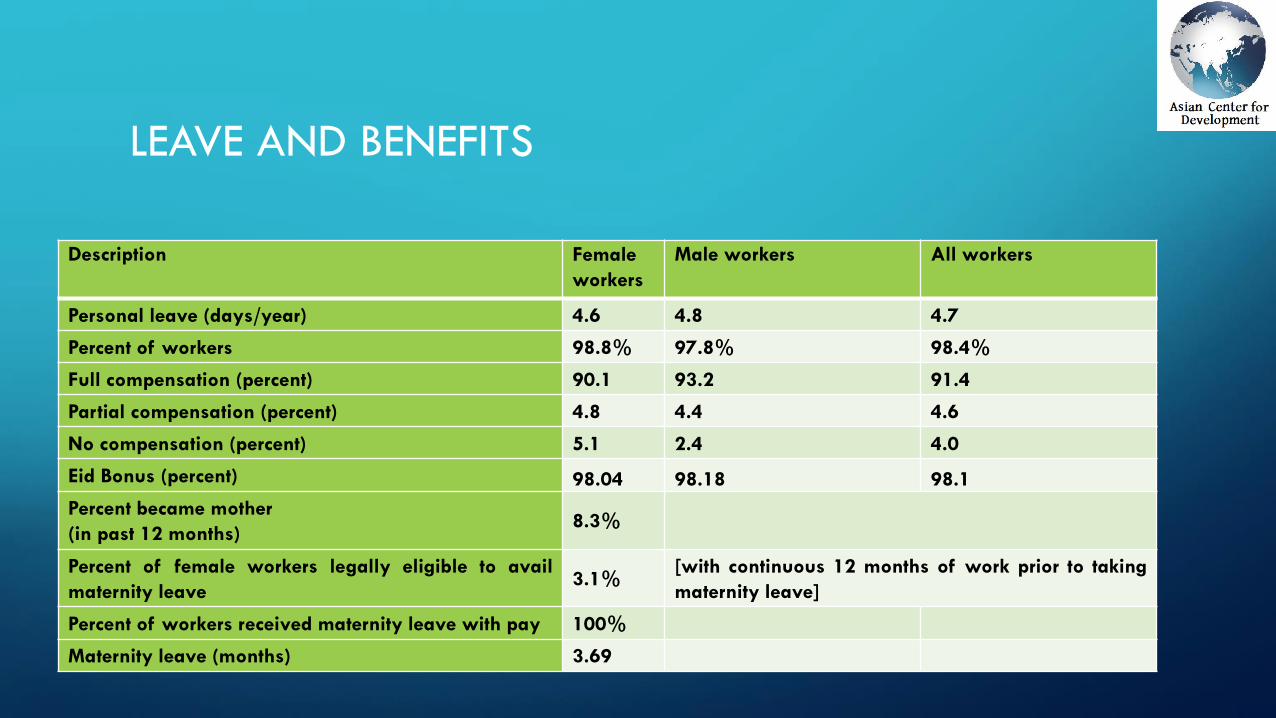
LEAVE AND BENEFITS
Description Female
workers
Male workers All workers
Personal leave (days/year) 4.6 4.8 4.7
Percent of workers 98.8% 97.8% 98.4%
Full compensation (percent) 90.1 93.2 91.4
Partial compensation (percent) 4.8 4.4 4.6
No compensation (percent) 5.1 2.4 4.0
Eid Bonus (percent) 98.04 98.18 98.1
Percent became mother
(in past 12 months)8.3%
Percent of female workers legally eligible to avail
maternity leave3.1%
[with continuous 12 months of work prior to taking
maternity leave]
Percent of workers received maternity leave with pay 100%
Maternity leave (months) 3.69
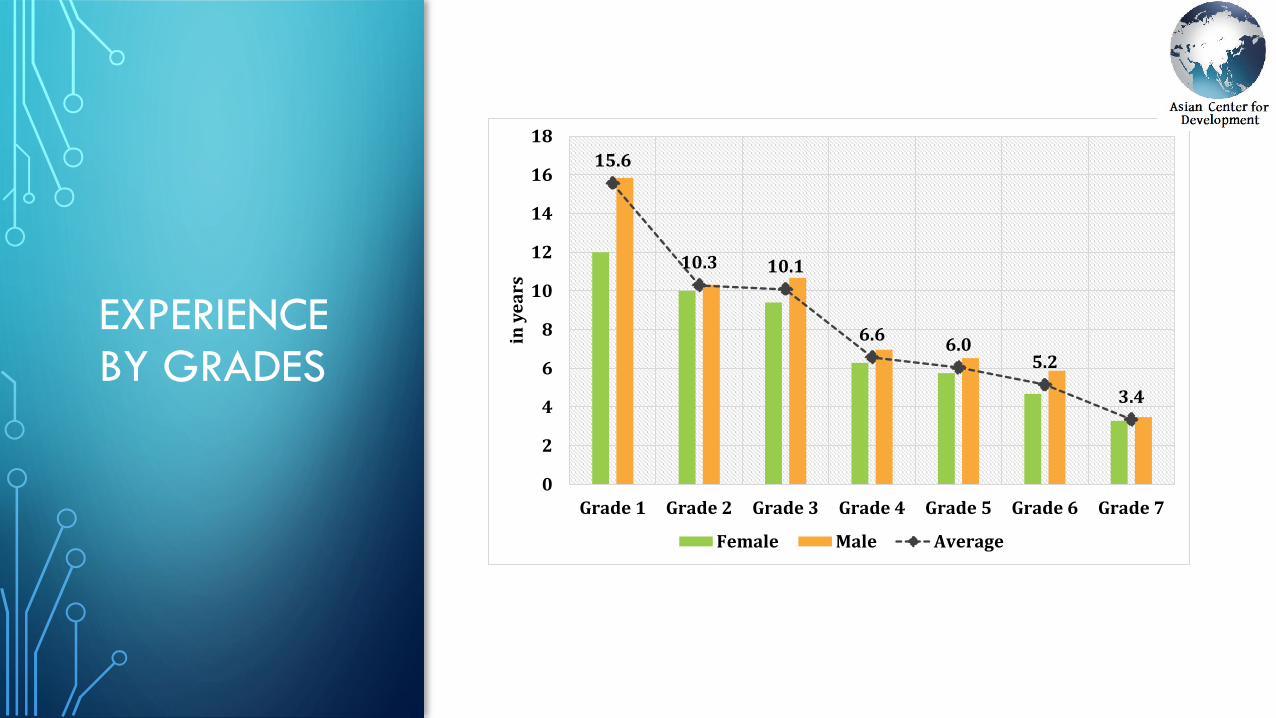
EXPERIENCE BY GRADES
15.6
10.3 10.1
6.66.0
5.2
3.4
0
2
4
6
8
10
12
14
16
18
Grade 1 Grade 2 Grade 3 Grade 4 Grade 5 Grade 6 Grade 7in
ye
ars
Female Male Average
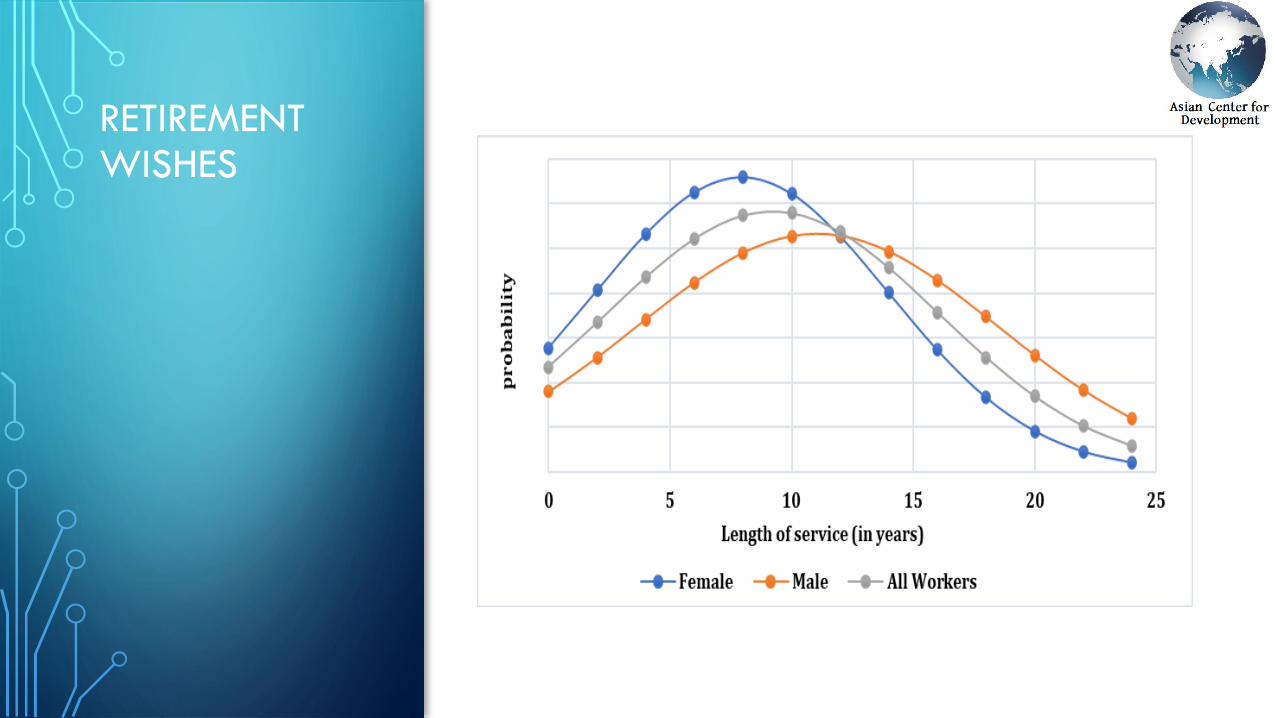
RETIREMENT WISHES
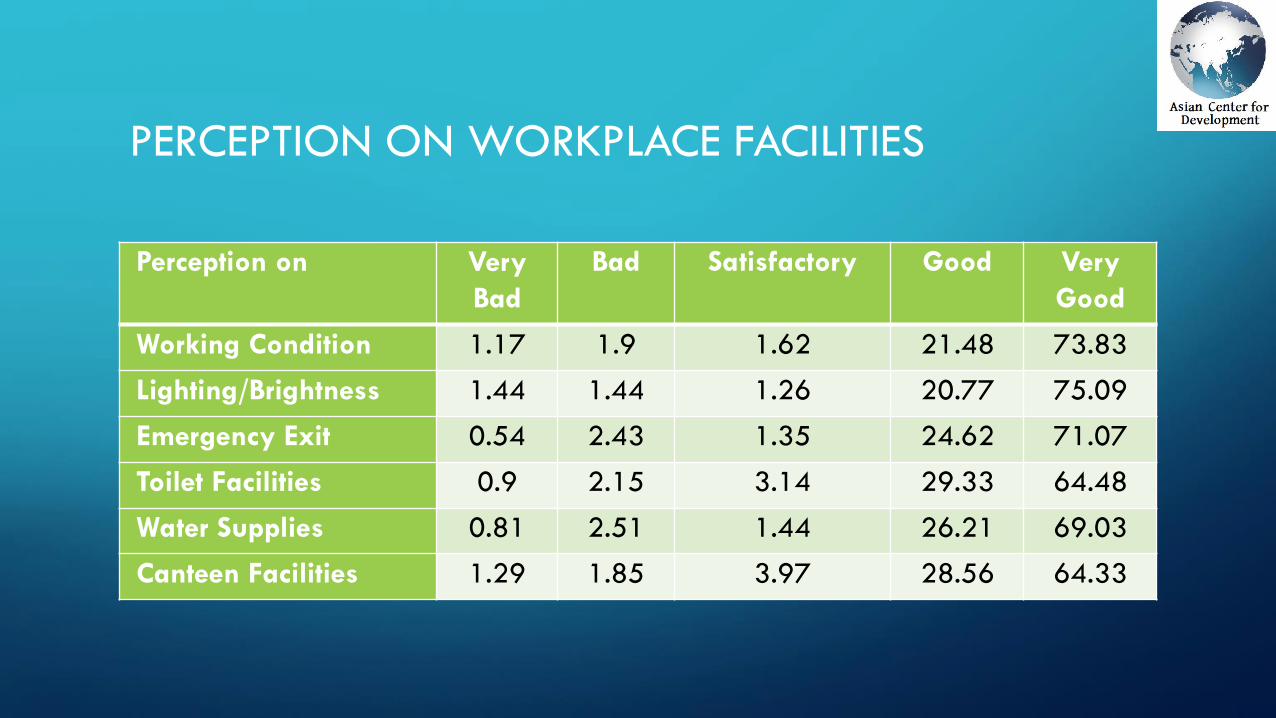
PERCEPTION ON WORKPLACE FACILITIES
Perception on Very
Bad
Bad Satisfactory Good Very
Good
Working Condition 1.17 1.9 1.62 21.48 73.83
Lighting/Brightness 1.44 1.44 1.26 20.77 75.09
Emergency Exit 0.54 2.43 1.35 24.62 71.07
Toilet Facilities 0.9 2.15 3.14 29.33 64.48
Water Supplies 0.81 2.51 1.44 26.21 69.03
Canteen Facilities 1.29 1.85 3.97 28.56 64.33
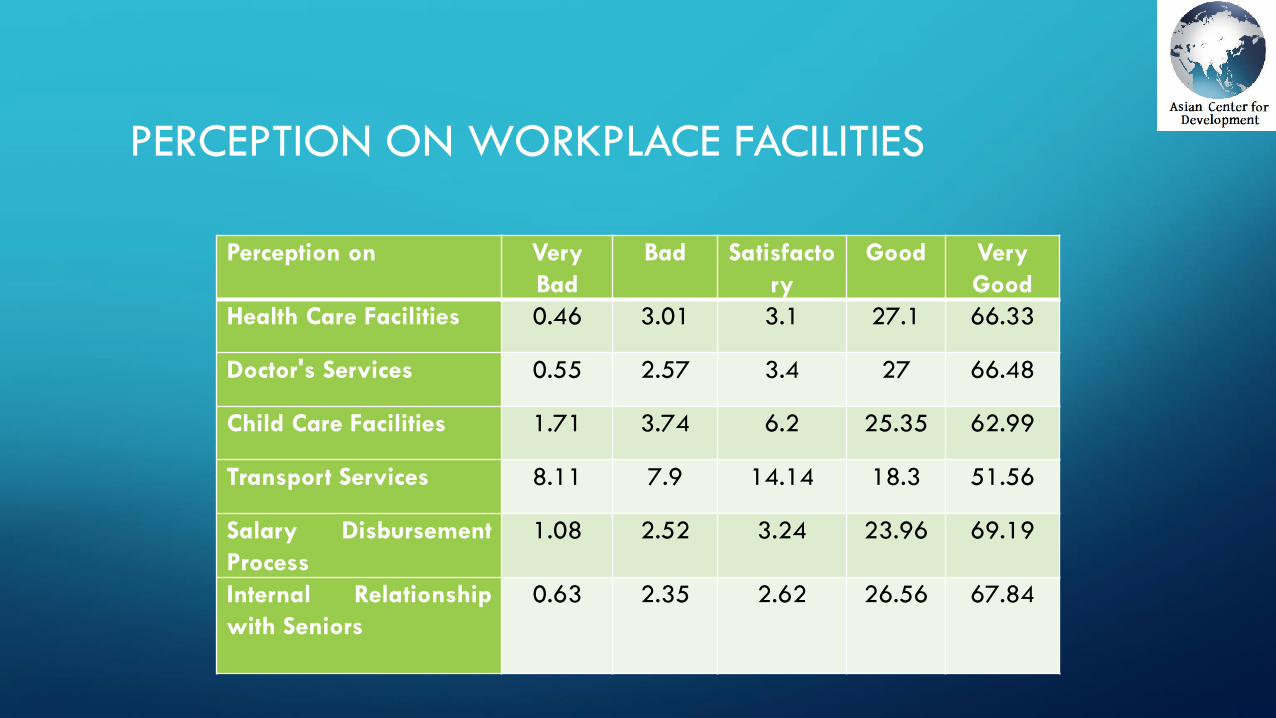
PERCEPTION ON WORKPLACE FACILITIES
Perception on Very
Bad
Bad Satisfacto
ry
Good Very
Good
Health Care Facilities 0.46 3.01 3.1 27.1 66.33
Doctor's Services 0.55 2.57 3.4 27 66.48
Child Care Facilities 1.71 3.74 6.2 25.35 62.99
Transport Services 8.11 7.9 14.14 18.3 51.56
Salary Disbursement
Process
1.08 2.52 3.24 23.96 69.19
Internal Relationship
with Seniors
0.63 2.35 2.62 26.56 67.84
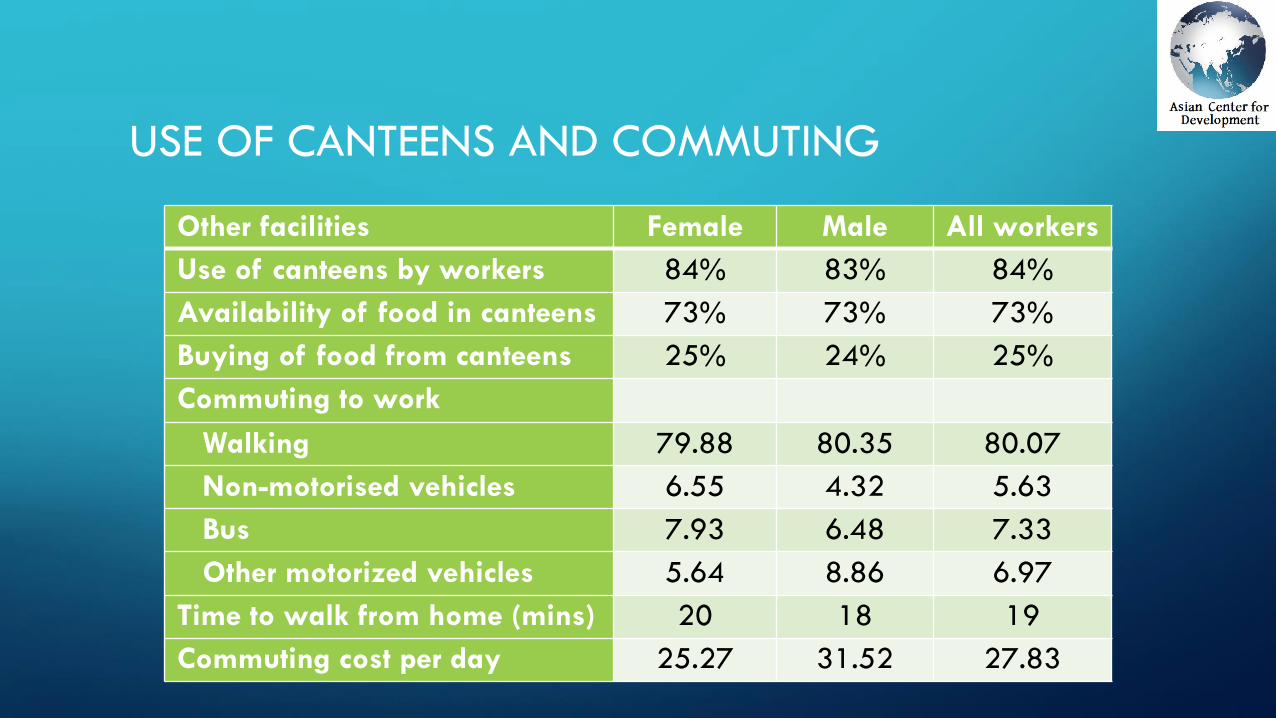
USE OF CANTEENS AND COMMUTING
Other facilities Female Male All workers
Use of canteens by workers 84% 83% 84%
Availability of food in canteens 73% 73% 73%
Buying of food from canteens 25% 24% 25%
Commuting to work
Walking 79.88 80.35 80.07
Non-motorised vehicles 6.55 4.32 5.63
Bus 7.93 6.48 7.33
Other motorized vehicles 5.64 8.86 6.97
Time to walk from home (mins) 20 18 19
Commuting cost per day 25.27 31.52 27.83
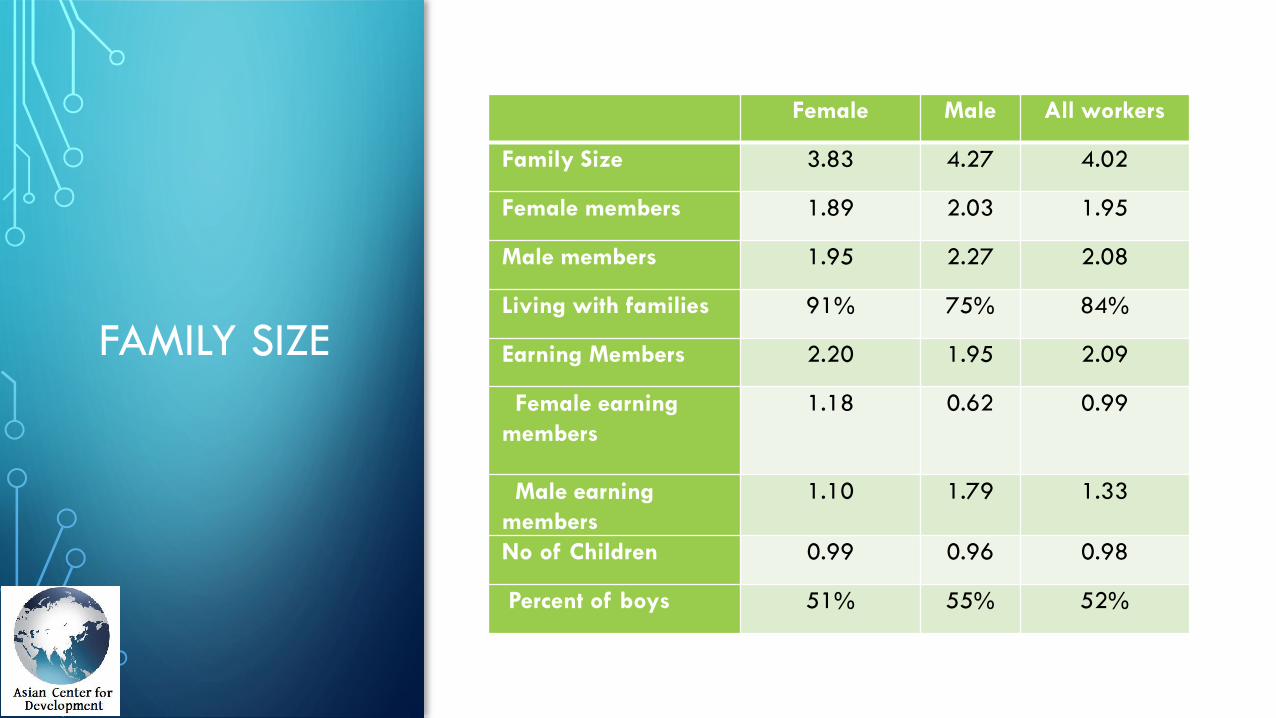
FAMILY SIZE
Female Male All workers
Family Size 3.83 4.27 4.02
Female members 1.89 2.03 1.95
Male members 1.95 2.27 2.08
Living with families 91% 75% 84%
Earning Members 2.20 1.95 2.09
Female earning
members
1.18 0.62 0.99
Male earning
members
1.10 1.79 1.33
No of Children 0.99 0.96 0.98
Percent of boys 51% 55% 52%
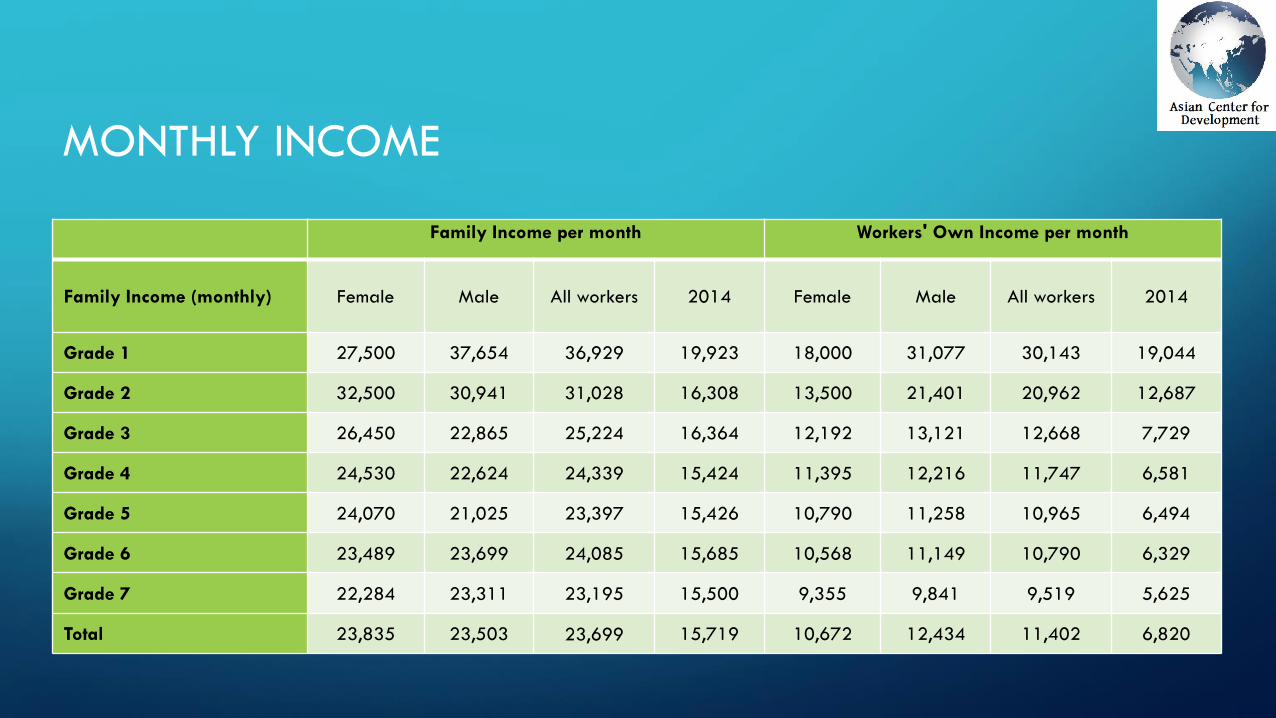
MONTHLY INCOME
Family Income per month Workers' Own Income per month
Family Income (monthly) Female Male All workers 2014 Female Male All workers 2014
Grade 1 27,500 37,654 36,929 19,923 18,000 31,077 30,143 19,044
Grade 2 32,500 30,941 31,028 16,308 13,500 21,401 20,962 12,687
Grade 3 26,450 22,865 25,224 16,364 12,192 13,121 12,668 7,729
Grade 4 24,530 22,624 24,339 15,424 11,395 12,216 11,747 6,581
Grade 5 24,070 21,025 23,397 15,426 10,790 11,258 10,965 6,494
Grade 6 23,489 23,699 24,085 15,685 10,568 11,149 10,790 6,329
Grade 7 22,284 23,311 23,195 15,500 9,355 9,841 9,519 5,625
Total 23,835 23,503 23,699 15,719 10,672 12,434 11,402 6,820
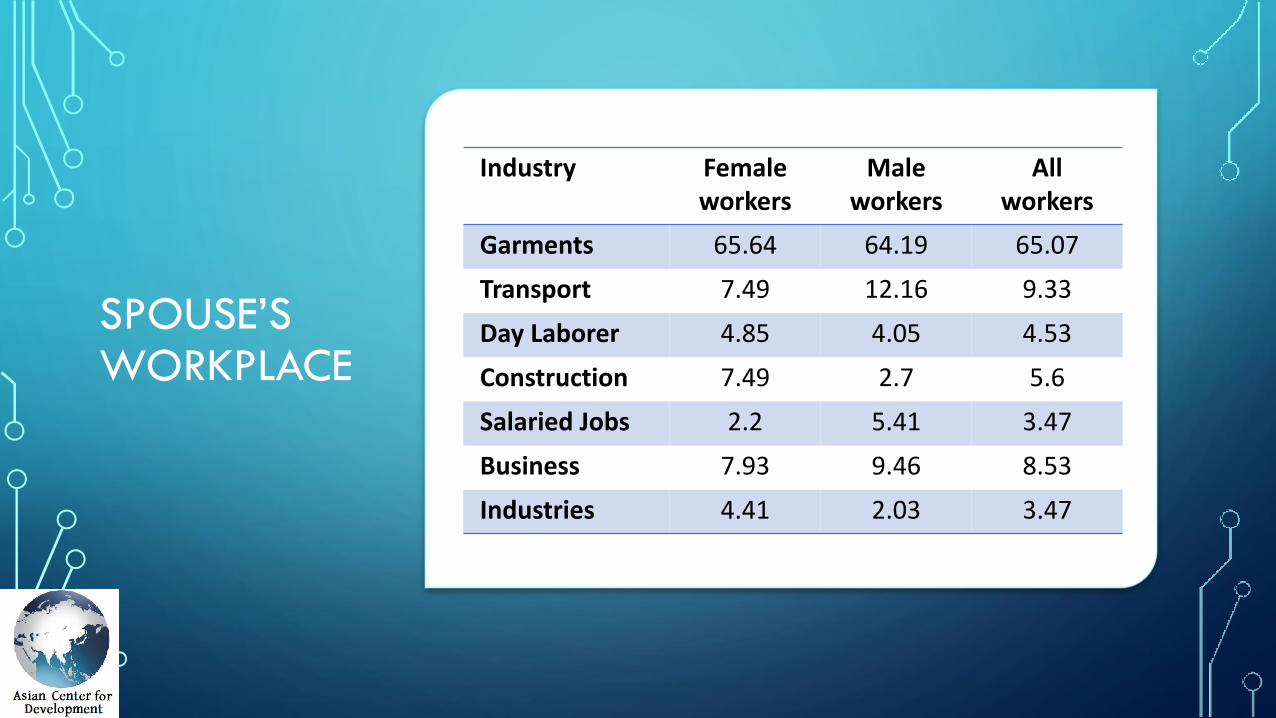
SPOUSE’S WORKPLACE
Industry Female workers
Male workers
All workers
Garments 65.64 64.19 65.07
Transport 7.49 12.16 9.33
Day Laborer 4.85 4.05 4.53
Construction 7.49 2.7 5.6
Salaried Jobs 2.2 5.41 3.47
Business 7.93 9.46 8.53
Industries 4.41 2.03 3.47
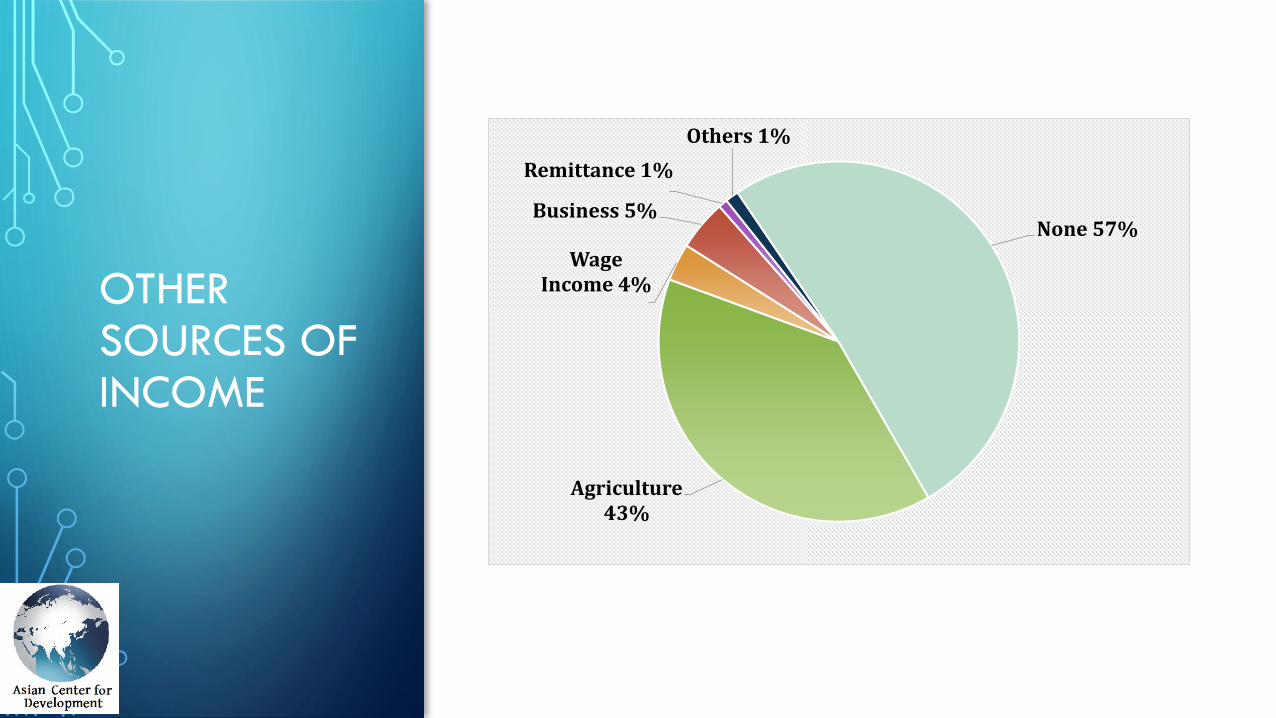
OTHER SOURCES OF INCOME
Agriculture43%
Wage Income 4%
Business 5%
Remittance 1%
Others 1%
None 57%
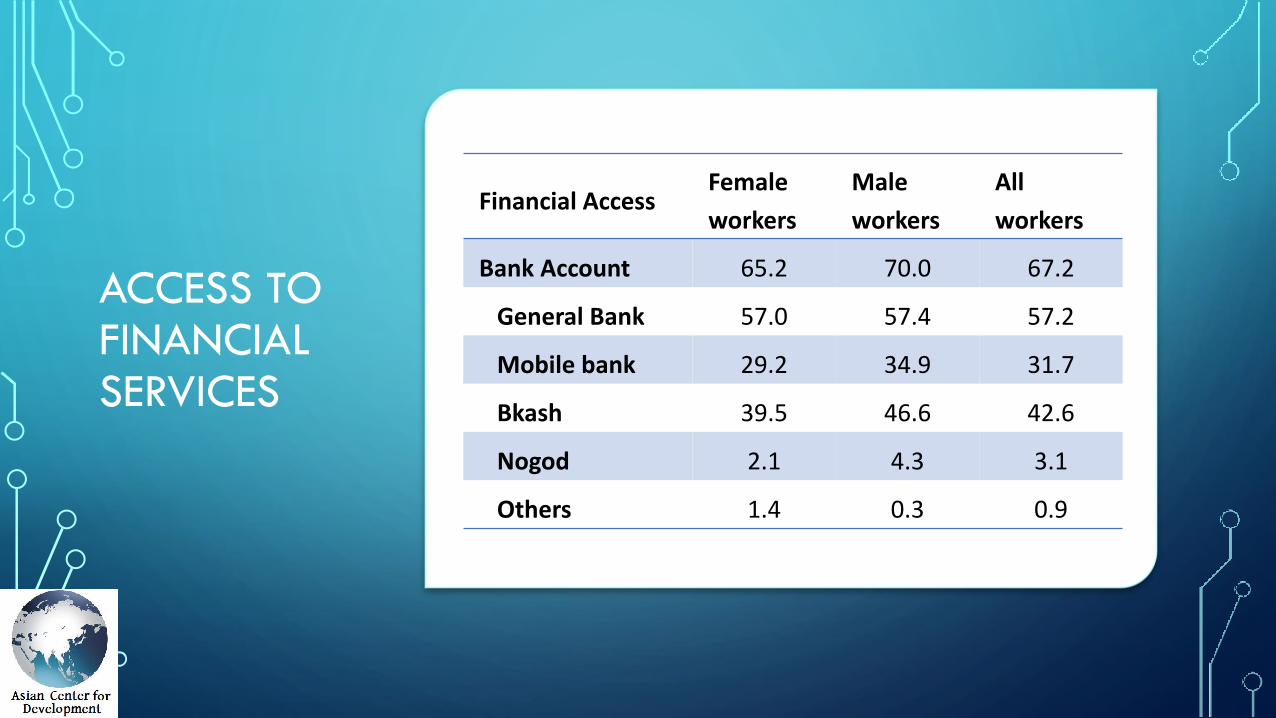
ACCESS TO FINANCIAL SERVICES
Financial AccessFemale
workers
Male
workers
All
workers
Bank Account 65.2 70.0 67.2
General Bank 57.0 57.4 57.2
Mobile bank 29.2 34.9 31.7
Bkash 39.5 46.6 42.6
Nogod 2.1 4.3 3.1
Others 1.4 0.3 0.9
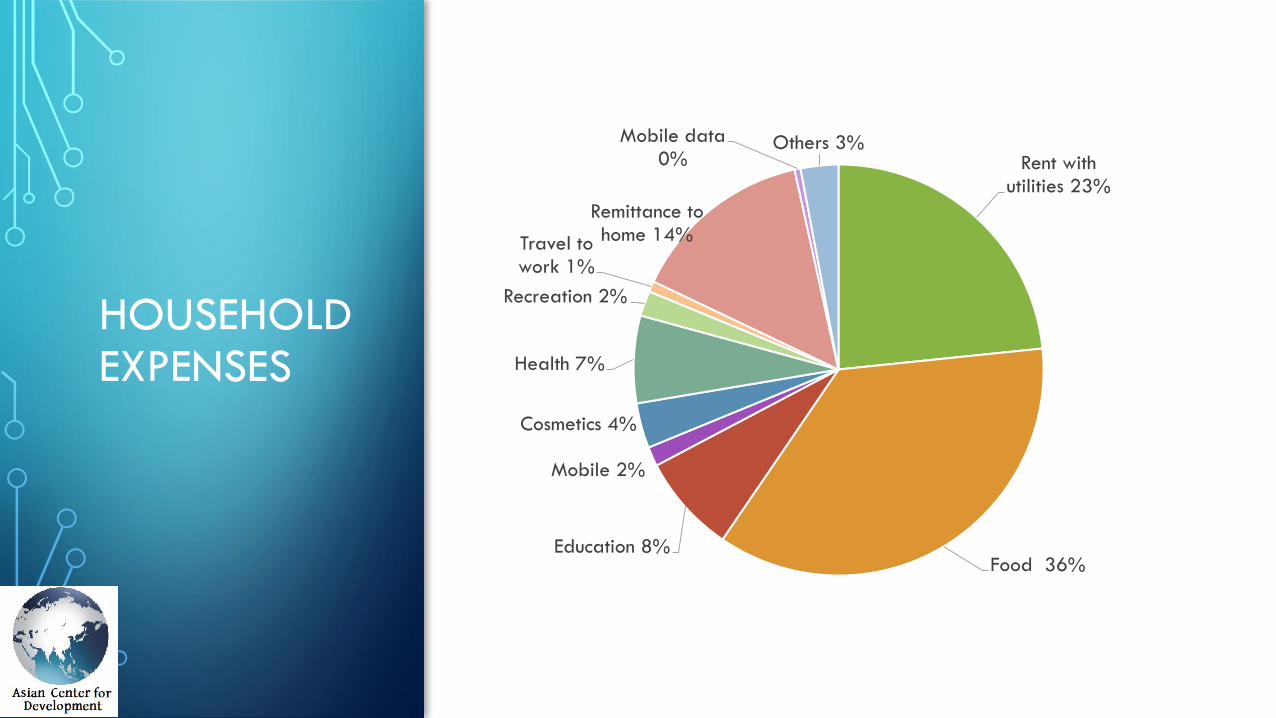
HOUSEHOLD EXPENSES
Rent with utilities 23%
Food 36%Education 8%
Mobile 2%
Cosmetics 4%
Health 7%
Recreation 2%
Travel to work 1%
Remittance to home 14%
Mobile data0%
Others 3%
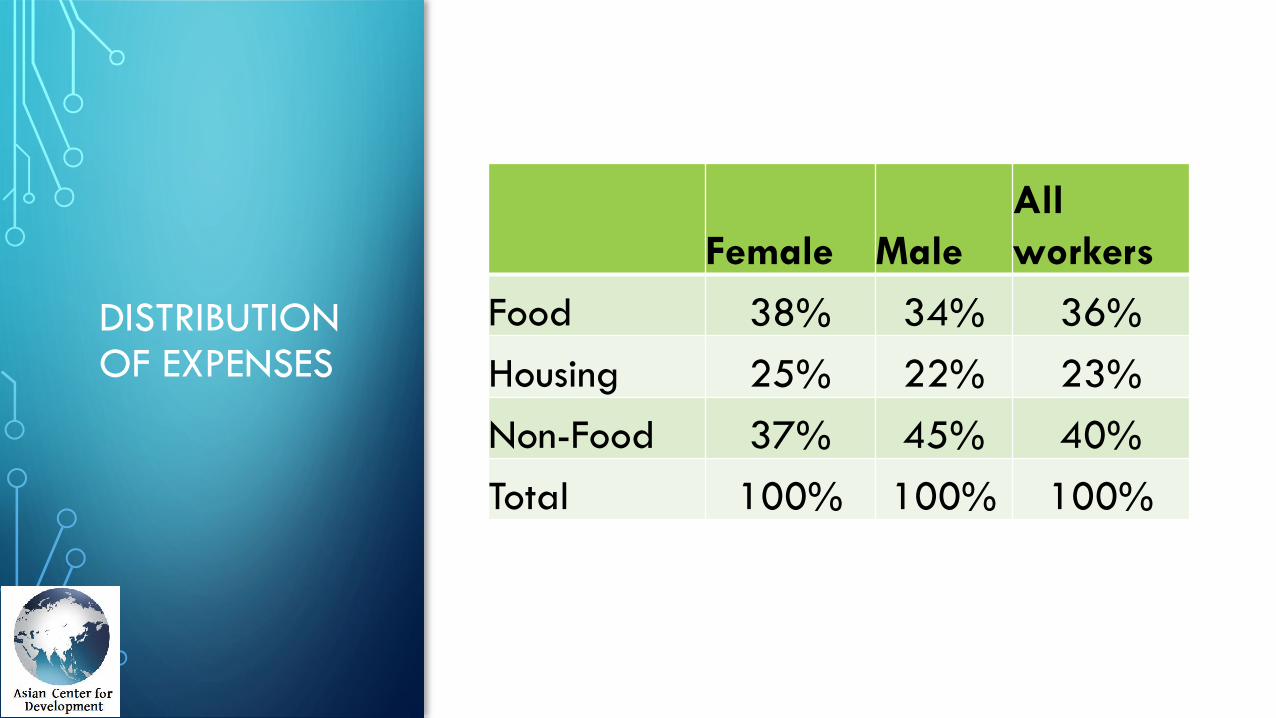
DISTRIBUTION OF EXPENSES
Female Male
All
workers
Food 38% 34% 36%
Housing 25% 22% 23%
Non-Food 37% 45% 40%
Total 100% 100% 100%
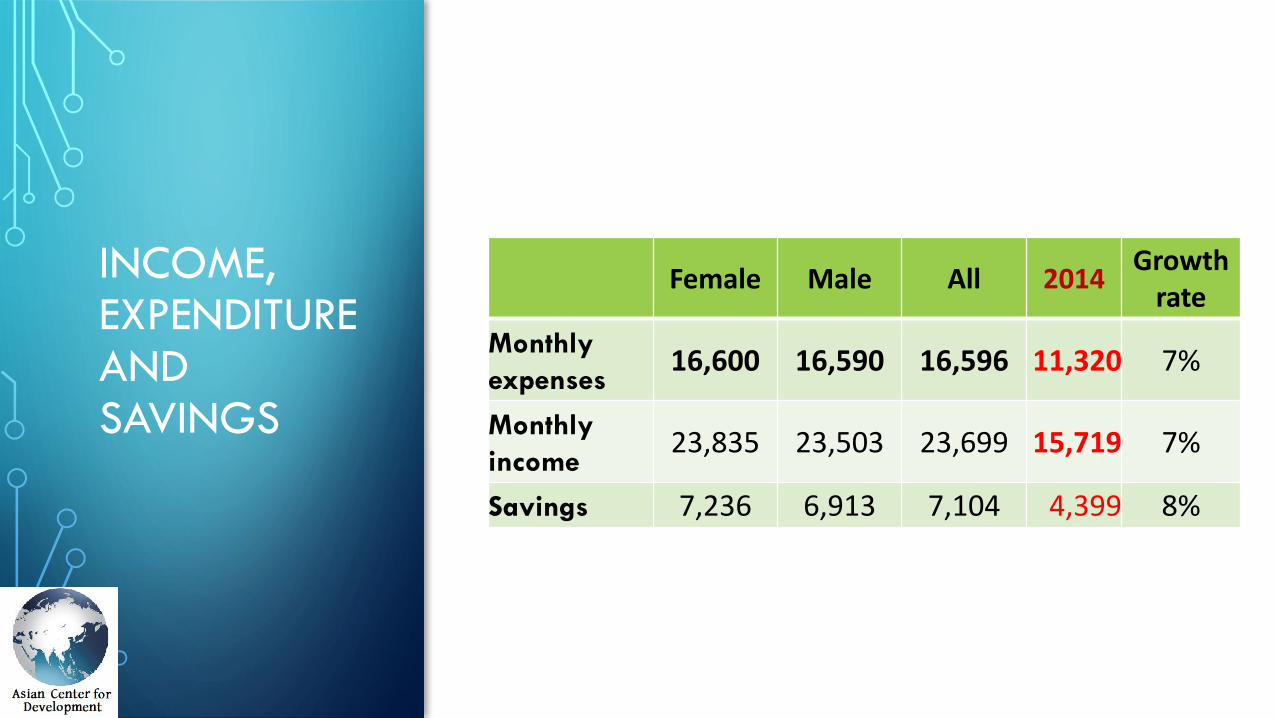
INCOME, EXPENDITURE AND SAVINGS
Female Male All 2014Growth
rate
Monthly
expenses16,600 16,590 16,596 11,320 7%
Monthly
income23,835 23,503 23,699 15,719 7%
Savings 7,236 6,913 7,104 4,399 8%
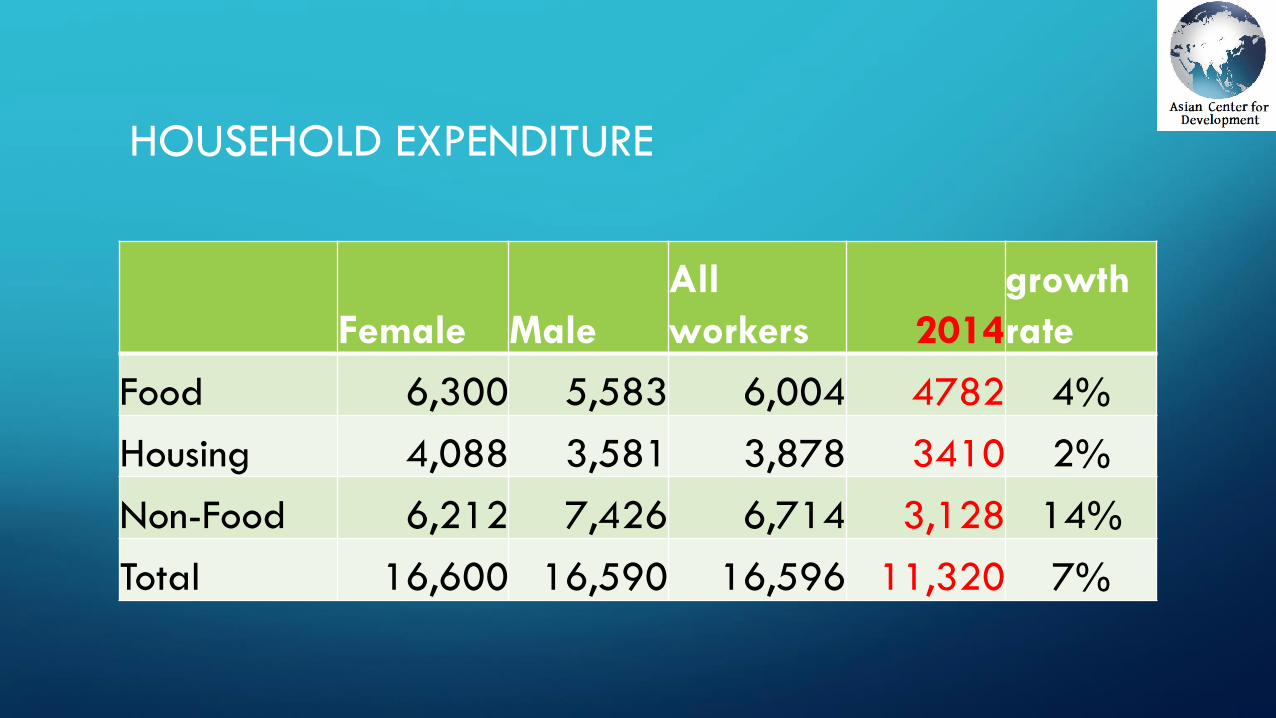
HOUSEHOLD EXPENDITURE
Female Male
All
workers 2014
growth
rate
Food 6,300 5,583 6,004 4782 4%
Housing 4,088 3,581 3,878 3410 2%
Non-Food 6,212 7,426 6,714 3,128 14%
Total 16,600 16,590 16,596 11,320 7%
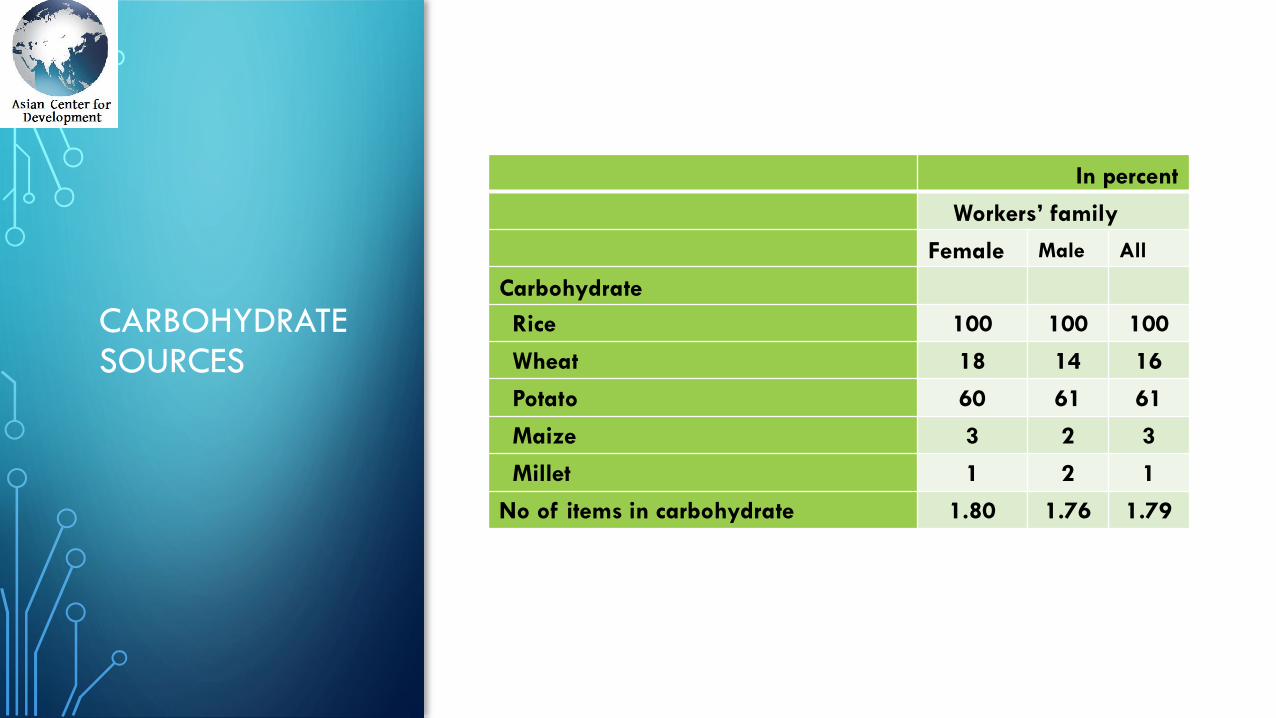
CARBOHYDRATE SOURCES
In percent
Workers’ family
Female Male All
Carbohydrate
Rice 100 100 100
Wheat 18 14 16
Potato 60 61 61
Maize 3 2 3
Millet 1 2 1
No of items in carbohydrate 1.80 1.76 1.79
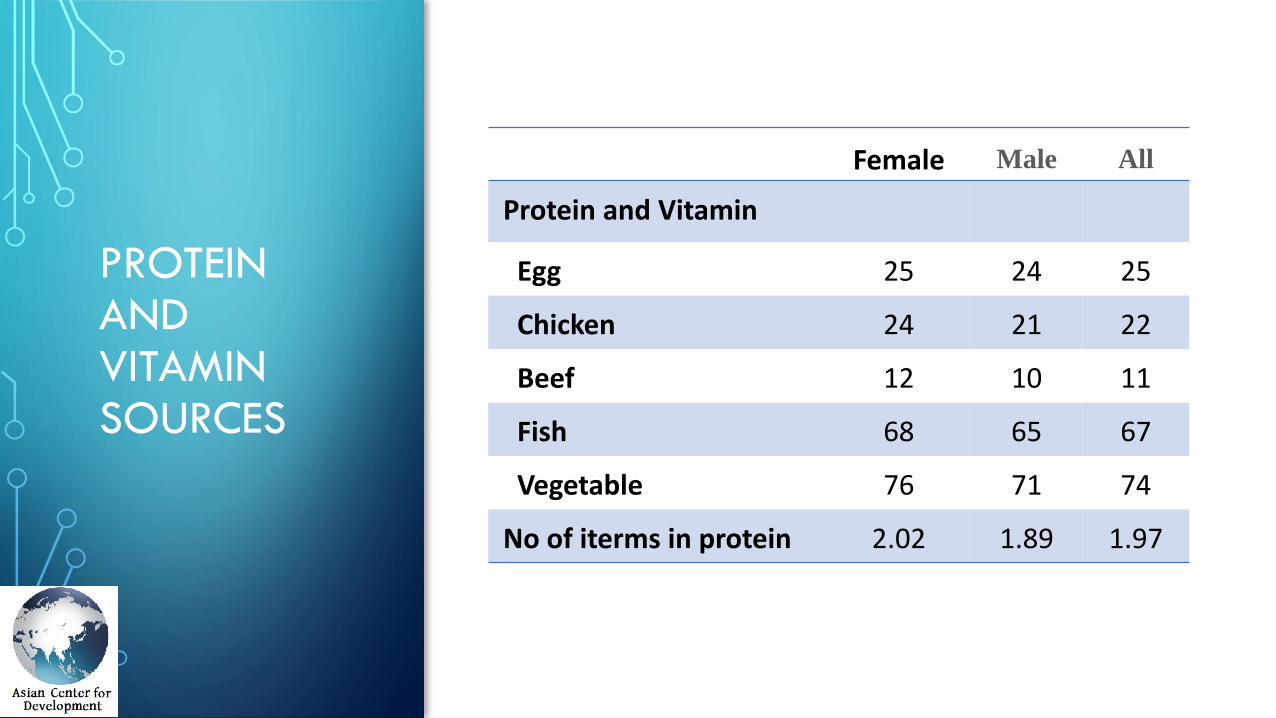
PROTEIN AND VITAMIN SOURCES
Female Male All
Protein and Vitamin
Egg 25 24 25
Chicken 24 21 22
Beef 12 10 11
Fish 68 65 67
Vegetable 76 71 74
No of iterms in protein 2.02 1.89 1.97
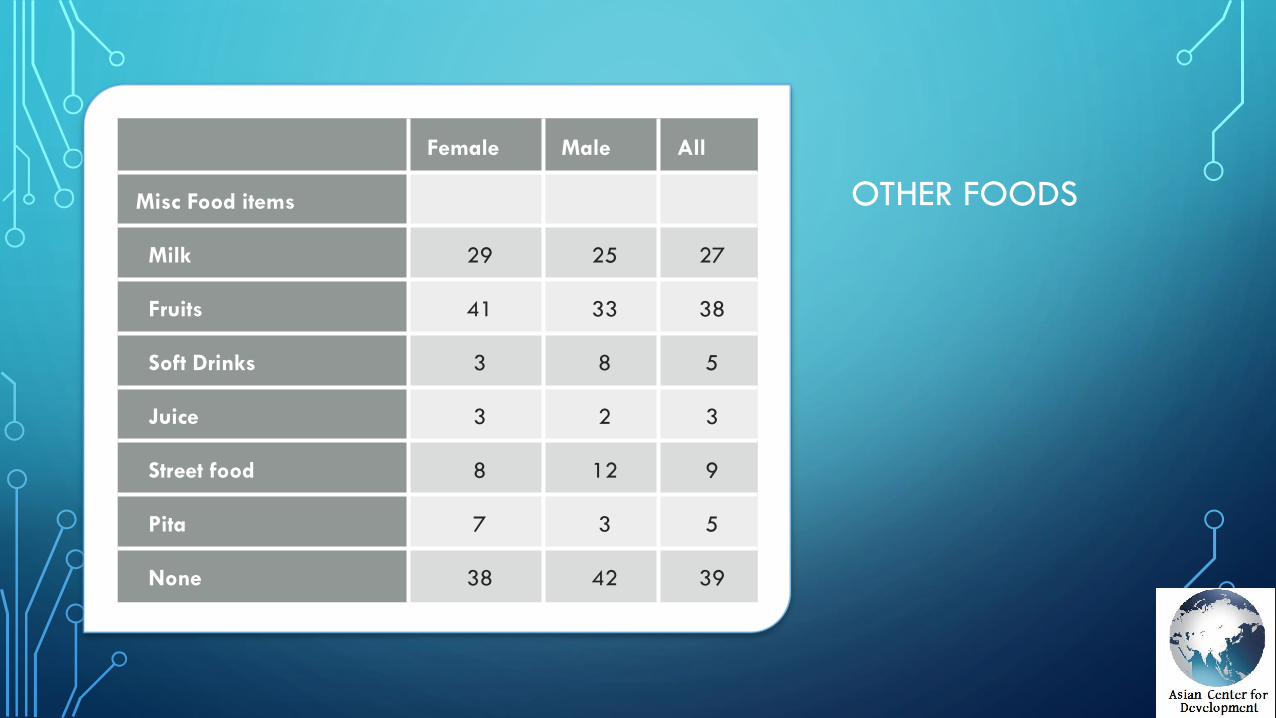
OTHER FOODS
Female Male All
Misc Food items
Milk 29 25 27
Fruits 41 33 38
Soft Drinks 3 8 5
Juice 3 2 3
Street food 8 12 9
Pita 7 3 5
None 38 42 39
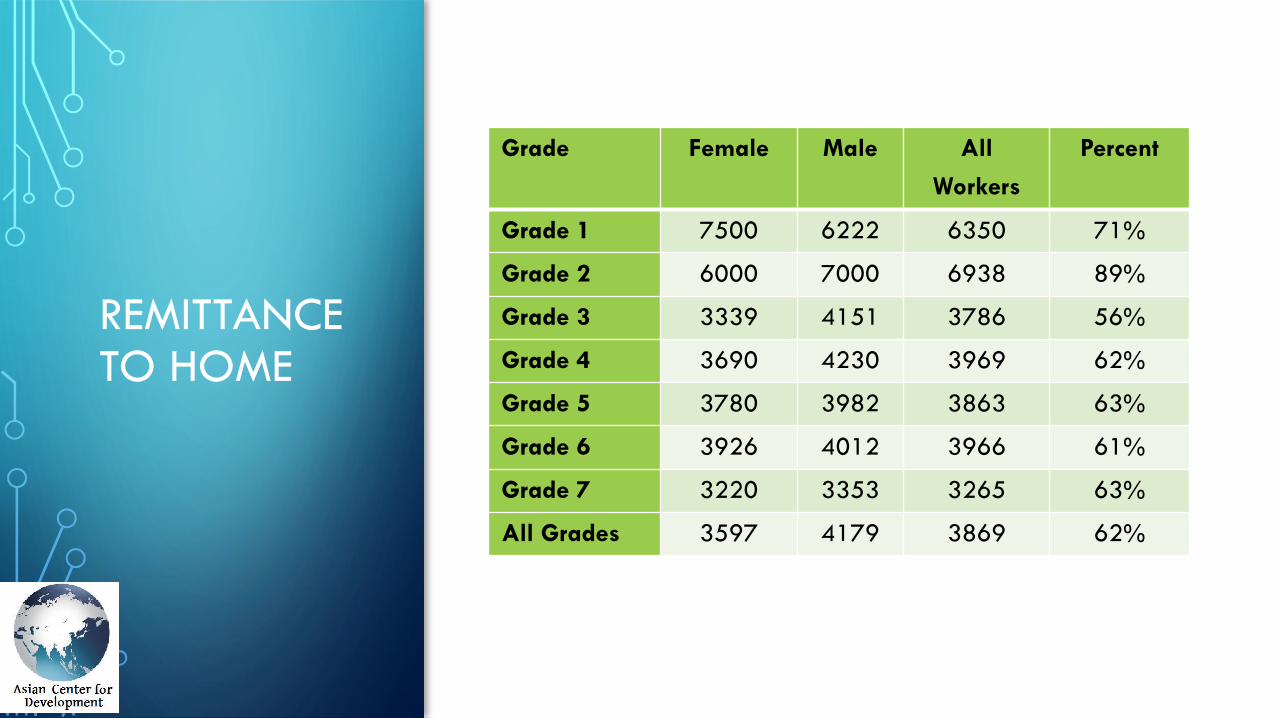
REMITTANCE TO HOME
Grade Female Male All
Workers
Percent
Grade 1 7500 6222 6350 71%
Grade 2 6000 7000 6938 89%
Grade 3 3339 4151 3786 56%
Grade 4 3690 4230 3969 62%
Grade 5 3780 3982 3863 63%
Grade 6 3926 4012 3966 61%
Grade 7 3220 3353 3265 63%
All Grades 3597 4179 3869 62%
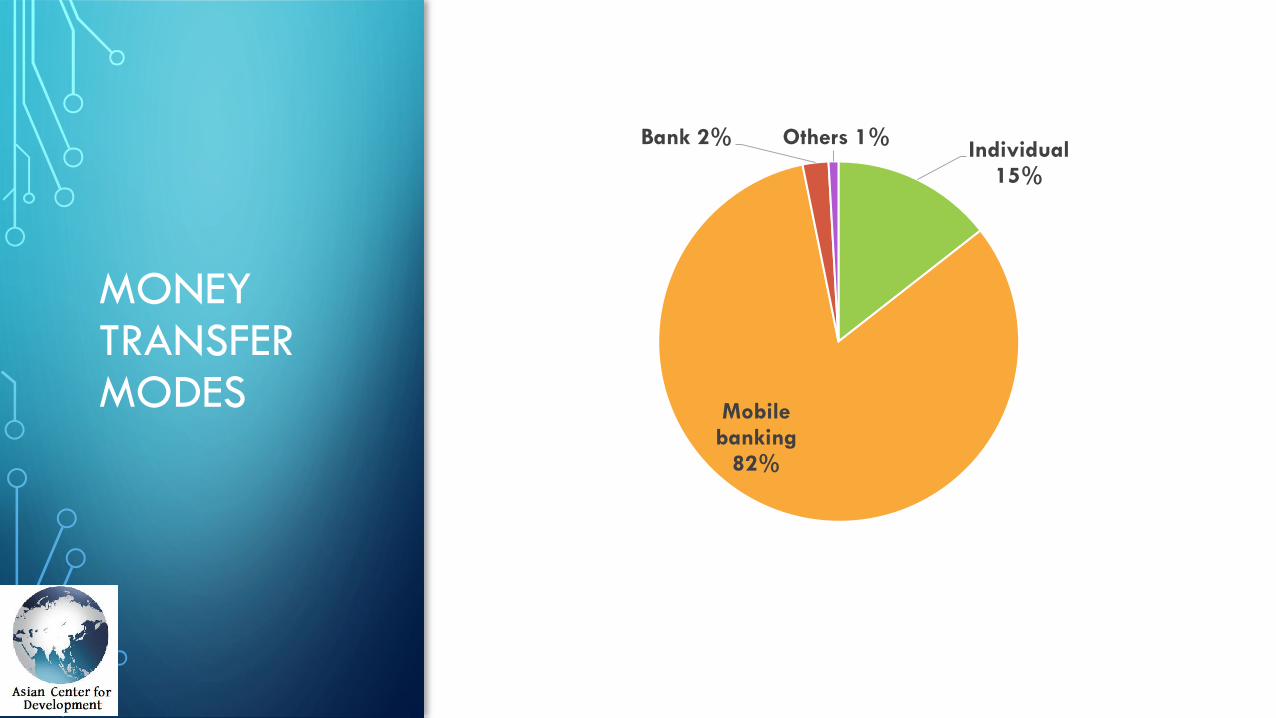
MONEY TRANSFER MODES
Individual15%
Mobile banking
82%
Bank 2% Others 1%
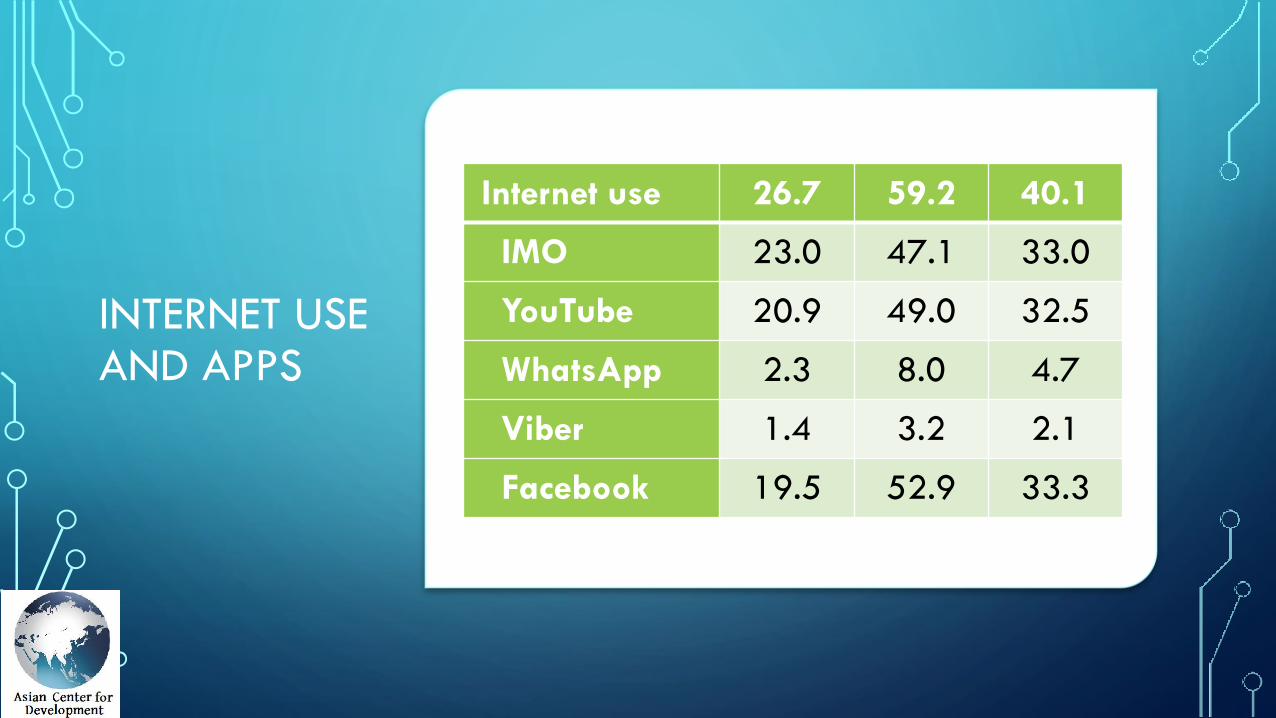
INTERNET USE AND APPS
Internet use 26.7 59.2 40.1
IMO 23.0 47.1 33.0
YouTube 20.9 49.0 32.5
WhatsApp 2.3 8.0 4.7
Viber 1.4 3.2 2.1
Facebook 19.5 52.9 33.3
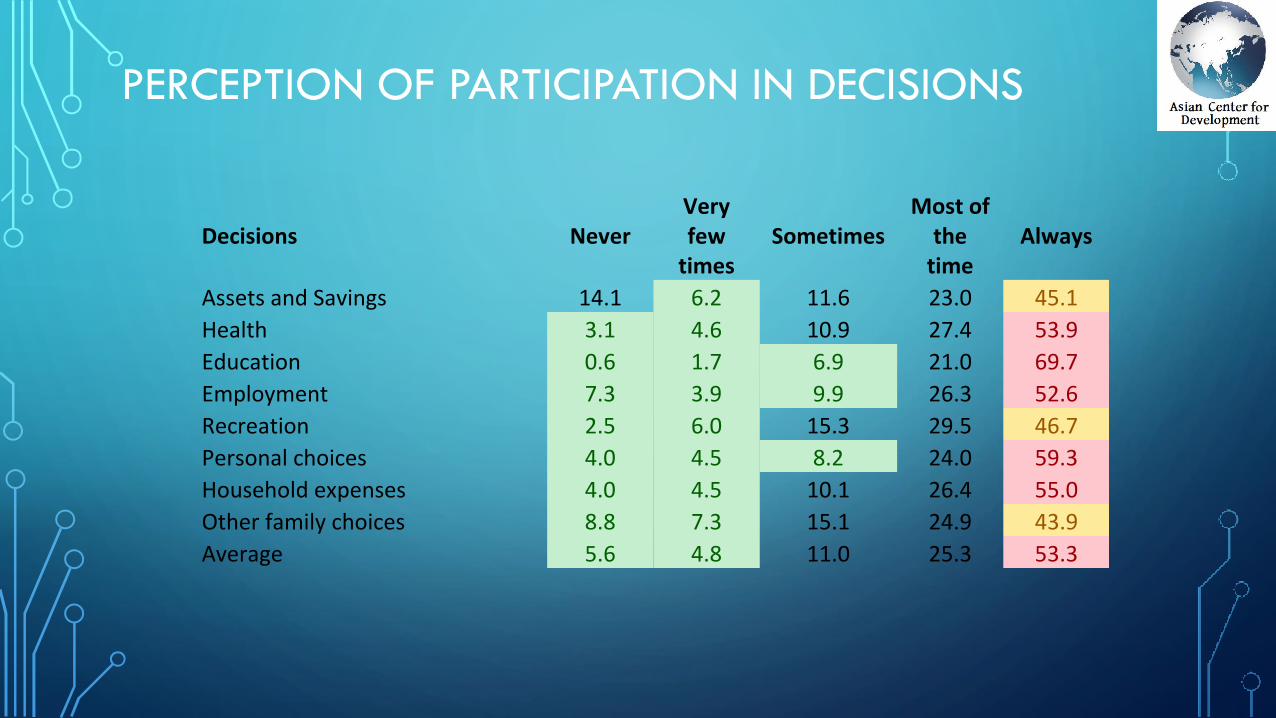
PERCEPTION OF PARTICIPATION IN DECISIONS
Decisions Never Very few
times Sometimes
Most of the
time Always
Assets and Savings 14.1 6.2 11.6 23.0 45.1
Health 3.1 4.6 10.9 27.4 53.9
Education 0.6 1.7 6.9 21.0 69.7
Employment 7.3 3.9 9.9 26.3 52.6
Recreation 2.5 6.0 15.3 29.5 46.7
Personal choices 4.0 4.5 8.2 24.0 59.3
Household expenses 4.0 4.5 10.1 26.4 55.0
Other family choices 8.8 7.3 15.1 24.9 43.9
Average 5.6 4.8 11.0 25.3 53.3