Embed Size (px)
Citation preview
Presentation for Set 4: Day Two15 November 2016
COMMISSION OF INQUIRY INTO HIGHER EDUCATION AND TRAINING:
STUDENT FUNDING

Presentation OverviewEligibility for NSFAS funding1
The NSFAS means test2
3 Funding to universities and TVETs
4 Different funding programmes
5 A detailed look at the student centred model
6 Measuring impact
7 Questions
Eligibility for NSFAS funding
How is this defined and differentiated between
Universities and TVET colleges?
Exec Coaching
Delegations
Staff sessions
TONEFRO
M THE
TOP
BUILDING
A TEAM
ETHOSSMF
PMO
NCOs
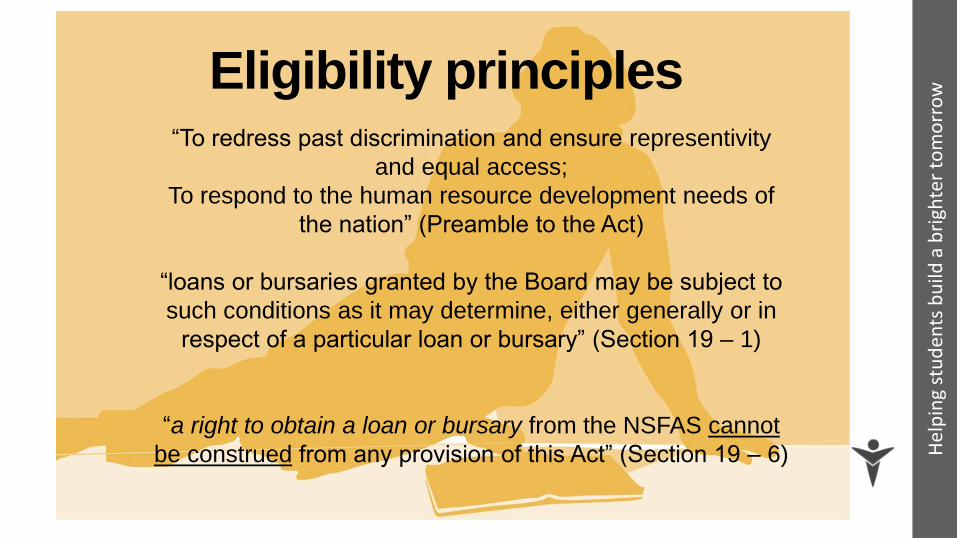
Eligibility principles“To redress past discrimination and ensure representivity
and equal access;
To respond to the human resource development needs of
the nation” (Preamble to the Act)
“loans or bursaries granted by the Board may be subject to
such conditions as it may determine, either generally or in
respect of a particular loan or bursary” (Section 19 – 1)
“a right to obtain a loan or bursary from the NSFAS cannot
be construed from any provision of this Act” (Section 19 – 6) Hel
pin
g st
ud
ents
bu
ild a
bri
ghte
r to
mo
rro
w

Two-pronged core eligibility criteria4
Financial Need
• Targeting tool – means testing recognized as a legitimate mechanism for determining who should receive benefits from the State e.g financial aid.
• Multi-purpose – differentiate those that need the financial support the most from those who require it the least PLUS determine how much support is needed.
• Affordability – In line with values, NSFAS aims to offer affordable solutions for students to study at public universities and TVET colleges
Academic potential
• What does the Act provide – “if the borrower does not perform satisfactorily in his or her studies, the Board may terminate the granting of finance ….”.
• Sufficiency – for all first-time entering students, NSFAS recognises that the academic admission of students to a higher education programme is sufficient as an indicator of “potential to succeed”.
• Reasonableness – Funding made available should continue to be allocated only to those making sufficient academic progress to complete within 2 years of regulation time (N+2).
• Minimum requirement – NSFAS set a course pass rate of 50% for continued funding, but many institutions have adopted different practices.
Acc
essi
bili
ty
Tra
nsp
aren
cy
Aff
ord
abili
ty
Rel
iab
ility
A
uth
enti
city
“Aim of the NSFAS is to provide financial aid to eligible students who meet the criteria for admission to a higher education programme.”
(Section 2 – 2)

Eligible
South African citizens only, registered to
study for an accredited, funded programme at a South African public
university or TVET college.
Specific funders, at their discretion, may fund students to do courses at Private Institutions
UNDERGRADUATES studying towards
their first higher education qualification, or studying for a
postgraduate qualification required in order to practice in a professional
field (e.g. PGCE, LLB); unless funder determines otherwise
CORE:
Student is able to demonstrate potential for academic success, and
that he/she is financially needy.
Not eligible
Students who have already graduated from a first undergraduate degree or
diploma (regardless of whether or not this was funded by NSFAS)
OTHER FUNDING:
Students who have received loans, bursaries or scholarships from non-NSFAS sources
that cover the full cost of study
EXCLUSIONS:
General rule: no Btech’s (but list of those that can be funded in Handbook);
No short courses or
qualifications/courses that are non-degree/diploma purposes
Eligibility for
financial aid
SPECIFIED AS PART OF THE
HANDBOOK
Not all funders apply the same
eligibility criteria
Pre-selected students by some
donors may not adopt all these
criteria
Other funders that have narrower
criteria
Pages 62 – 68 (2016 edition)
Hel
pin
g st
ud
ents
bu
ild a
bri
ghte
r to
mo
rro
w
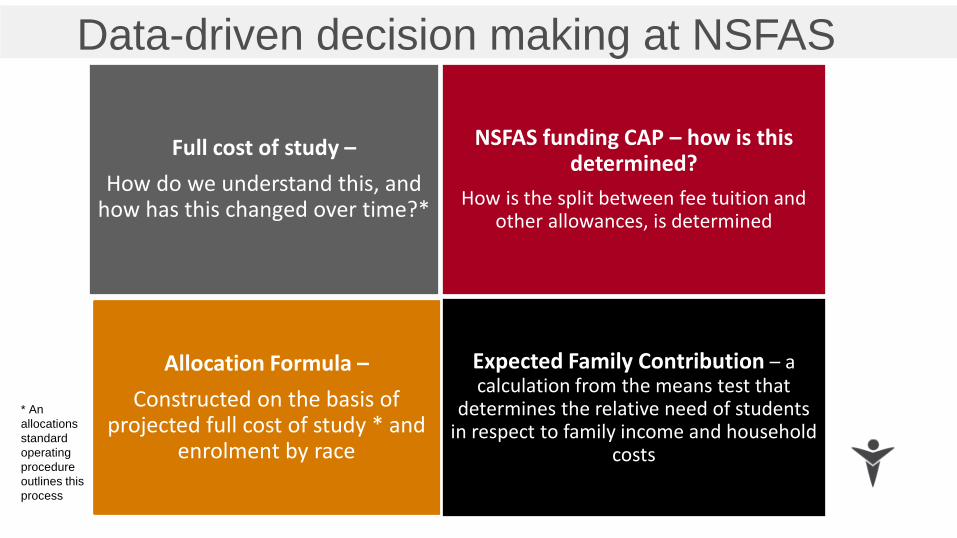
Full cost of study –
How do we understand this, and how has this changed over time?*
NSFAS funding CAP – how is this determined?
How is the split between fee tuition and other allowances, is determined
Allocation Formula –
Constructed on the basis of projected full cost of study * and
enrolment by race
Expected Family Contribution – a calculation from the means test that
determines the relative need of students in respect to family income and household
costs
Data-driven decision making at NSFAS
* An
allocations
standard
operating
procedure
outlines this
process

The full cost of
study (FCS) and
the NSFAS cap
FCS used as a projection of the following year’s likely academic cost for the allocation formula and the calculation of the NSFAS capped amount – a “calculated estimate of what it will cost a student to study at university for one year” –expanded over time to include wider range of costs
Once funding decision made, FCS is used to refer to the cost of study inclusive of actual fee account charges and allowances
NSFAS has data as far back as 2005 on these estimates.
Accessibility Transparency Affordability Reliability Authenticity
WITWATERSRAND R 46 802,00 R 9 340,00 R 33 660,00 R 19 008,00 R 108 810,00
CAPE TOWN R 52 237,00 R 42 398,00 R 15 667,00 R 3 300,00 R 113 602,00
JOHANNESBURG R 24 929,00 R 24 854,00 R 4 756,00 R 3 225,00 R 57 764,00
PRETORIA R 37 900,00 R 33 200,00 R 28 800,00 R 99 900,00
RHODES R 38 950,00 R 1 650,00 R 49 300,00 R 5 000,00 R 94 900,00
DURBAN R 27 635,05 R 21 615,25 R 22 320,00 R 9 600,00 R 81 170,30
VENDA R 28 543,22 R 2 720,00 R 17 590,00 R 24 410,00 R 5 000,00 R 78 263,22
NELSON MANDELA R 25 710,00 R 950,00 R 23 740,00 R 17 610,00 R 3 000,00 R 71 010,00
LIMPOPO R 24 431,00 R 5 000,00 R 14 500,00 R 21 622,00 R 4 000,00 R 69 553,00
FORT HARE R 28 413,00 R 2 630,00 R 26 000,00 R 10 000,00 R 4 000,00 R 71 043,00
STELLENBOSCH R 39 235,00 R 32 755,00 R 15 000,00 R 86 990,00
FREE STATE R 21 774,48 R 950,00 R 29 045,00 R 16 000,00 R 5 000,00 R 72 769,48
WESTERN CAPE R 22 400,00 R 1 210,00 R 17 710,00 R 20 000,00 R 6 000,00 R 67 320,00
NORTH-WEST R 37 810,00 R 1 560,00 R 17 500,00 R 12 000,00 R 8 000,00 R 76 870,00
KWAZULU NATAL R 31 710,91 R 23 265,00 R 17 500,00 R 5 000,00 R 77 475,91
CENTRAL R 19 502,93 R 858,00 R 18 020,00 R 18 000,00 R 5 000,00 R 61 380,93
VAAL R 20 238,00 R 870,00 R 20 611,00 R 22 300,00 R 4 000,00 R 68 019,00
CAPE PENINSULA R 19 177,00 R 745,00 R 23 409,00 R 2 000,00 R 3 500,00 R 48 831,00
TSHWANE R 18 356,88 R 1 500,00 R 13 331,48 R 20 564,00 R 4 600,00 R 58 352,35
MANGOSUTHU R 21 612,00 R 2 000,00 R 25 360,00 R 19 008,00 R 9 500,00 R 77 480,00
WALTER SISULU R 20 220,00 R 23 498,00 R 10 000,00 R 2 000,00 R 55 718,00
ZULULAND R 17 648,00 R 2 837,00 R 14 851,00 R 13 200,00 R 2 000,00 R 50 536,00
UNISA R 13 350,00 R 5 000,00 R 18 350,00
SPU R 24 125,97 R 23 500,00 R 3 973,33 R 6 716,67 R 58 315,97
UMP (UNIV MPUMALANGA) R 25 246,40 R 3 000,00 R 16 500,00 R 16 500,00 R 1 809,30 R 63 055,70
SMU (SEFAKO MAKGATHO UNIV.) R 38 945,00 R 5 000,00 R 16 052,00 R 28 000,00 R 7 000,00 R 94 997,00
AVERAGE R 27 957,80 R 2 518,82 R 24 090,59 R 16 593,26 R 4 880,48 R 72 402,96
TABLE A4 - FULL COST OF STUDY - 2015
Institution Tuition Registration Residence Meals BooksFCS (A)
Actual Fee
* Tuition costs
account for
between 31%
(MUT) and
52% (WITS) of
the FCS
** Average
FCS of 12
universities
above NSFAS
cap.
In 2015, cap
was R71 800.
*** allowance
costs
recommended
by NSFAS but
determined at
university
discretion
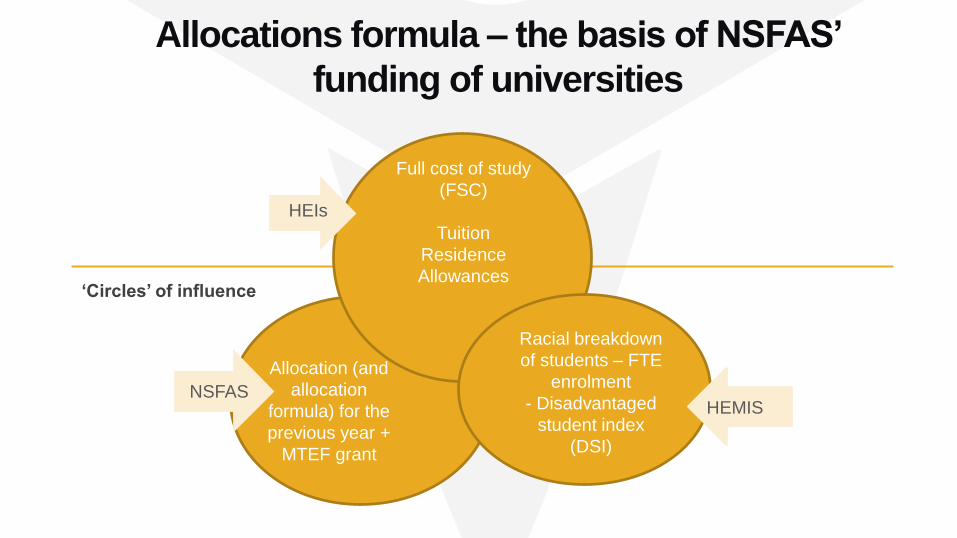
Allocations formula – the basis of NSFAS’
funding of universities
‘Circles’ of influence
Racial breakdown
of students – FTE
enrolment
- Disadvantaged
student index
(DSI)
Full cost of study
(FSC)
Tuition
Residence
Allowances
Allocation (and
allocation
formula) for the
previous year +
MTEF grant
HEIs
NSFASHEMIS
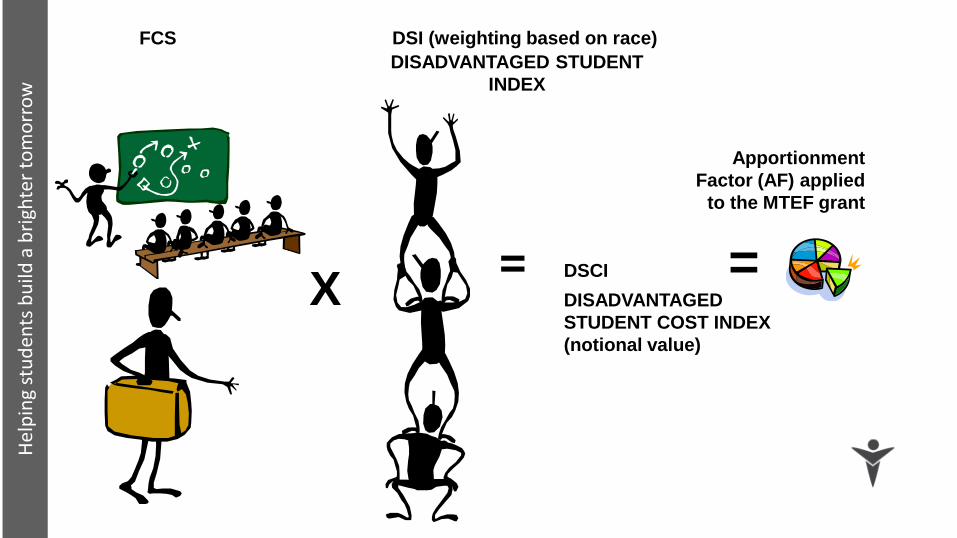
FCS
X
DSI (weighting based on race)
=
Apportionment
Factor (AF) applied
to the MTEF grant
= DSCI
DISADVANTAGED STUDENT
INDEX
DISADVANTAGED
STUDENT COST INDEX
(notional value)
Hel
pin
g st
ud
ents
bu
ild a
bri
ghte
r to
mo
rro
w
NSFAS’ means test
Differentiating between those who are able to pay and
those that can’t
NSFAS Act 56 of
1999Purpose of
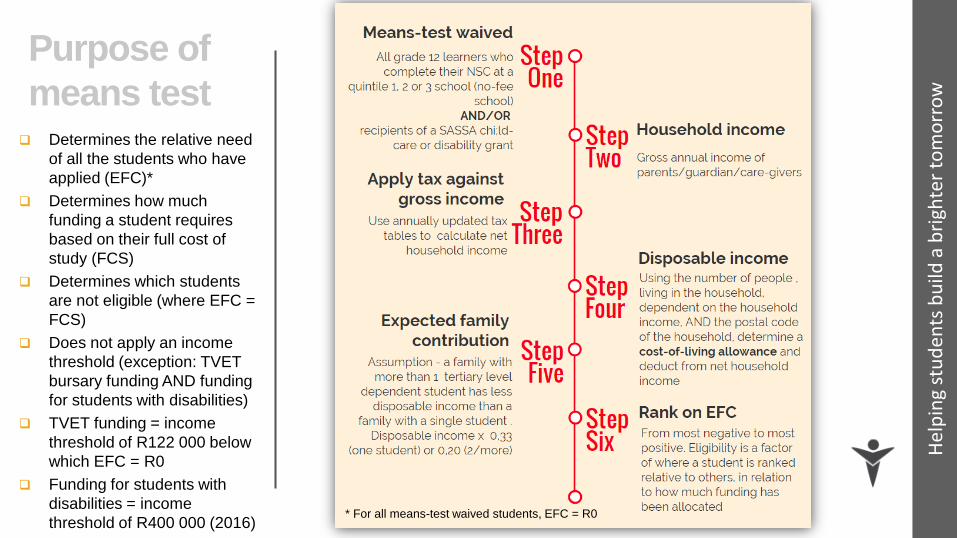
means test Determines the relative need
of all the students who have
applied (EFC)*
Determines how much
funding a student requires
based on their full cost of
study (FCS)
Determines which students
are not eligible (where EFC =
FCS)
Does not apply an income
threshold (exception: TVET
bursary funding AND funding
for students with disabilities)
TVET funding = income
threshold of R122 000 below
which EFC = R0
Funding for students with
disabilities = income
threshold of R400 000 (2016)
Hel
pin
g st
ud
ents
bu
ild a
bri
ghte
r to
mo
rro
w
* For all means-test waived students, EFC = R0
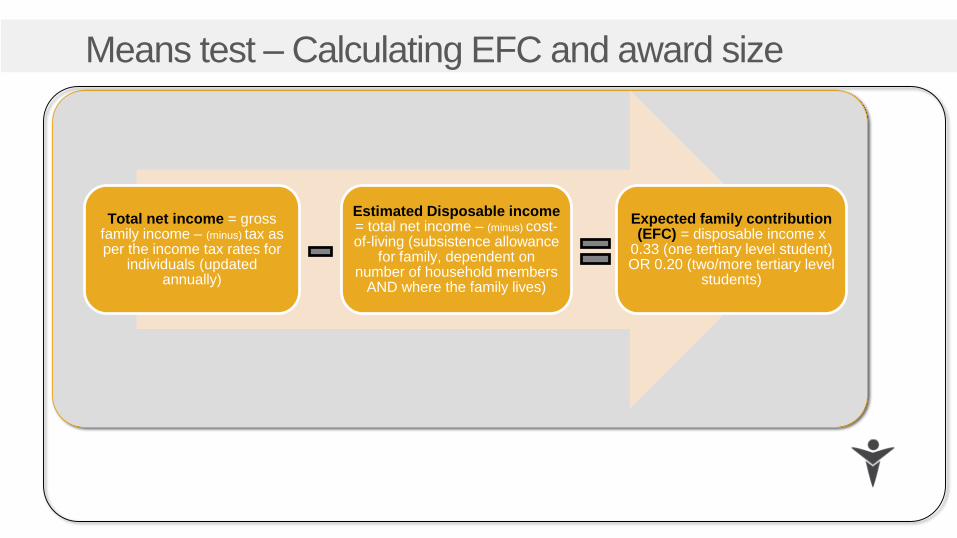
Means test – Calculating EFC and award size
Total net income = gross family income – (minus) tax as per the income tax rates for
individuals (updated annually)
Estimated Disposable income = total net income – (minus) cost-of-living (subsistence allowance
for family, dependent on number of household members
AND where the family lives)
Expected family contribution (EFC) = disposable income x
0.33 (one tertiary level student) OR 0.20 (two/more tertiary level
students)
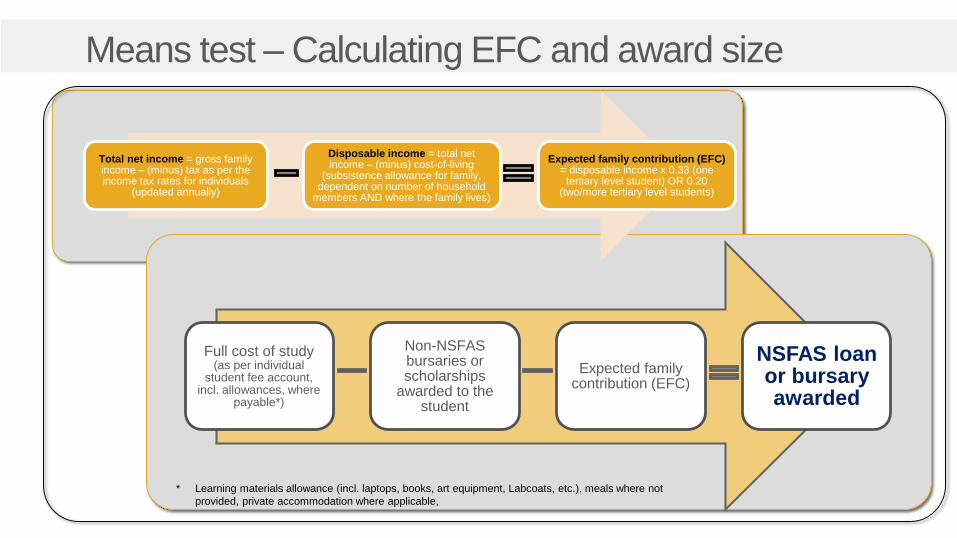
Means test – Calculating EFC and award size
Full cost of study (as per individual
student fee account, incl. allowances, where
payable*)
Non-NSFAS bursaries or scholarships
awarded to the student
Expected family contribution (EFC)
NSFAS loan or bursary awarded
Total net income = gross family income – (minus) tax as per the income tax rates for individuals
(updated annually)
Disposable income = total net income – (minus) cost-of-living
(subsistence allowance for family, dependent on number of household
members AND where the family lives)
Expected family contribution (EFC) = disposable income x 0.33 (one tertiary level student) OR 0.20
(two/more tertiary level students)
* Learning materials allowance (incl. laptops, books, art equipment, Labcoats, etc.), meals where not
provided, private accommodation where applicable,

Acc
essi
bili
ty
Tra
nsp
aren
cy
Aff
ord
abili
ty
Rel
iab
ility
A
uth
enti
city
MEANS TEST REQUIREMENTS
Proof of income of parents,
guardian (not older than 3 months)
Certified copies of ID: own, parents
and all members of household
Copies of registration of a sibling at
another tertiary institution
Separate annexure required for all
first-time applicants with disabilities
25
In the online application process, students
who are means-test waived only need to
supply their own ID copy, as background
validations with Umalusi and SASSA
databases are done. No family income
required. However, all paper-based
applications must include all supporting
documents.
Validations with Home Affairs are now
done – this will contribute significantly to
verifying the eligibility of individual students
to funding, and reduce wastage and fraud.
Overview of funding to Universities and
TVETs
Mapping the funding to universities and TVET colleges
in the last few years
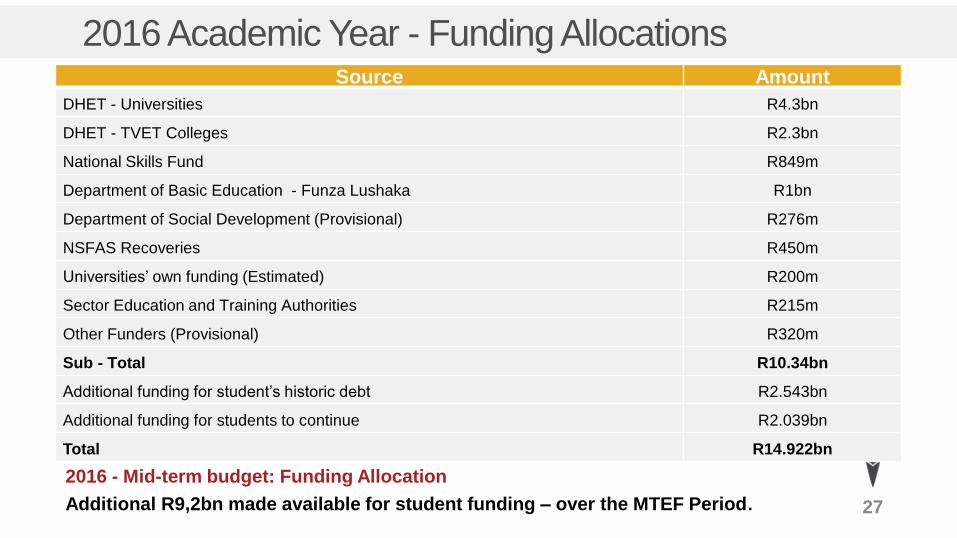
2016 Academic Year - Funding Allocations
27
Source: NSFAS Strategic Plan 2016/17-2019/20
Source Amount
DHET - Universities R4.3bn
DHET - TVET Colleges R2.3bn
National Skills Fund R849m
Department of Basic Education - Funza Lushaka R1bn
Department of Social Development (Provisional) R276m
NSFAS Recoveries R450m
Universities’ own funding (Estimated) R200m
Sector Education and Training Authorities R215m
Other Funders (Provisional) R320m
Sub - Total R10.34bn
Additional funding for student’s historic debt R2.543bn
Additional funding for students to continue R2.039bn
Total R14.922bn
2016 - Mid-term budget: Funding Allocation
Additional R9,2bn made available for student funding – over the MTEF Period.
Acc
essi
bili
ty
Tra
nsp
aren
cy
Aff
ord
abili
ty
Rel
iab
ility
A
uth
enti
city
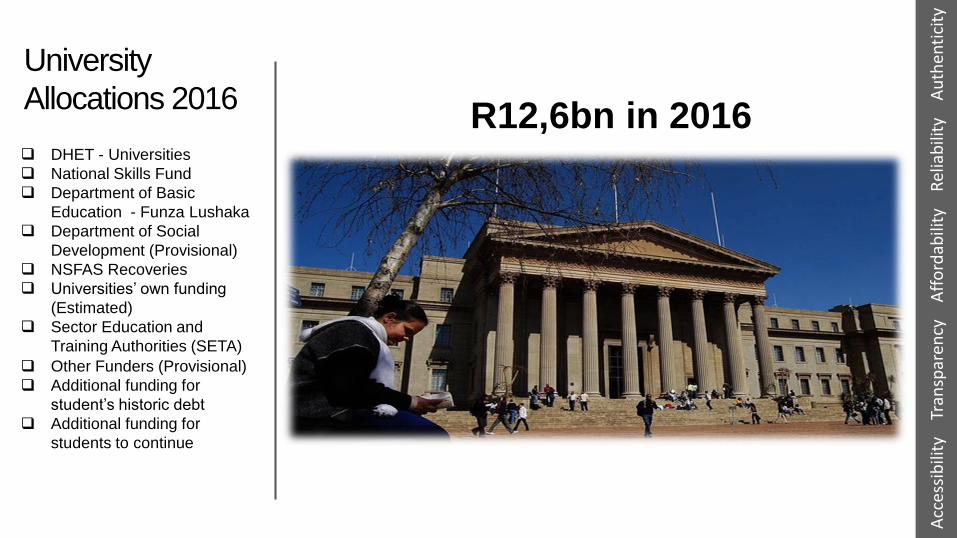
University
Allocations 2016R12,6bn in 2016
DHET - Universities
National Skills Fund
Department of Basic
Education - Funza Lushaka
Department of Social
Development (Provisional)
NSFAS Recoveries
Universities’ own funding
(Estimated)
Sector Education and
Training Authorities (SETA)
Other Funders (Provisional)
Additional funding for
student’s historic debt
Additional funding for
students to continue

Programme costs are approved by
the DHET annually ito funding norms
DHET makes allocation to each
college on the basis of enrolment for Report 191 and
NCV
Bursary covers the 20% student own
contribution to tuition
Acc
essi
bili
ty
Tra
nsp
aren
cy
Aff
ord
abili
ty
Rel
iab
ility
A
uth
enti
city
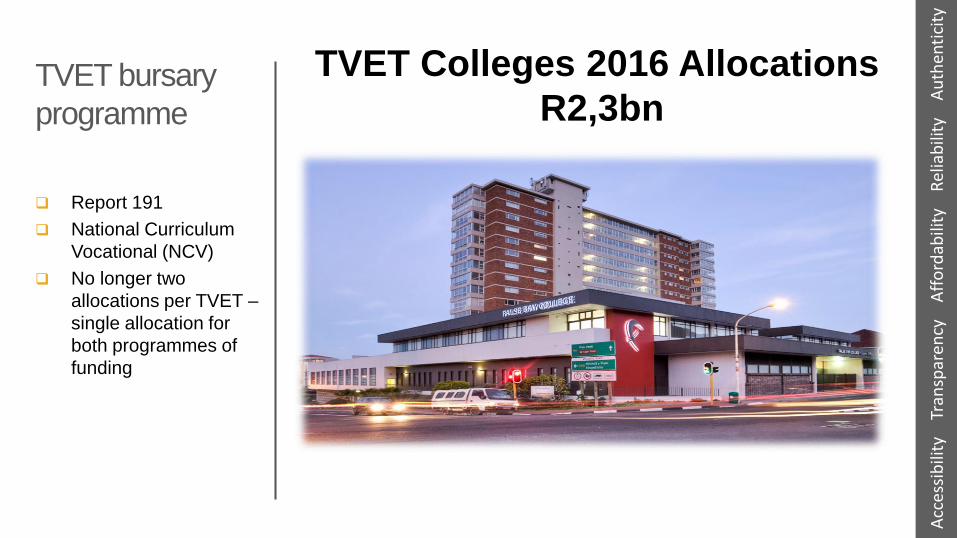
TVET bursary
programme
Introduced in 2007
Only funding for the
NCV and Report 191
programmes (both
highest NQF level = 4)
Purpose: Attract young
learners into vocational
education and training
Approx. 33-35% of
students in these
programmes are funded
by NSFAS
Acc
essi
bili
ty
Tra
nsp
aren
cy
Aff
ord
abili
ty
Rel
iab
ility
A
uth
enti
city
TVET bursary
programme
Report 191
National Curriculum
Vocational (NCV)
No longer two
allocations per TVET –
single allocation for
both programmes of
funding
TVET Colleges 2016 Allocations
R2,3bn
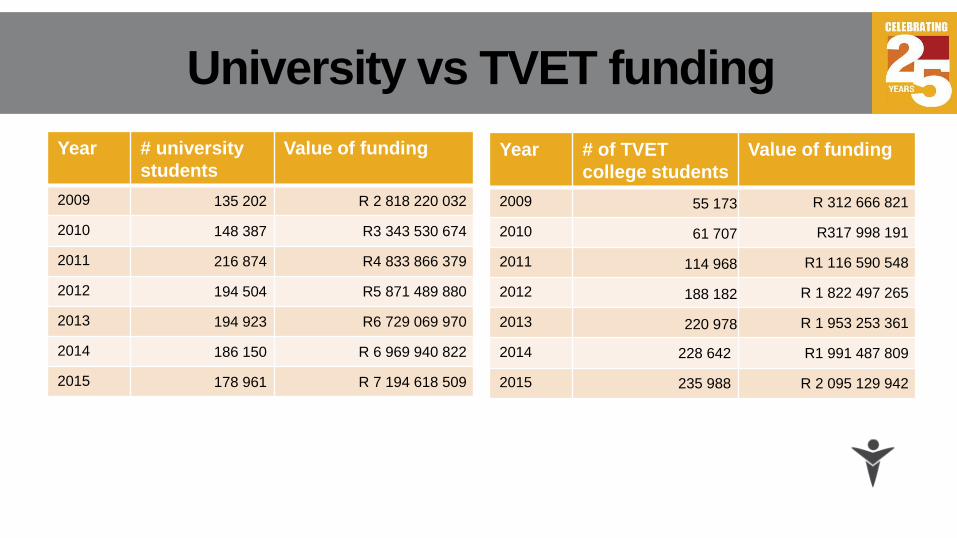
Year # university
students
Value of funding
2009 135 202 R 2 818 220 032
2010 148 387 R3 343 530 674
2011 216 874 R4 833 866 379
2012 194 504 R5 871 489 880
2013 194 923 R6 729 069 970
2014 186 150 R 6 969 940 822
2015 178 961 R 7 194 618 509
Year # of TVET
college students
Value of funding
2009 55 173 R 312 666 821
2010 61 707 R317 998 191
2011 114 968 R1 116 590 548
2012 188 182 R 1 822 497 265
2013 220 978 R 1 953 253 361
2014 228 642 R1 991 487 809
2015 235 988 R 2 095 129 942
University vs TVET funding

What NSFAS funds?
Supporting students to access funding that will contribute
to the human resource development needs of the Country

40/60 convertible loansAnnual reconciliation of individual student academic performance. Up to 40% of the loan amount converted to a bursary.
100/0 convertible loans
On graduation:Full loan value of final year of study converted to grant.
100% non-convertible loans
No portion of the loan is converted to a grant.
Acc
essi
bili
ty
Tra
nsp
aren
cy
Aff
ord
abili
ty
Rel
iab
ility
A
uth
enti
city
33
NSFAS loan
product ‘typology’ Funding from the DHET – 40/60
loans
Funding from the DHET – 100/0
loans (final year)
Institution Loans
40/60
100% (no conversion)
Other loan funding
NGO-programmes
(40/60)
SAICA/Thuthuka
EC and KZN Premier’s
Office (40/60)
Outlier – Bursary to Loan
conversion (for students
who default on their work
back commitments)
34
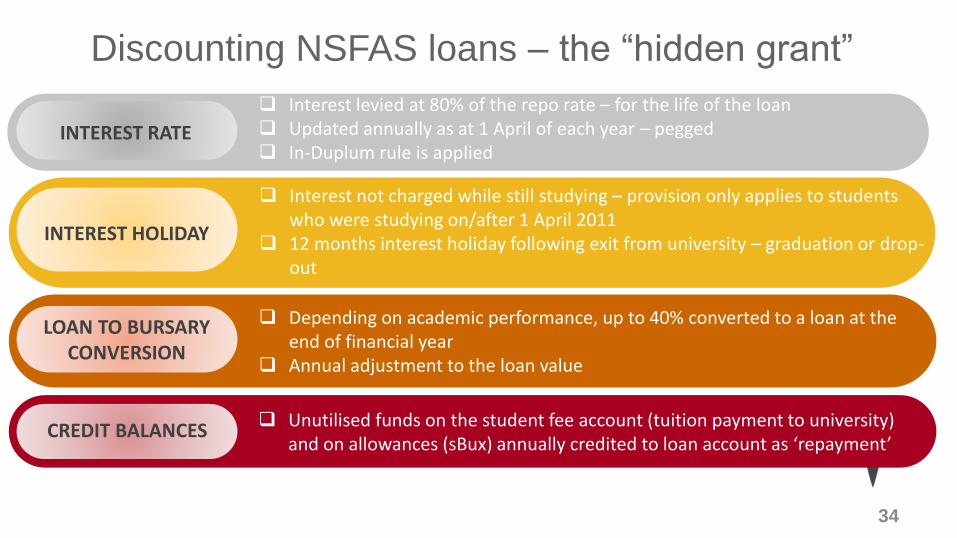
Discounting NSFAS loans – the “hidden grant”
Interest levied at 80% of the repo rate – for the life of the loan Updated annually as at 1 April of each year – pegged In-Duplum rule is applied
Interest not charged while still studying – provision only applies to students who were studying on/after 1 April 2011
12 months interest holiday following exit from university – graduation or drop-out
Depending on academic performance, up to 40% converted to a loan at the end of financial year
Annual adjustment to the loan value
Unutilised funds on the student fee account (tuition payment to university) and on allowances (sBux) annually credited to loan account as ‘repayment’
LOAN TO BURSARY CONVERSION
INTEREST HOLIDAY
INTEREST RATE
CREDIT BALANCES

Government Gazette 2014Top 100 Occupations in Demand. 2-yr review lifecycle.Definition: those occupations in which there are currently a scarcity of qualified or experienced people, currently or anticipated in the future (absolute or relative scarcity)
Scarce Skills (as per NSF)*
BCM: Accounting, Financial Management, Actuarial Studies, Auditing,
Bus Man, Economics, Financial Accounting;
SET: Physics, Comp Sc, Chemistry, Geology, Info Systems,
Mathematical Sciences, Agric, Stats, Biotech, Engineering;
Postgraduate Studies
Only Honours programmes, no BTechs (exceptions).
Masters where funding available or special programmes.
Acc
essi
bili
ty
Tra
nsp
aren
cy
Aff
ord
abili
ty
Rel
iab
ility
A
uth
enti
city
35
NSFAS bursary
products for
scarce skills Funding from the DHET –
for Students with Disabilities
Funding from the NSF – for
Scarce Skills as per an
agreed list
Funding from the NSF – for
postgraduate study
Funding from the DBE – for
initial teacher education
(Funza Lushaka)
Funding from the DSD – for
social work
Funding from the SETAs –
for each of their identified
scarce skills
Specialised funding from the
NSF – NIHSS etc * SETAs have also developed SSPs (sector skills plans) that identifies scarce skills in
their sector, and pivotal skills (top-10)
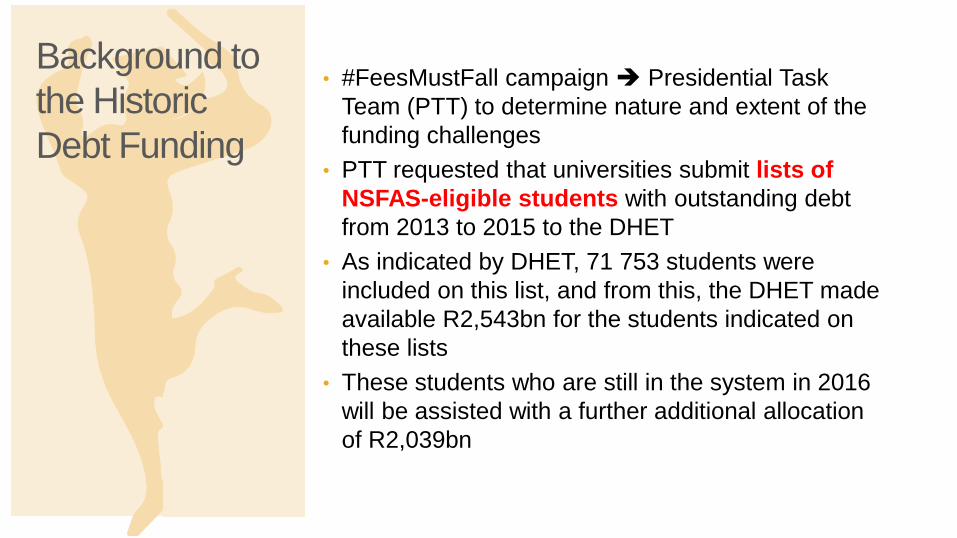
Background to
the Historic
Debt Funding
• #FeesMustFall campaign Presidential Task
Team (PTT) to determine nature and extent of the
funding challenges
• PTT requested that universities submit lists of
NSFAS-eligible students with outstanding debt
from 2013 to 2015 to the DHET
• As indicated by DHET, 71 753 students were
included on this list, and from this, the DHET made
available R2,543bn for the students indicated on
these lists
• These students who are still in the system in 2016
will be assisted with a further additional allocation
of R2,039bn
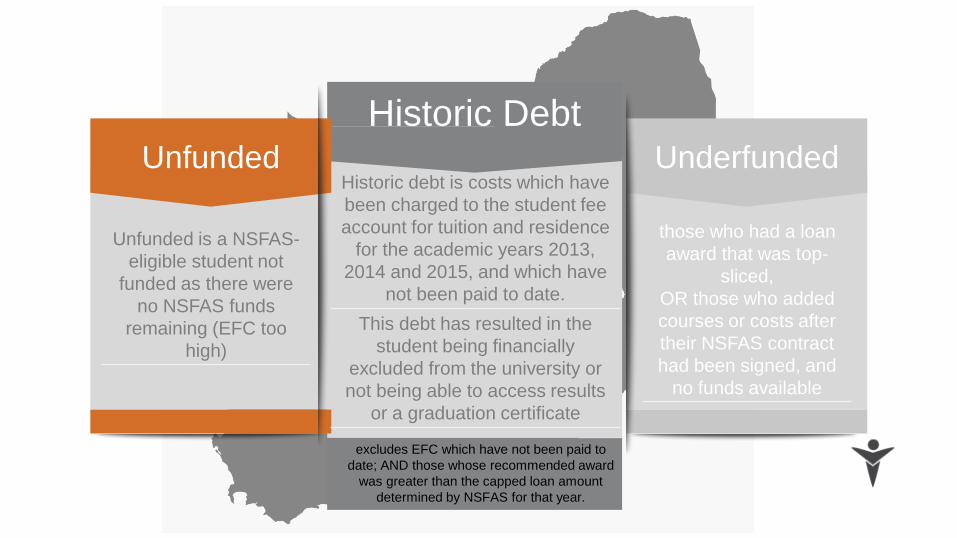
Historic Debt
Unfunded is a NSFAS-
eligible student not
funded as there were
no NSFAS funds
remaining (EFC too
high)
Historic debt is costs which have
been charged to the student fee
account for tuition and residence
for the academic years 2013,
2014 and 2015, and which have
not been paid to date.
This debt has resulted in the
student being financially
excluded from the university or
not being able to access results
or a graduation certificate
those who had a loan
award that was top-
sliced,
OR those who added
courses or costs after
their NSFAS contract
had been signed, and
no funds available
Unfunded Underfunded
excludes EFC which have not been paid to
date; AND those whose recommended award
was greater than the capped loan amount
determined by NSFAS for that year.

Student centred model – who, what, why?
Meeting the mandate to provide systems through which
qualifying students can apply for and receive loans
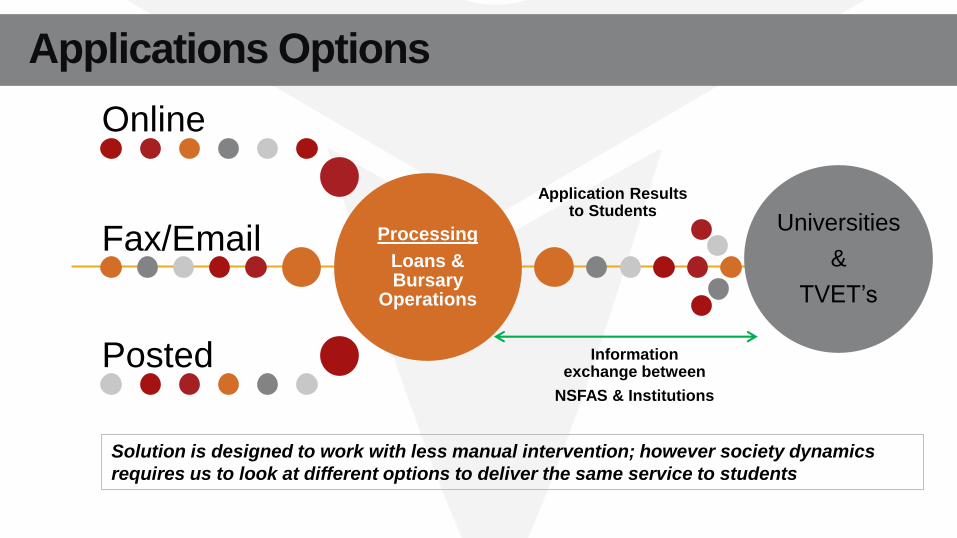
Applications Options
Processing
Loans & Bursary
Operations
Online
Fax/Email
Posted
Application Results to Students
Universities
&
TVET’s
Information exchange between
NSFAS & Institutions
Solution is designed to work with less manual intervention; however society dynamics
requires us to look at different options to deliver the same service to students
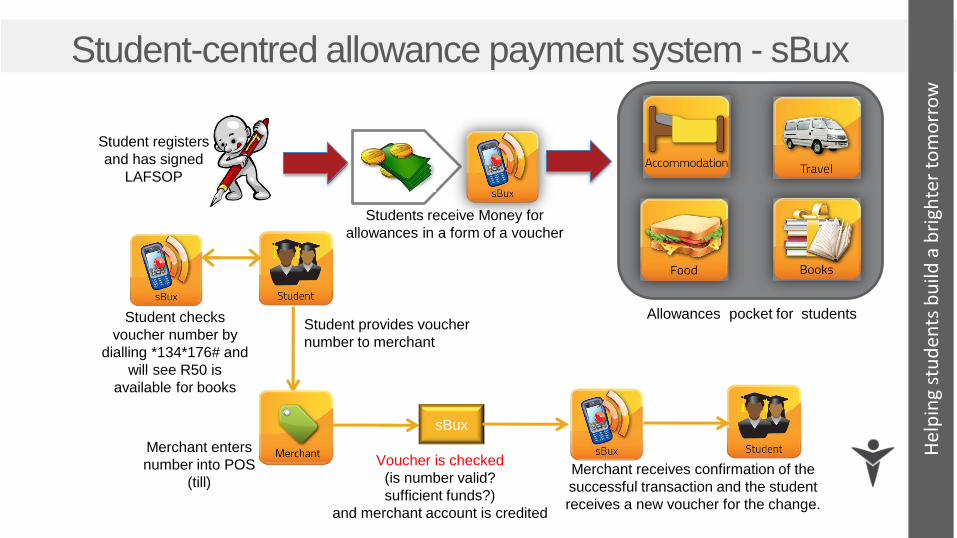
Allowances pocket for students
Students receive Money for
allowances in a form of a voucher
Student-centred allowance payment system - sBux
Hel
pin
g st
ud
ents
bu
ild a
bri
ghte
r to
mo
rro
w
Student checks
voucher number by
dialling *134*176# and
will see R50 is
available for books
Student provides voucher
number to merchant
Merchant enters
number into POS
(till)
sBux
Voucher is checked
(is number valid?
sufficient funds?)
and merchant account is credited
Merchant receives confirmation of the
successful transaction and the student
receives a new voucher for the change.
Student registers
and has signed
LAFSOP
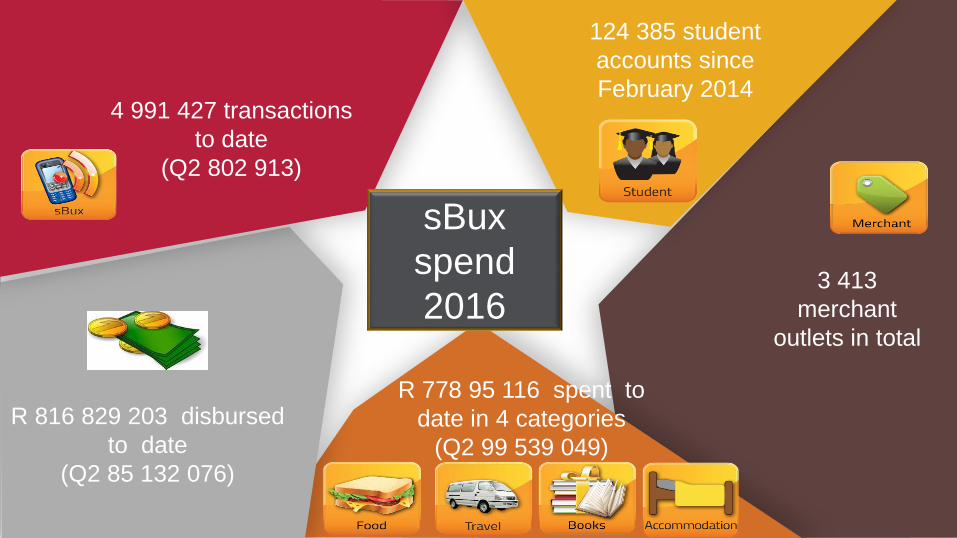
4 991 427 transactions
to date
(Q2 802 913)
R 778 95 116 spent to
date in 4 categories
(Q2 99 539 049)
3 413
merchant
outlets in total
R 816 829 203 disbursed
to date
(Q2 85 132 076)
124 385 student
accounts since
February 2014
sBux
spend
2016
Measuring impact
Using different mechanisms to track the success of the
Scheme in student funding and producing graduates

Performance
information -
Universities
53%
55%Student
retention. Based on DHET
data, only 8
universities have less
than a 15% drop-out
rate at the end of first
year**. National
average 25,2%
Completion.55% of students (SU study)
received qualifications within
9 years, most in N+1, with
only 38% drop-out (2000
cohort)
25,2%
76,6%
Drop-out.While it is estimated that
30-40% of students
drop-out in the first year
of study, data shows
53% never graduate
Academic pass
rate.From 1996 to 2015,
average courses
passed rate was 76,6%*.
* Courses passed rate is not a reflection of whether a student is on track to graduate
within regulation time neither is it indicative of the credit value of each course
enrolled for. Historically collected for bursary conversion purposes.
** These include UCT, UP, UKZN, NWU, Rhodes, UL, SUN and WITS
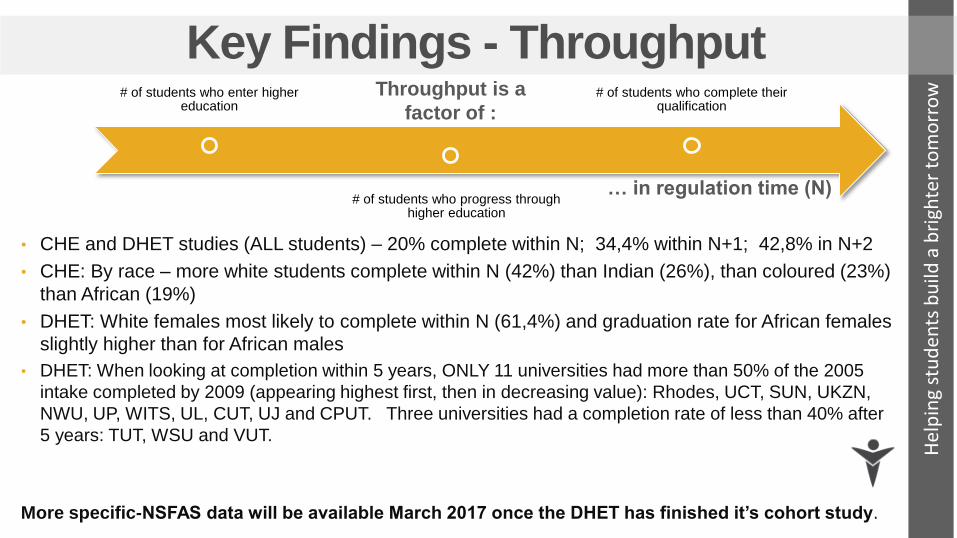
Key Findings - Throughput# of students who enter higher
education
# of students who progress through higher education
# of students who complete their qualification
• CHE and DHET studies (ALL students) – 20% complete within N; 34,4% within N+1; 42,8% in N+2
• CHE: By race – more white students complete within N (42%) than Indian (26%), than coloured (23%)
than African (19%)
• DHET: White females most likely to complete within N (61,4%) and graduation rate for African females
slightly higher than for African males
• DHET: When looking at completion within 5 years, ONLY 11 universities had more than 50% of the 2005
intake completed by 2009 (appearing highest first, then in decreasing value): Rhodes, UCT, SUN, UKZN,
NWU, UP, WITS, UL, CUT, UJ and CPUT. Three universities had a completion rate of less than 40% after
5 years: TUT, WSU and VUT.
More specific-NSFAS data will be available March 2017 once the DHET has finished it’s cohort study.
Throughput is a
factor of :
… in regulation time (N)
Hel
pin
g st
ud
ents
bu
ild a
bri
ghte
r to
mo
rro
w

2017 Academic Year
Preparation for the 2017 academic year, progress to date
and the plans in place
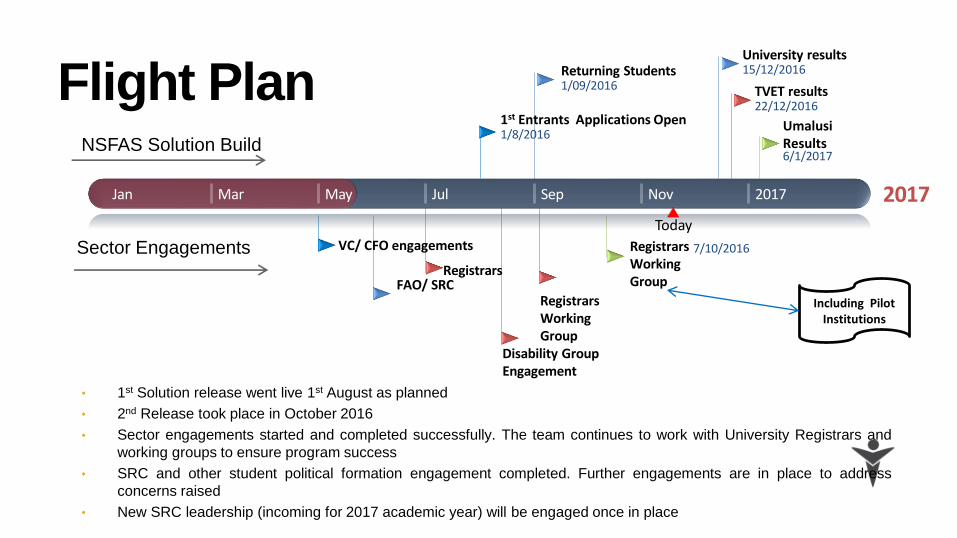
Registrars
Flight Plan
2017Jan Mar May Jul Sep Nov 2017
1st Entrants Applications Open1/8/2016
University results15/12/2016
TVET results22/12/2016
Umalusi Results6/1/2017
VC/ CFO engagements
FAO/ SRC Registrars Working Group
Registrars Working Group
Including Pilot Institutions
Disability Group Engagement
7/10/2016
Returning Students1/09/2016
• 1st Solution release went live 1st August as planned
• 2nd Release took place in October 2016
• Sector engagements started and completed successfully. The team continues to work with University Registrars and
working groups to ensure program success
• SRC and other student political formation engagement completed. Further engagements are in place to address
concerns raised
• New SRC leadership (incoming for 2017 academic year) will be engaged once in place
NSFAS Solution Build
Sector Engagements
Today

Application open window
Create MyNSFAS account
Generation of LAFSOPs,
signing and appeals
Cycle 1
Disbursement of funds –
Tuition to university (quarterly)
Allowances to students via
sBux (monthly)
Key activity
milestones January to
November
2017January
to March
2017
Countdown
to application
closing date48
Ranking and provisional funding
Registration – actual costs
January and
February
2017
Assessment of applications
received – both online and
paper-based
1 August to
30
November
1 September to
31 December
2016
January
to March
2017
Reporting to stakeholders
Monitoring drawdown on funds
Planning for the 2018 implementation
April 2017
to March
2018
Target
migration to
the “SCM”
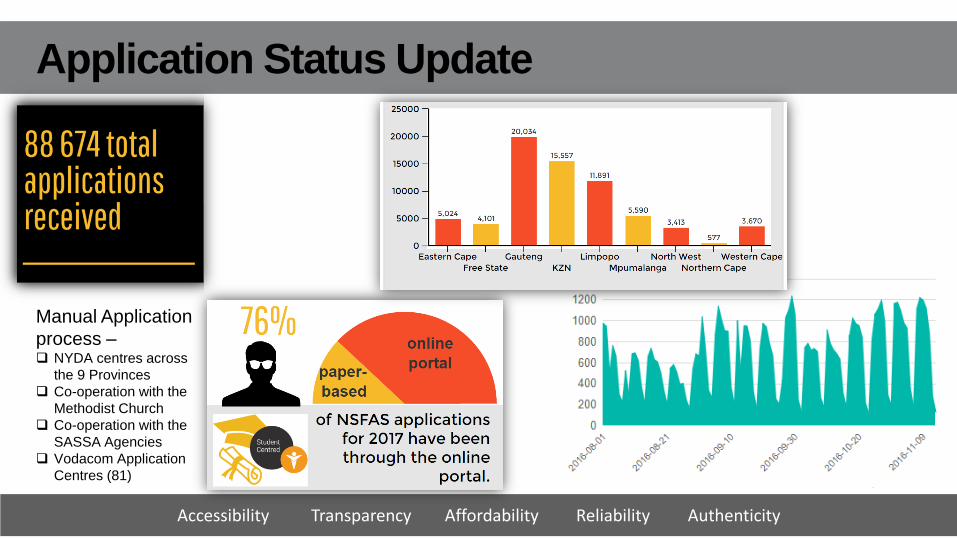
Application Status Update
Accessibility Transparency Affordability Reliability Authenticity
Manual Application
process – NYDA centres across
the 9 Provinces
Co-operation with the
Methodist Church
Co-operation with the
SASSA Agencies
Vodacom Application
Centres (81)

………Organisational re-alignment is critical for the successful roll out of the student
centred model
………a systematic approach is important to drive operations excellence and effective
execution capability across the value chain
2017 and beyond …..
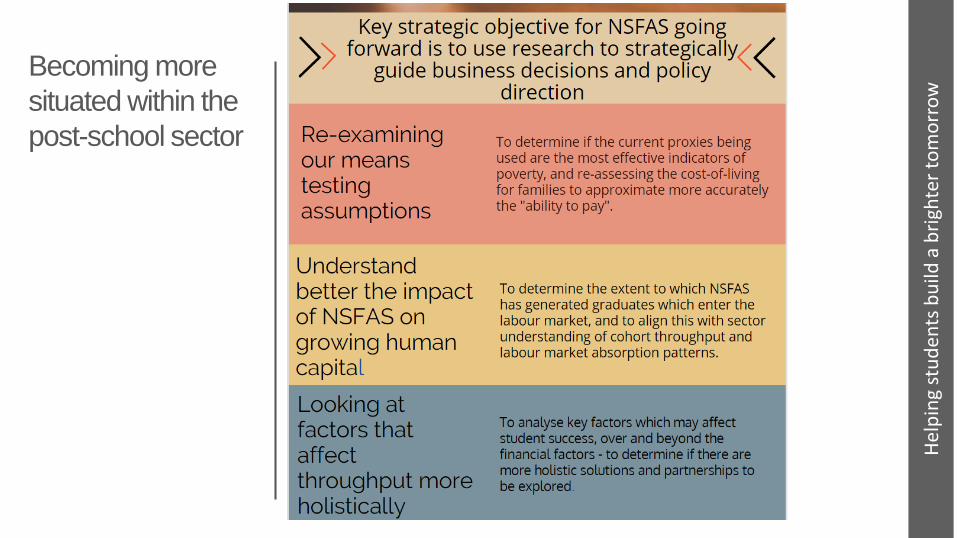
Becoming more
situated within the
post-school sector
Hel
pin
g st
ud
ents
bu
ild a
bri
ghte
r to
mo
rro
w

QUESTIONS