Embed Size (px)
Citation preview

Presentation at BVI Asset Management
Frankfurt, 1 October 2015
Peter Praet
Rubric
www.ecb.europa.eu 2
Real GDP growth and PMI
Composite output quarter-on-quarter percentage growth; diffusion index
Sources: Eurostat, Markit and ECB staff calculations.
Latest observation: 2015Q2 for GDP growth, August 2015 for PMI.
-3.0
-2.5
-2.0
-1.5
-1.0
-0.5
0.0
0.5
1.0
20
25
30
35
40
45
50
55
60
2008 2009 2010 2011 2012 2013 2014 2015
Real GDP (rhs)
Composite PMI(lhs)
2015-10-01 Frankfurt
5 years ahead growth expectations for the euro area % p.a.
Source: Consensus.
1.0
1.2
1.4
1.6
1.8
2.0
2.2
2.4
2.6
2.8
3.0
1.0
1.2
1.4
1.6
1.8
2.0
2.2
2.4
2.6
2.8
3.0
2001 2003 2005 2007 2009 2011 2013 2015
Rubric
www.ecb.europa.eu
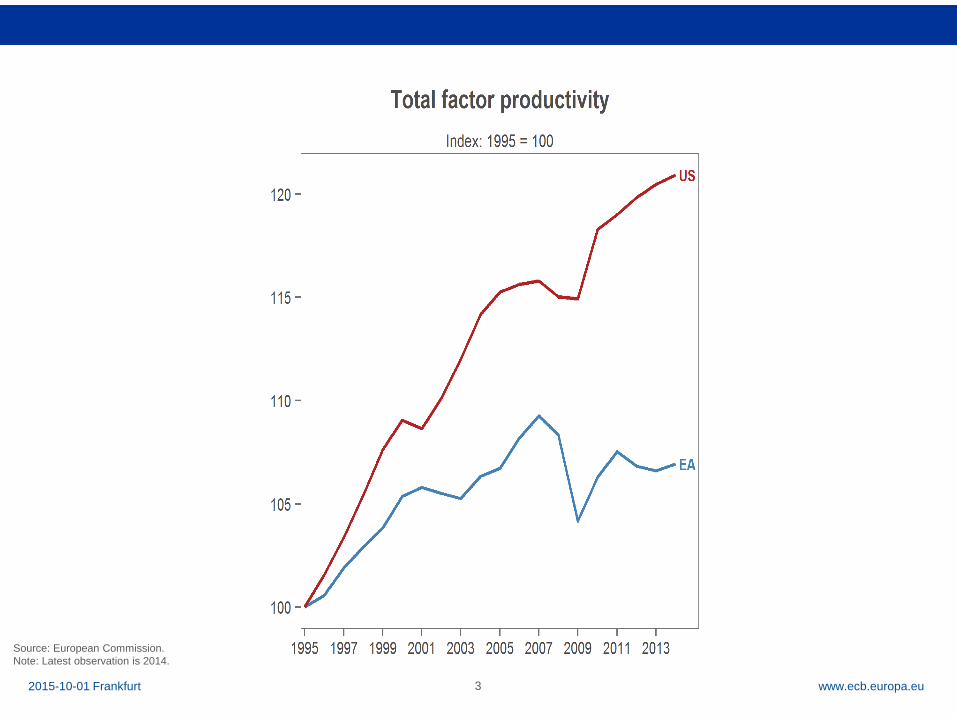
Source: European Commission.
Note: Latest observation is 2014.
3 2015-10-01 Frankfurt

Rubric
www.ecb.europa.eu
Sources: European Commission, Consensus Economics and ECB calculations.
Latest data: 2014 for GDP outcome.
Note: The dotted line represents the evolution of GDP based on private sector
expectations as measured by Consensus Economics in October 2007.
Real GDP & pre-crisis expected path index, 2006 = 100
95
100
105
110
115
120
125
2006 2007 2008 2009 2010 2011 2012 2013 2014
Actual growth
Expected growth
path in late 2007
100
105
110
115
120
125
130
135
140
1999 2002 2005 2008 2011 2014 2017
10%
Counterfactual
potential GDP
Actual GDP Potential
GDP
Source: European Commission Spring 2015 forecast, Output Gap
Working Group.
Note: counterfactual potential GDP assumes that potential GDP
continued to grow at its 2007 growth rate. I.e. it reflects the observation
that potential growth has already slowed down before the crisis.
Germany
Euro area
Spain
EA: Potential output reduction index, potential GDP in 1999=100
4 2015-10-01 Frankfurt

Rubric
www.ecb.europa.eu
Sources: European Commission and ECB calculations.
Note: 2014 partially based on forecasts. Euro area refers to euro area 12.
Equipment investment 2006=100
5
Unemployment rate % of (extended) labor force
Sources: Labour Force Survey and ECB staff calculation.
Note: Discouraged workers are inactive people who are available
but not searching a job. The extended labor force is the number of
active persons extended with the number of discouraged workers.
75
80
85
90
95
100
105
110
115
120
75
80
85
90
95
100
105
110
115
120
2006 2007 2008 2009 2010 2011 2012 2013 2014
Germany
Euro area
Spain
0
2
4
6
8
10
12
0
2
4
6
8
10
12
2005 2007 2009 2011 2013 2015
Unemployment rate
Discouraged workers
2015-10-01 Frankfurt

Rubric
www.ecb.europa.eu
Source: ECB.
Latest observation: June 2015.
Bank loans to private sector annual percentage changes
-10
-5
0
5
10
15
20
25
30
-10
-5
0
5
10
15
20
25
30
2003 2005 2007 2009 2011 2013 2015
DE ES EA
6 2015-10-01 Frankfurt
Rubric
www.ecb.europa.eu 7
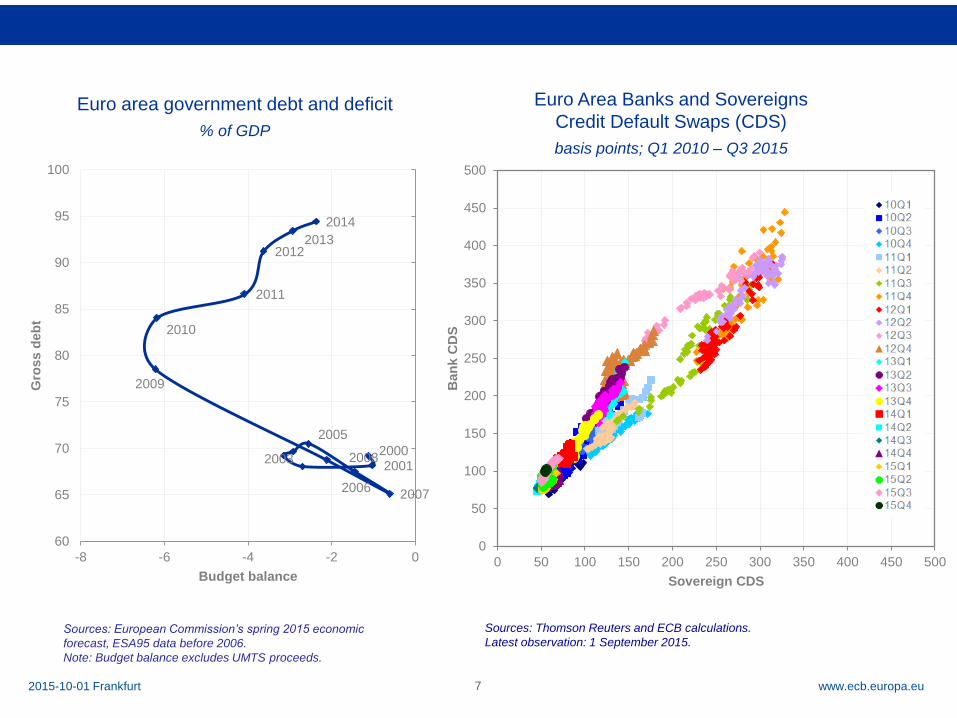
Sources: European Commission’s spring 2015 economic
forecast, ESA95 data before 2006.
Note: Budget balance excludes UMTS proceeds.
Euro area government debt and deficit
% of GDP
2000 2001
2003
2005
2006 2007
2008
2009
2010
2011
2012 2013
2014
60
65
70
75
80
85
90
95
100
-8 -6 -4 -2 0
Gro
ss d
eb
t
Budget balance
2015-10-01 Frankfurt
Sources: Thomson Reuters and ECB calculations.
Latest observation: 1 September 2015.
Euro Area Banks and Sovereigns
Credit Default Swaps (CDS)
basis points; Q1 2010 – Q3 2015
0
50
100
150
200
250
300
350
400
450
500
0 50 100 150 200 250 300 350 400 450 500
Ban
k C
DS
Sovereign CDS
Rubric
www.ecb.europa.eu
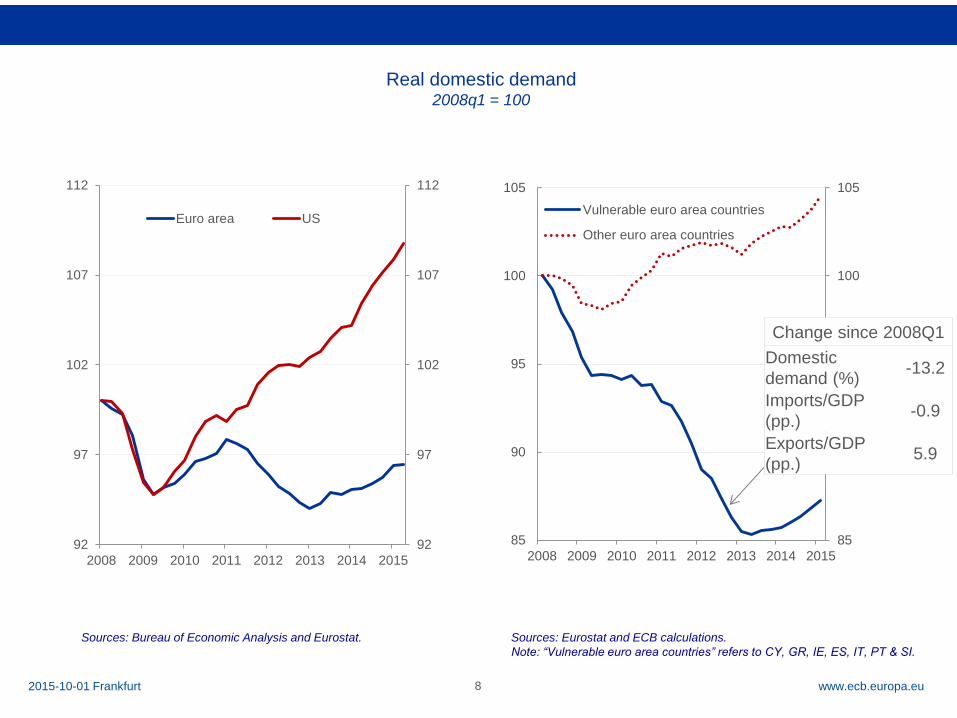
Real domestic demand 2008q1 = 100
8
Sources: Eurostat and ECB calculations.
Note: “Vulnerable euro area countries” refers to CY, GR, IE, ES, IT, PT & SI.
Sources: Bureau of Economic Analysis and Eurostat.
85
90
95
100
105
85
90
95
100
105
2008 2009 2010 2011 2012 2013 2014 2015
Vulnerable euro area countries
Other euro area countries
92
97
102
107
112
92
97
102
107
112
2008 2009 2010 2011 2012 2013 2014 2015
Euro area US
Change since 2008Q1
Domestic
demand (%) -13.2
Imports/GDP
(pp.) -0.9
Exports/GDP
(pp.) 5.9
2015-10-01 Frankfurt

Rubric
www.ecb.europa.eu 9
Price of inflation and deflation protection basis points per annum
Source: Bloomberg.
Note: Price of 0% floor and 4% cap options (year-on-year) on euro area HICP
inflation – 5Y maturity. Developments should be interpreted with caution due to
limited market liquidity. Latest observation: 2 September 2015.
0
50
100
150
200
250
300
350
400
0
50
100
150
200
250
300
350
400
2008 2009 2010 2011 2012 2013 2014 2015
Price of inflation protection
Price of deflation protection
Euro area inflation % p.a.
Source: Eurostat.
Latest observation: September 2015 (flash)
2015-10-01 Frankfurt
-0.1
0.9
-1.0
-0.5
0.0
0.5
1.0
1.5
2.0
2.5
3.0
3.5
4.0
4.5
-1.0
-0.5
0.0
0.5
1.0
1.5
2.0
2.5
3.0
3.5
4.0
4.5
2008 2009 2010 2011 2012 2013 2014 2015
Euro Area HICP
Euro Area HICP excluding food and energy
Rubric
www.ecb.europa.eu
0
2
4
6
8
10
12
14
16
0
2
4
6
8
10
12
14
16
1980 1985 1990 1995 2000 2005 2010 2015
United States
Germany
10
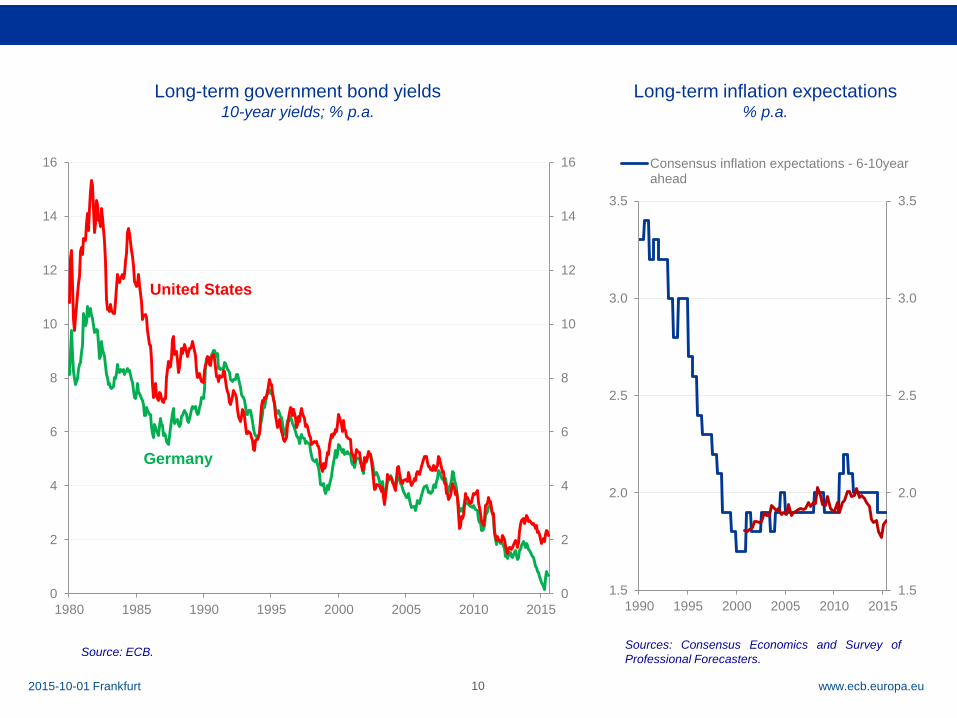
Long-term government bond yields 10-year yields; % p.a.
Source: ECB.
2015-10-01 Frankfurt
1.5
2.0
2.5
3.0
3.5
1.5
2.0
2.5
3.0
3.5
1990 1995 2000 2005 2010 2015
Consensus inflation expectations - 6-10yearahead
Long-term inflation expectations % p.a.
Sources: Consensus Economics and Survey of
Professional Forecasters.
Rubric
www.ecb.europa.eu 11
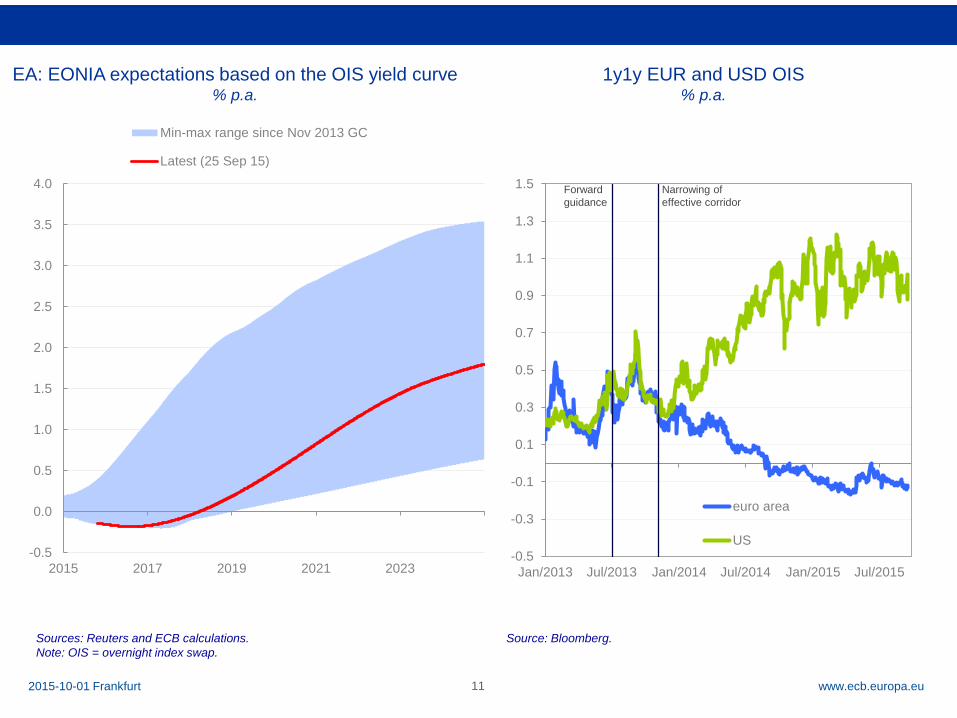
1y1y EUR and USD OIS % p.a.
Source: Bloomberg.
2015-10-01 Frankfurt
Sources: Reuters and ECB calculations.
Note: OIS = overnight index swap.
EA: EONIA expectations based on the OIS yield curve % p.a.
-0.5
-0.3
-0.1
0.1
0.3
0.5
0.7
0.9
1.1
1.3
1.5
Jan/2013 Jul/2013 Jan/2014 Jul/2014 Jan/2015 Jul/2015
euro area
US
Forward
guidance
Narrowing of
effective corridor
-0.5
0.0
0.5
1.0
1.5
2.0
2.5
3.0
3.5
4.0
2015 2017 2019 2021 2023
Min-max range since Nov 2013 GC
Latest (25 Sep 15)

Rubric
www.ecb.europa.eu
Composite indicator of the nominal cost of bank borrowing
for non-financial corporations % p.a.
Source: ECB.
Note: The indicator for the total cost of bank borrowing is calculated by aggregating short- and long-term rates
using a 24-month moving average of new business volumes. Latest observation: July 2015.
0.0
2.0
4.0
6.0
8.0
0.0
2.0
4.0
6.0
8.0
2008 2009 2010 2011 2012 2013 2014 2015
DE ES FR EA IT
12 2015-10-01 Frankfurt
Rubric
www.ecb.europa.eu
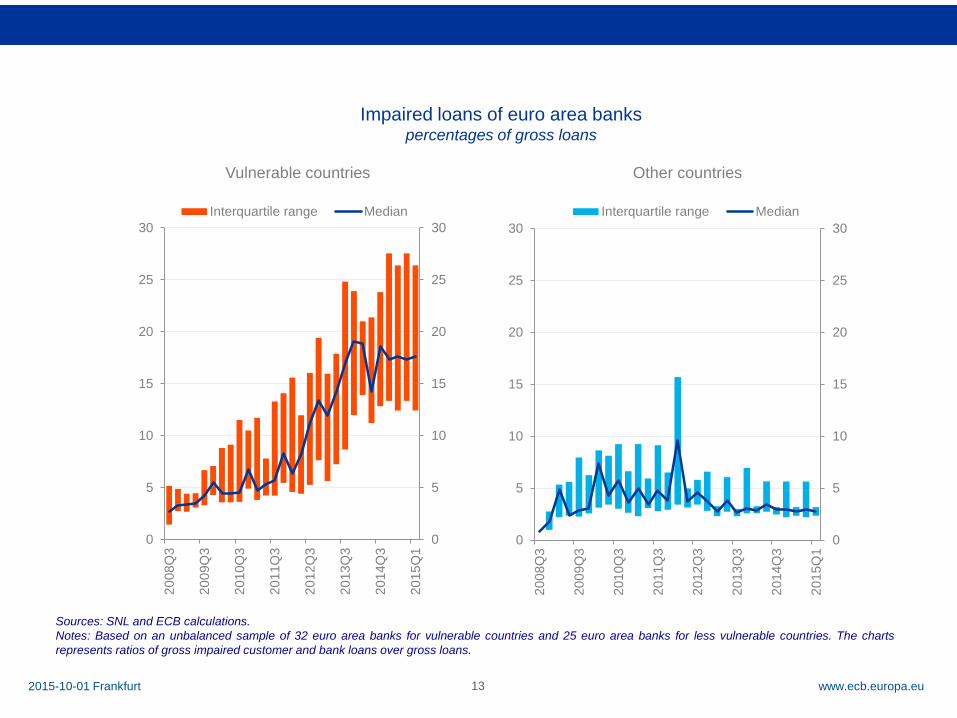
Impaired loans of euro area banks percentages of gross loans
Sources: SNL and ECB calculations.
Notes: Based on an unbalanced sample of 32 euro area banks for vulnerable countries and 25 euro area banks for less vulnerable countries. The charts
represents ratios of gross impaired customer and bank loans over gross loans.
13
0
5
10
15
20
25
30
0
5
10
15
20
25
30
20
08Q
3
20
09Q
3
20
10Q
3
20
11Q
3
20
12Q
3
20
13Q
3
20
14Q
3
20
15Q
1
Vulnerable countries
Interquartile range Median
0
5
10
15
20
25
30
0
5
10
15
20
25
30
20
08Q
3
20
09Q
3
20
10Q
3
20
11Q
3
20
12Q
3
20
13Q
3
20
14Q
3
20
15Q
1
Other countries
Interquartile range Median
2015-10-01 Frankfurt
Rubric
www.ecb.europa.eu
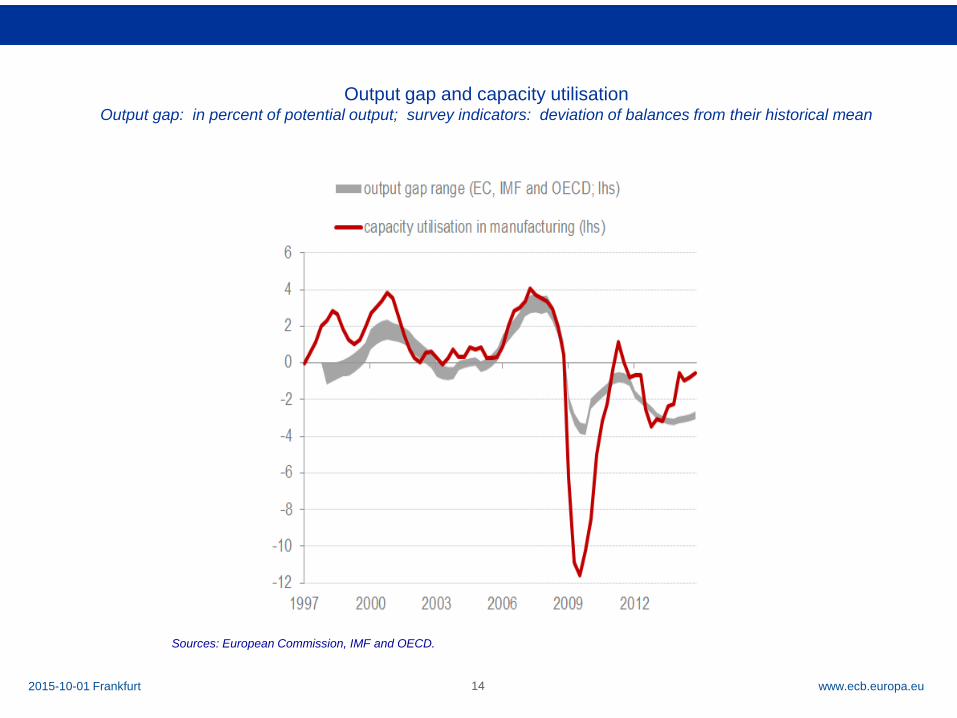
Output gap and capacity utilisation Output gap: in percent of potential output; survey indicators: deviation of balances from their historical mean
Sources: European Commission, IMF and OECD.
14 2015-10-01 Frankfurt

Rubric
www.ecb.europa.eu 15
Source: Eurobarometer ‘s 70.1, 78.2 and 81.1.
Note: Excludes response “Don’t know”.
“Generally speaking, do you think that the life of those in the EU who are children today will
be easier, more difficult, or about the same as the life of those of your own generation?”
Share of respondents in the euro area
12%
19%
67%
61%
18% 18%
0%
10%
20%
30%
40%
50%
60%
70%
80%
0%
10%
20%
30%
40%
50%
60%
70%
80%
2012 2014 2012 2014 2012 2014
Easier More difficult Neither nor
2015-10-01 Frankfurt