Embed Size (px)
Citation preview

2018 Interim Results For the six months ended 31 March 2018
Presentation and Investor Discussion Pack
Westpac Banking Corporation | ABN 33 007 457 141
Westpac 2018 Interim Results index
2018 Interim Result Presentation 3
Investor Discussion Pack of 2018 Interim Result 28
Strategy 29
Overview Performance discipline Service leadership Workforce revolution Digital transformation Sustainable futures
35 38 40 42 43 50
Earnings drivers Revenue Expenses Impairment charges
53 54 59 61
Credit quality 62
Capital, Funding and Liquidity 84
Divisional results Consumer Bank Business Bank BT Financial Group Westpac Institutional Bank Westpac New Zealand
95 96 99
102 106 109
Economics 115
Appendix and Disclaimer 130
Contact us 138
Disclaimer 139
Image on front The Westpac Rescue Helicopter Service in action Image on right Westpac head office, 275 Kent Street, Sydney
Westpac Banking Corporation | ABN 33 007 457 141
Brian Hartzer Chief Executive Officer
Financial results based on cash earnings unless otherwise stated Refer page 36 for definition. Results principally cover the 1H18, 2H17 and 1H17 periods Comparison of 1H18 versus 2H17 (unless otherwise stated)
Westpac Group 2018 Interim Results Presentation & Investor Discussion Pack
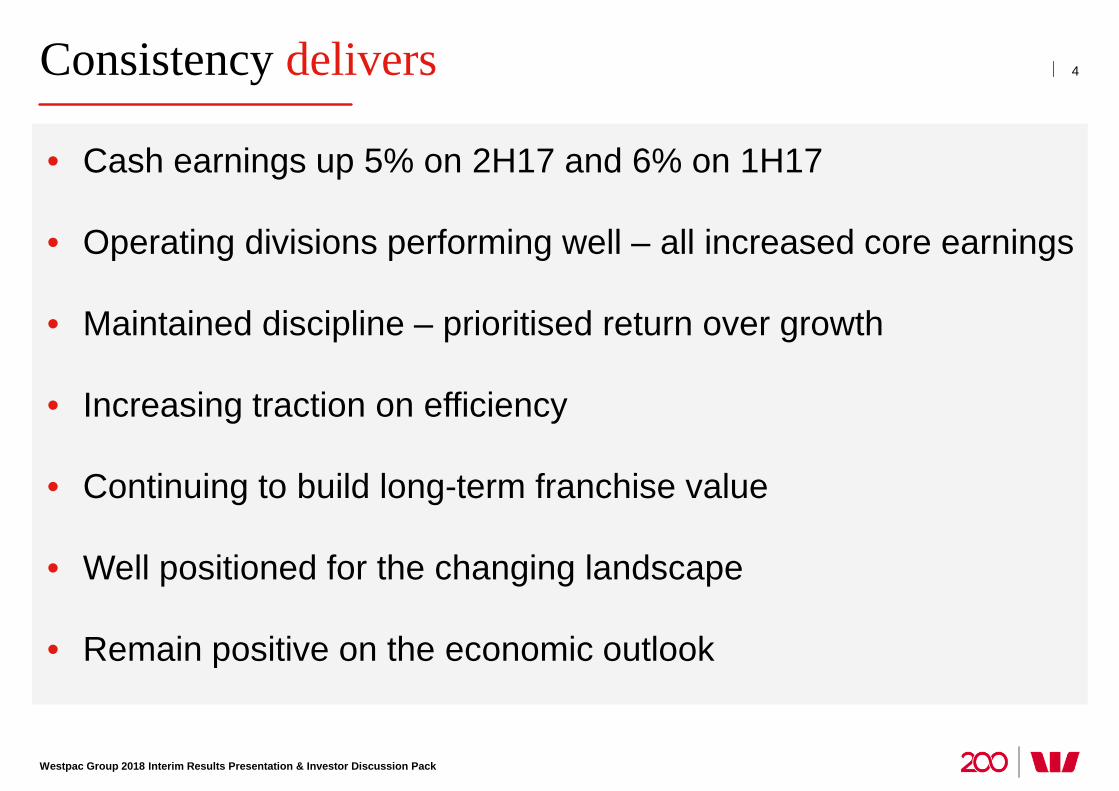
Consistency delivers
• Cash earnings up 5% on 2H17 and 6% on 1H17
• Operating divisions performing well – all increased core earnings
• Maintained discipline – prioritised return over growth
• Increasing traction on efficiency
• Continuing to build long-term franchise value
• Well positioned for the changing landscape
• Remain positive on the economic outlook
4
Westpac Group 2018 Interim Results Presentation & Investor Discussion Pack
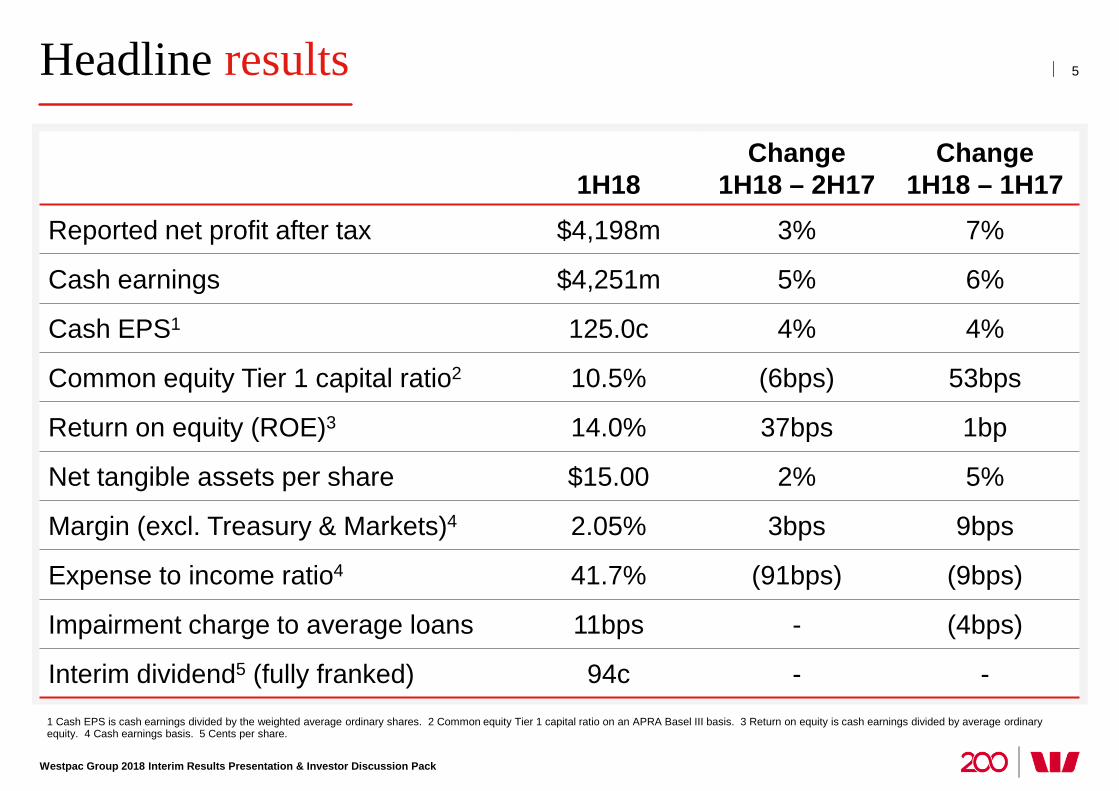
Headline results
1 Cash EPS is cash earnings divided by the weighted average ordinary shares. 2 Common equity Tier 1 capital ratio on an APRA Basel III basis. 3 Return on equity is cash earnings divided by average ordinary equity. 4 Cash earnings basis. 5 Cents per share.
5
1H18 Change
1H18 – 2H17 Change
1H18 – 1H17 Reported net profit after tax $4,198m 3% 7%
Cash earnings $4,251m 5% 6%
Cash EPS1 125.0c 4% 4%
Common equity Tier 1 capital ratio2 10.5% (6bps) 53bps
Return on equity (ROE)3 14.0% 37bps 1bp
Net tangible assets per share $15.00 2% 5%
Margin (excl. Treasury & Markets)4 2.05% 3bps 9bps
Expense to income ratio4 41.7% (91bps) (9bps)
Impairment charge to average loans 11bps - (4bps)
Interim dividend5 (fully franked) 94c - -
Data for 1H18 or at 31 March 2018 unless otherwise stated. 1 FY17 for detail see Westpac Group 2017 Sustainability Performance Report page 84. 2 Australia data only. 3 Excludes institutional lending.
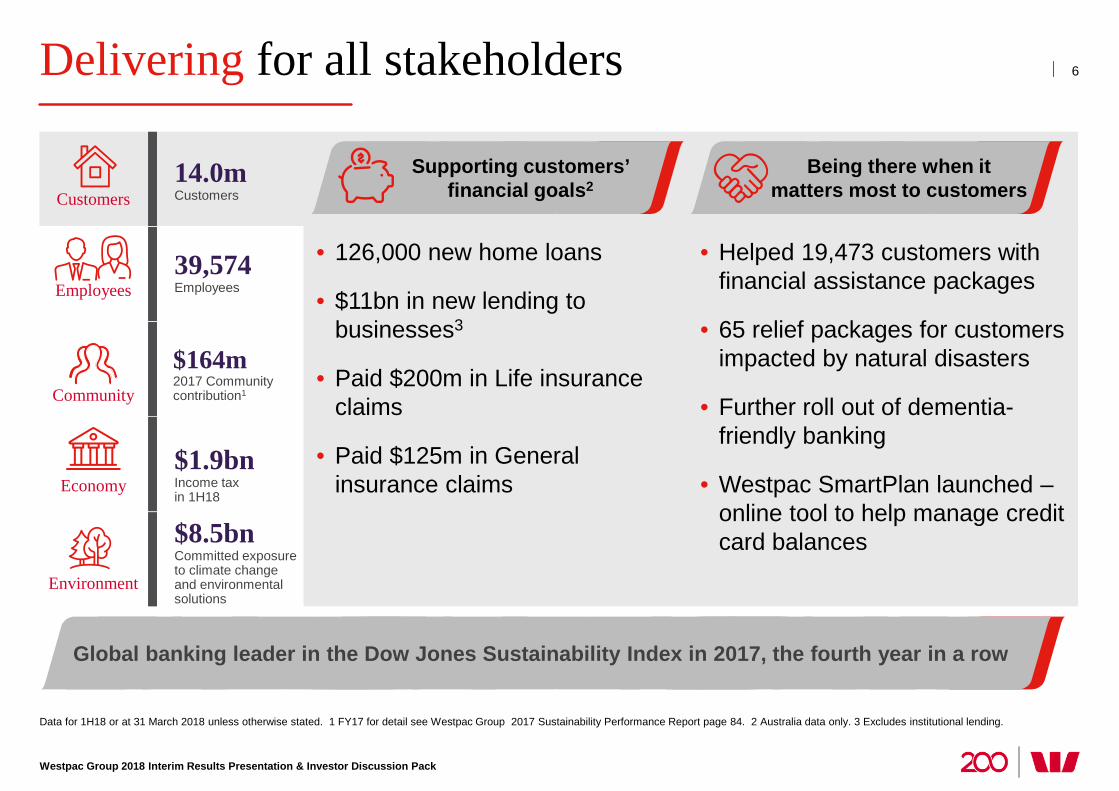
Delivering for all stakeholders
Westpac Group 2018 Interim Results Presentation & Investor Discussion Pack
6
14.0m Customers Customers
Employees 39,574 Employees
Community
$164m 2017 Community contribution1
Environment
$8.5bn Committed exposure to climate change and environmental solutions
Economy $1.9bn Income tax in 1H18
Supporting customers’ financial goals2
• [text to come]
• [text to come]
Being there when it matters most to customers
• 126,000 new home loans
• $11bn in new lending to businesses3
• Paid $200m in Life insurance claims
• Paid $125m in General insurance claims
• Helped 19,473 customers with financial assistance packages
• 65 relief packages for customers impacted by natural disasters
• Further roll out of dementia-friendly banking
• Westpac SmartPlan launched – online tool to help manage credit card balances
Global banking leader in the Dow Jones Sustainability Index in 2017, the fourth year in a row
Westpac Group 2018 Interim Results Presentation & Investor Discussion Pack
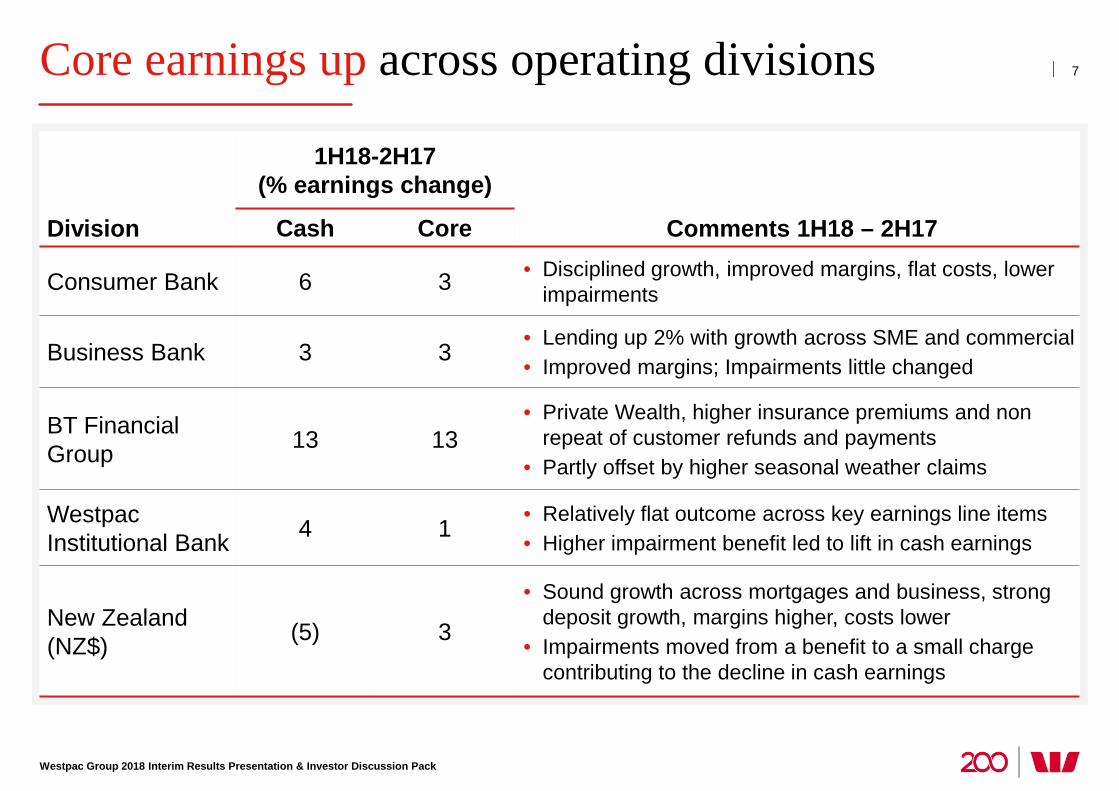
Core earnings up across operating divisions 7
Division
1H18-2H17 (% earnings change)
Comments 1H18 – 2H17 Cash Core
Consumer Bank 6 3 • Disciplined growth, improved margins, flat costs, lower impairments
Business Bank 3 3 • Lending up 2% with growth across SME and commercial • Improved margins; Impairments little changed
BT Financial Group 13 13
• Private Wealth, higher insurance premiums and non repeat of customer refunds and payments
• Partly offset by higher seasonal weather claims
Westpac Institutional Bank 4 1 • Relatively flat outcome across key earnings line items
• Higher impairment benefit led to lift in cash earnings
New Zealand (NZ$) (5) 3
• Sound growth across mortgages and business, strong deposit growth, margins higher, costs lower
• Impairments moved from a benefit to a small charge contributing to the decline in cash earnings
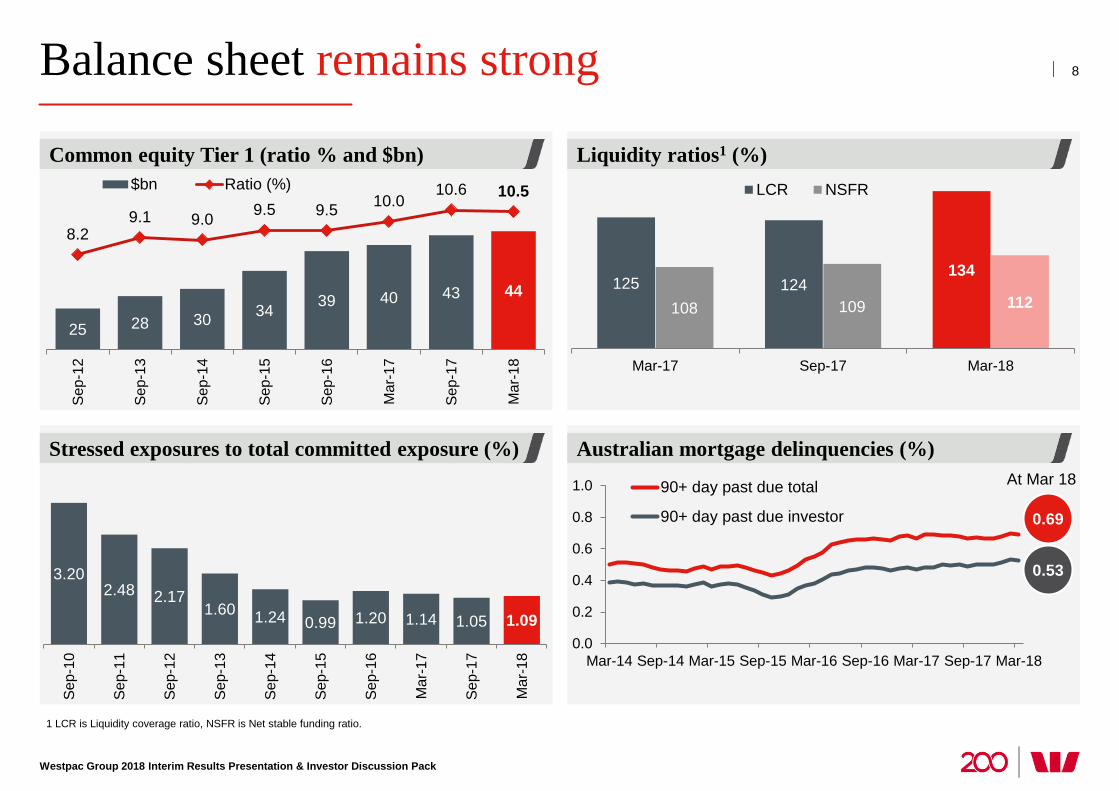
Balance sheet remains strong
Westpac Group 2018 Interim Results Presentation & Investor Discussion Pack
Liquidity ratios1 (%)
Australian mortgage delinquencies (%)
Common equity Tier 1 (ratio % and $bn)
Stressed exposures to total committed exposure (%)
8
3.20 2.48 2.17
1.60 1.24 0.99 1.20 1.14 1.05 1.09
Sep-
10
Sep-
11
Sep-
12
Sep-
13
Sep-
14
Sep-
15
Sep-
16
Mar
-17
Sep-
17
Mar
-18
25 28 30 34 39 40 43 44
8.2 9.1 9.0 9.5 9.5 10.0
10.6 10.5
3
4
5
6
7
8
9
10
11
12
15
20
25
30
35
40
45
50
55
Sep-
12
Sep-
13
Sep-
14
Sep-
15
Sep-
16
Mar
-17
Sep-
17
Mar
-18
$bn Ratio (%)
125 124 134
108 109 112
Mar-17 Sep-17 Mar-18
LCR NSFR
0.0
0.2
0.4
0.6
0.8
1.0
Mar-14 Sep-14 Mar-15 Sep-15 Mar-16 Sep-16 Mar-17 Sep-17 Mar-18
90+ day past due total
90+ day past due investor 0.69
0.53
At Mar 18
1 LCR is Liquidity coverage ratio, NSFR is Net stable funding ratio.
Westpac Group 2018 Interim Results Presentation & Investor Discussion Pack
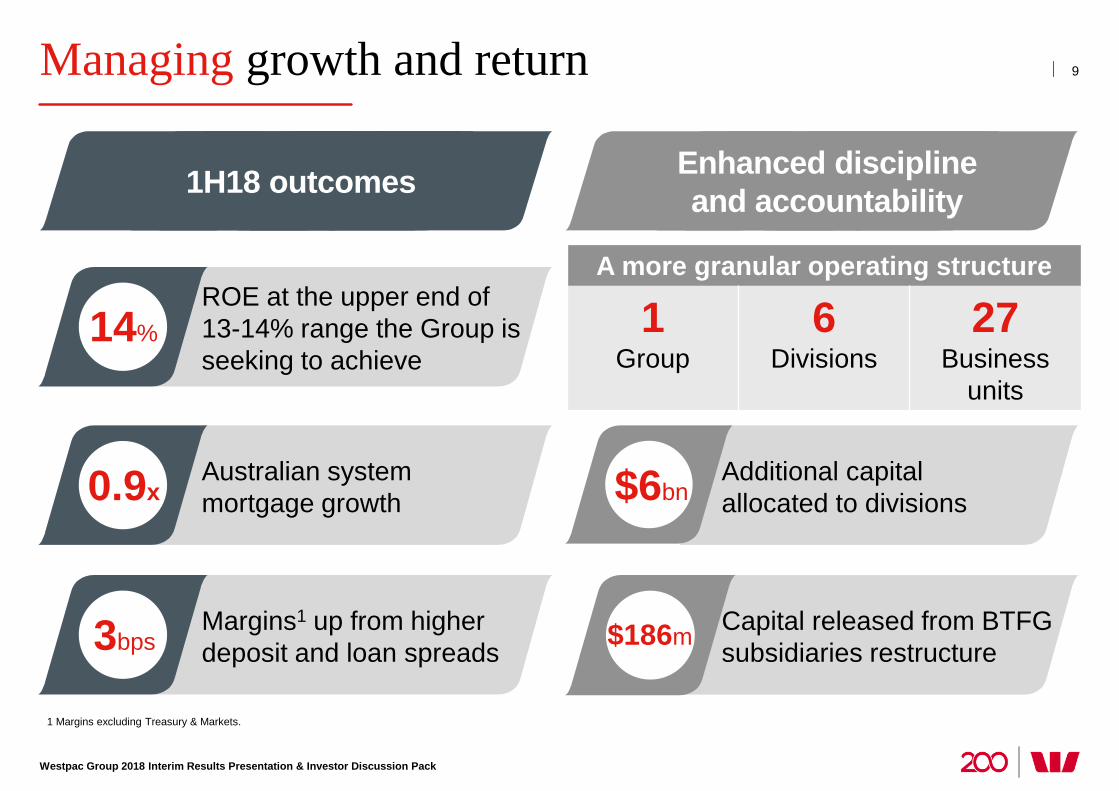
Managing growth and return
1 Margins excluding Treasury & Markets.
9
A more granular operating structure
1 Group
6 Divisions
27 Business
units
14% ROE at the upper end of 13-14% range the Group is seeking to achieve
0.9x Australian system mortgage growth
3bps Margins1 up from higher deposit and loan spreads
$6bn Additional capital allocated to divisions
$186m Capital released from BTFG subsidiaries restructure
Enhanced discipline and accountability 1H18 outcomes
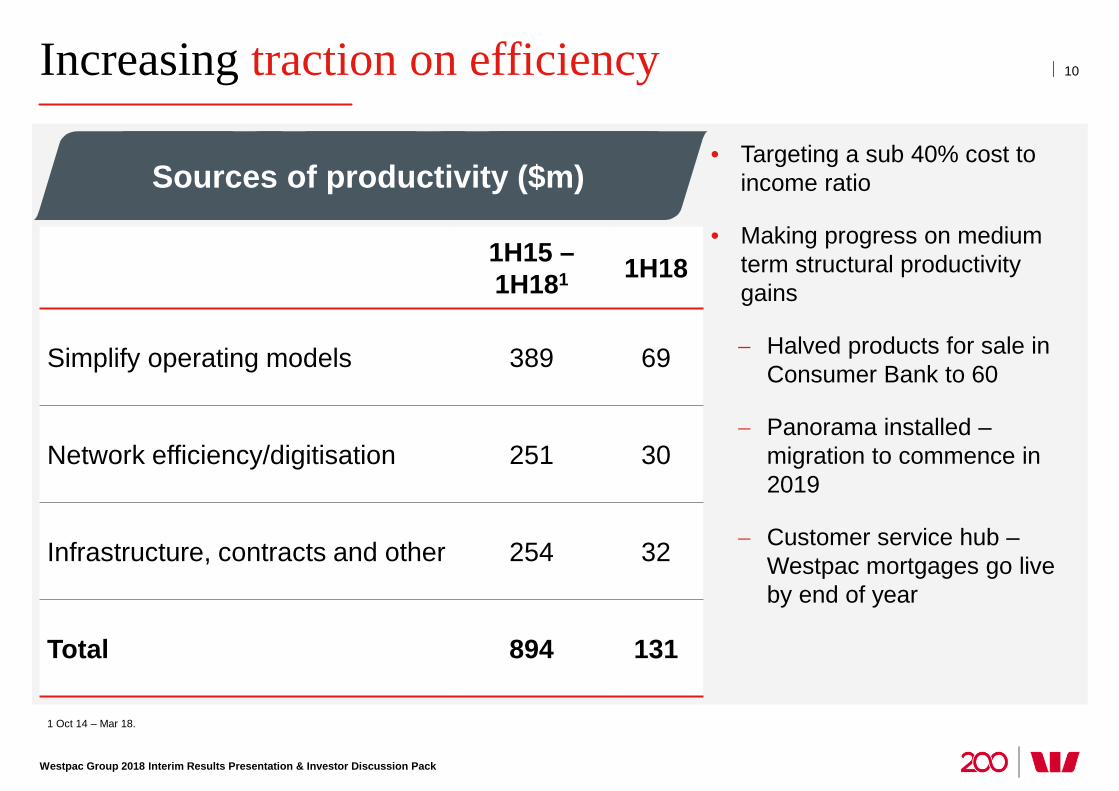
Increasing traction on efficiency
Westpac Group 2018 Interim Results Presentation & Investor Discussion Pack
10
• Targeting a sub 40% cost to income ratio
• Making progress on medium term structural productivity gains
− Halved products for sale in Consumer Bank to 60
− Panorama installed – migration to commence in 2019
− Customer service hub –Westpac mortgages go live by end of year
1H15 – 1H181 1H18
Simplify operating models 389 69
Network efficiency/digitisation 251 30
Infrastructure, contracts and other 254 32
Total 894 131
Sources of productivity ($m)
1 Oct 14 – Mar 18.
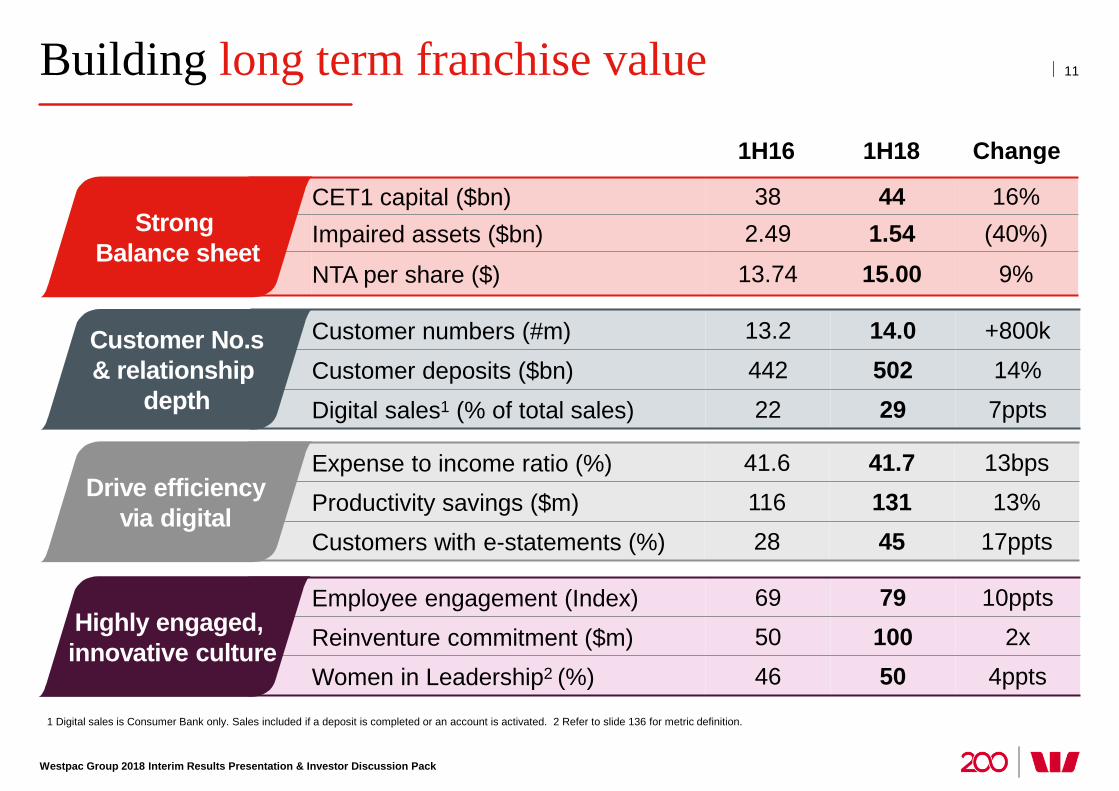
Employee engagement (Index) 69 79 10ppts
Reinventure commitment ($m) 50 100 2x
Women in Leadership2 (%) 46 50 4ppts
Expense to income ratio (%) 41.6 41.7 13bps
Productivity savings ($m) 116 131 13%
Customers with e-statements (%) 28 45 17ppts
Customer numbers (#m) 13.2 14.0 +800k
Customer deposits ($bn) 442 502 14%
Digital sales1 (% of total sales) 22 29 7ppts
CET1 capital ($bn) 38 44 16% Impaired assets ($bn) 2.49 1.54 (40%)
NTA per share ($) 13.74 15.00 9%
Building long term franchise value
1 Digital sales is Consumer Bank only. Sales included if a deposit is completed or an account is activated. 2 Refer to slide 136 for metric definition.
Customer No.s & relationship
depth
Drive efficiency
via digital
Highly engaged, innovative culture
Strong Balance sheet
Westpac Group 2018 Interim Results Presentation & Investor Discussion Pack
11
1H16 1H18 Change
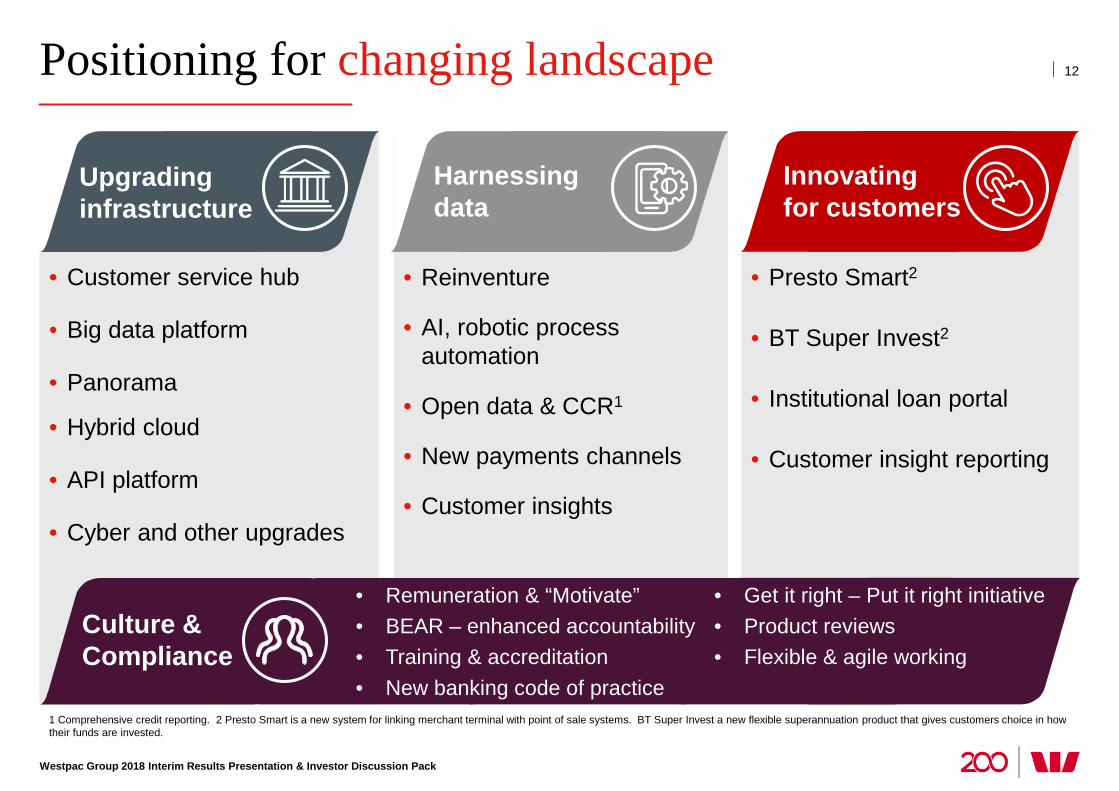
Positioning for changing landscape
Westpac Group 2018 Interim Results Presentation & Investor Discussion Pack
12
• Reinventure
• AI, robotic process automation
• Open data & CCR1
• New payments channels
• Customer insights
• Customer service hub
• Big data platform
• Panorama
• Hybrid cloud
• API platform
• Cyber and other upgrades
Upgrading infrastructure
Harnessing data
Innovating for customers
• Presto Smart2
• BT Super Invest2
• Institutional loan portal
• Customer insight reporting
Culture & Compliance
• Remuneration & “Motivate” • BEAR – enhanced accountability • Training & accreditation • New banking code of practice
• Get it right – Put it right initiative • Product reviews • Flexible & agile working
1 Comprehensive credit reporting. 2 Presto Smart is a new system for linking merchant terminal with point of sale systems. BT Super Invest a new flexible superannuation product that gives customers choice in how their funds are invested.
Westpac Banking Corporation | ABN 33 007 457 141
Peter King Chief Financial Officer
Financial results based on cash earnings unless otherwise stated Refer page 36 for definition. Results principally cover the 1H18, 2H17 and 1H17 periods Comparison of 1H18 versus 2H17 (unless otherwise stated)
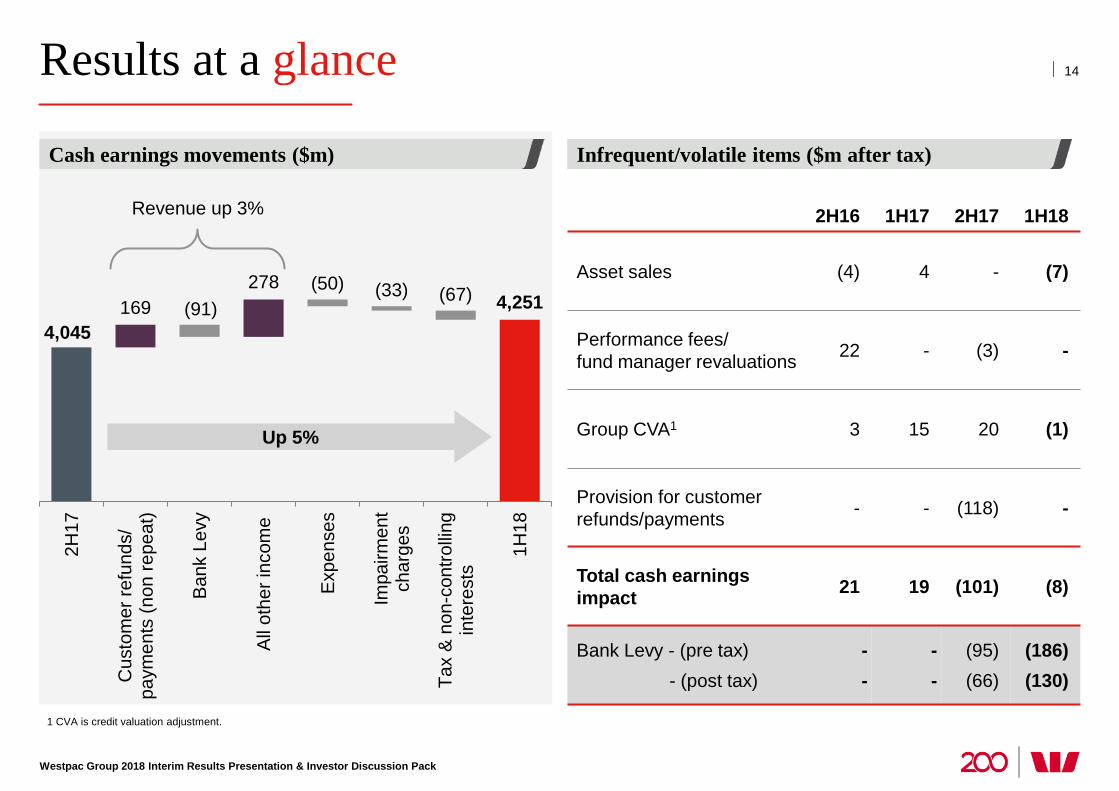
Results at a glance
Westpac Group 2018 Interim Results Presentation & Investor Discussion Pack
1 CVA is credit valuation adjustment.
4,045 4,251 169
278 (91)
(50) (33) (67)
2H17
Cus
tom
er re
fund
s/pa
ymen
ts (n
on re
peat
)
Ban
k Le
vy
All
othe
r inc
ome
Exp
ense
s
Impa
irmen
tch
arge
s
Tax
& n
on-c
ontro
lling
inte
rest
s
1H18
Revenue up 3% 2H16 1H17 2H17 1H18
Asset sales (4) 4 - (7)
Performance fees/ fund manager revaluations 22 - (3) -
Group CVA1 3 15 20 (1)
Provision for customer refunds/payments - - (118) -
Total cash earnings impact 21 19 (101) (8)
Bank Levy - (pre tax) - (post tax)
- -
- -
(95) (66)
(186) (130)
14
Infrequent/volatile items ($m after tax) Cash earnings movements ($m)
Up 5%
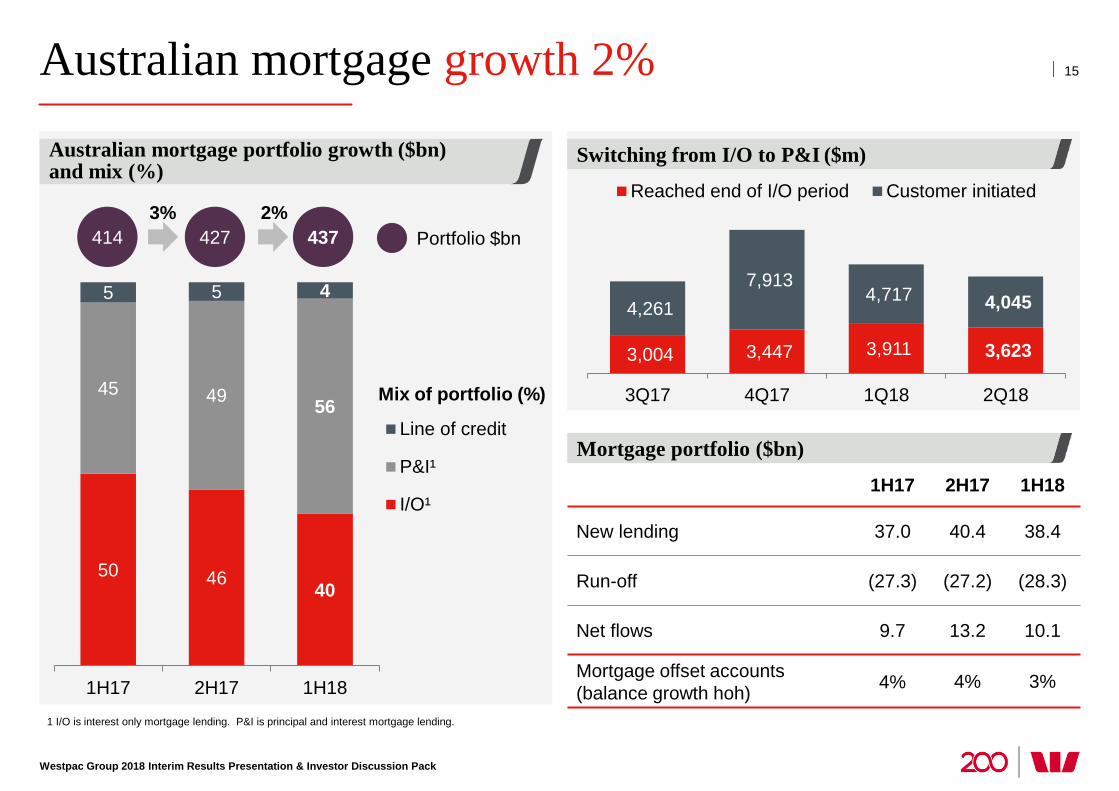
Australian mortgage growth 2%
Westpac Group 2018 Interim Results Presentation & Investor Discussion Pack
1 I/O is interest only mortgage lending. P&I is principal and interest mortgage lending.
50 46 40
45 49 56
5 5 4
1H17 2H17 1H18
Line of credit
P&I¹
I/O¹
3,004 3,447 3,911 3,623
4,261 7,913
4,717 4,045
3Q17 4Q17 1Q18 2Q18
Reached end of I/O period Customer initiated
1H17 2H17 1H18
New lending 37.0 40.4 38.4
Run-off (27.3) (27.2) (28.3)
Net flows 9.7 13.2 10.1
Mortgage offset accounts (balance growth hoh) 4% 4% 3%
Mortgage portfolio ($bn)
Switching from I/O to P&I ($m)
15
414 427 437 3% 2%
Australian mortgage portfolio growth ($bn) and mix (%)
Portfolio $bn
Mix of portfolio (%)
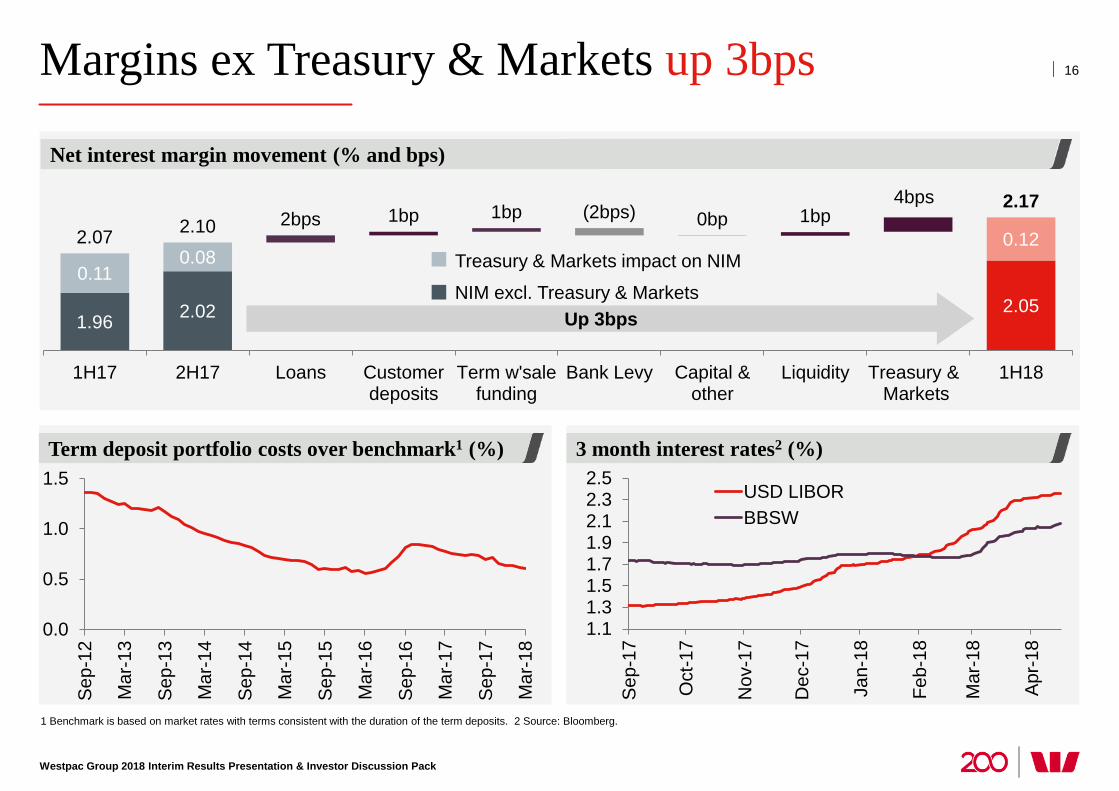
Margins ex Treasury & Markets up 3bps
Net interest margin movement (% and bps)
16
3 month interest rates2 (%) Term deposit portfolio costs over benchmark1 (%)
1 Benchmark is based on market rates with terms consistent with the duration of the term deposits. 2 Source: Bloomberg.
Westpac Group 2018 Interim Results Presentation & Investor Discussion Pack
NIM excl. Treasury & Markets
Treasury & Markets impact on NIM
1.96 2.02 2.05
0.11 0.08
4bps
0.12 2.07 2.10 2bps 1bp 1bp (2bps) 0bp 1bp 2.17
1H17 2H17 Loans Customerdeposits
Term w'salefunding
Bank Levy Capital &other
Liquidity Treasury & Markets
1H18
0.0
0.5
1.0
1.5
Sep
-12
Mar
-13
Sep
-13
Mar
-14
Sep
-14
Mar
-15
Sep
-15
Mar
-16
Sep
-16
Mar
-17
Sep
-17
Mar
-18
1.11.31.51.71.92.12.32.5
Sep
-17
Oct
-17
Nov
-17
Dec
-17
Jan-
18
Feb-
18
Mar
-18
Apr
-18
USD LIBORBBSW
Up 3bps
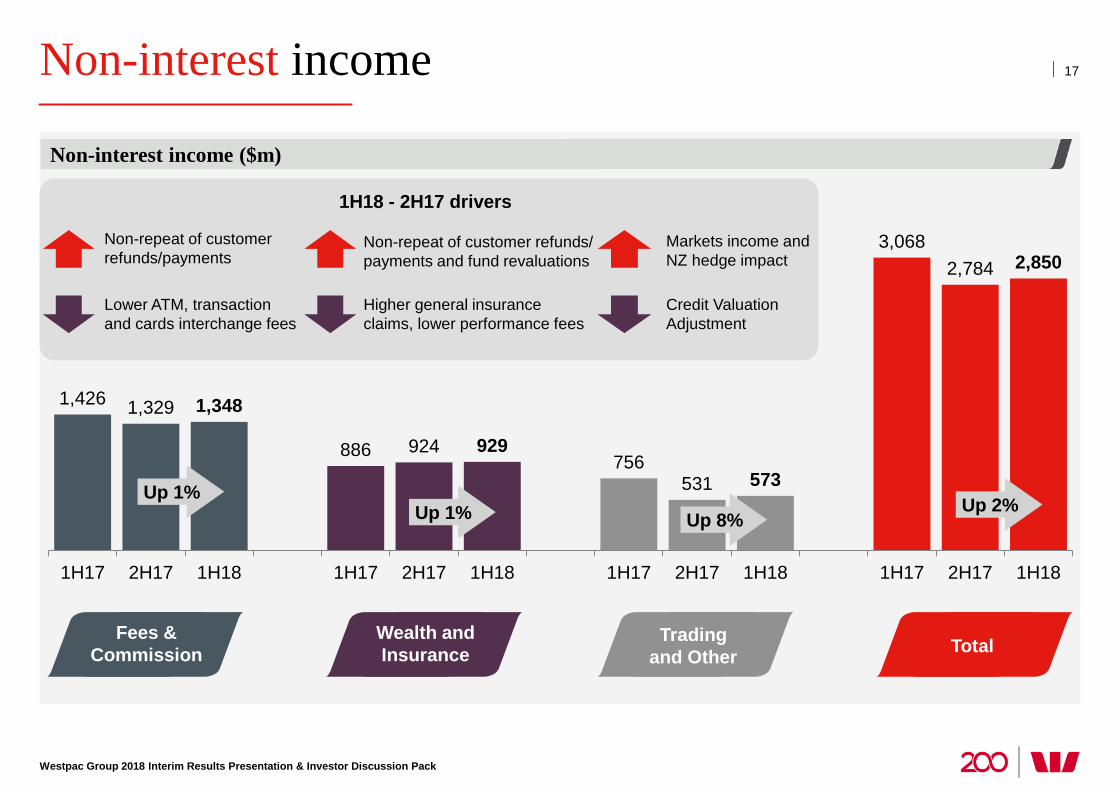
Non-interest income
Westpac Group 2018 Interim Results Presentation & Investor Discussion Pack
Non-interest income ($m)
17
1,426 1,329 1,348
886 924 929 756
531 573
3,068 2,784 2,850
1H17 2H17 1H18 1H17 2H17 1H18 1H17 2H17 1H18 1H17 2H17 1H18
Total
Up 2% Up 1%
Fees & Commission
Wealth and Insurance
Trading and Other Total
Up 1% Up 8%
1H18 - 2H17 drivers
Non-repeat of customer refunds/ payments and fund revaluations
Non-repeat of customer refunds/payments
Lower ATM, transaction and cards interchange fees
Markets income and NZ hedge impact
Credit Valuation Adjustment
Higher general insurance claims, lower performance fees
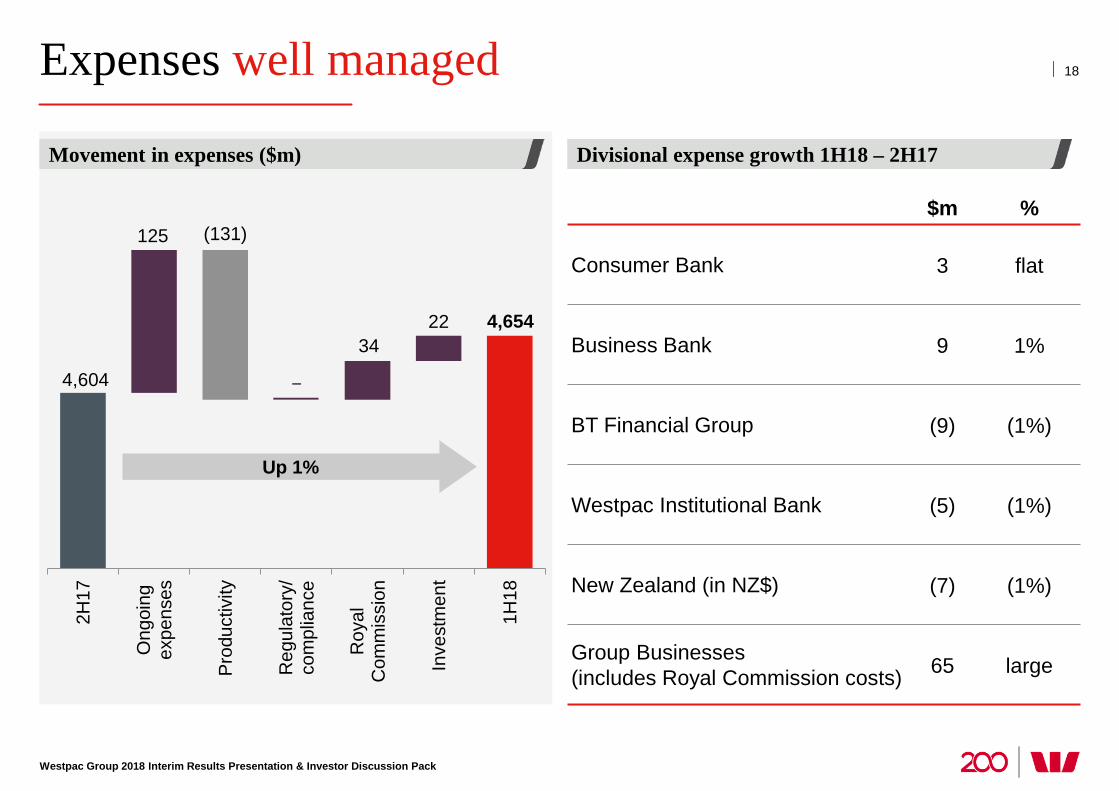
Expenses well managed
Westpac Group 2018 Interim Results Presentation & Investor Discussion Pack
4,604
4,654
125
34 22
(131)
2H17
Ong
oing
expe
nses
Pro
duct
ivity
Reg
ulat
ory/
com
plia
nce
Roy
alC
omm
issi
on
Inve
stm
ent
1H18
Up 1%
–
$m %
Consumer Bank 3 flat
Business Bank 9 1%
BT Financial Group (9) (1%)
Westpac Institutional Bank (5) (1%)
New Zealand (in NZ$) (7) (1%)
Group Businesses (includes Royal Commission costs) 65 large
18
Divisional expense growth 1H18 – 2H17 Movement in expenses ($m)
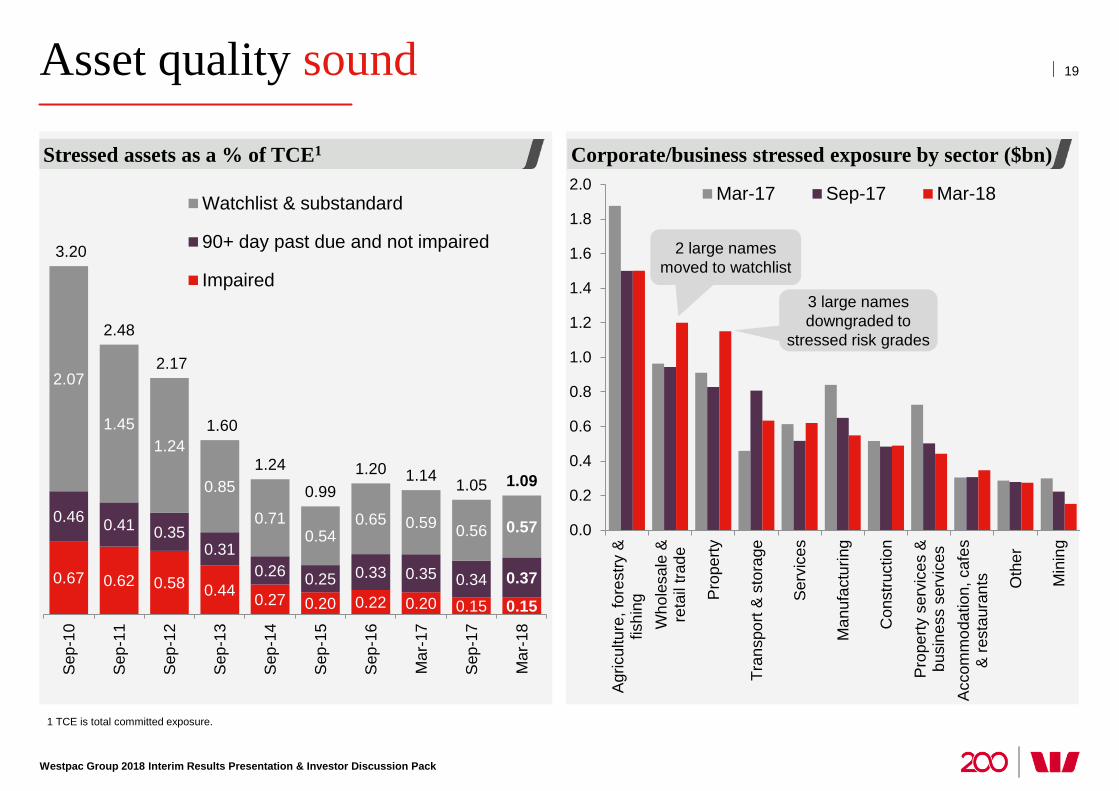
Asset quality sound
Westpac Group 2018 Interim Results Presentation & Investor Discussion Pack
1 TCE is total committed exposure.
0.67 0.62 0.58 0.44 0.27 0.20 0.22 0.20 0.15 0.15
0.46 0.41 0.35 0.31
0.26 0.25 0.33 0.35 0.34 0.37
2.07
1.45 1.24
0.85
0.71 0.54
0.65 0.59 0.56 0.57
3.20
2.48
2.17
1.60
1.24
0.99 1.20 1.14 1.05 1.09
Sep
-10
Sep
-11
Sep
-12
Sep
-13
Sep
-14
Sep
-15
Sep
-16
Mar
-17
Sep
-17
Mar
-18
Watchlist & substandard
90+ day past due and not impaired
Impaired
0.0
0.2
0.4
0.6
0.8
1.0
1.2
1.4
1.6
1.8
2.0
Agr
icul
ture
, for
estry
&fis
hing
Who
lesa
le &
reta
il tra
de
Pro
perty
Tran
spor
t & s
tora
ge
Ser
vice
s
Man
ufac
turin
g
Con
stru
ctio
n
Pro
perty
ser
vice
s &
busi
ness
ser
vice
sA
ccom
mod
atio
n, c
afes
& re
stau
rant
s Oth
er
Min
ing
Mar-17 Sep-17 Mar-18
3 large names downgraded to
stressed risk grades
19
Corporate/business stressed exposure by sector ($bn) Stressed assets as a % of TCE1
2 large names moved to watchlist
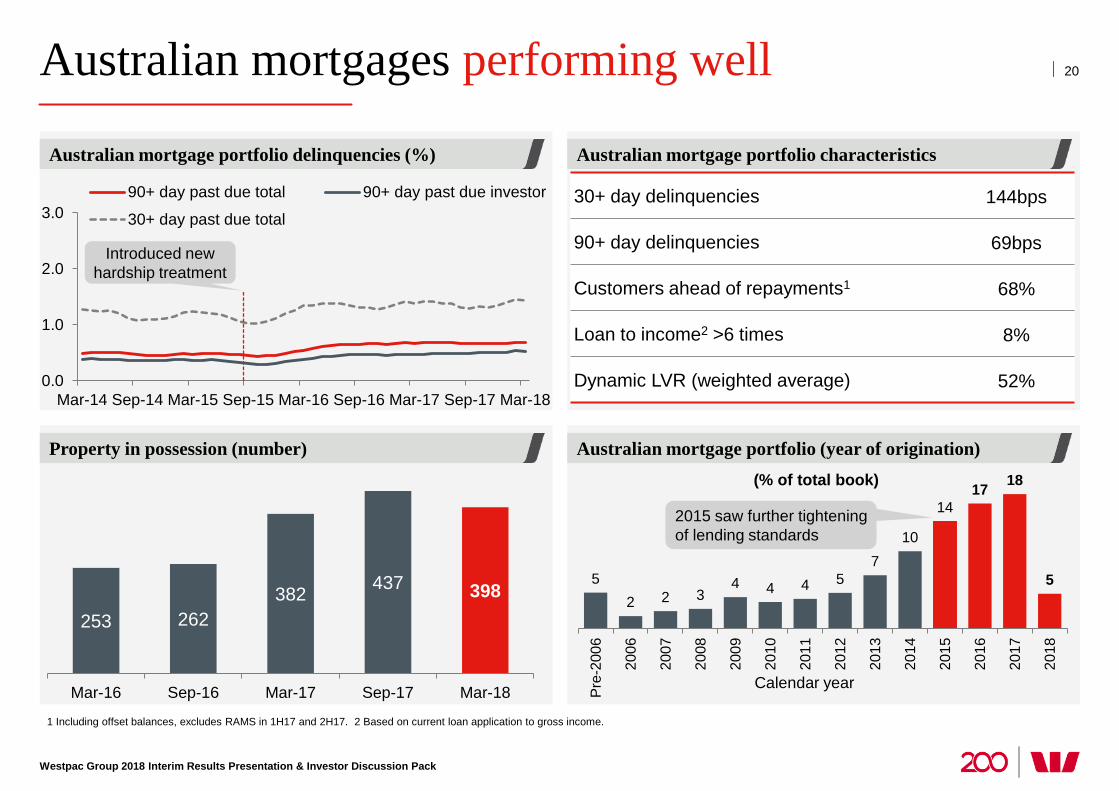
Australian mortgages performing well
Westpac Group 2018 Interim Results Presentation & Investor Discussion Pack
Australian mortgage portfolio (year of origination)
Australian mortgage portfolio delinquencies (%)
Property in possession (number)
1 Including offset balances, excludes RAMS in 1H17 and 2H17. 2 Based on current loan application to gross income.
20
(% of total book)
0.0
1.0
2.0
3.0
Mar-14 Sep-14 Mar-15 Sep-15 Mar-16 Sep-16 Mar-17 Sep-17 Mar-18
90+ day past due total 90+ day past due investor
30+ day past due total
253 262 382 437 398
Mar-16 Sep-16 Mar-17 Sep-17 Mar-18
Australian mortgage portfolio characteristics
5 2 2 3
4 4 4 5 7
10
14 17 18
5 Pr
e-20
06
2006
2007
2008
2009
2010
2011
2012
2013
2014
2015
2016
2017
2018
2015 saw further tightening of lending standards
Calendar year
30+ day delinquencies 144bps
90+ day delinquencies 69bps
Customers ahead of repayments1 68%
Loan to income2 >6 times 8%
Dynamic LVR (weighted average) 52%
Introduced new hardship treatment
Westpac Group 2018 Interim Results Presentation & Investor Discussion Pack
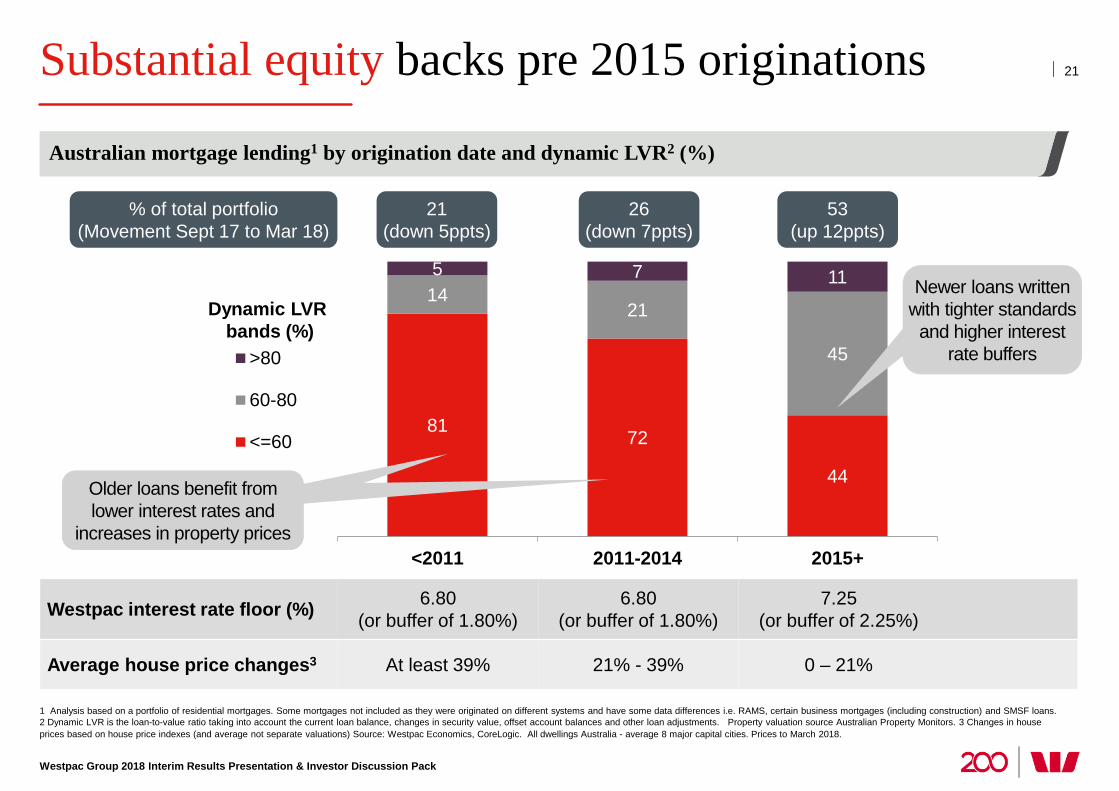
Substantial equity backs pre 2015 originations 21
81 72
44
14 21
45
5 7 11
<2011 2011-2014 2015+
>80
60-80
<=60
Westpac interest rate floor (%) 6.80 (or buffer of 1.80%)
6.80 (or buffer of 1.80%)
7.25 (or buffer of 2.25%)
Average house price changes3 At least 39% 21% - 39% 0 – 21%
1 Analysis based on a portfolio of residential mortgages. Some mortgages not included as they were originated on different systems and have some data differences i.e. RAMS, certain business mortgages (including construction) and SMSF loans. 2 Dynamic LVR is the loan-to-value ratio taking into account the current loan balance, changes in security value, offset account balances and other loan adjustments. Property valuation source Australian Property Monitors. 3 Changes in house prices based on house price indexes (and average not separate valuations) Source: Westpac Economics, CoreLogic. All dwellings Australia - average 8 major capital cities. Prices to March 2018.
Dynamic LVR bands (%)
Australian mortgage lending1 by origination date and dynamic LVR2 (%)
Newer loans written with tighter standards
and higher interest rate buffers
% of total portfolio (Movement Sept 17 to Mar 18)
53 (up 12ppts)
26 (down 7ppts)
21 (down 5ppts)
Older loans benefit from lower interest rates and
increases in property prices
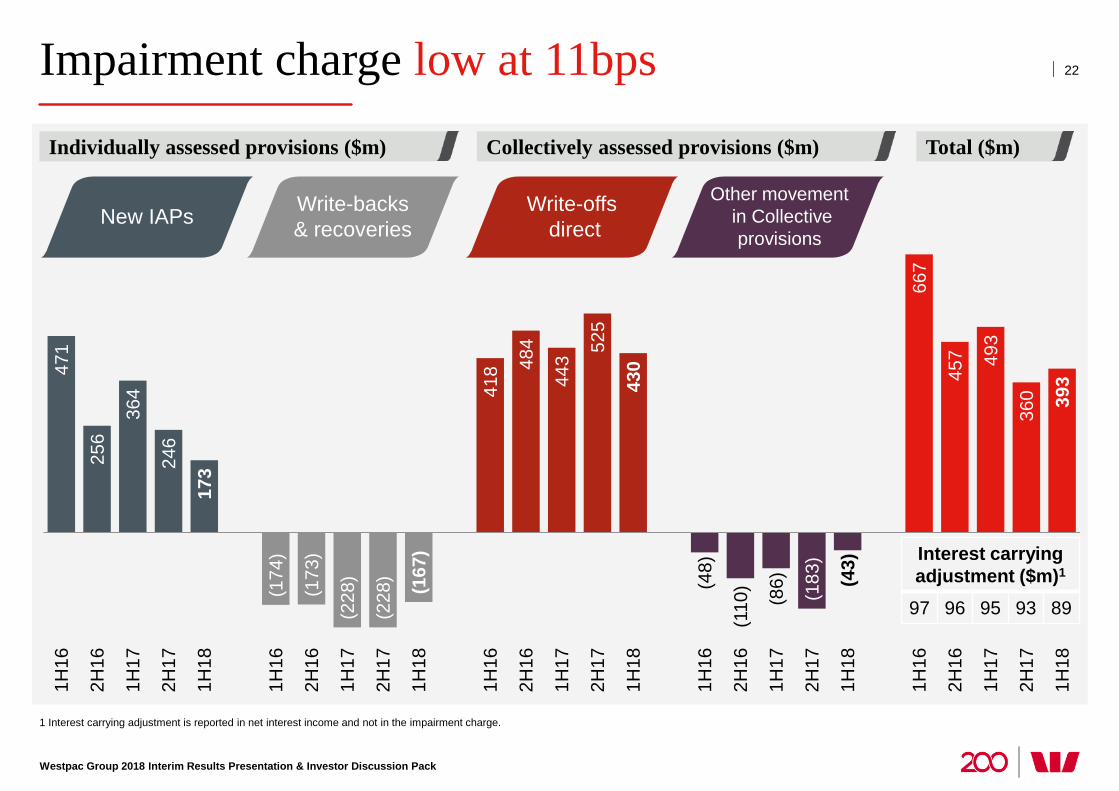
Impairment charge low at 11bps
1 Interest carrying adjustment is reported in net interest income and not in the impairment charge.
22
Total ($m) Collectively assessed provisions ($m) Individually assessed provisions ($m)
471
256
364
246
173
(174
)
(173
)
(228
)
(228
) (167
)
418 48
4
443
525
430
(48)
(110
)
(86)
(183
)
(43)
667
457 49
3
360 39
3
1H16
2H16
1H17
2H17
1H18
1H16
2H16
1H17
2H17
1H18
1H16
2H16
1H17
2H17
1H18
1H16
2H16
1H17
2H17
1H18
1H16
2H16
1H17
2H17
1H18
New IAPs Write-backs & recoveries
Write-offs direct
Other movement in Collective
provisions
Westpac Group 2018 Interim Results Presentation & Investor Discussion Pack
Interest carrying adjustment ($m)1
97 96 95 93 89
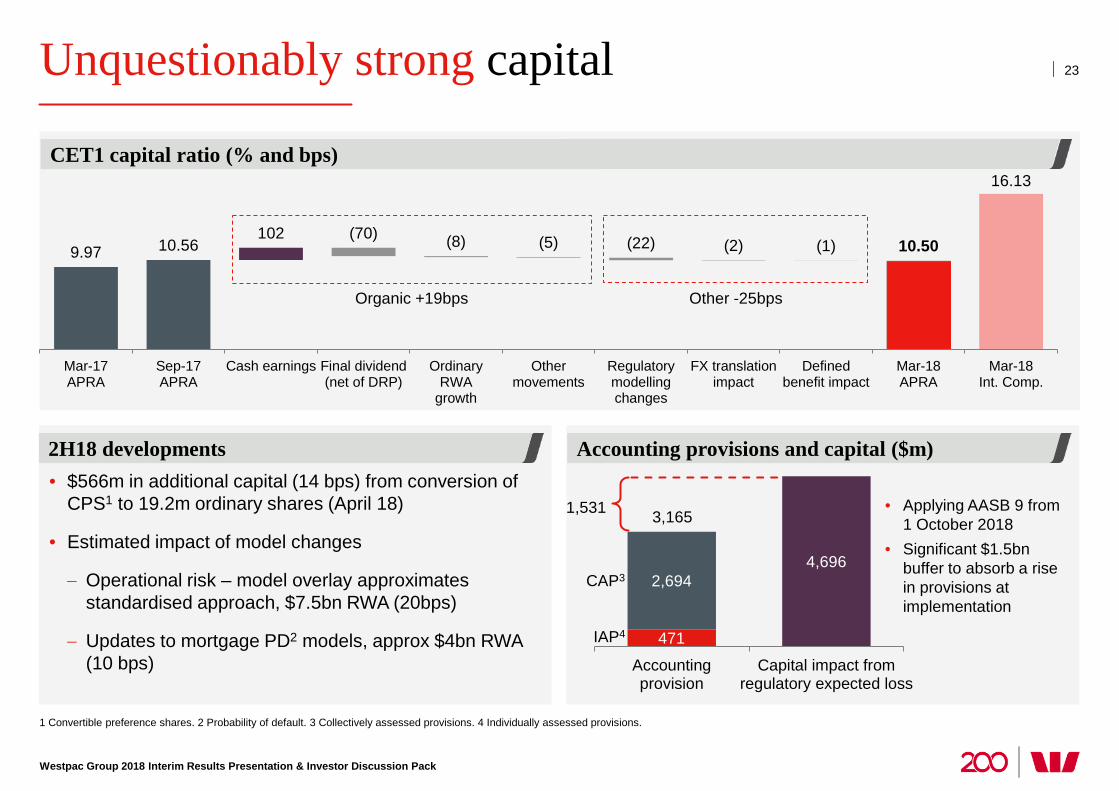
Unquestionably strong capital
CET1 capital ratio (% and bps)
23
Accounting provisions and capital ($m) 2H18 developments
Westpac Group 2018 Interim Results Presentation & Investor Discussion Pack
9.97 10.56 102
10.50
16.13
(70) (8) (5) (22) (2) (1)
Mar-17APRA
Sep-17APRA
Cash earnings Final dividend(net of DRP)
OrdinaryRWA
growth
Othermovements
Regulatorymodellingchanges
FX translationimpact
Definedbenefit impact
Mar-18APRA
Mar-18Int. Comp.
Organic +19bps Other -25bps
• $566m in additional capital (14 bps) from conversion of CPS1 to 19.2m ordinary shares (April 18)
• Estimated impact of model changes
− Operational risk – model overlay approximates standardised approach, $7.5bn RWA (20bps)
− Updates to mortgage PD2 models, approx $4bn RWA (10 bps)
471
2,694 4,696
Accountingprovision
Capital impact fromregulatory expected loss
IAP4
CAP3
• Applying AASB 9 from 1 October 2018
• Significant $1.5bn buffer to absorb a rise in provisions at implementation
3,165
1 Convertible preference shares. 2 Probability of default. 3 Collectively assessed provisions. 4 Individually assessed provisions.
1,531
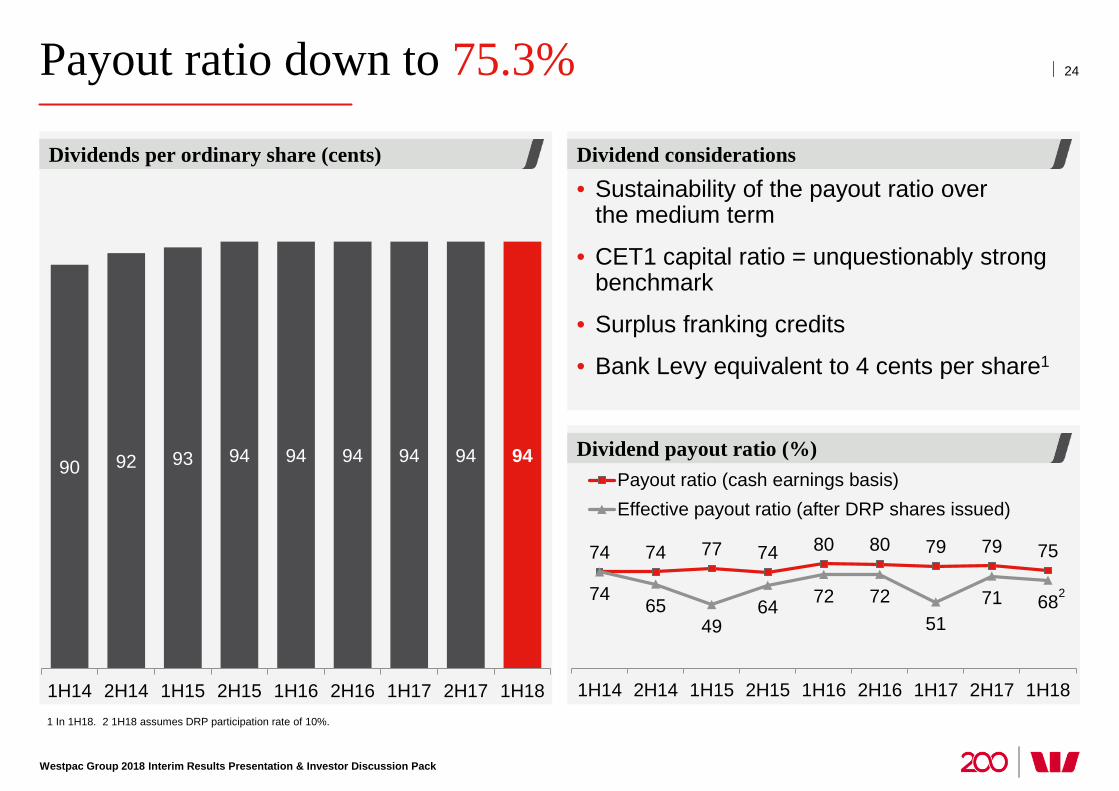
Payout ratio down to 75.3%
Westpac Group 2018 Interim Results Presentation & Investor Discussion Pack
1 In 1H18. 2 1H18 assumes DRP participation rate of 10%.
Dividend payout ratio (%)
Dividend considerations Dividends per ordinary share (cents)
24
90 92 93 94 94 94 94 94 94
1H14 2H14 1H15 2H15 1H16 2H16 1H17 2H17 1H18
• Sustainability of the payout ratio over the medium term
• CET1 capital ratio = unquestionably strong benchmark
• Surplus franking credits
• Bank Levy equivalent to 4 cents per share1
74 74 77 74 80 80 79 79 75
74 65 49
64 72 72 51
71 68
1H14 2H14 1H15 2H15 1H16 2H16 1H17 2H17 1H18
Payout ratio (cash earnings basis)Effective payout ratio (after DRP shares issued)
2
Westpac Group 2018 Interim Results Presentation & Investor Discussion Pack
Considerations for 2H18
• Remaining disciplined on growth/return
• Expect system lending growth to further moderate
• Margins: further mortgage switching and higher funding costs
• Hastings exit: small cash earnings impact, will lift revenue and expenses
• Targeting similar productivity savings as 1H18. Excluding Hastings impact, expected cost growth for FY18 to be in the range of 2-3%
• Capital: $566m of CPS converted to equity, RWA model changes in 4Q18
• Asset quality expected to remain in good shape
25
Westpac Banking Corporation | ABN 33 007 457 141
Brian Hartzer Chief Executive Officer
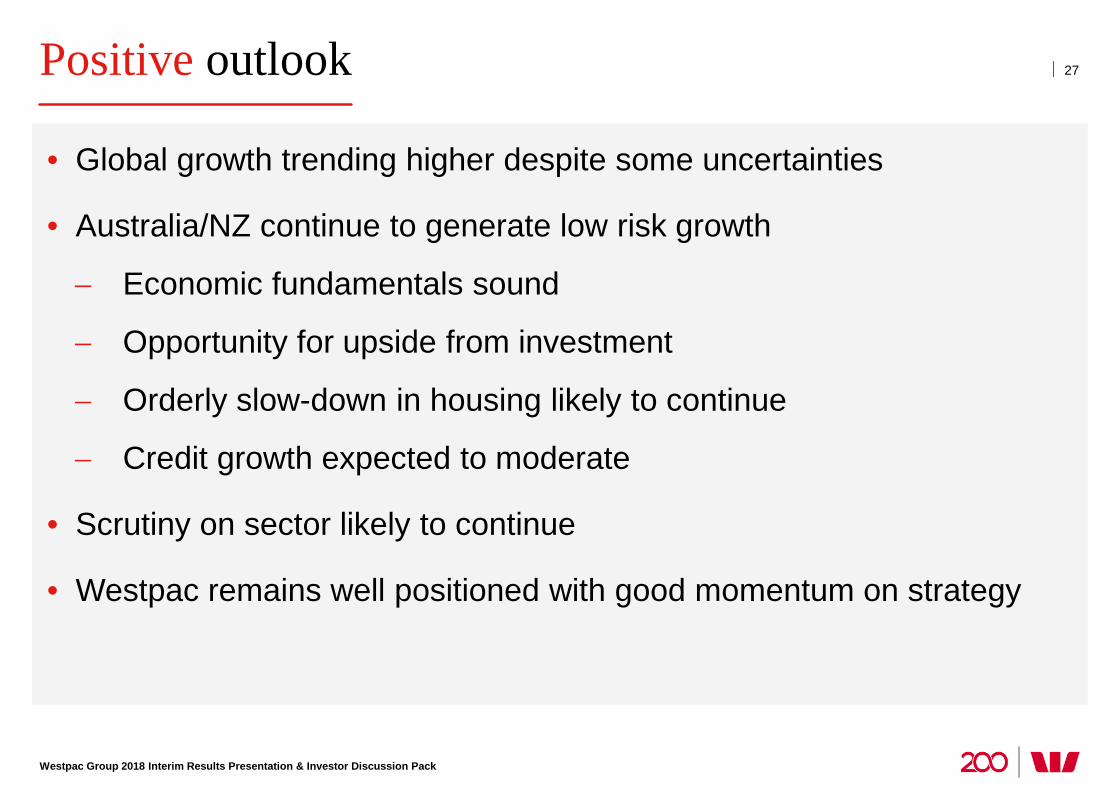
Positive outlook
• Global growth trending higher despite some uncertainties
• Australia/NZ continue to generate low risk growth
− Economic fundamentals sound
− Opportunity for upside from investment
− Orderly slow-down in housing likely to continue
− Credit growth expected to moderate
• Scrutiny on sector likely to continue
• Westpac remains well positioned with good momentum on strategy
27
Westpac Group 2018 Interim Results Presentation & Investor Discussion Pack

Investor Discussion Pack
Financial results based on cash earnings unless otherwise stated Refer page 36 for definition. Results principally cover the 1H18, 2H17 and 1H17 periods Comparison of 1H18 versus 2H17 (unless otherwise stated)

Strategy
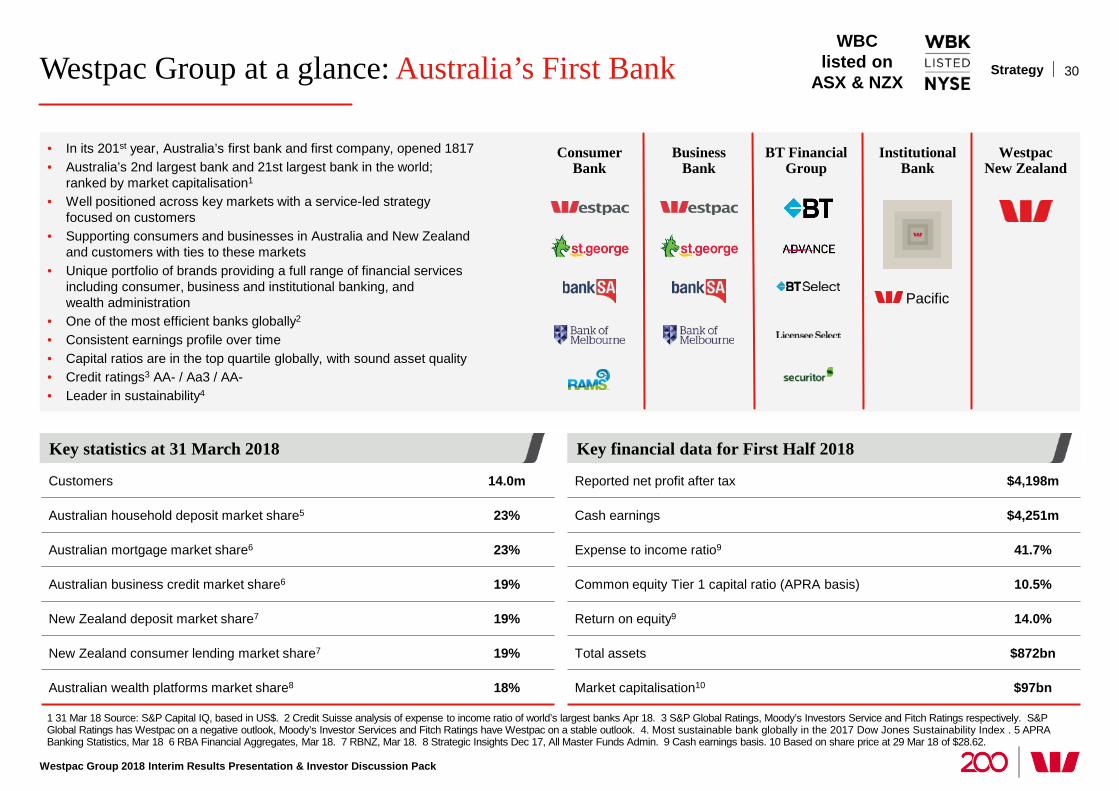
Westpac Group at a glance: Australia’s First Bank
Westpac Group 2018 Interim Results Presentation & Investor Discussion Pack
1 31 Mar 18 Source: S&P Capital IQ, based in US$. 2 Credit Suisse analysis of expense to income ratio of world’s largest banks Apr 18. 3 S&P Global Ratings, Moody’s Investors Service and Fitch Ratings respectively. S&P Global Ratings has Westpac on a negative outlook, Moody’s Investor Services and Fitch Ratings have Westpac on a stable outlook. 4. Most sustainable bank globally in the 2017 Dow Jones Sustainability Index . 5 APRA Banking Statistics, Mar 18 6 RBA Financial Aggregates, Mar 18. 7 RBNZ, Mar 18. 8 Strategic Insights Dec 17, All Master Funds Admin. 9 Cash earnings basis. 10 Based on share price at 29 Mar 18 of $28.62.
30
WBC listed on
ASX & NZX Strategy
• In its 201st year, Australia’s first bank and first company, opened 1817 • Australia’s 2nd largest bank and 21st largest bank in the world;
ranked by market capitalisation1 • Well positioned across key markets with a service-led strategy
focused on customers • Supporting consumers and businesses in Australia and New Zealand
and customers with ties to these markets • Unique portfolio of brands providing a full range of financial services
including consumer, business and institutional banking, and wealth administration
• One of the most efficient banks globally2
• Consistent earnings profile over time • Capital ratios are in the top quartile globally, with sound asset quality • Credit ratings3 AA- / Aa3 / AA-
• Leader in sustainability4
Institutional Bank
Westpac New Zealand
Consumer Bank
Pacific
Business Bank
BT Financial Group
Key statistics at 31 March 2018 Key financial data for First Half 2018
Reported net profit after tax $4,198m
Cash earnings $4,251m
Expense to income ratio9 41.7%
Common equity Tier 1 capital ratio (APRA basis) 10.5%
Return on equity9 14.0%
Total assets $872bn
Market capitalisation10 $97bn
Customers 14.0m
Australian household deposit market share5 23%
Australian mortgage market share6 23%
Australian business credit market share6 19%
New Zealand deposit market share7 19%
New Zealand consumer lending market share7 19%
Australian wealth platforms market share8 18%
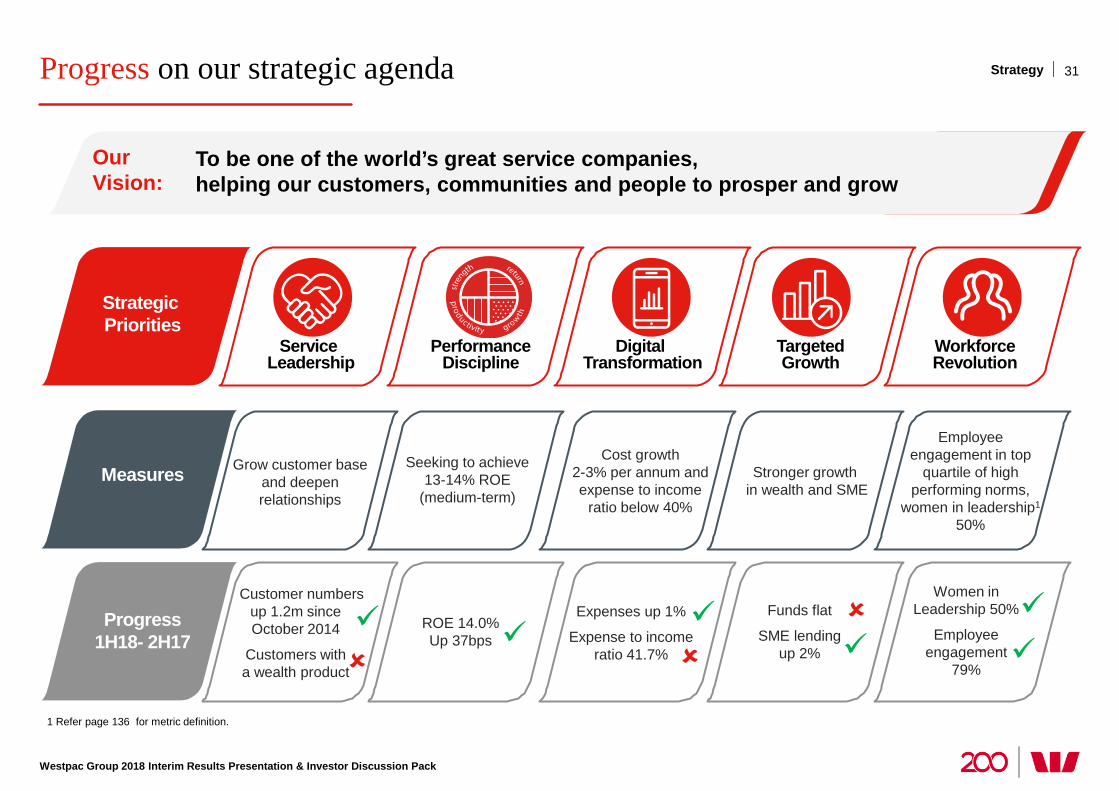
Progress on our strategic agenda
1 Refer page 136 for metric definition.
Strategy
Digital Transformation
Targeted Growth
Workforce Revolution
Measures
Progress 1H18- 2H17
Cost growth 2-3% per annum and expense to income
ratio below 40%
Stronger growth in wealth and SME
Employee engagement in top
quartile of high performing norms,
women in leadership1 50%
Expenses up 1%
Expense to income ratio 41.7%
Funds flat
SME lending up 2%
Women in Leadership 50%
Employee engagement
79%
Strategic Priorities
Our Vision:
To be one of the world’s great service companies, helping our customers, communities and people to prosper and grow
Performance Discipline
Seeking to achieve 13-14% ROE
(medium-term)
ROE 14.0% Up 37bps
Service Leadership
Grow customer base and deepen relationships
Customer numbers up 1.2m since October 2014
Customers with a wealth product
Westpac Group 2018 Interim Results Presentation & Investor Discussion Pack
31
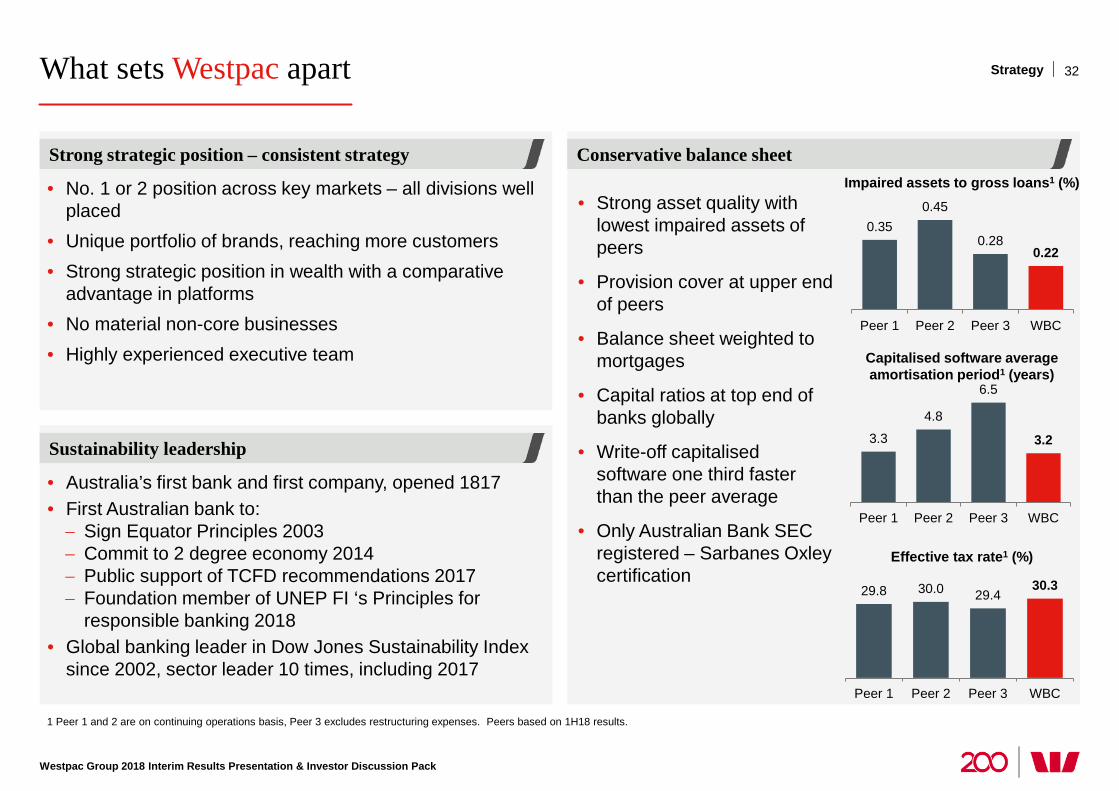
What sets Westpac apart
Westpac Group 2018 Interim Results Presentation & Investor Discussion Pack
Strong strategic position – consistent strategy
Sustainability leadership
1 Peer 1 and 2 are on continuing operations basis, Peer 3 excludes restructuring expenses. Peers based on 1H18 results.
• Strong asset quality with lowest impaired assets of peers
• Provision cover at upper end of peers
• Balance sheet weighted to mortgages
• Capital ratios at top end of banks globally
• Write-off capitalised software one third faster than the peer average
• Only Australian Bank SEC registered – Sarbanes Oxley certification
• Australia’s first bank and first company, opened 1817 • First Australian bank to: − Sign Equator Principles 2003 − Commit to 2 degree economy 2014 − Public support of TCFD recommendations 2017 − Foundation member of UNEP FI ‘s Principles for
responsible banking 2018 • Global banking leader in Dow Jones Sustainability Index
since 2002, sector leader 10 times, including 2017
Conservative balance sheet
32 Strategy
• No. 1 or 2 position across key markets – all divisions well placed
• Unique portfolio of brands, reaching more customers • Strong strategic position in wealth with a comparative
advantage in platforms • No material non-core businesses • Highly experienced executive team
0.35 0.45
0.28 0.22
Peer 1 Peer 2 Peer 3 WBC
29.8 30.0 29.4 30.3
Peer 1 Peer 2 Peer 3 WBC
3.3
4.8
6.5
3.2
Peer 1 Peer 2 Peer 3 WBC
Impaired assets to gross loans1 (%)
Capitalised software average amortisation period1 (years)
Effective tax rate1 (%)
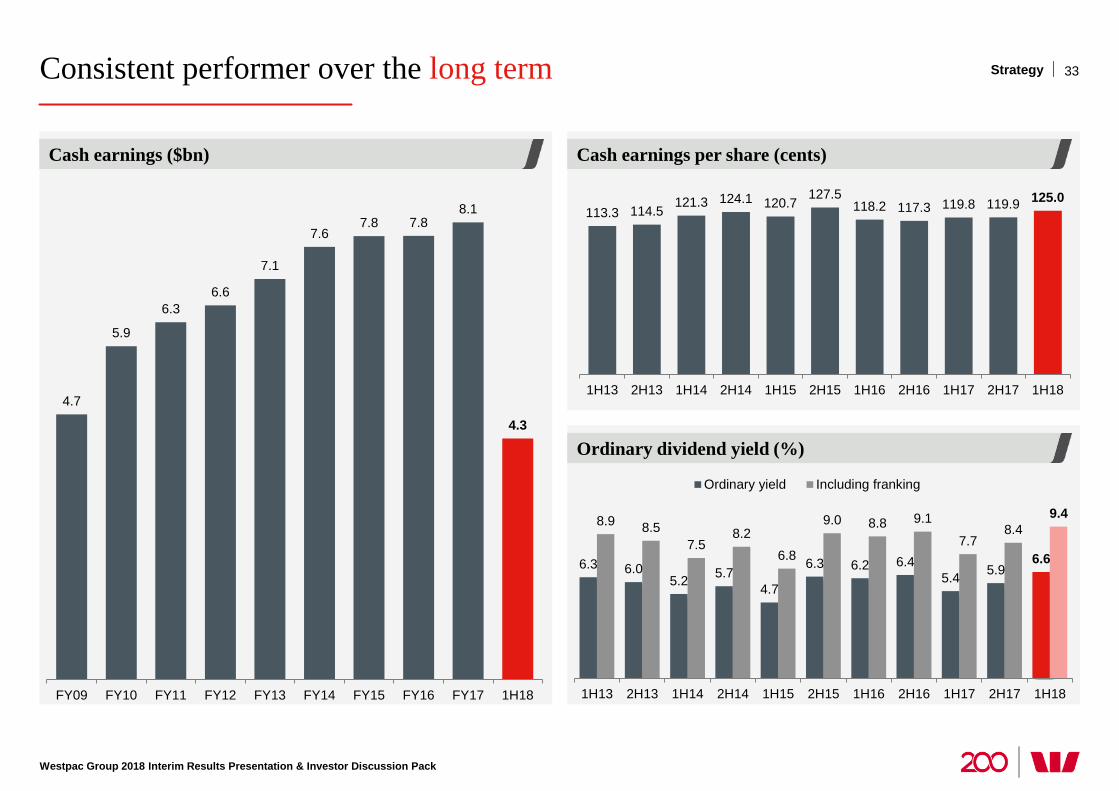
Consistent performer over the long term
Westpac Group 2018 Interim Results Presentation & Investor Discussion Pack
Ordinary dividend yield (%)
Cash earnings per share (cents) Cash earnings ($bn)
33 Strategy
113.3 114.5 121.3 124.1 120.7
127.5 118.2 117.3 119.8 119.9 125.0
1H13 2H13 1H14 2H14 1H15 2H15 1H16 2H16 1H17 2H17 1H18
6.3 6.0 5.2 5.7
4.7
6.3 6.2 6.4 5.4 5.9
6.6
8.9 8.5 7.5
8.2 6.8
9.0 8.8 9.1
7.7 8.4
9.4
1H13 2H13 1H14 2H14 1H15 2H15 1H16 2H16 1H17 2H17 1H18
Ordinary yield Including franking
4.7
5.9
6.3 6.6
7.1
7.6 7.8 7.8
8.1
4.3
FY09 FY10 FY11 FY12 FY13 FY14 FY15 FY16 FY17 1H18
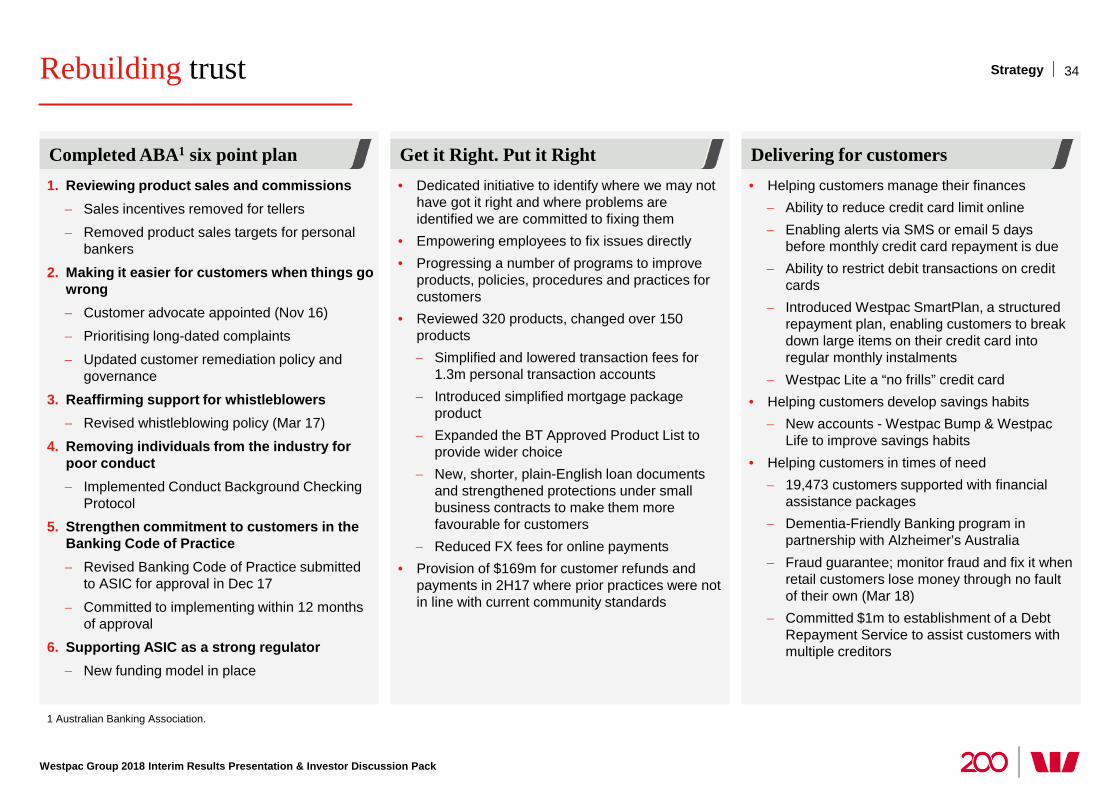
Rebuilding trust
Westpac Group 2018 Interim Results Presentation & Investor Discussion Pack
1 Australian Banking Association.
1. Reviewing product sales and commissions − Sales incentives removed for tellers − Removed product sales targets for personal
bankers
2. Making it easier for customers when things go wrong − Customer advocate appointed (Nov 16) − Prioritising long-dated complaints
− Updated customer remediation policy and governance
3. Reaffirming support for whistleblowers − Revised whistleblowing policy (Mar 17)
4. Removing individuals from the industry for poor conduct − Implemented Conduct Background Checking
Protocol 5. Strengthen commitment to customers in the
Banking Code of Practice − Revised Banking Code of Practice submitted
to ASIC for approval in Dec 17
− Committed to implementing within 12 months of approval
6. Supporting ASIC as a strong regulator − New funding model in place
Completed ABA1 six point plan
34
• Dedicated initiative to identify where we may not have got it right and where problems are identified we are committed to fixing them
• Empowering employees to fix issues directly • Progressing a number of programs to improve
products, policies, procedures and practices for customers
• Reviewed 320 products, changed over 150 products − Simplified and lowered transaction fees for
1.3m personal transaction accounts − Introduced simplified mortgage package
product − Expanded the BT Approved Product List to
provide wider choice − New, shorter, plain-English loan documents
and strengthened protections under small business contracts to make them more favourable for customers
− Reduced FX fees for online payments • Provision of $169m for customer refunds and
payments in 2H17 where prior practices were not in line with current community standards
Get it Right. Put it Right • Helping customers manage their finances
− Ability to reduce credit card limit online − Enabling alerts via SMS or email 5 days
before monthly credit card repayment is due − Ability to restrict debit transactions on credit
cards − Introduced Westpac SmartPlan, a structured
repayment plan, enabling customers to break down large items on their credit card into regular monthly instalments
− Westpac Lite a “no frills” credit card • Helping customers develop savings habits
− New accounts - Westpac Bump & Westpac Life to improve savings habits
• Helping customers in times of need − 19,473 customers supported with financial
assistance packages − Dementia-Friendly Banking program in
partnership with Alzheimer’s Australia − Fraud guarantee; monitor fraud and fix it when
retail customers lose money through no fault of their own (Mar 18)
− Committed $1m to establishment of a Debt Repayment Service to assist customers with multiple creditors
Delivering for customers
Strategy
Overview
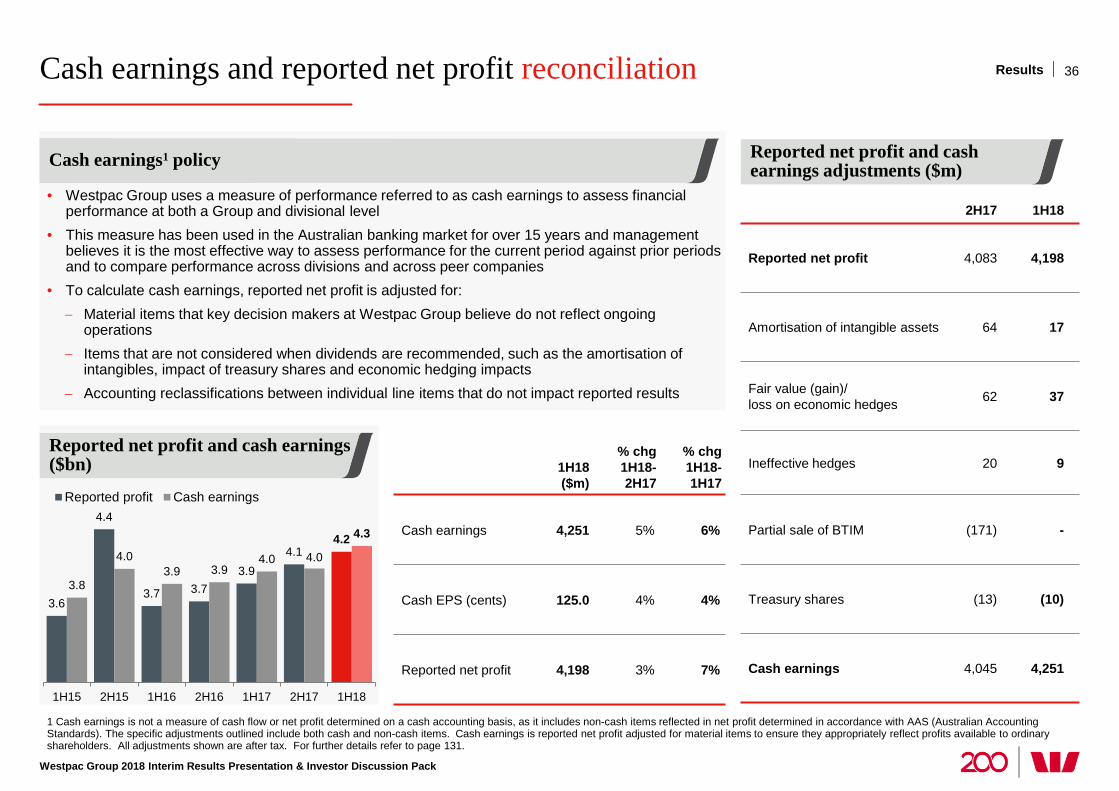
Cash earnings and reported net profit reconciliation
Westpac Group 2018 Interim Results Presentation & Investor Discussion Pack
1 Cash earnings is not a measure of cash flow or net profit determined on a cash accounting basis, as it includes non-cash items reflected in net profit determined in accordance with AAS (Australian Accounting Standards). The specific adjustments outlined include both cash and non-cash items. Cash earnings is reported net profit adjusted for material items to ensure they appropriately reflect profits available to ordinary shareholders. All adjustments shown are after tax. For further details refer to page 131.
36 Results
Reported net profit and cash earnings adjustments ($m)
2H17 1H18
Reported net profit 4,083 4,198
Amortisation of intangible assets 64 17
Fair value (gain)/ loss on economic hedges 62 37
Ineffective hedges 20 9
Partial sale of BTIM (171) -
Treasury shares (13) (10)
Cash earnings 4,045 4,251
• Westpac Group uses a measure of performance referred to as cash earnings to assess financial performance at both a Group and divisional level
• This measure has been used in the Australian banking market for over 15 years and management believes it is the most effective way to assess performance for the current period against prior periods and to compare performance across divisions and across peer companies
• To calculate cash earnings, reported net profit is adjusted for: − Material items that key decision makers at Westpac Group believe do not reflect ongoing
operations − Items that are not considered when dividends are recommended, such as the amortisation of
intangibles, impact of treasury shares and economic hedging impacts − Accounting reclassifications between individual line items that do not impact reported results
Reported net profit and cash earnings ($bn) 1H18
($m)
% chg 1H18-2H17
% chg 1H18-1H17
Cash earnings 4,251 5% 6%
Cash EPS (cents) 125.0 4% 4%
Reported net profit 4,198 3% 7%
3.6
4.4
3.7 3.7 3.9
4.1 4.2
3.8
4.0 3.9 3.9
4.0 4.0
4.3
1H15 2H15 1H16 2H16 1H17 2H17 1H18
Reported profit Cash earnings
Cash earnings1 policy
Westpac Group 2018 Interim Results Presentation & Investor Discussion Pack
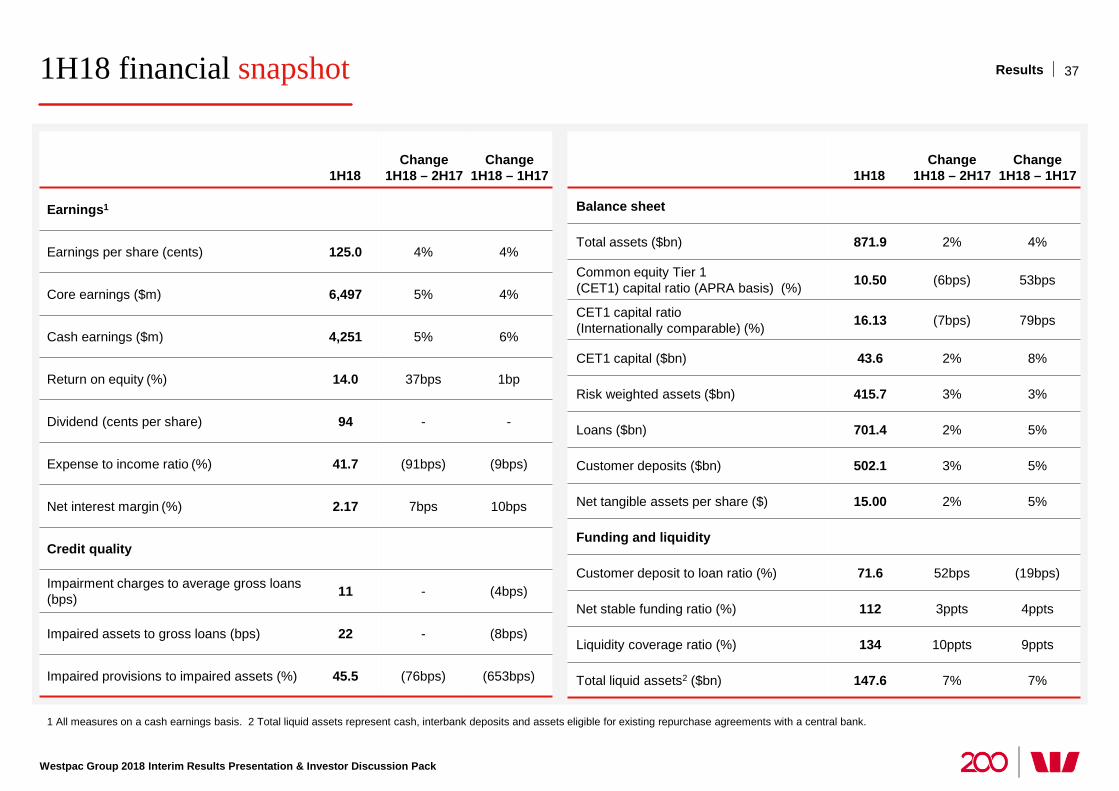
1H18 financial snapshot
1 All measures on a cash earnings basis. 2 Total liquid assets represent cash, interbank deposits and assets eligible for existing repurchase agreements with a central bank.
37 Results
1H18 Change
1H18 – 2H17 Change
1H18 – 1H17
Earnings1
Earnings per share (cents) 125.0 4% 4%
Core earnings ($m) 6,497 5% 4%
Cash earnings ($m) 4,251 5% 6%
Return on equity (%) 14.0 37bps 1bp
Dividend (cents per share) 94 - -
Expense to income ratio (%) 41.7 (91bps) (9bps)
Net interest margin (%) 2.17 7bps 10bps
Credit quality
Impairment charges to average gross loans (bps) 11 - (4bps)
Impaired assets to gross loans (bps) 22 - (8bps)
Impaired provisions to impaired assets (%) 45.5 (76bps) (653bps)
1H18 Change
1H18 – 2H17 Change
1H18 – 1H17
Balance sheet
Total assets ($bn) 871.9 2% 4%
Common equity Tier 1 (CET1) capital ratio (APRA basis) (%) 10.50 (6bps) 53bps
CET1 capital ratio (Internationally comparable) (%) 16.13 (7bps) 79bps
CET1 capital ($bn) 43.6 2% 8%
Risk weighted assets ($bn) 415.7 3% 3%
Loans ($bn) 701.4 2% 5%
Customer deposits ($bn) 502.1 3% 5%
Net tangible assets per share ($) 15.00 2% 5%
Funding and liquidity
Customer deposit to loan ratio (%) 71.6 52bps (19bps)
Net stable funding ratio (%) 112 3ppts 4ppts
Liquidity coverage ratio (%) 134 10ppts 9ppts
Total liquid assets2 ($bn) 147.6 7% 7%
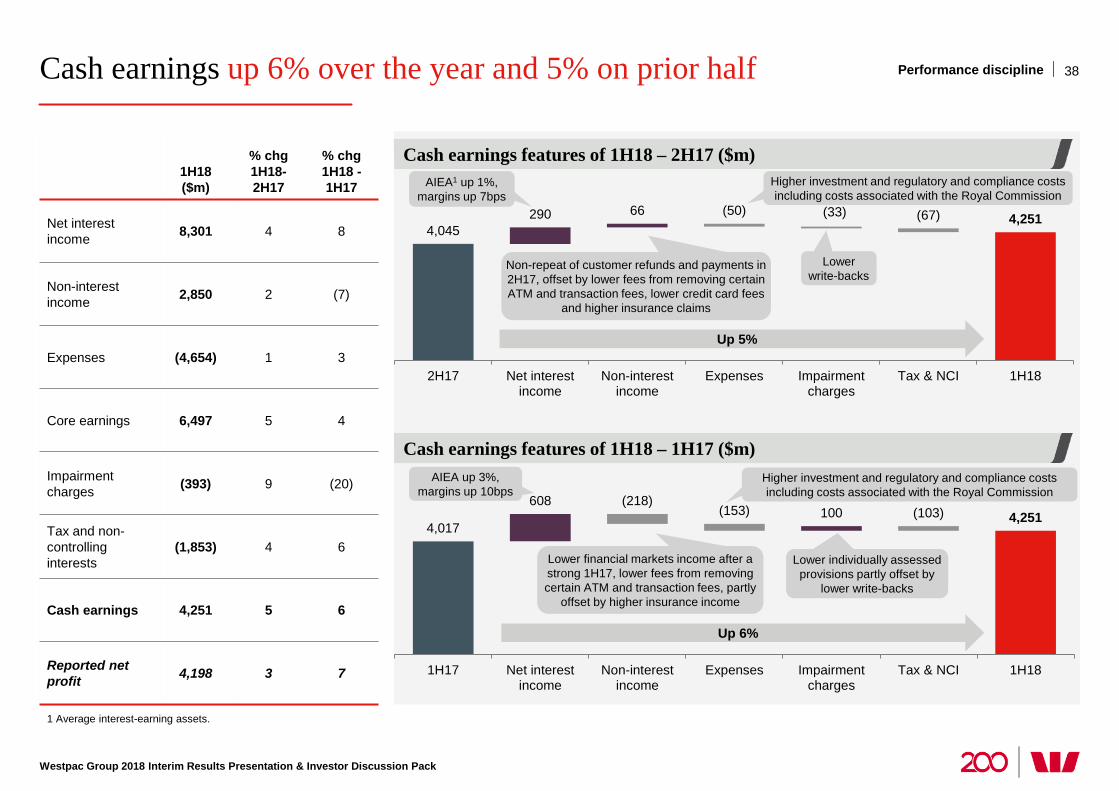
Cash earnings up 6% over the year and 5% on prior half
Westpac Group 2018 Interim Results Presentation & Investor Discussion Pack
1 Average interest-earning assets.
Cash earnings features of 1H18 – 2H17 ($m)
Cash earnings features of 1H18 – 1H17 ($m)
38 Performance discipline
1H18 ($m)
% chg 1H18-2H17
% chg 1H18 -1H17
Net interest income 8,301 4 8
Non-interest income 2,850 2 (7)
Expenses (4,654) 1 3
Core earnings 6,497 5 4
Impairment charges (393) 9 (20)
Tax and non- controlling interests
(1,853) 4 6
Cash earnings 4,251 5 6
Reported net profit 4,198 3 7
4,045 290 66 4,251 (50) (33) (67)
2H17 Net interestincome
Non-interestincome
Expenses Impairmentcharges
Tax & NCI 1H18
Up 5%
AIEA1 up 1%, margins up 7bps
Lower write-backs
Non-repeat of customer refunds and payments in 2H17, offset by lower fees from removing certain ATM and transaction fees, lower credit card fees
and higher insurance claims
Higher investment and regulatory and compliance costs including costs associated with the Royal Commission
4,017
608 100 4,251
(218) (153) (103)
1H17 Net interestincome
Non-interestincome
Expenses Impairmentcharges
Tax & NCI 1H18
Up 6%
AIEA up 3%, margins up 10bps
Lower financial markets income after a strong 1H17, lower fees from removing certain ATM and transaction fees, partly
offset by higher insurance income
Lower individually assessed provisions partly offset by
lower write-backs
Higher investment and regulatory and compliance costs including costs associated with the Royal Commission
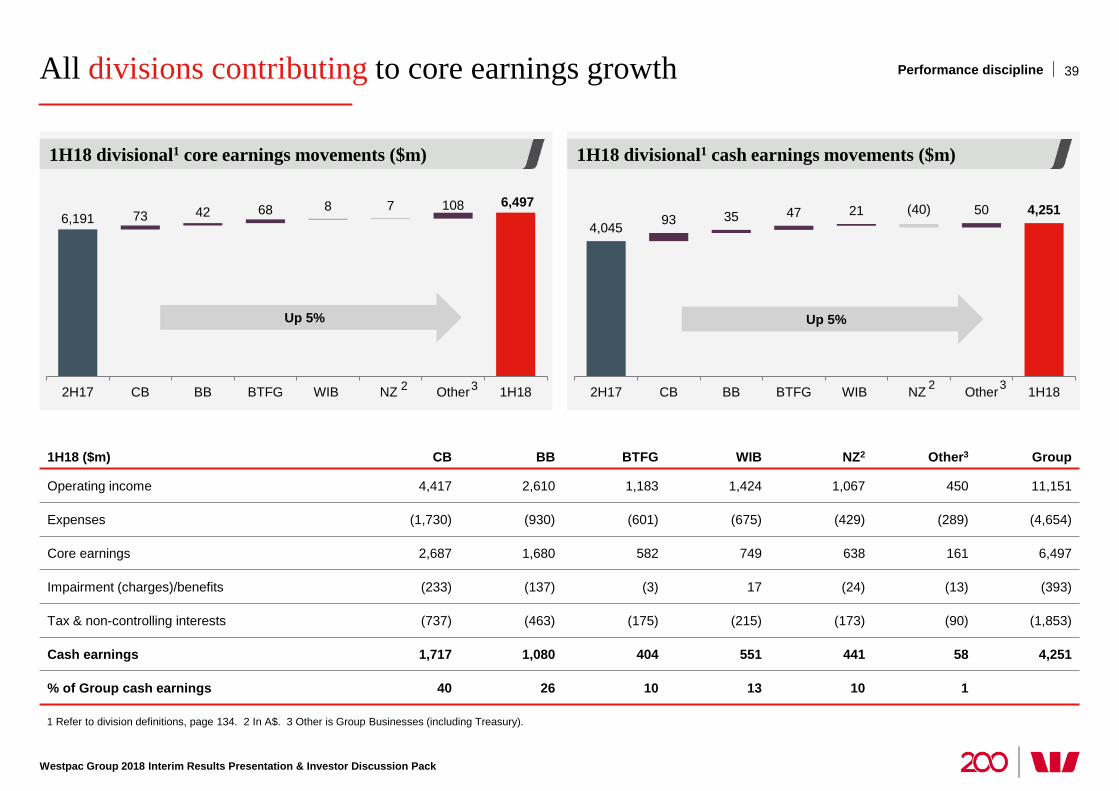
All divisions contributing to core earnings growth
Westpac Group 2018 Interim Results Presentation & Investor Discussion Pack
1 Refer to division definitions, page 134. 2 In A$. 3 Other is Group Businesses (including Treasury).
39 Performance discipline
1H18 ($m) CB BB BTFG WIB NZ2 Other3 Group
Operating income 4,417 2,610 1,183 1,424 1,067 450 11,151
Expenses (1,730) (930) (601) (675) (429) (289) (4,654)
Core earnings 2,687 1,680 582 749 638 161 6,497
Impairment (charges)/benefits (233) (137) (3) 17 (24) (13) (393)
Tax & non-controlling interests (737) (463) (175) (215) (173) (90) (1,853)
Cash earnings 1,717 1,080 404 551 441 58 4,251
% of Group cash earnings 40 26 10 13 10 1
Up 5%
2 3
1H18 divisional1 core earnings movements ($m) 1H18 divisional1 cash earnings movements ($m)
4,045 93 35 47 21 50 4,251 (40)
2H17 CB BB BTFG WIB NZ Other 1H18
Up 5%
3 2
6,191 6,497
73 42 68 8 7 108
2H17 CB BB BTFG WIB NZ Other 1H18
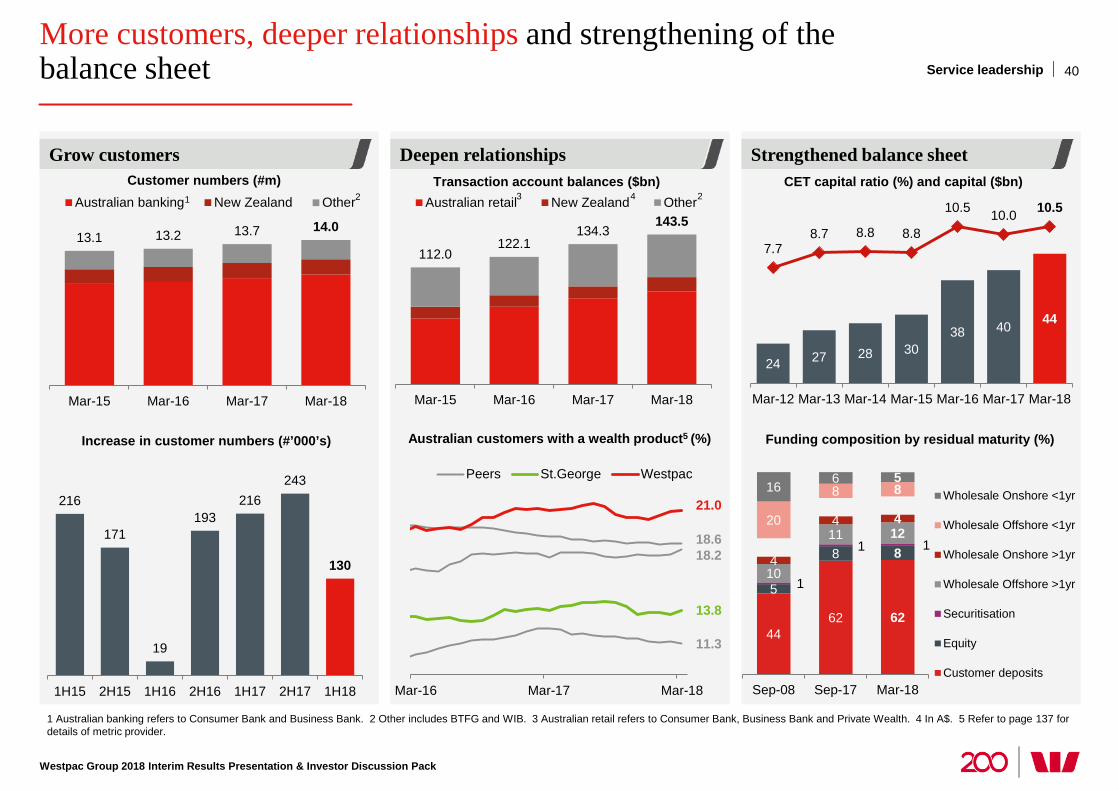
More customers, deeper relationships and strengthening of the balance sheet
Westpac Group 2018 Interim Results Presentation & Investor Discussion Pack
1 Australian banking refers to Consumer Bank and Business Bank. 2 Other includes BTFG and WIB. 3 Australian retail refers to Consumer Bank, Business Bank and Private Wealth. 4 In A$. 5 Refer to page 137 for details of metric provider.
Grow customers
40
Deepen relationships Strengthened balance sheet
13.1 13.2 13.7 14.0
Mar-15 Mar-16 Mar-17 Mar-18
Customer numbers (#m) Australian banking New Zealand Other
24 27 28 30 38 40 44
7.7 8.7 8.8 8.8
10.5 10.0 10.5
Mar-12 Mar-13 Mar-14 Mar-15 Mar-16 Mar-17 Mar-18
CET capital ratio (%) and capital ($bn)
44 62 62
5
8 8
1
1 1
10
11 12
4
4 4 20
8 8 16 6 5
Sep-08 Sep-17 Mar-18
Wholesale Onshore <1yr
Wholesale Offshore <1yr
Wholesale Onshore >1yr
Wholesale Offshore >1yr
Securitisation
Equity
Customer deposits
Service leadership
18.2 18.6
11.3
13.8
21.0
Mar-16 Mar-17 Mar-18
Peers St.George Westpac
112.0 122.1
134.3 143.5
Mar-15 Mar-16 Mar-17 Mar-18
Transaction account balances ($bn) Australian retail New Zealand Other
Funding composition by residual maturity (%) Australian customers with a wealth product5 (%)
1 2 3 2
216
171
19
193 216
243
130
1H15 2H15 1H16 2H16 1H17 2H17 1H18
Increase in customer numbers (#’000’s)
4
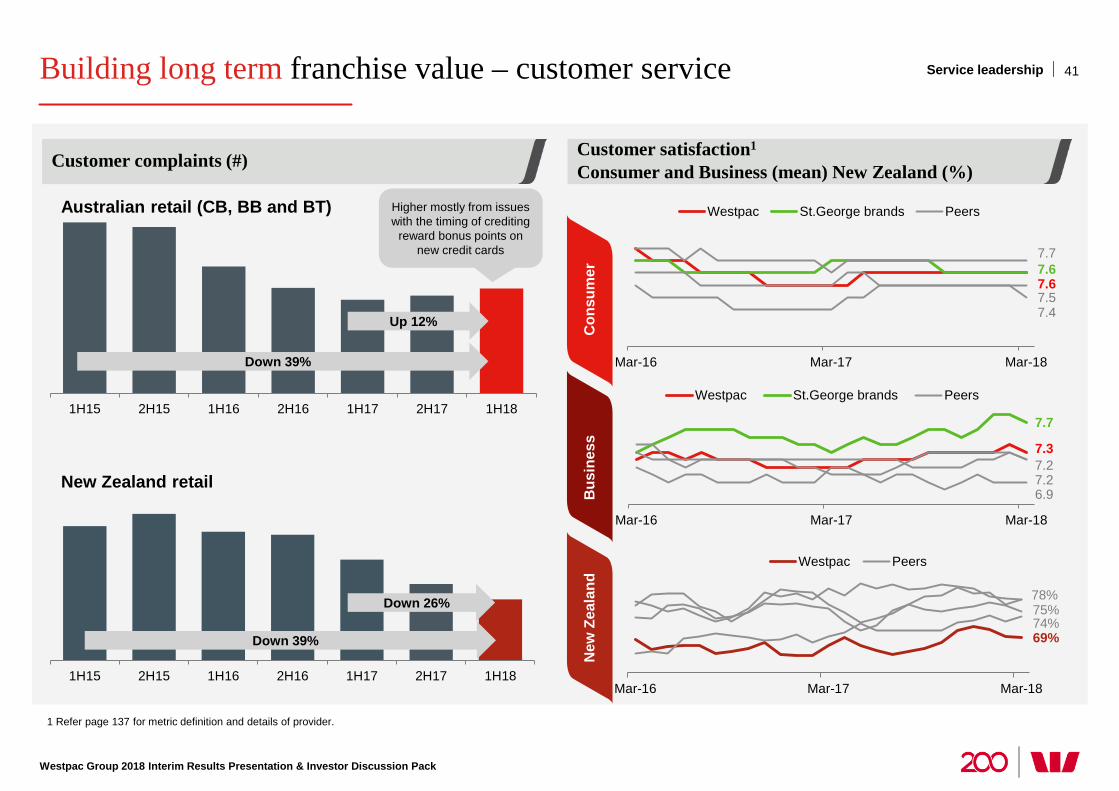
Building long term franchise value – customer service
Westpac Group 2018 Interim Results Presentation & Investor Discussion Pack
1 Refer page 137 for metric definition and details of provider.
41
Customer complaints (#)
Service leadership
1H15 2H15 1H16 2H16 1H17 2H17 1H18
1H15 2H15 1H16 2H16 1H17 2H17 1H18
Australian retail (CB, BB and BT)
New Zealand retail
Down 26%
Down 39%
New
Zea
land
Down 39%
Up 12%
Higher mostly from issues with the timing of crediting
reward bonus points on new credit cards
Customer satisfaction1
Consumer and Business (mean) New Zealand (%)
7.6 7.6
7.5 7.4
7.7
Mar-16 Mar-17 Mar-18
Westpac St.George brands Peers
7.3
7.7
7.2
6.9 7.2
Mar-16 Mar-17 Mar-18
Westpac St.George brands Peers
Bus
ines
s C
onsu
mer
69% 74% 75% 78%
Mar-16 Mar-17 Mar-18
Westpac Peers
Westpac Group 2018 Interim Results Presentation & Investor Discussion Pack
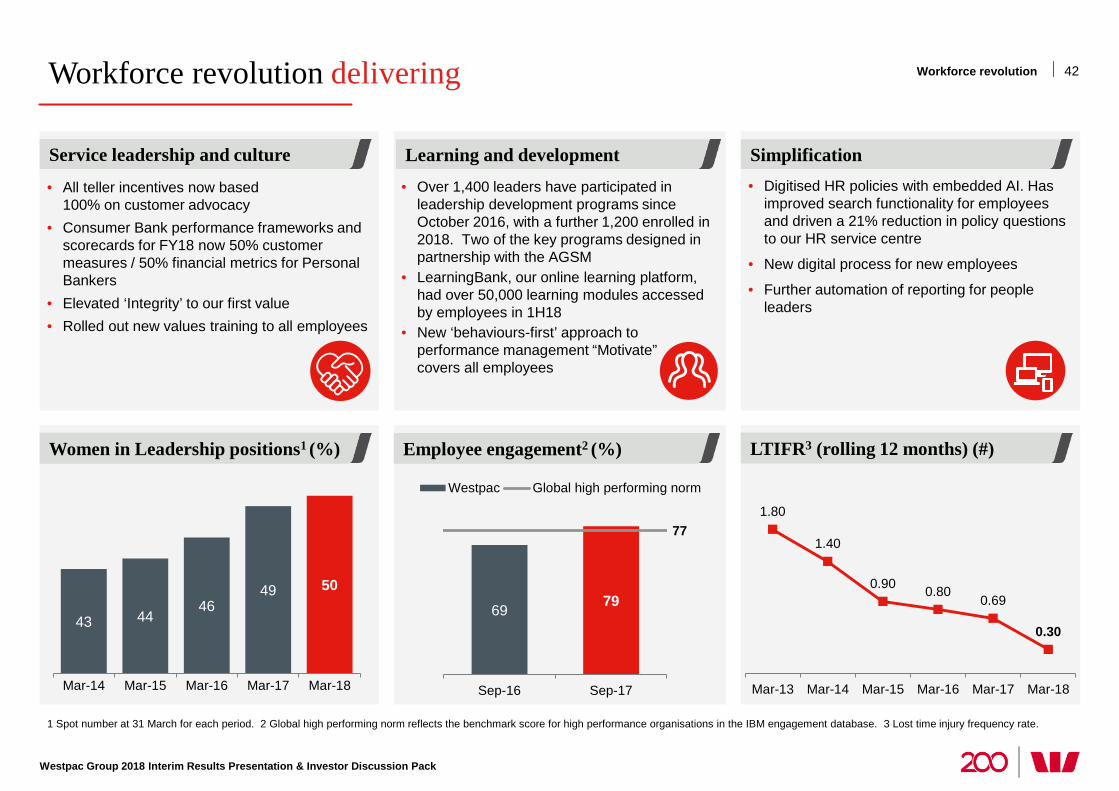
• Digitised HR policies with embedded AI. Has improved search functionality for employees and driven a 21% reduction in policy questions to our HR service centre
• New digital process for new employees
• Further automation of reporting for people leaders
• All teller incentives now based 100% on customer advocacy
• Consumer Bank performance frameworks and scorecards for FY18 now 50% customer measures / 50% financial metrics for Personal Bankers
• Elevated ‘Integrity’ to our first value • Rolled out new values training to all employees
• Over 1,400 leaders have participated in leadership development programs since October 2016, with a further 1,200 enrolled in 2018. Two of the key programs designed in partnership with the AGSM
• LearningBank, our online learning platform, had over 50,000 learning modules accessed by employees in 1H18
• New ‘behaviours-first’ approach to performance management “Motivate” now covers all employees
42 Workforce revolution delivering
1 Spot number at 31 March for each period. 2 Global high performing norm reflects the benchmark score for high performance organisations in the IBM engagement database. 3 Lost time injury frequency rate.
Employee engagement2 (%) LTIFR3 (rolling 12 months) (#) Women in Leadership positions1 (%)
Learning and development Simplification Service leadership and culture
43 44 46
49 50
Mar-14 Mar-15 Mar-16 Mar-17 Mar-18
1.80
1.40
0.90 0.80 0.69
0.30
Mar-13 Mar-14 Mar-15 Mar-16 Mar-17 Mar-18
69 79
77
Sep-16 Sep-17
Westpac Global high performing norm
Workforce revolution
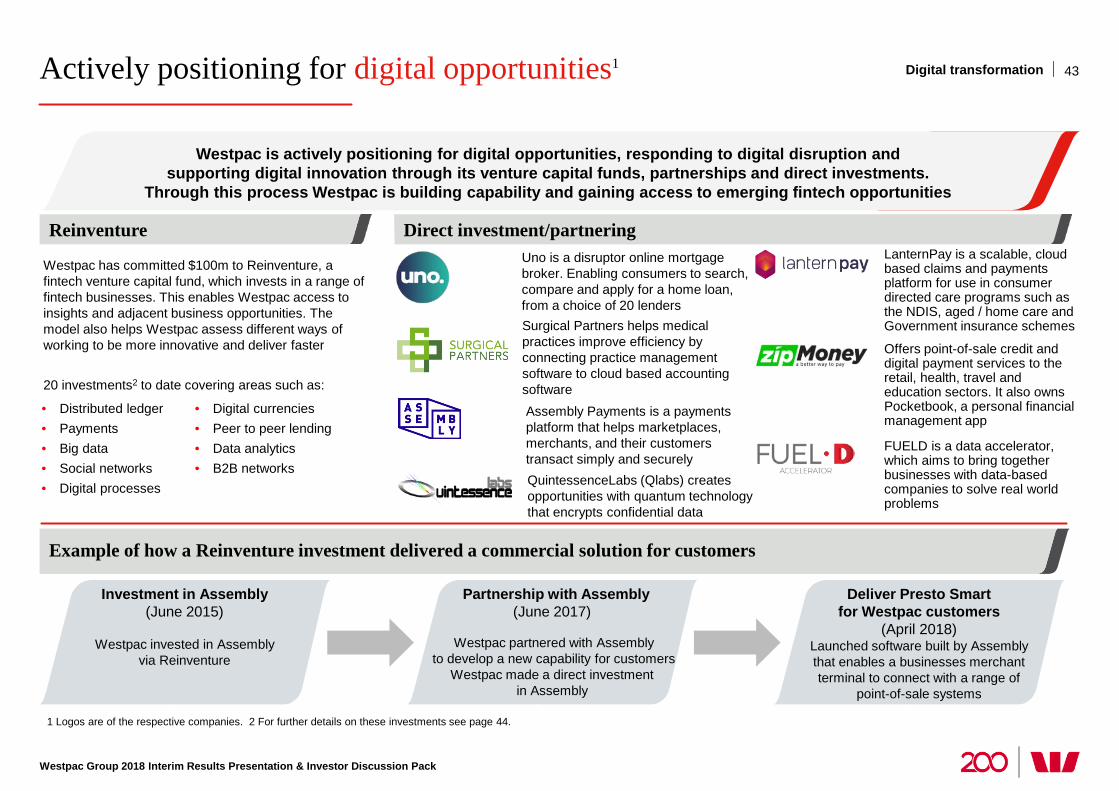
Actively positioning for digital opportunities1
Westpac Group 2018 Interim Results Presentation & Investor Discussion Pack
1 Logos are of the respective companies. 2 For further details on these investments see page 44.
43 Digital transformation
Westpac is actively responding to digital threats and opportunities. We encourage digital innovation through investing in venture capital, partnerships and direct investments.
Westpac can learn directly and gain access to emerging fintech developments.
Westpac has committed $100m to Reinventure, a fintech venture capital fund, which invests in a range of fintech businesses. This enables Westpac access to insights and adjacent business opportunities. The model also helps Westpac assess different ways of working to be more innovative and deliver faster 20 investments2 to date covering areas such as:
Investment in Assembly (June 2015)
Westpac invested in Assembly
via Reinventure
Partnership with Assembly (June 2017)
Westpac partnered with Assembly
to develop a new capability for customers Westpac made a direct investment
in Assembly
Deliver Presto Smart for Westpac customers
(April 2018) Launched software built by Assembly that enables a businesses merchant terminal to connect with a range of
point-of-sale systems
Uno is a disruptor online mortgage broker. Enabling consumers to search, compare and apply for a home loan, from a choice of 20 lenders Surgical Partners helps medical practices improve efficiency by connecting practice management software to cloud based accounting software
Offers point-of-sale credit and digital payment services to the retail, health, travel and education sectors. It also owns Pocketbook, a personal financial management app
LanternPay is a scalable, cloud based claims and payments platform for use in consumer directed care programs such as the NDIS, aged / home care and Government insurance schemes
FUELD is a data accelerator, which aims to bring together businesses with data-based companies to solve real world problems
Westpac is actively positioning for digital opportunities, responding to digital disruption and supporting digital innovation through its venture capital funds, partnerships and direct investments.
Through this process Westpac is building capability and gaining access to emerging fintech opportunities
QuintessenceLabs (Qlabs) creates opportunities with quantum technology that encrypts confidential data
Assembly Payments is a payments platform that helps marketplaces, merchants, and their customers transact simply and securely
Direct investment/partnering Reinventure
Example of how a Reinventure investment delivered a commercial solution for customers
• Distributed ledger • Payments • Big data • Social networks • Digital processes
• Digital currencies • Peer to peer lending • Data analytics • B2B networks
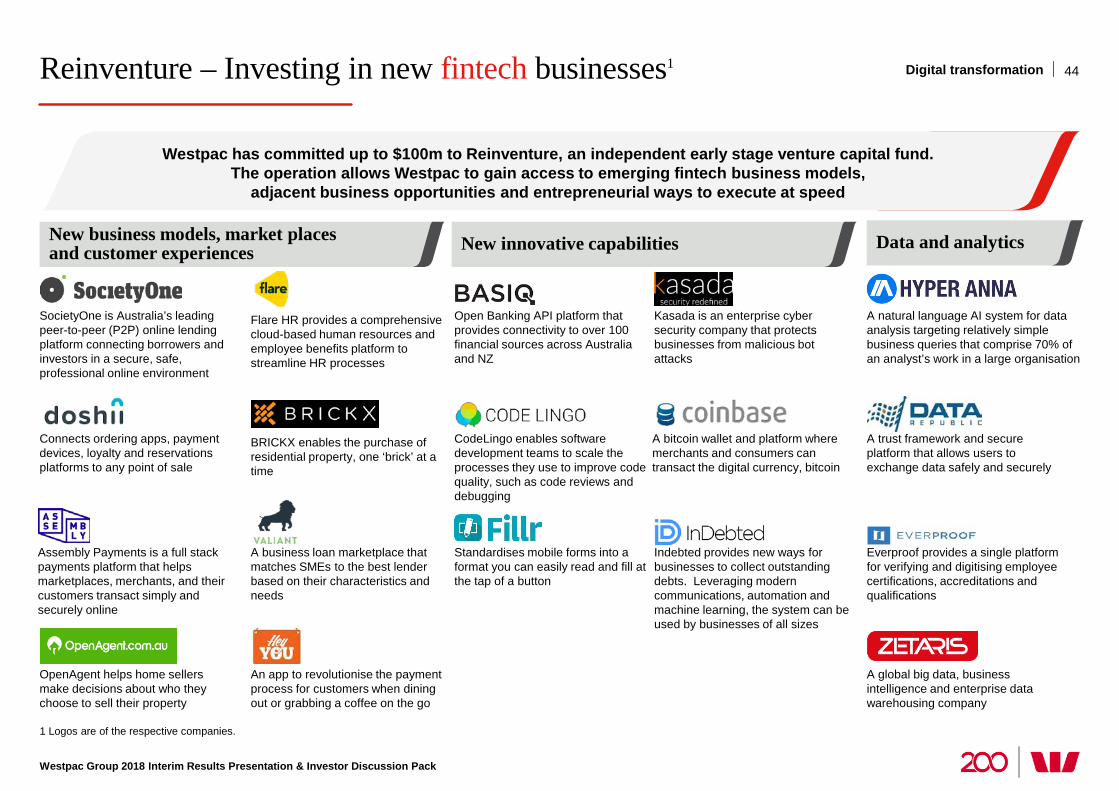
Reinventure – Investing in new fintech businesses1
1 Logos are of the respective companies.
Digital transformation
Flare HR provides a comprehensive cloud-based human resources and employee benefits platform to streamline HR processes
A business loan marketplace that matches SMEs to the best lender based on their characteristics and needs
A natural language AI system for data analysis targeting relatively simple business queries that comprise 70% of an analyst’s work in a large organisation
Open Banking API platform that provides connectivity to over 100 financial sources across Australia and NZ
BRICKX enables the purchase of residential property, one ‘brick’ at a time
SocietyOne is Australia’s leading peer-to-peer (P2P) online lending platform connecting borrowers and investors in a secure, safe, professional online environment
A bitcoin wallet and platform where merchants and consumers can transact the digital currency, bitcoin
OpenAgent helps home sellers make decisions about who they choose to sell their property
Assembly Payments is a full stack payments platform that helps marketplaces, merchants, and their customers transact simply and securely online
Connects ordering apps, payment devices, loyalty and reservations platforms to any point of sale
A trust framework and secure platform that allows users to exchange data safely and securely
Standardises mobile forms into a format you can easily read and fill at the tap of a button
A global big data, business intelligence and enterprise data warehousing company
Kasada is an enterprise cyber security company that protects businesses from malicious bot attacks
CodeLingo enables software development teams to scale the processes they use to improve code quality, such as code reviews and debugging
Everproof provides a single platform for verifying and digitising employee certifications, accreditations and qualifications
Indebted provides new ways for businesses to collect outstanding debts. Leveraging modern communications, automation and machine learning, the system can be used by businesses of all sizes
An app to revolutionise the payment process for customers when dining out or grabbing a coffee on the go
New business models, market places and customer experiences New innovative capabilities Data and analytics
Westpac is actively responding to digital threats and opportunities. We encourage digital innovation through investing in venture capital, partnerships and direct investments.
Westpac can learn directly and gain access to emerging fintech developments.
Westpac has committed up to $100m to Reinventure, an independent early stage venture capital fund. The operation allows Westpac to gain access to emerging fintech business models,
adjacent business opportunities and entrepreneurial ways to execute at speed
Westpac Group 2018 Interim Results Presentation & Investor Discussion Pack
44
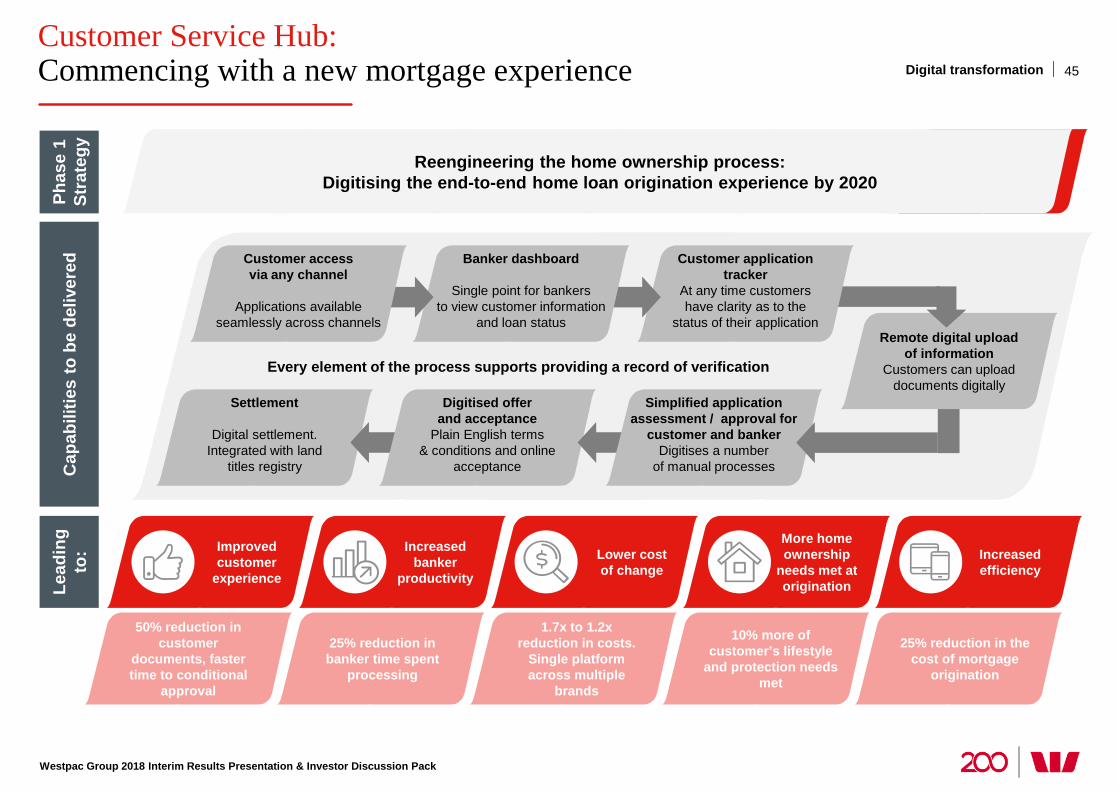
Settlement
Digital settlement. Integrated with land
titles registry Cap
abili
ties
to b
e de
liver
ed
Customer Service Hub: Commencing with a new mortgage experience Digital transformation
Increased efficiency
More home ownership
needs met at origination
Lower cost of change
Increased banker
productivity
Improved customer
experience
Lead
ing
to:
Phas
e 1
Stra
tegy
Reengineering the home ownership process: Digitising the end-to-end home loan origination experience by 2020
50% reduction in customer
documents, faster time to conditional
approval
25% reduction in banker time spent
processing
1.7x to 1.2x reduction in costs.
Single platform across multiple
brands
10% more of customer’s lifestyle
and protection needs met
25% reduction in the cost of mortgage
origination
Every element of the process supports providing a record of verification
Digitised offer and acceptance
Plain English terms & conditions and online
acceptance
Simplified application assessment / approval for
customer and banker Digitises a number
of manual processes
Remote digital upload of information
Customers can upload documents digitally
Customer application tracker
At any time customers have clarity as to the
status of their application
Banker dashboard
Single point for bankers to view customer information
and loan status
Customer access via any channel
Applications available
seamlessly across channels
Westpac Group 2018 Interim Results Presentation & Investor Discussion Pack
45
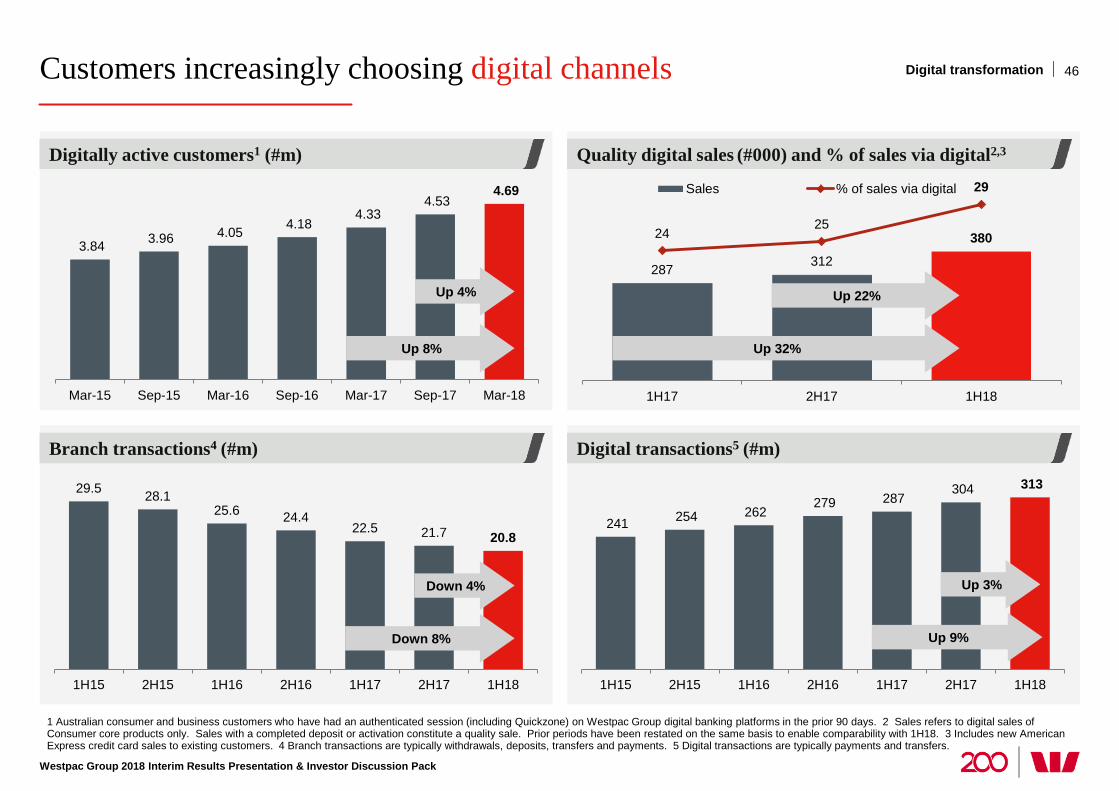
287 312
380 24 25
29
1H17 2H17 1H18
Sales % of sales via digital
Customers increasingly choosing digital channels
Westpac Group 2018 Interim Results Presentation & Investor Discussion Pack
1 Australian consumer and business customers who have had an authenticated session (including Quickzone) on Westpac Group digital banking platforms in the prior 90 days. 2 Sales refers to digital sales of Consumer core products only. Sales with a completed deposit or activation constitute a quality sale. Prior periods have been restated on the same basis to enable comparability with 1H18. 3 Includes new American Express credit card sales to existing customers. 4 Branch transactions are typically withdrawals, deposits, transfers and payments. 5 Digital transactions are typically payments and transfers.
46 Digital transformation
241 254 262 279 287
304 313
1H15 2H15 1H16 2H16 1H17 2H17 1H18
Quality digital sales (#000) and % of sales via digital2,3
Digital transactions5 (#m)
Digitally active customers1 (#m)
Branch transactions4 (#m)
3.84 3.96 4.05 4.18 4.33
4.53 4.69
Mar-15 Sep-15 Mar-16 Sep-16 Mar-17 Sep-17 Mar-18
Up 8%
Up 4%
Up 32%
Up 22%
29.5 28.1 25.6 24.4
22.5 21.7 20.8
1H15 2H15 1H16 2H16 1H17 2H17 1H18
Down 8%
Down 4%
Up 9%
Up 3%
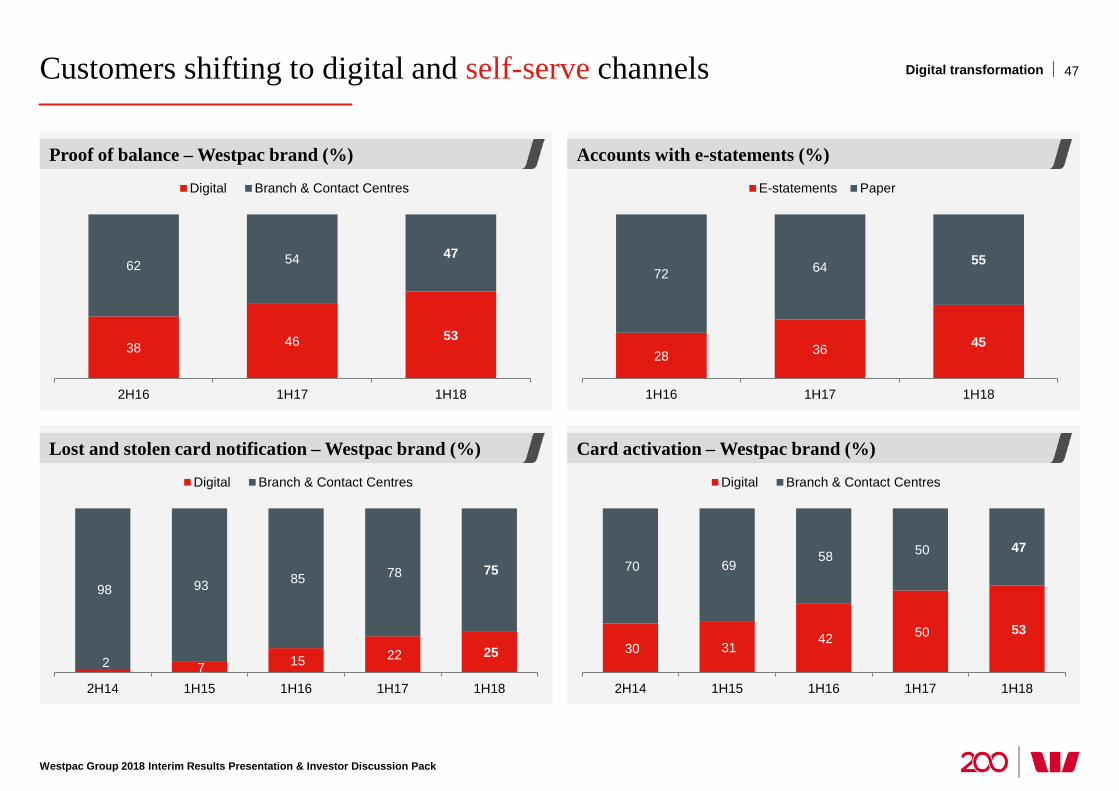
Customers shifting to digital and self-serve channels
Westpac Group 2018 Interim Results Presentation & Investor Discussion Pack
Accounts with e-statements (%)
Card activation – Westpac brand (%)
Proof of balance – Westpac brand (%)
Lost and stolen card notification – Westpac brand (%)
47 Digital transformation
38 46 53
62 54 47
2H16 1H17 1H18
Digital Branch & Contact Centres
28 36 45
72 64 55
1H16 1H17 1H18
E-statements Paper
2 7 15 22 25
98 93 85 78 75
2H14 1H15 1H16 1H17 1H18
Digital Branch & Contact Centres
30 31 42 50 53
70 69 58 50 47
2H14 1H15 1H16 1H17 1H18
Digital Branch & Contact Centres
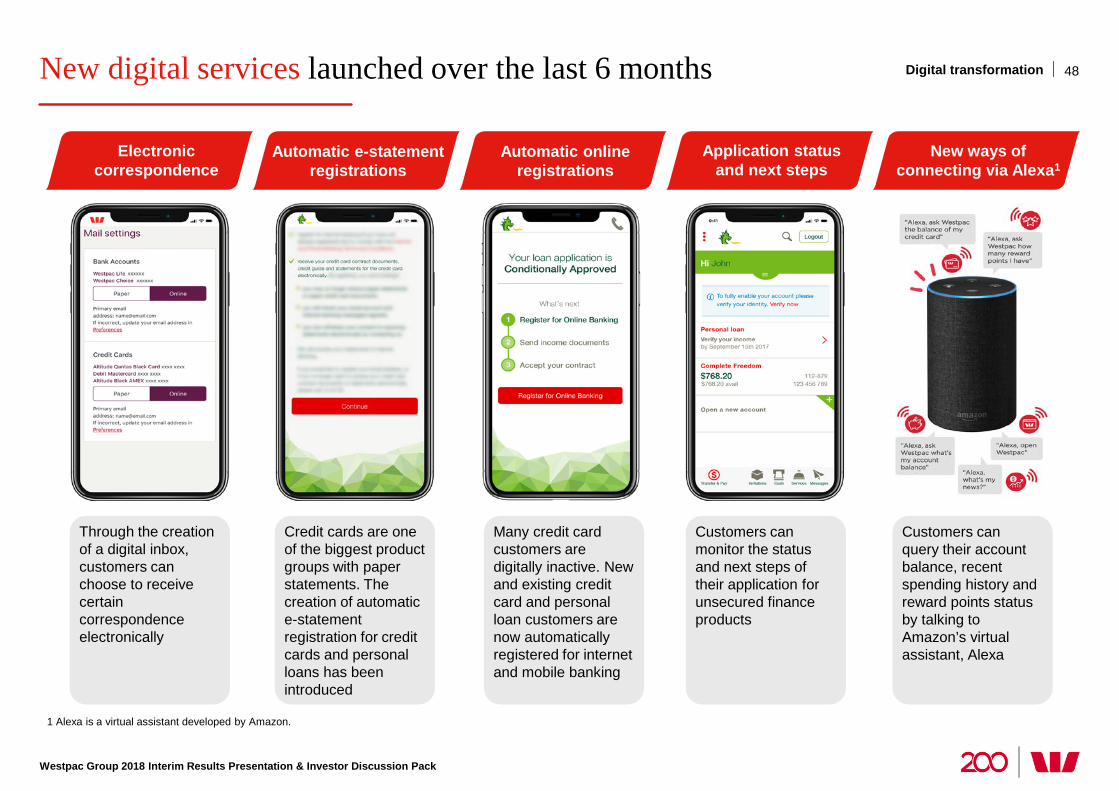
New digital services launched over the last 6 months
1 Alexa is a virtual assistant developed by Amazon.
Digital transformation
Electronic correspondence
Automatic e-statement registrations
Automatic online registrations
Application status and next steps
New ways of connecting via Alexa1
Through the creation of a digital inbox, customers can choose to receive certain correspondence electronically
Credit cards are one of the biggest product groups with paper statements. The creation of automatic e-statement registration for credit cards and personal loans has been introduced
Many credit card customers are digitally inactive. New and existing credit card and personal loan customers are now automatically registered for internet and mobile banking
Customers can monitor the status and next steps of their application for unsecured finance products
Customers can query their account balance, recent spending history and reward points status by talking to Amazon’s virtual assistant, Alexa
Westpac Group 2018 Interim Results Presentation & Investor Discussion Pack
48
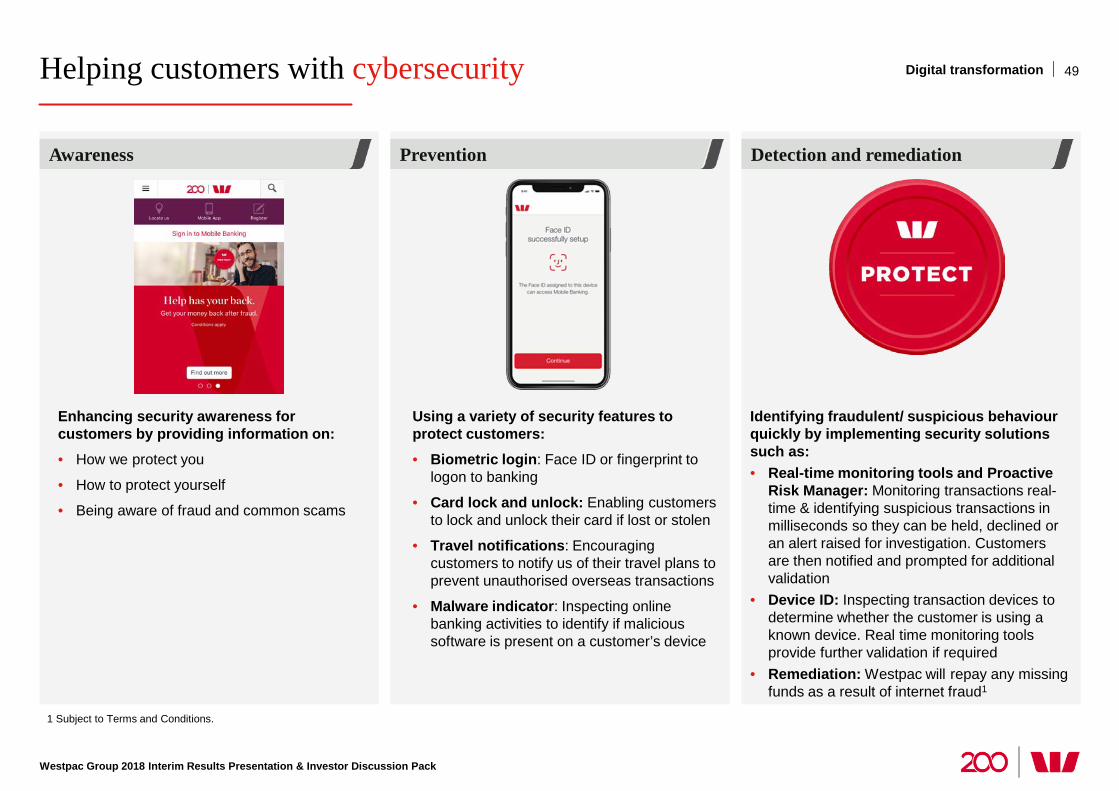
Helping customers with cybersecurity
Westpac Group 2018 Interim Results Presentation & Investor Discussion Pack
1 Subject to Terms and Conditions.
Awareness
49
Prevention Detection and remediation
Digital transformation
Enhancing security awareness for customers by providing information on: • How we protect you
• How to protect yourself
• Being aware of fraud and common scams
Using a variety of security features to protect customers: • Biometric login: Face ID or fingerprint to
logon to banking
• Card lock and unlock: Enabling customers to lock and unlock their card if lost or stolen
• Travel notifications: Encouraging customers to notify us of their travel plans to prevent unauthorised overseas transactions
• Malware indicator: Inspecting online banking activities to identify if malicious software is present on a customer’s device
Identifying fraudulent/ suspicious behaviour quickly by implementing security solutions such as: • Real-time monitoring tools and Proactive
Risk Manager: Monitoring transactions real-time & identifying suspicious transactions in milliseconds so they can be held, declined or an alert raised for investigation. Customers are then notified and prompted for additional validation
• Device ID: Inspecting transaction devices to determine whether the customer is using a known device. Real time monitoring tools provide further validation if required
• Remediation: Westpac will repay any missing funds as a result of internet fraud1
Westpac Group 2018 Interim Results Presentation & Investor Discussion Pack
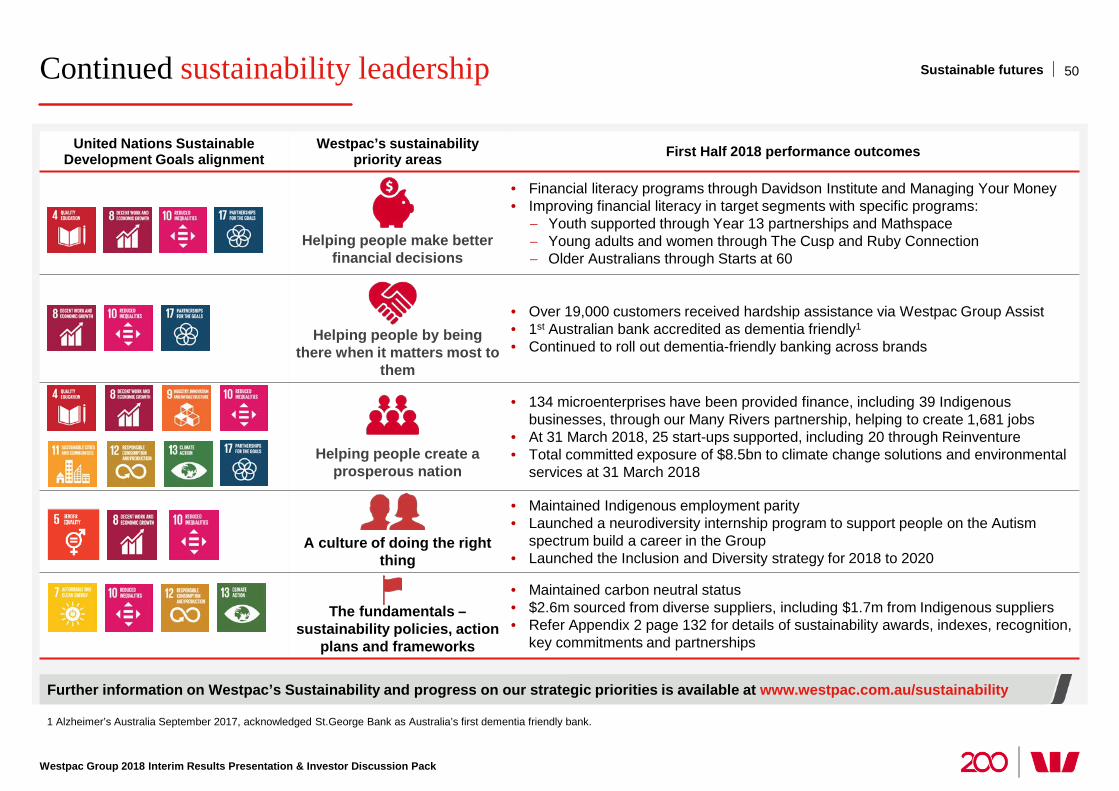
Continued sustainability leadership
1 Alzheimer’s Australia September 2017, acknowledged St.George Bank as Australia’s first dementia friendly bank.
50
United Nations Sustainable Development Goals alignment
Westpac’s sustainability priority areas First Half 2018 performance outcomes
Helping people make better financial decisions
• Financial literacy programs through Davidson Institute and Managing Your Money • Improving financial literacy in target segments with specific programs:
− Youth supported through Year 13 partnerships and Mathspace − Young adults and women through The Cusp and Ruby Connection − Older Australians through Starts at 60
Helping people by being there when it matters most to
them
• Over 19,000 customers received hardship assistance via Westpac Group Assist • 1st Australian bank accredited as dementia friendly1 • Continued to roll out dementia-friendly banking across brands
Helping people create a prosperous nation
• 134 microenterprises have been provided finance, including 39 Indigenous businesses, through our Many Rivers partnership, helping to create 1,681 jobs
• At 31 March 2018, 25 start-ups supported, including 20 through Reinventure • Total committed exposure of $8.5bn to climate change solutions and environmental
services at 31 March 2018
A culture of doing the right thing
• Maintained Indigenous employment parity • Launched a neurodiversity internship program to support people on the Autism
spectrum build a career in the Group • Launched the Inclusion and Diversity strategy for 2018 to 2020
The fundamentals –
sustainability policies, action plans and frameworks
• Maintained carbon neutral status • $2.6m sourced from diverse suppliers, including $1.7m from Indigenous suppliers • Refer Appendix 2 page 132 for details of sustainability awards, indexes, recognition,
key commitments and partnerships
Sustainable futures
Further information on Westpac’s Sustainability and progress on our strategic priorities is available at www.westpac.com.au/sustainability
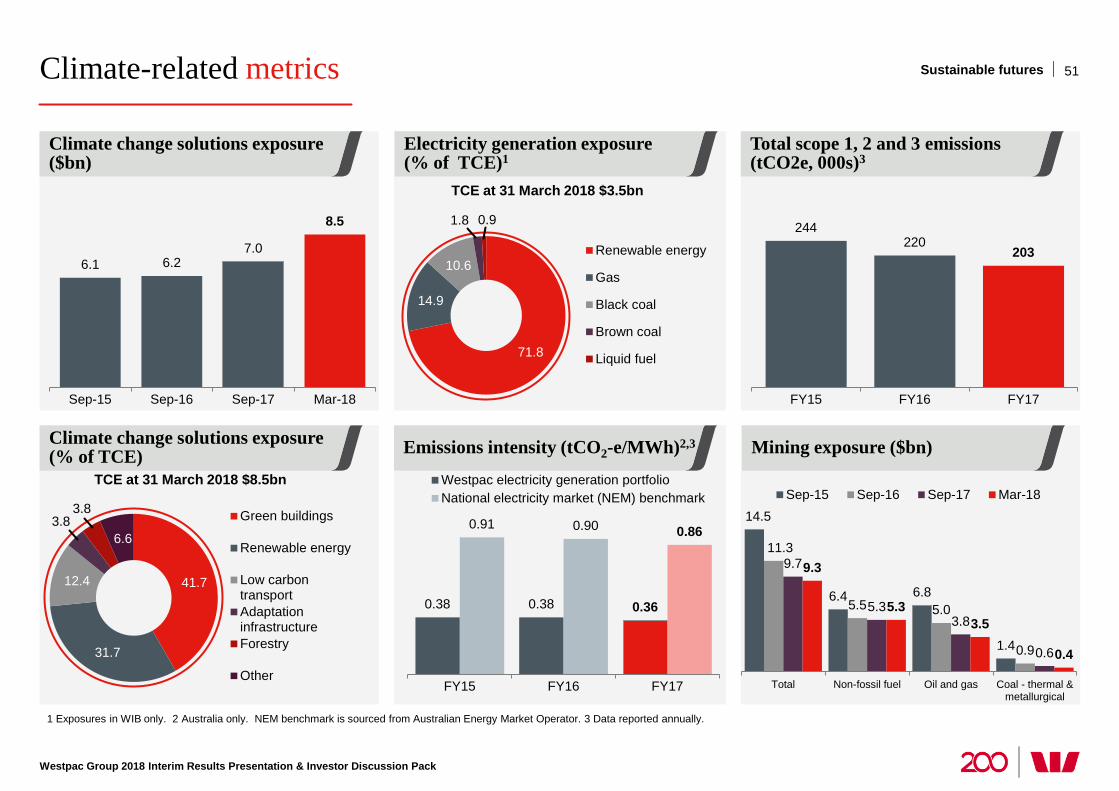
Climate-related metrics
Westpac Group 2018 Interim Results Presentation & Investor Discussion Pack
1 Exposures in WIB only. 2 Australia only. NEM benchmark is sourced from Australian Energy Market Operator. 3 Data reported annually.
51 Sustainable futures
Climate change solutions exposure (% of TCE) Emissions intensity (tCO2-e/MWh)2,3
Electricity generation exposure (% of TCE)1
Total scope 1, 2 and 3 emissions (tCO2e, 000s)3
Climate change solutions exposure ($bn)
Mining exposure ($bn)
6.1 6.2 7.0
8.5
Sep-15 Sep-16 Sep-17 Mar-18
244 220
203
FY15 FY16 FY17
71.8
14.9
10.6
1.8 0.9
Renewable energy
Gas
Black coal
Brown coal
Liquid fuel
41.7
31.7
12.4
3.8 3.8
6.6
Green buildings
Renewable energy
Low carbontransportAdaptationinfrastructureForestry
Other
0.38 0.38 0.36
0.91 0.90 0.86
FY15 FY16 FY17
Westpac electricity generation portfolioNational electricity market (NEM) benchmark
14.5
6.4 6.8
1.4
11.3
5.5 5.0
0.9
9.7
5.3 3.8
0.6
9.3
5.3 3.5
0.4
Total Non-fossil fuel Oil and gas Coal - thermal &metallurgical
Sep-15 Sep-16 Sep-17 Mar-18
TCE at 31 March 2018 $3.5bn
TCE at 31 March 2018 $8.5bn
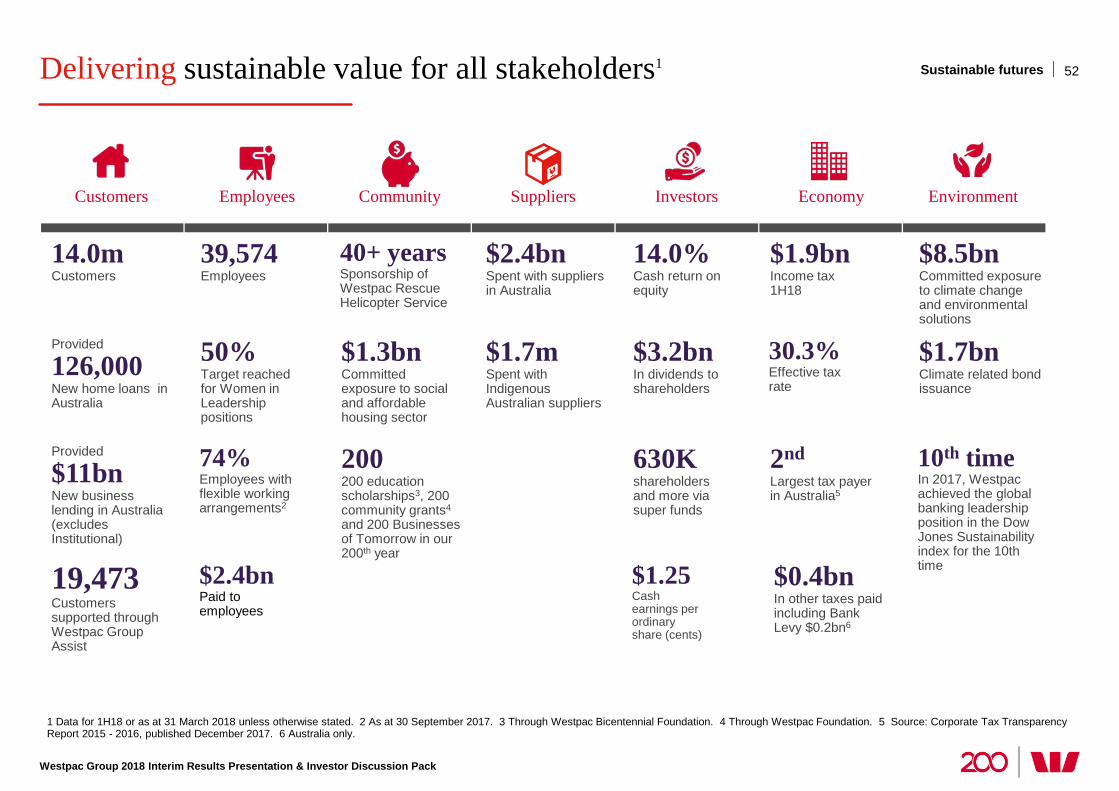
1 Data for 1H18 or as at 31 March 2018 unless otherwise stated. 2 As at 30 September 2017. 3 Through Westpac Bicentennial Foundation. 4 Through Westpac Foundation. 5 Source: Corporate Tax Transparency Report 2015 - 2016, published December 2017. 6 Australia only.
Customers Employees Community Suppliers Investors Economy Environment
14.0m Customers
Provided
126,000 New home loans in Australia
19,473 Customers supported through Westpac Group Assist
39,574 Employees
50% Target reached for Women in Leadership positions
200 200 education scholarships3, 200 community grants4 and 200 Businesses of Tomorrow in our 200th year
$1.3bn Committed exposure to social and affordable housing sector
$2.4bn Spent with suppliers in Australia
$1.7m Spent with Indigenous Australian suppliers
14.0% Cash return on equity
$3.2bn In dividends to shareholders
$1.9bn Income tax 1H18
$8.5bn Committed exposure to climate change and environmental solutions
$1.7bn Climate related bond issuance
Provided
$11bn New business lending in Australia (excludes Institutional)
630K shareholders and more via super funds
2nd Largest tax payer in Australia5
40+ years Sponsorship of Westpac Rescue Helicopter Service
Delivering sustainable value for all stakeholders1
74% Employees with flexible working arrangements2
10th time In 2017, Westpac achieved the global banking leadership position in the Dow Jones Sustainability index for the 10th time
$2.4bn Paid to employees
$1.25 Cash earnings per ordinary share (cents)
30.3% Effective tax rate
$0.4bn In other taxes paid including Bank Levy $0.2bn6
Sustainable futures
Westpac Group 2018 Interim Results Presentation & Investor Discussion Pack
52

Earnings Drivers
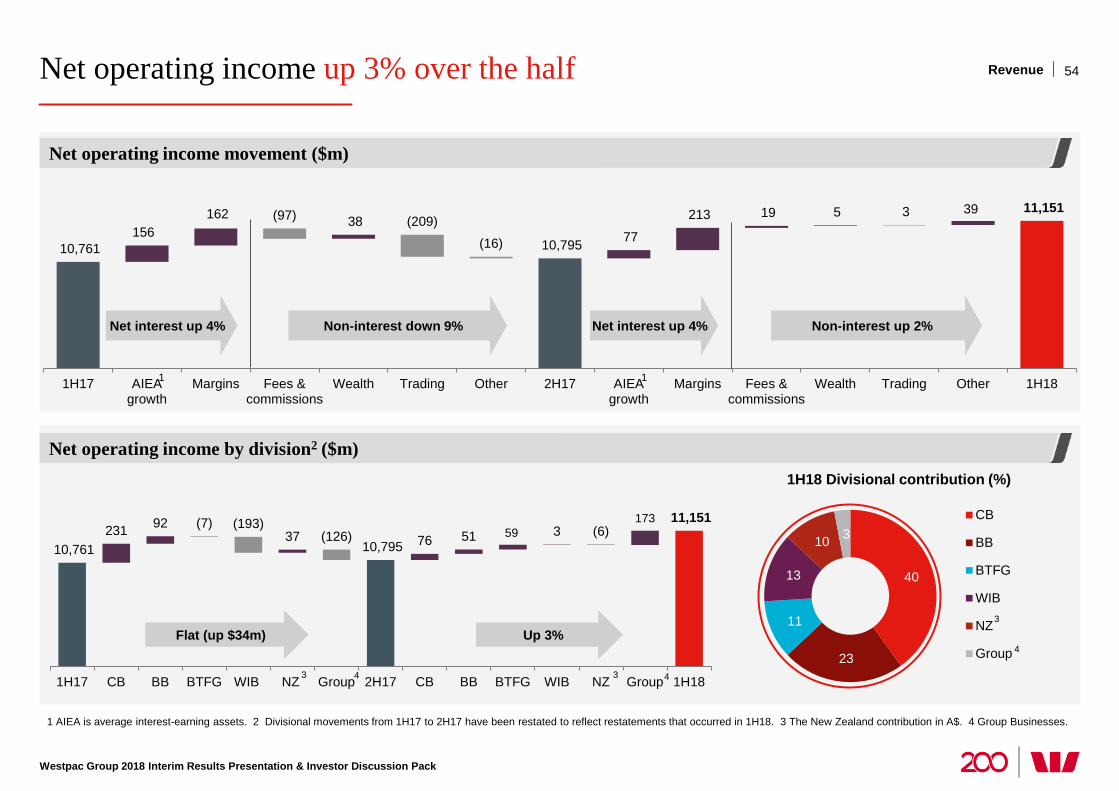
Net operating income up 3% over the half
Westpac Group 2018 Interim Results Presentation & Investor Discussion Pack
1 AIEA is average interest-earning assets. 2 Divisional movements from 1H17 to 2H17 have been restated to reflect restatements that occurred in 1H18. 3 The New Zealand contribution in A$. 4 Group Businesses.
54
Net operating income movement ($m)
Net operating income by division2 ($m)
10,761 156
162 38
10,795 77
213 19 5 3 39 11,151 (97) (209) (16)
1H17 AIEAgrowth
Margins Fees &commissions
Wealth Trading Other 2H17 AIEAgrowth
Margins Fees &commissions
Wealth Trading Other 1H18
59 173
10,761 231 92
37 10,795 76 51 3
11,151 (7) (193) (126) (6)
1H17 CB BB BTFG WIB NZ Group 2H17 CB BB BTFG WIB NZ Group 1H18
40
23
11
13
10 3 CB
BB
BTFG
WIB
NZ
Group
1H18 Divisional contribution (%)
1
Net interest up 4% Non-interest down 9% Net interest up 4% Non-interest up 2%
Flat (up $34m) Up 3%
1
3
4
3 3 4 4
Revenue
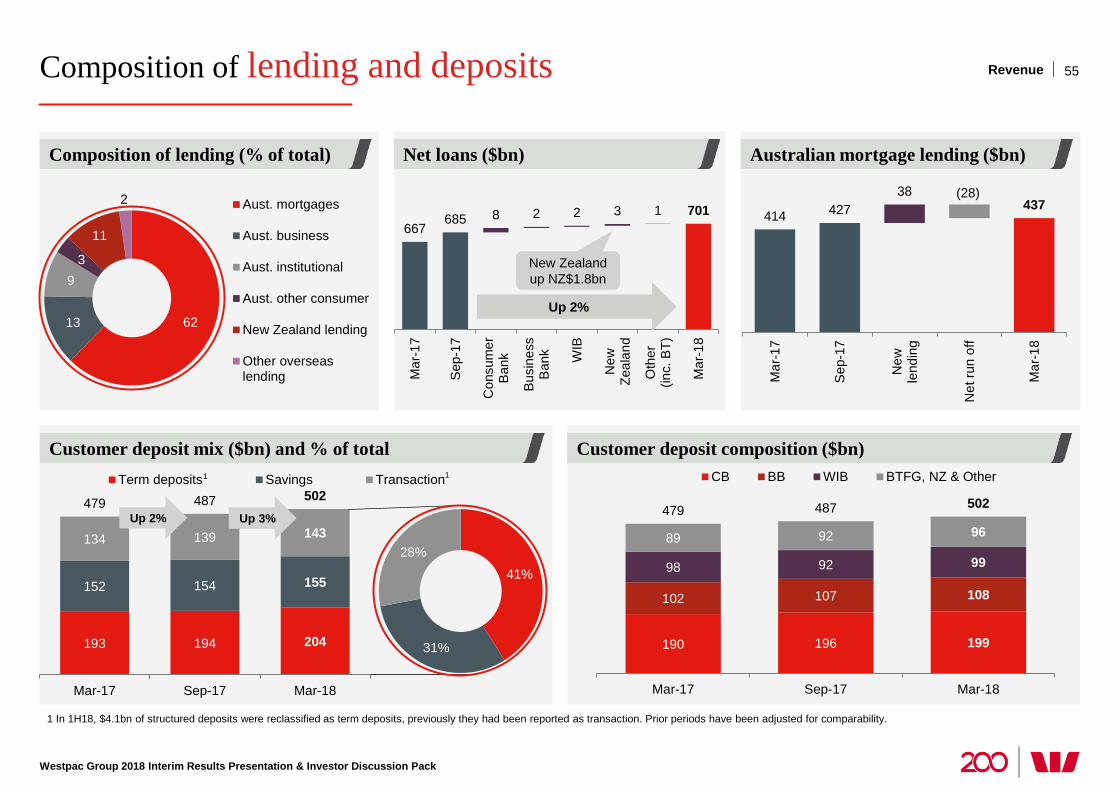
193 194 204
152 154 155
134 139 143
479 487 502
Mar-17 Sep-17 Mar-18
Term deposits Savings Transaction
41%
31%
28%
Composition of lending and deposits
Westpac Group 2018 Interim Results Presentation & Investor Discussion Pack
1 In 1H18, $4.1bn of structured deposits were reclassified as term deposits, previously they had been reported as transaction. Prior periods have been adjusted for comparability.
Australian mortgage lending ($bn) Composition of lending (% of total) Net loans ($bn)
Customer deposit composition ($bn) Customer deposit mix ($bn) and % of total
55
62 13
9 3
11
2 Aust. mortgages
Aust. business
Aust. institutional
Aust. other consumer
New Zealand lending
Other overseaslending
667 685 8 2 2 3 1 701
Mar
-17
Sep
-17
Con
sum
erB
ank
Bus
ines
sB
ank WIB
New
Zeal
and
Oth
er(in
c. B
T)
Mar
-18
New Zealand up NZ$1.8bn
Up 2%
Up 3% Up 2%
190 196 199
102 107 108
98 92 99
89 92 96 479 487 502
Mar-17 Sep-17 Mar-18
CB BB WIB BTFG, NZ & Other
414 427 38
437 (28)
Mar
-17
Sep
-17
New
lend
ing
Net
run
off
Mar
-18
1 1
Revenue
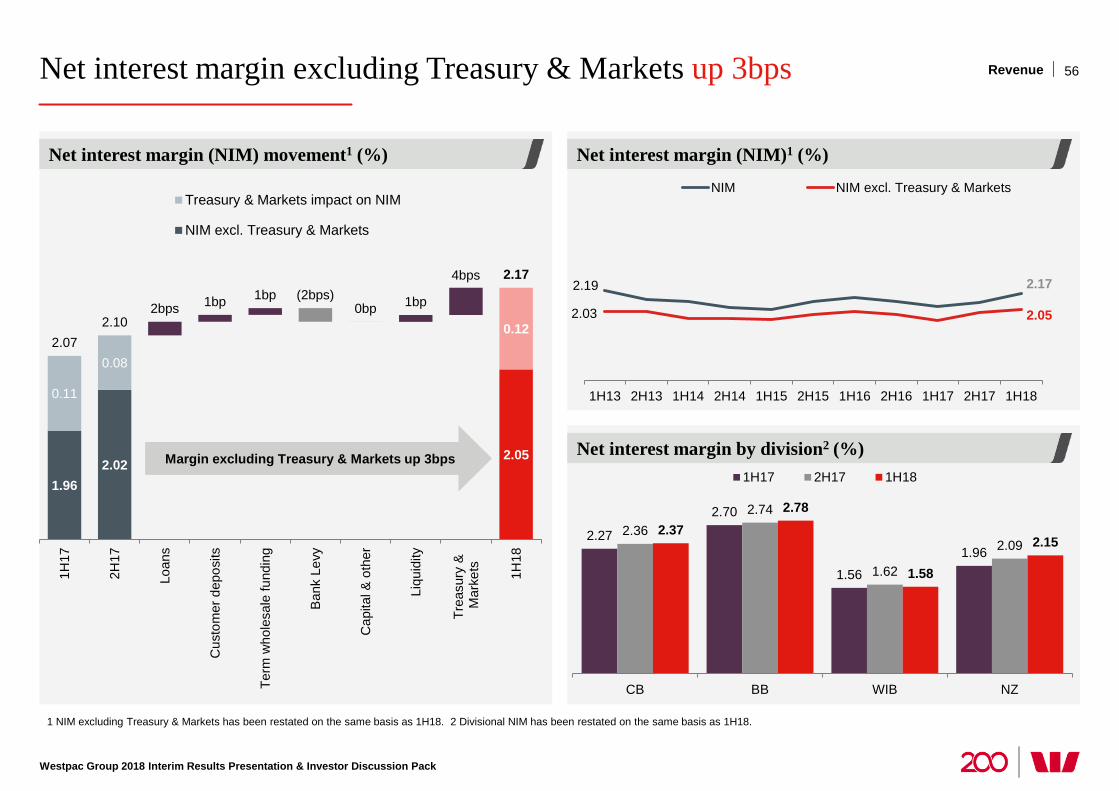
Net interest margin excluding Treasury & Markets up 3bps
Westpac Group 2018 Interim Results Presentation & Investor Discussion Pack
1 NIM excluding Treasury & Markets has been restated on the same basis as 1H18. 2 Divisional NIM has been restated on the same basis as 1H18.
Net interest margin by division2 (%)
Net interest margin (NIM)1 (%) Net interest margin (NIM) movement1 (%)
56
1.96 2.02
2.05
0.11
0.08
4bps
0.12 2.07
2.10 2bps 1bp 1bp (2bps)
0bp 1bp
2.17
1H17
2H17
Loan
s
Cus
tom
er d
epos
its
Term
who
lesa
le fu
ndin
g
Ban
k Le
vy
Cap
ital &
oth
er
Liqu
idity
Trea
sury
& M
arke
ts 1H18
Treasury & Markets impact on NIM
NIM excl. Treasury & Markets
2.19 2.17
2.03 2.05
1H13 2H13 1H14 2H14 1H15 2H15 1H16 2H16 1H17 2H17 1H18
NIM NIM excl. Treasury & Markets
2.27
2.70
1.56
1.96
2.36 2.74
1.62
2.09 2.37
2.78
1.58
2.15
CB BB WIB NZ
1H17 2H17 1H18Margin excluding Treasury & Markets up 3bps
Revenue
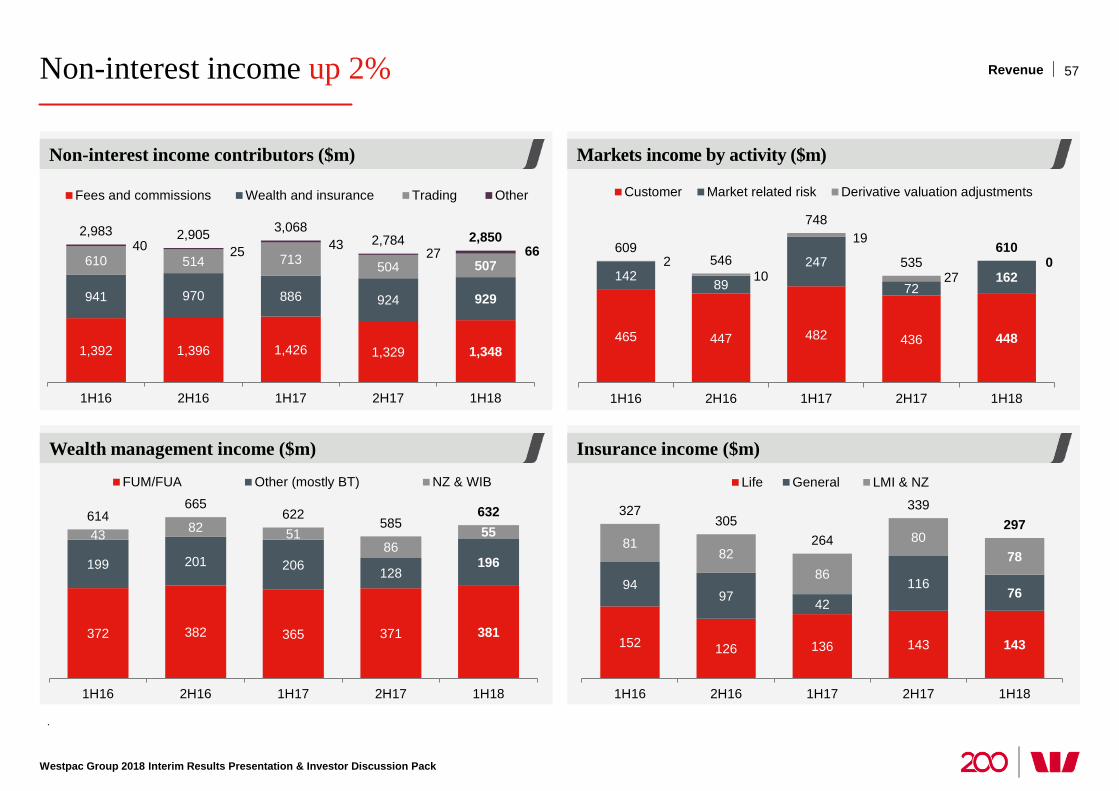
Non-interest income up 2%
Westpac Group 2018 Interim Results Presentation & Investor Discussion Pack
Markets income by activity ($m)
Insurance income ($m)
Non-interest income contributors ($m)
Wealth management income ($m)
.
57 Revenue
1,392 1,396 1,426 1,329 1,348
941 970 886 924 929
610 514 713 504 507 40 25 43 27 66
2,983 2,905 3,068 2,784 2,850
1H16 2H16 1H17 2H17 1H18
Fees and commissions Wealth and insurance Trading Other
372 382 365 371 381
199 201 206 128 196
43 82 51 86
55 614
665 622
585 632
1H16 2H16 1H17 2H17 1H18
FUM/FUA Other (mostly BT) NZ & WIB
465 447 482 436 448
142 89
247
72 162
2 10
19
27 0
609 546
748
535 610
1H16 2H16 1H17 2H17 1H18
Customer Market related risk Derivative valuation adjustments
152 126 136 143 143
94 97 42
116 76
81 82
86
80 78
327 305
264
339 297
1H16 2H16 1H17 2H17 1H18
Life General LMI & NZ
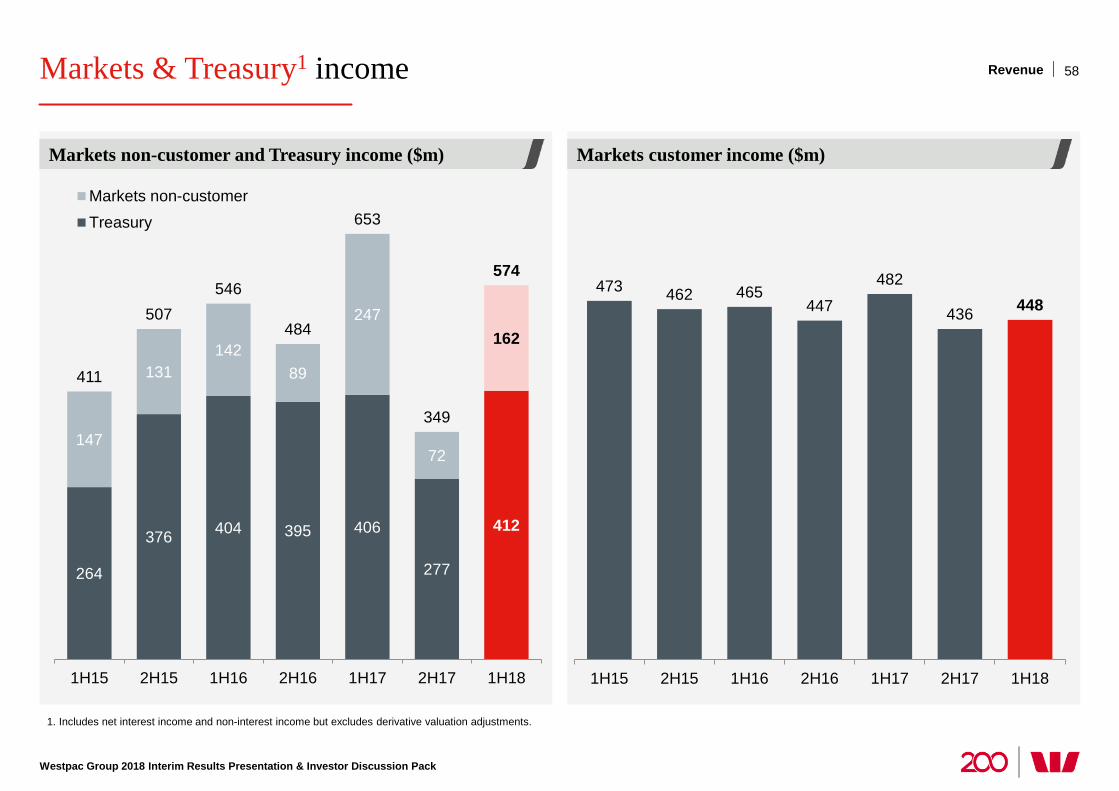
Markets & Treasury1 income
Westpac Group 2018 Interim Results Presentation & Investor Discussion Pack
1. Includes net interest income and non-interest income but excludes derivative valuation adjustments.
58
Markets customer income ($m) Markets non-customer and Treasury income ($m)
Revenue
264
376 404 395 406
277
412
147
131 142
89
247
72
162
411
507 546
484
653
349
574
1H15 2H15 1H16 2H16 1H17 2H17 1H18
Markets non-customerTreasury
473 462 465 447
482
436 448
1H15 2H15 1H16 2H16 1H17 2H17 1H18
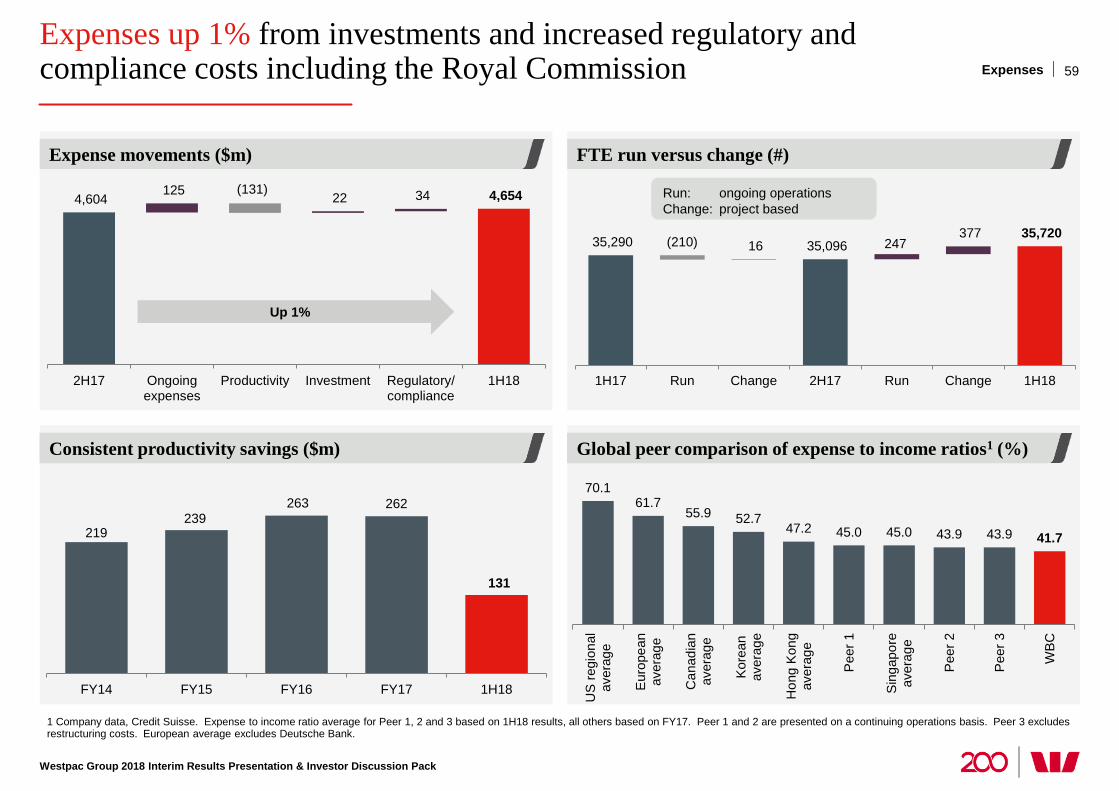
247 35,290 16 35,096 377 35,720
(210)
1H17 Run Change 2H17 Run Change 1H18
4,604 125 22 34 4,654 (131)
2H17 Ongoingexpenses
Productivity Investment Regulatory/compliance
1H18
Expenses up 1% from investments and increased regulatory and compliance costs including the Royal Commission
Westpac Group 2018 Interim Results Presentation & Investor Discussion Pack
FTE run versus change (#) Expense movements ($m)
1 Company data, Credit Suisse. Expense to income ratio average for Peer 1, 2 and 3 based on 1H18 results, all others based on FY17. Peer 1 and 2 are presented on a continuing operations basis. Peer 3 excludes restructuring costs. European average excludes Deutsche Bank.
59 Expenses
Global peer comparison of expense to income ratios1 (%) Consistent productivity savings ($m)
Up 1%
70.1 61.7
55.9 52.7 47.2 45.0 45.0 43.9 43.9 41.7
US
regi
onal
aver
age
Eur
opea
nav
erag
e
Can
adia
nav
erag
e
Kor
ean
aver
age
Hon
g K
ong
aver
age
Pee
r 1
Sin
gapo
reav
erag
e
Pee
r 2
Pee
r 3
WBC
219 239
263 262
131
FY14 FY15 FY16 FY17 1H18
Run: ongoing operations Change: project based
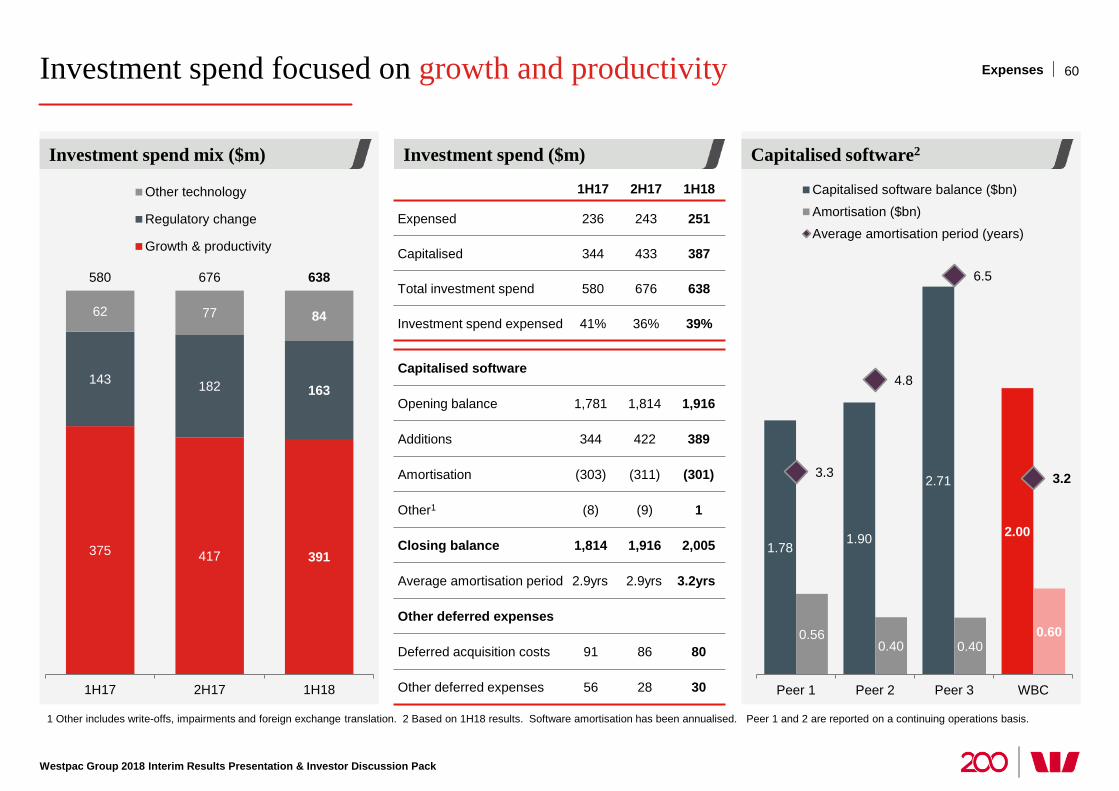
Investment spend focused on growth and productivity
Westpac Group 2018 Interim Results Presentation & Investor Discussion Pack
1 Other includes write-offs, impairments and foreign exchange translation. 2 Based on 1H18 results. Software amortisation has been annualised. Peer 1 and 2 are reported on a continuing operations basis.
Investment spend mix ($m)
60
Investment spend ($m) Capitalised software2
Expenses
375 417 391
143 182 163
62 77 84
580 676 638
1H17 2H17 1H18
Other technology
Regulatory change
Growth & productivity
1H17 2H17 1H18
Expensed 236 243 251
Capitalised 344 433 387
Total investment spend 580 676 638
Investment spend expensed 41% 36% 39%
Capitalised software
Opening balance 1,781 1,814 1,916
Additions 344 422 389
Amortisation (303) (311) (301)
Other1 (8) (9) 1
Closing balance 1,814 1,916 2,005
Average amortisation period 2.9yrs 2.9yrs 3.2yrs
Other deferred expenses
Deferred acquisition costs 91 86 80
Other deferred expenses 56 28 30
1.78 1.90
2.71
2.00
0.56 0.40 0.40
0.60
3.3
4.8
6.5
3.2
Peer 1 Peer 2 Peer 3 WBC
Capitalised software balance ($bn)
Amortisation ($bn)
Average amortisation period (years)
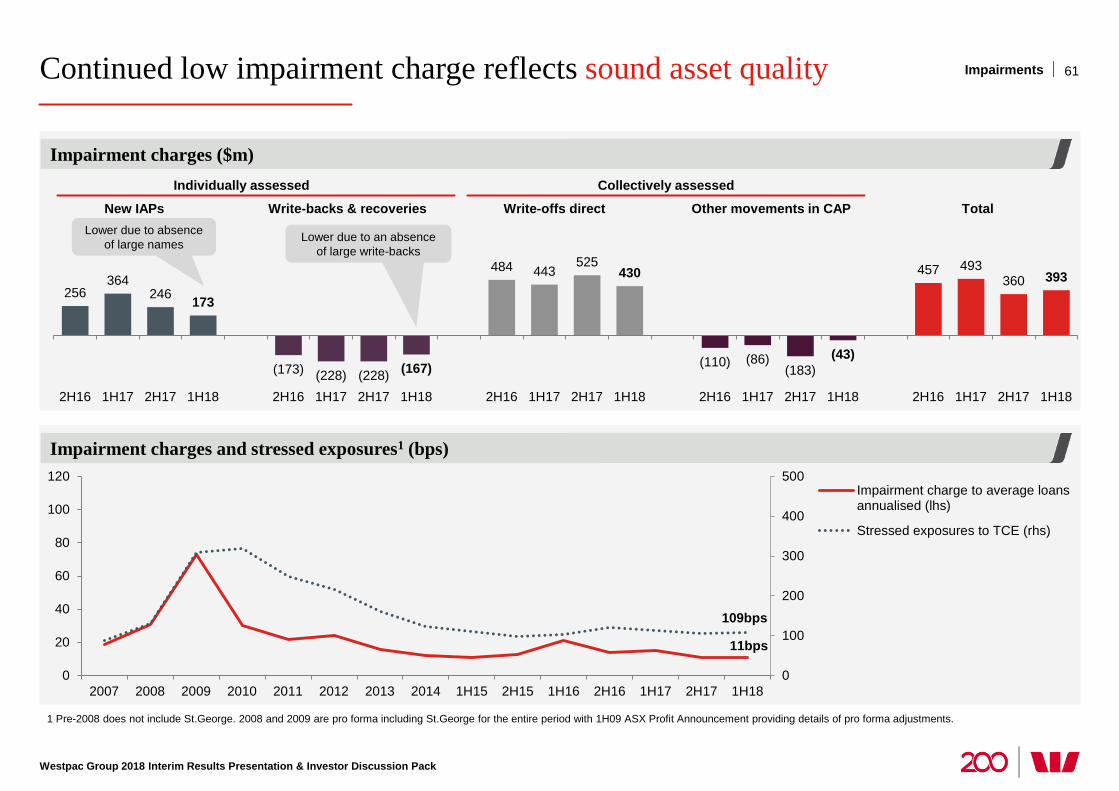
Continued low impairment charge reflects sound asset quality
Westpac Group 2018 Interim Results Presentation & Investor Discussion Pack
1 Pre-2008 does not include St.George. 2008 and 2009 are pro forma including St.George for the entire period with 1H09 ASX Profit Announcement providing details of pro forma adjustments.
61
256 364
246 173
(173) (228) (228) (167)
484 443 525
430
(110) (86) (183)
(43)
457 493 360 393
2H16 1H17 2H17 1H18 2H16 1H17 2H17 1H18 2H16 1H17 2H17 1H18 2H16 1H17 2H17 1H18 2H16 1H17 2H17 1H18
Impairment charges ($m)
Impairment charges and stressed exposures1 (bps)
New IAPs Write-backs & recoveries Write-offs direct Other movements in CAP Total
Individually assessed Collectively assessed
Lower due to absence of large names
11bps
109bps
0
100
200
300
400
500
0
20
40
60
80
100
120
2007 2008 2009 2010 2011 2012 2013 2014 1H15 2H15 1H16 2H16 1H17 2H17 1H18
Impairment charge to average loansannualised (lhs)
Stressed exposures to TCE (rhs)
Lower due to an absence of large write-backs
Impairments

Credit Quality
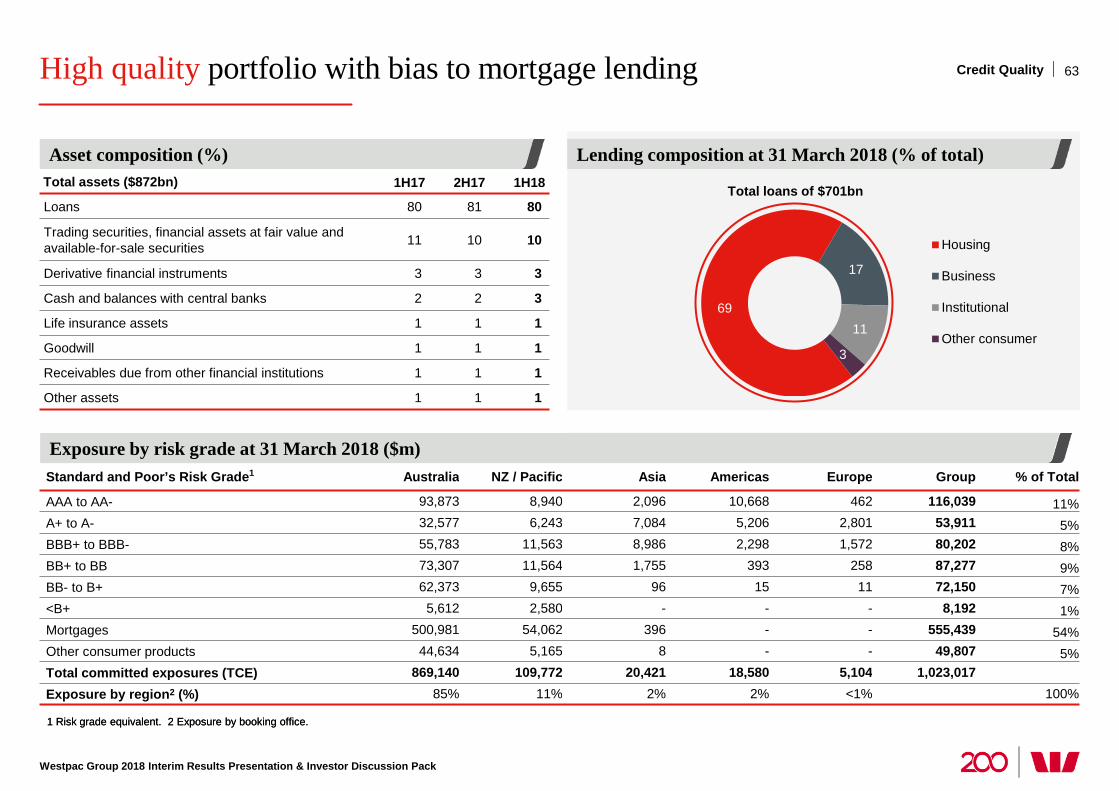
Standard and Poor’s Risk Grade1 Australia NZ / Pacific Asia Americas Europe Group % of Total
AAA to AA- 93,873 8,940 2,096 10,668 462 116,039 11% A+ to A- 32,577 6,243 7,084 5,206 2,801 53,911 5% BBB+ to BBB- 55,783 11,563 8,986 2,298 1,572 80,202 8% BB+ to BB 73,307 11,564 1,755 393 258 87,277 9% BB- to B+ 62,373 9,655 96 15 11 72,150 7% <B+ 5,612 2,580 - - - 8,192 1% Mortgages 500,981 54,062 396 - - 555,439 54% Other consumer products 44,634 5,165 8 - - 49,807 5% Total committed exposures (TCE) 869,140 109,772 20,421 18,580 5,104 1,023,017 Exposure by region2 (%) 85% 11% 2% 2% <1% 100%
High quality portfolio with bias to mortgage lending
Westpac Group 2018 Interim Results Presentation & Investor Discussion Pack
1 Risk grade equivalent. 2 Exposure by booking office.
Lending composition at 31 March 2018 (% of total) Asset composition (%)
63 Credit Quality
69
17
11
3
Housing
Business
Institutional
Other consumer
Total loans of $701bn
1 Risk grade equivalent. 2 Exposure by booking office.
Exposure by risk grade at 31 March 2018 ($m)
Total assets ($872bn) 1H17 2H17 1H18
Loans 80 81 80
Trading securities, financial assets at fair value and available-for-sale securities 11 10 10
Derivative financial instruments 3 3 3
Cash and balances with central banks 2 2 3
Life insurance assets 1 1 1
Goodwill 1 1 1
Receivables due from other financial institutions 1 1 1
Other assets 1 1 1
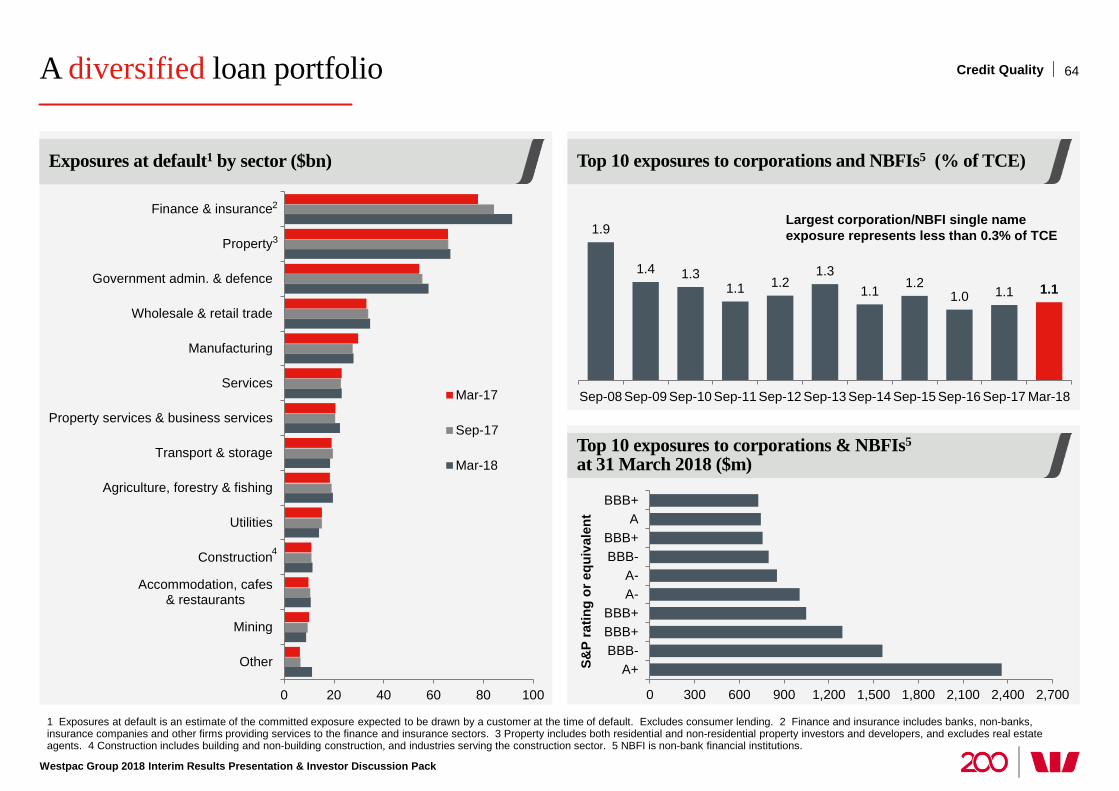
A diversified loan portfolio
Westpac Group 2018 Interim Results Presentation & Investor Discussion Pack
1 Exposures at default is an estimate of the committed exposure expected to be drawn by a customer at the time of default. Excludes consumer lending. 2 Finance and insurance includes banks, non-banks, insurance companies and other firms providing services to the finance and insurance sectors. 3 Property includes both residential and non-residential property investors and developers, and excludes real estate agents. 4 Construction includes building and non-building construction, and industries serving the construction sector. 5 NBFI is non-bank financial institutions.
0 20 40 60 80 100
Other
Mining
Accommodation, cafes& restaurants
Construction
Utilities
Agriculture, forestry & fishing
Transport & storage
Property services & business services
Services
Manufacturing
Wholesale & retail trade
Government admin. & defence
Property
Finance & insurance
Mar-17
Sep-17
Mar-18
1.9
1.4 1.3 1.1 1.2
1.3 1.1 1.2
1.0 1.1 1.1
Sep-08 Sep-09 Sep-10 Sep-11 Sep-12 Sep-13 Sep-14 Sep-15 Sep-16 Sep-17 Mar-18
0 300 600 900 1,200 1,500 1,800 2,100 2,400 2,700
A+BBB-BBB+BBB+
A-A-
BBB-BBB+
ABBB+
S&P
ratin
g or
equ
ival
ent
Top 10 exposures to corporations and NBFIs5 (% of TCE)
Top 10 exposures to corporations & NBFIs5 at 31 March 2018 ($m)
64
Largest corporation/NBFI single name exposure represents less than 0.3% of TCE
Exposures at default1 by sector ($bn)
2
3
4
Credit Quality
52
43
35
45 46 48
36
46 46 50
34
46
Westpac Peer 1 Peer 2 Peer 3
1H17 2H17 1H18
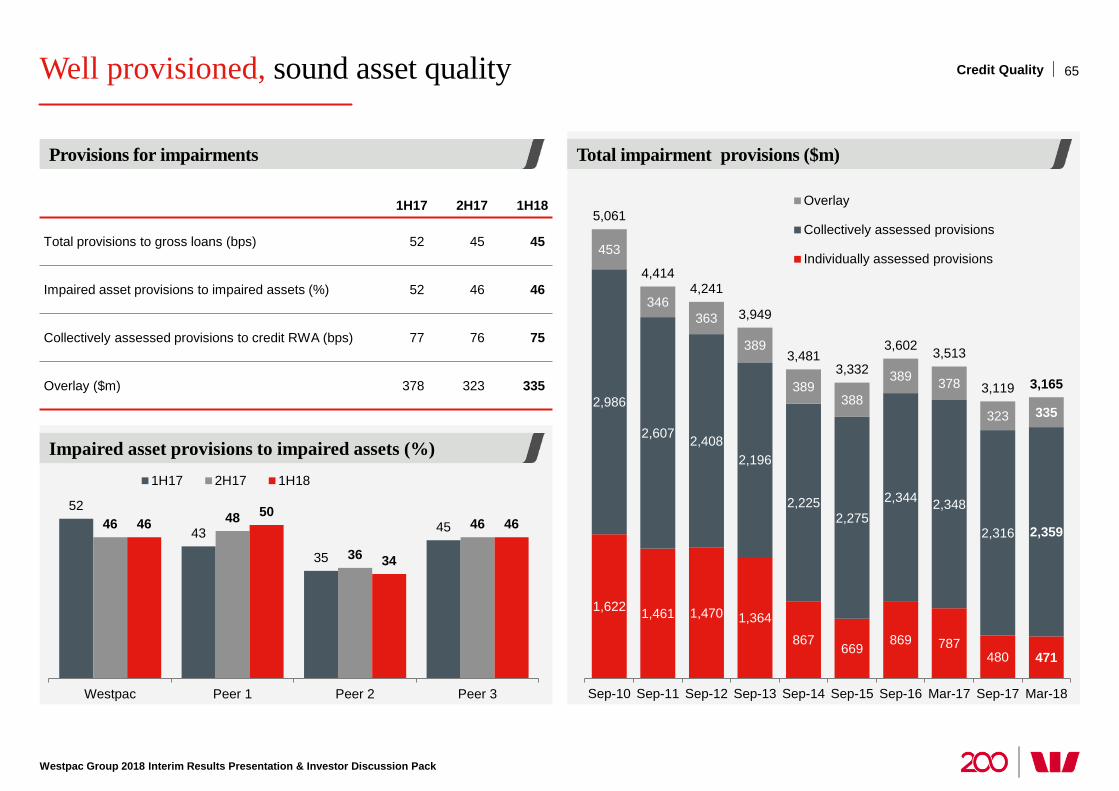
Well provisioned, sound asset quality
Westpac Group 2018 Interim Results Presentation & Investor Discussion Pack
Provisions for impairments
Impaired asset provisions to impaired assets (%)
Total impairment provisions ($m)
65 Credit Quality
1H17 2H17 1H18
Total provisions to gross loans (bps) 52 45 45
Impaired asset provisions to impaired assets (%) 52 46 46
Collectively assessed provisions to credit RWA (bps) 77 76 75
Overlay ($m) 378 323 335
1,622 1,461 1,470 1,364
867 669 869 787
480 471
2,986
2,607 2,408 2,196
2,225 2,275
2,344 2,348
2,316 2,359
453
346 363
389
389 388
389 378
323 335
5,061
4,414 4,241
3,949
3,481 3,332
3,602 3,513
3,119 3,165
Sep-10 Sep-11 Sep-12 Sep-13 Sep-14 Sep-15 Sep-16 Mar-17 Sep-17 Mar-18
Overlay
Collectively assessed provisions
Individually assessed provisions
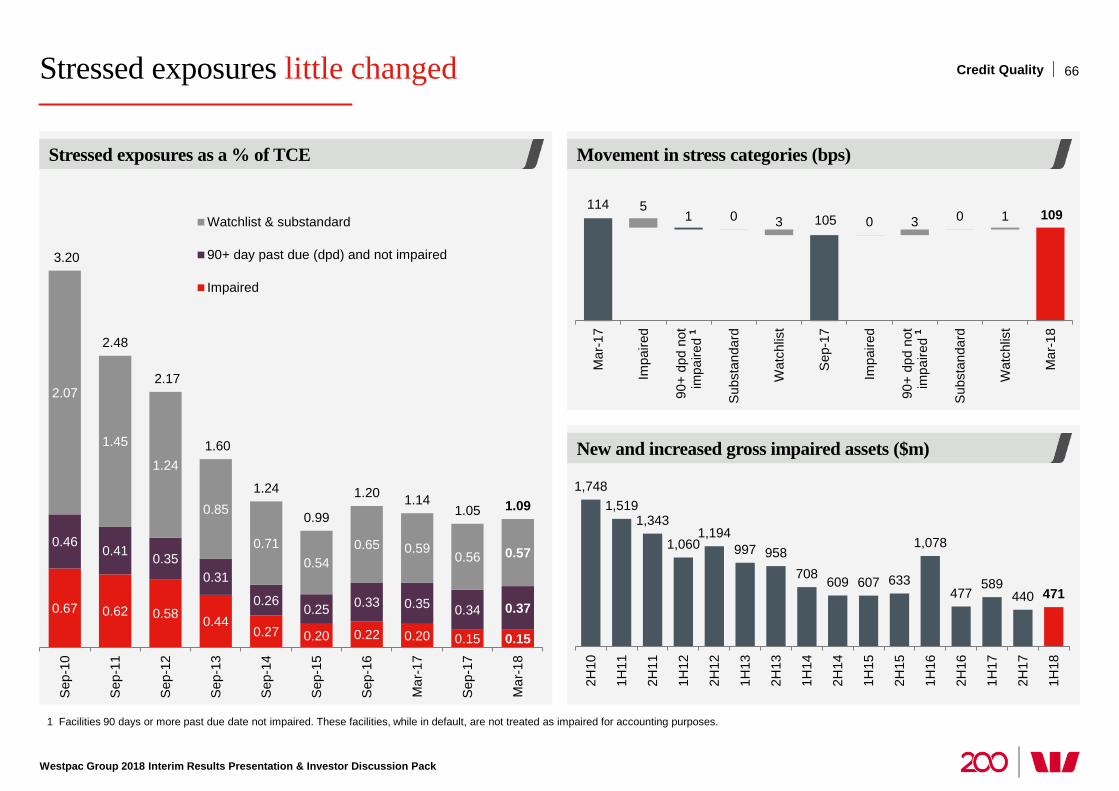
Stressed exposures little changed
Westpac Group 2018 Interim Results Presentation & Investor Discussion Pack
1 Facilities 90 days or more past due date not impaired. These facilities, while in default, are not treated as impaired for accounting purposes.
New and increased gross impaired assets ($m)
Movement in stress categories (bps) Stressed exposures as a % of TCE
66
114 5 1 0 3 105 0 3 0 1 109
Mar
-17
Impa
ired
90+
dpd
not
impa
ired
Sub
stan
dard
Wat
chlis
t
Sep
-17
Impa
ired
90+
dpd
not
impa
ired
Sub
stan
dard
Wat
chlis
t
Mar
-18
1,748 1,519
1,343
1,060 1,194
997 958 708 609 607 633
1,078
477 589
440 471 2H
10
1H11
2H11
1H12
2H12
1H13
2H13
1H14
2H14
1H15
2H15
1H16
2H16
1H17
2H17
1H18
0.67 0.62 0.58 0.44 0.27 0.20 0.22 0.20 0.15 0.15
0.46 0.41 0.35
0.31
0.26 0.25 0.33 0.35 0.34 0.37
2.07
1.45
1.24
0.85
0.71 0.54
0.65 0.59 0.56 0.57
3.20
2.48
2.17
1.60
1.24
0.99
1.20 1.14 1.05 1.09
Sep
-10
Sep
-11
Sep
-12
Sep
-13
Sep
-14
Sep
-15
Sep
-16
Mar
-17
Sep
-17
Mar
-18
Watchlist & substandard
90+ day past due (dpd) and not impaired
Impaired
Credit Quality
1 1
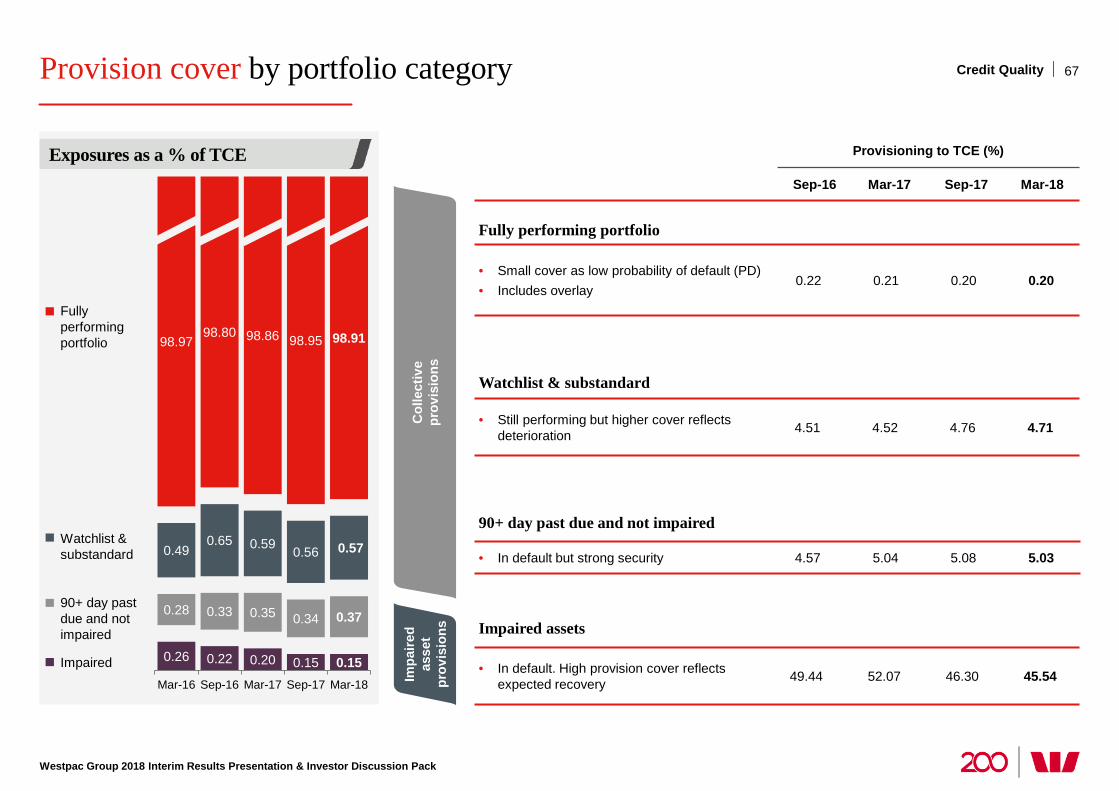
Provision cover by portfolio category
Westpac Group 2018 Interim Results Presentation & Investor Discussion Pack
67
Exposures as a % of TCE
0.26 0.22 0.20 0.15 0.15
0.28 0.33 0.35 0.34 0.37
0.49 0.65 0.59 0.56 0.57
98.97 98.80 98.86 98.95 98.91
Mar-16 Sep-16 Mar-17 Sep-17 Mar-18
Fully performing portfolio
Watchlist & substandard
90+ day past due and not impaired
Impaired
Fully performing portfolio
• Small cover as low probability of default (PD) • Includes overlay
0.22 0.21 0.20 0.20
Provisioning to TCE (%)
Sep-16 Mar-17 Sep-17 Mar-18
Watchlist & substandard
• Still performing but higher cover reflects deterioration 4.51 4.52 4.76 4.71
90+ day past due and not impaired
• In default but strong security 4.57 5.04 5.08 5.03
Impaired assets
• In default. High provision cover reflects expected recovery 49.44 52.07 46.30 45.54 Im
paire
d as
set
prov
isio
ns
Col
lect
ive
pr
ovis
ions
Credit Quality
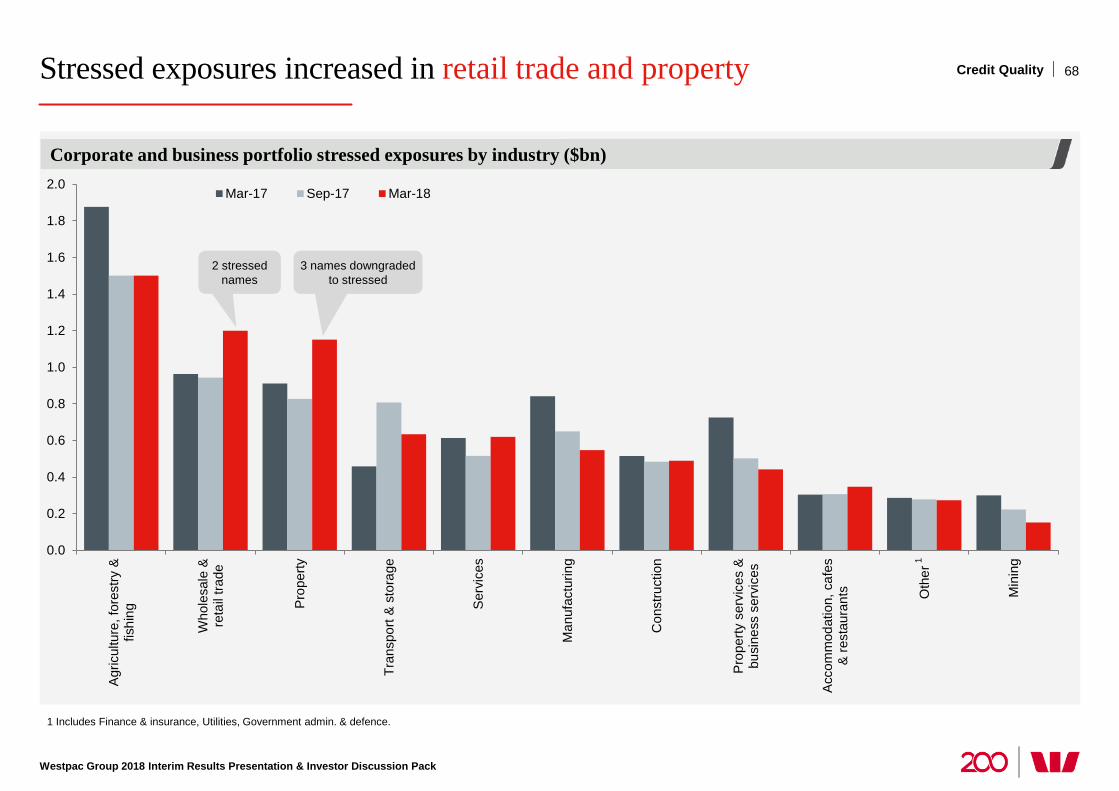
Stressed exposures increased in retail trade and property
Westpac Group 2018 Interim Results Presentation & Investor Discussion Pack
1 Includes Finance & insurance, Utilities, Government admin. & defence.
Corporate and business portfolio stressed exposures by industry ($bn)
68
0.0
0.2
0.4
0.6
0.8
1.0
1.2
1.4
1.6
1.8
2.0
Agr
icul
ture
, for
estry
&fis
hing
Who
lesa
le &
reta
il tra
de
Pro
perty
Tran
spor
t & s
tora
ge
Ser
vice
s
Man
ufac
turin
g
Con
stru
ctio
n
Pro
perty
ser
vice
s &
busi
ness
ser
vice
s
Acc
omm
odat
ion,
caf
es&
rest
aura
nts Oth
er
Min
ing
Mar-17 Sep-17 Mar-18
3 names downgraded to stressed
1
Credit Quality
2 stressed names
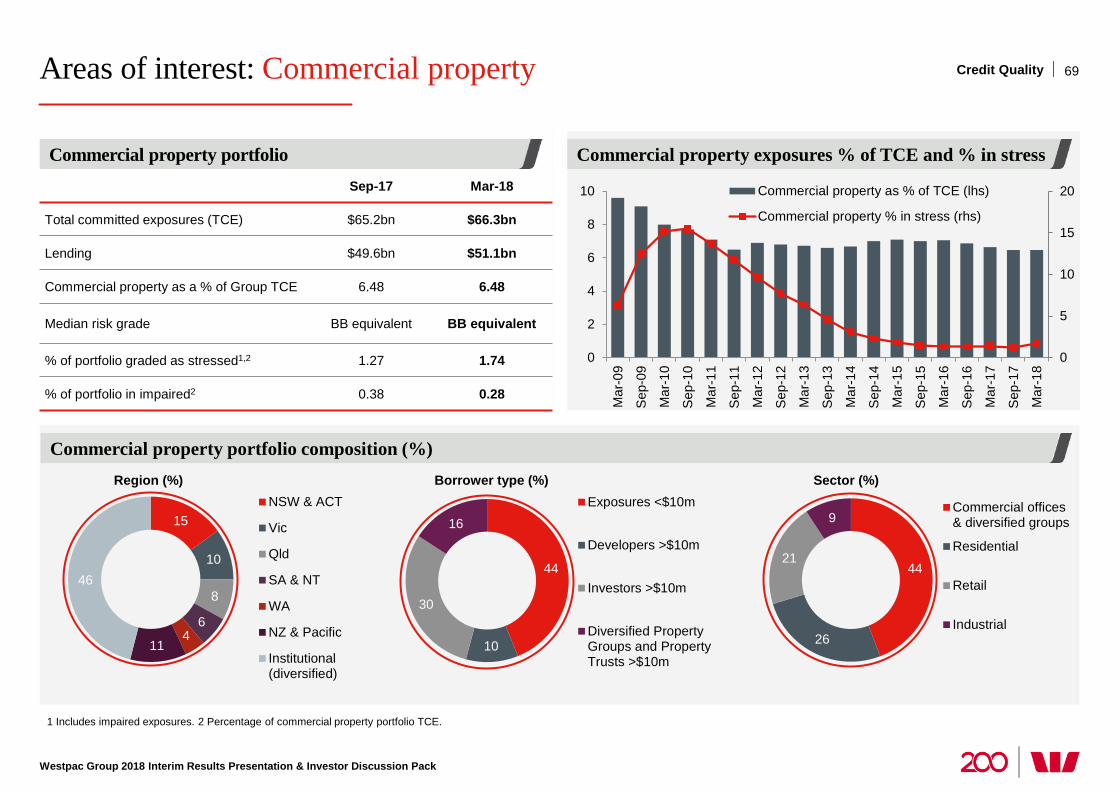
Areas of interest: Commercial property
Westpac Group 2018 Interim Results Presentation & Investor Discussion Pack
1 Includes impaired exposures. 2 Percentage of commercial property portfolio TCE.
Commercial property portfolio composition (%)
Commercial property exposures % of TCE and % in stress Commercial property portfolio
69
0
5
10
15
20
0
2
4
6
8
10
Mar
-09
Sep
-09
Mar
-10
Sep
-10
Mar
-11
Sep
-11
Mar
-12
Sep
-12
Mar
-13
Sep
-13
Mar
-14
Sep
-14
Mar
-15
Sep
-15
Mar
-16
Sep
-16
Mar
-17
Sep
-17
Mar
-18
Commercial property as % of TCE (lhs)
Commercial property % in stress (rhs)
Sep-17 Mar-18
Total committed exposures (TCE) $65.2bn $66.3bn
Lending $49.6bn $51.1bn
Commercial property as a % of Group TCE 6.48 6.48
Median risk grade BB equivalent BB equivalent
% of portfolio graded as stressed1,2 1.27 1.74
% of portfolio in impaired2 0.38 0.28
15
10
8
6 4
11
46
NSW & ACT
Vic
Qld
SA & NT
WA
NZ & Pacific
Institutional(diversified)
44
10
30
16 Exposures <$10m
Developers >$10m
Investors >$10m
Diversified PropertyGroups and PropertyTrusts >$10m
44
26
21
9 Commercial offices& diversified groups
Residential
Retail
Industrial
Borrower type (%) Region (%) Sector (%)
Credit Quality
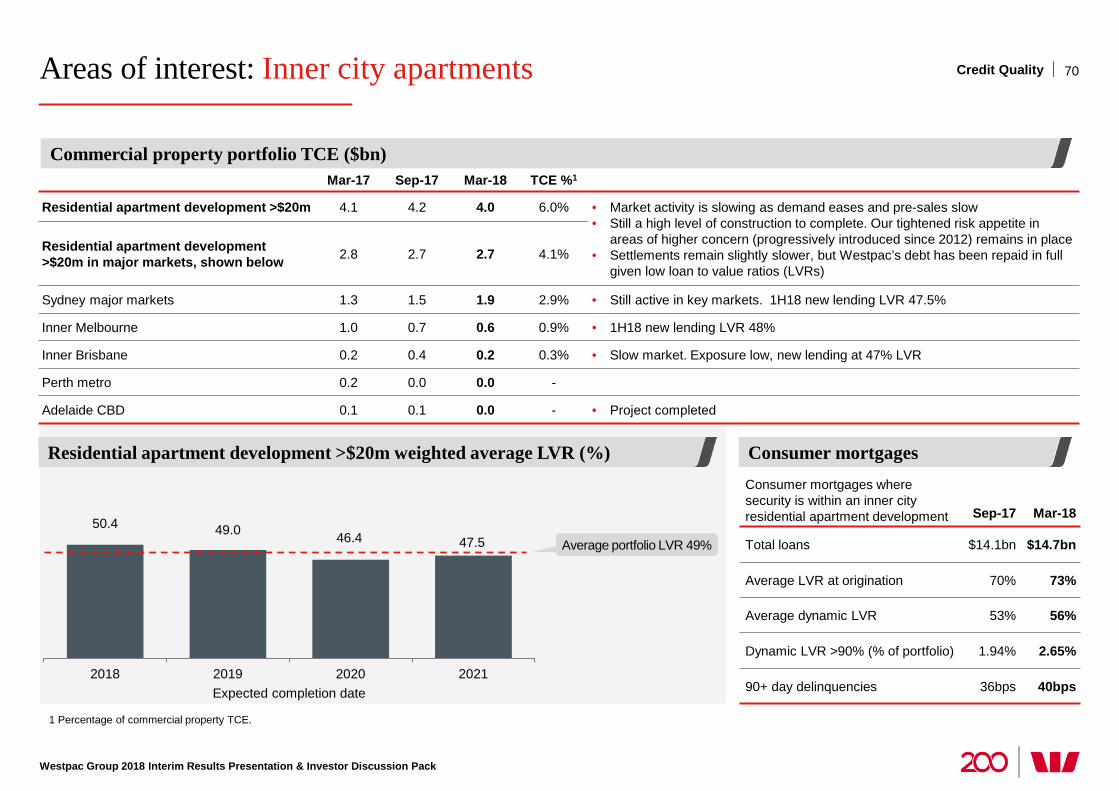
Areas of interest: Inner city apartments
Westpac Group 2018 Interim Results Presentation & Investor Discussion Pack
70
1 Percentage of commercial property TCE.
50.4 49.0 46.4 47.5
2018 2019 2020 2021Expected completion date
Mar-17 Sep-17 Mar-18 TCE %1
Residential apartment development >$20m 4.1 4.2 4.0 6.0% • Market activity is slowing as demand eases and pre-sales slow • Still a high level of construction to complete. Our tightened risk appetite in
areas of higher concern (progressively introduced since 2012) remains in place • Settlements remain slightly slower, but Westpac’s debt has been repaid in full
given low loan to value ratios (LVRs)
Residential apartment development >$20m in major markets, shown below 2.8 2.7 2.7 4.1%
Sydney major markets 1.3 1.5 1.9 2.9% • Still active in key markets. 1H18 new lending LVR 47.5%
Inner Melbourne 1.0 0.7 0.6 0.9% • 1H18 new lending LVR 48%
Inner Brisbane 0.2 0.4 0.2 0.3% • Slow market. Exposure low, new lending at 47% LVR
Perth metro 0.2 0.0 0.0 -
Adelaide CBD 0.1 0.1 0.0 - • Project completed
Average portfolio LVR 49%
Consumer mortgages where security is within an inner city residential apartment development Sep-17 Mar-18
Total loans $14.1bn $14.7bn
Average LVR at origination 70% 73%
Average dynamic LVR 53% 56%
Dynamic LVR >90% (% of portfolio) 1.94% 2.65%
90+ day delinquencies 36bps 40bps
Residential apartment development >$20m weighted average LVR (%)
Commercial property portfolio TCE ($bn)
Consumer mortgages
Credit Quality
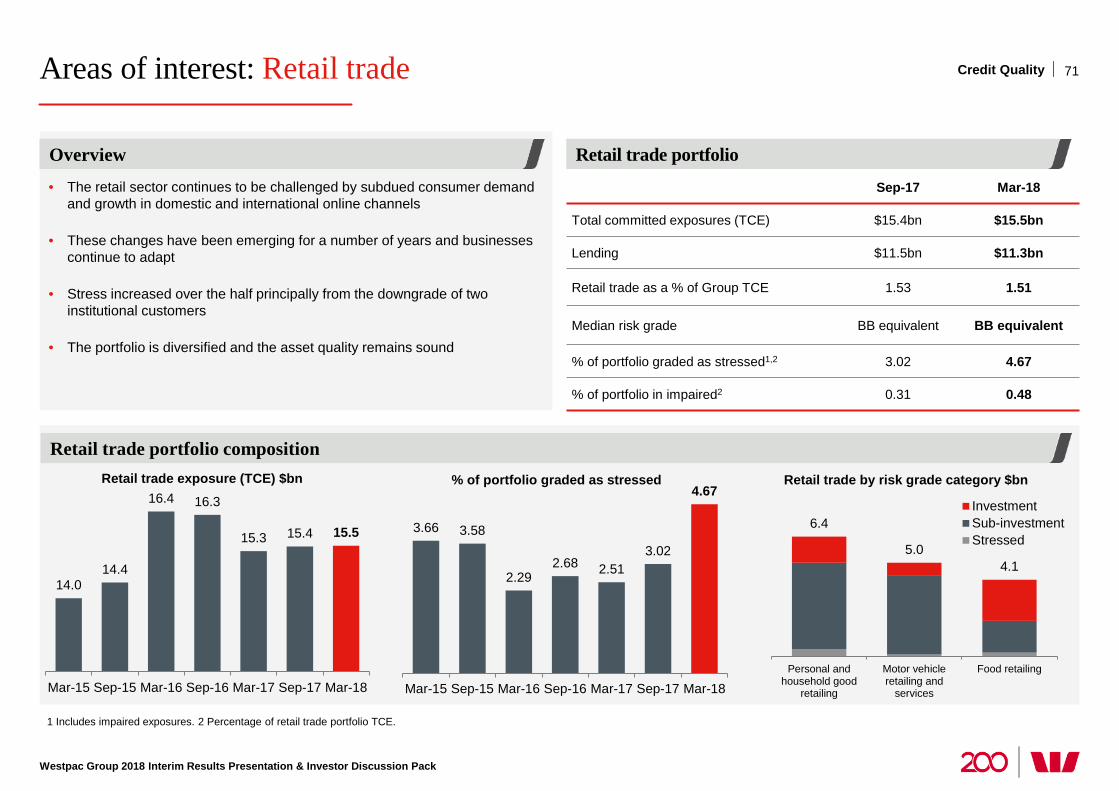
Areas of interest: Retail trade
Westpac Group 2018 Interim Results Presentation & Investor Discussion Pack
1 Includes impaired exposures. 2 Percentage of retail trade portfolio TCE.
Retail trade portfolio composition
Overview
71
Sep-17 Mar-18
Total committed exposures (TCE) $15.4bn $15.5bn
Lending $11.5bn $11.3bn
Retail trade as a % of Group TCE 1.53 1.51
Median risk grade BB equivalent BB equivalent
% of portfolio graded as stressed1,2 3.02 4.67
% of portfolio in impaired2 0.31 0.48
Credit Quality
Retail trade portfolio
• The retail sector continues to be challenged by subdued consumer demand and growth in domestic and international online channels
• These changes have been emerging for a number of years and businesses continue to adapt
• Stress increased over the half principally from the downgrade of two institutional customers
• The portfolio is diversified and the asset quality remains sound
14.0 14.4
16.4 16.3
15.3 15.4 15.5
Mar-15 Sep-15 Mar-16 Sep-16 Mar-17 Sep-17 Mar-18
Retail trade exposure (TCE) $bn
3.66 3.58
2.29 2.68 2.51
3.02
4.67
Mar-15 Sep-15 Mar-16 Sep-16 Mar-17 Sep-17 Mar-18
% of portfolio graded as stressed
Overview
6.4
5.0 4.1
Personal andhousehold good
retailing
Motor vehicleretailing and
services
Food retailing
InvestmentSub-investmentStressed
Retail trade by risk grade category $bn
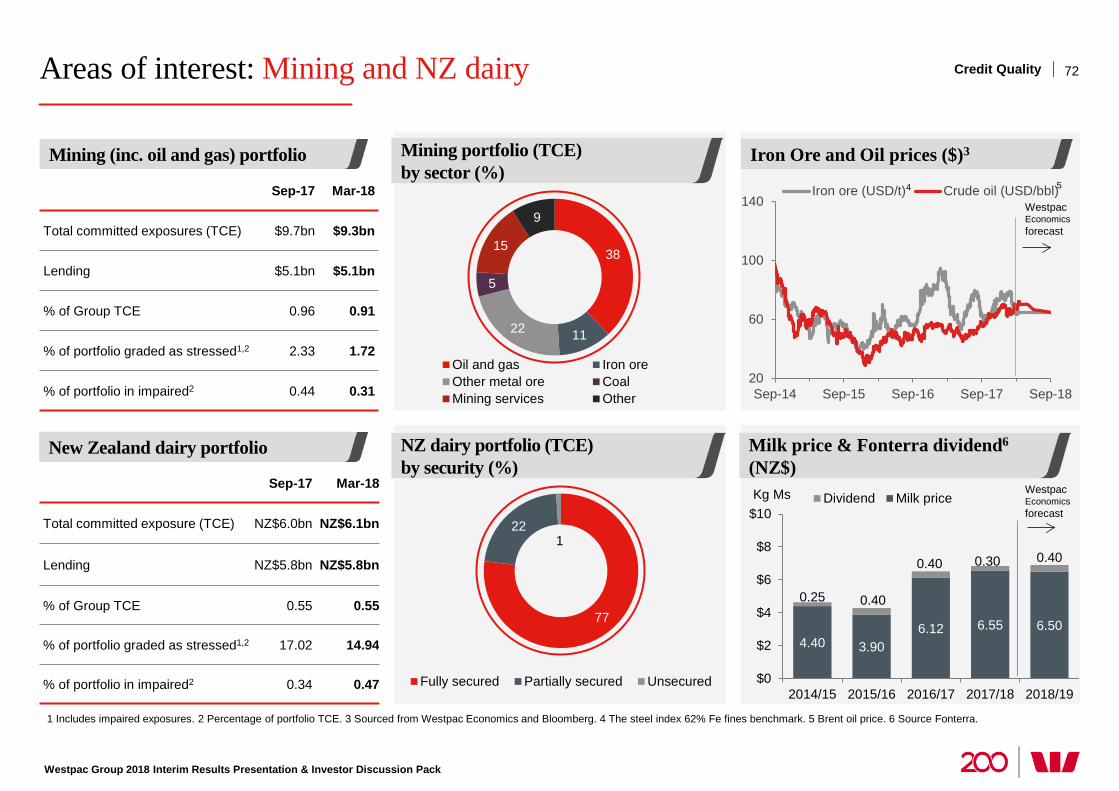
Areas of interest: Mining and NZ dairy
Westpac Group 2018 Interim Results Presentation & Investor Discussion Pack
1 Includes impaired exposures. 2 Percentage of portfolio TCE. 3 Sourced from Westpac Economics and Bloomberg. 4 The steel index 62% Fe fines benchmark. 5 Brent oil price. 6 Source Fonterra.
New Zealand dairy portfolio
Mining (inc. oil and gas) portfolio
72
Sep-17 Mar-18
Total committed exposures (TCE) $9.7bn $9.3bn
Lending $5.1bn $5.1bn
% of Group TCE 0.96 0.91
% of portfolio graded as stressed1,2 2.33 1.72
% of portfolio in impaired2 0.44 0.31
Sep-17 Mar-18
Total committed exposure (TCE) NZ$6.0bn NZ$6.1bn
Lending NZ$5.8bn NZ$5.8bn
% of Group TCE 0.55 0.55
% of portfolio graded as stressed1,2 17.02 14.94
% of portfolio in impaired2 0.34 0.47
Credit Quality
Iron Ore and Oil prices ($)3 Mining portfolio (TCE) by sector (%)
38
11 22
5
15
9
Oil and gas Iron oreOther metal ore CoalMining services Other
NZ dairy portfolio (TCE) by security (%)
77
22 1
Fully secured Partially secured Unsecured
Milk price & Fonterra dividend6 (NZ$)
4.40 3.90 6.12 6.55 6.50
0.25 0.40
0.40 0.30 0.40
$0
$2
$4
$6
$8
$10
2014/15 2015/16 2016/17 2017/18 2018/19
Kg Ms Dividend Milk price
20
60
100
140
Sep-14 Sep-15 Sep-16 Sep-17 Sep-18
Iron ore (USD/t) Crude oil (USD/bbl)
Westpac Economics forecast
4 5
Westpac Economics forecast
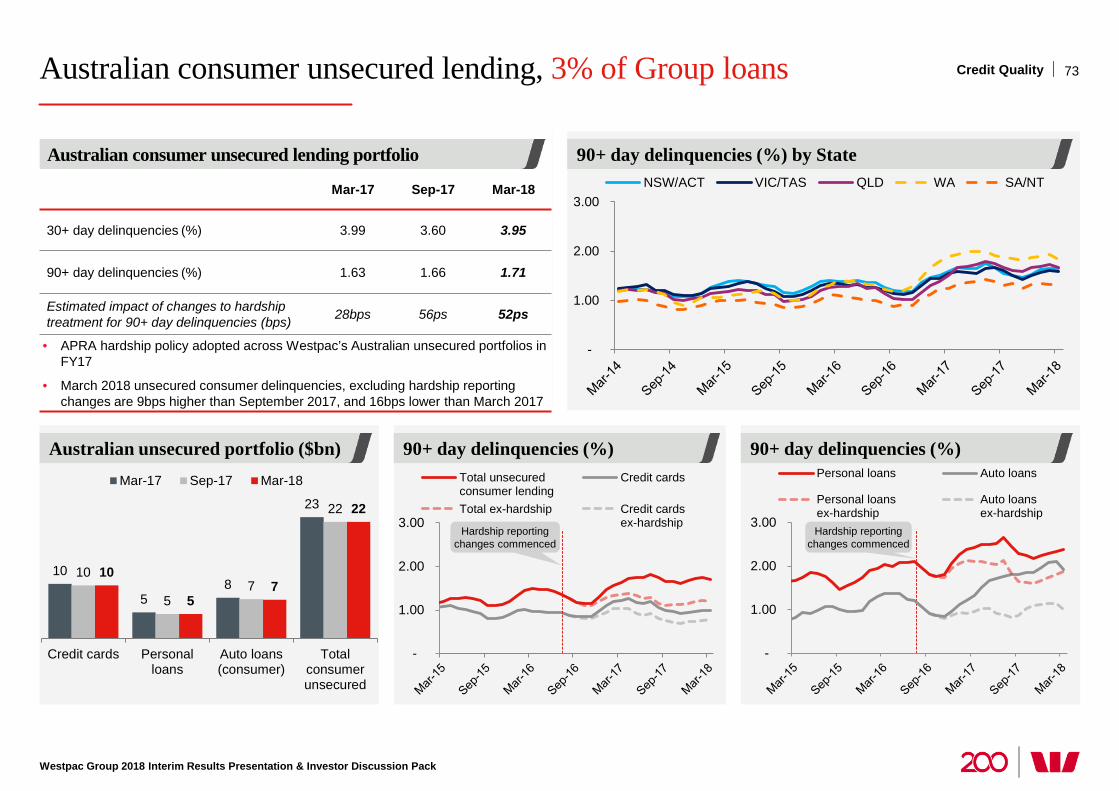
90+ day delinquencies (%) 90+ day delinquencies (%)
Australian consumer unsecured lending, 3% of Group loans
Westpac Group 2018 Interim Results Presentation & Investor Discussion Pack
Mar-17 Sep-17 Mar-18
30+ day delinquencies (%) 3.99 3.60 3.95
90+ day delinquencies (%) 1.63 1.66 1.71
Estimated impact of changes to hardship treatment for 90+ day delinquencies (bps) 28bps 56ps 52ps
• APRA hardship policy adopted across Westpac’s Australian unsecured portfolios in FY17
• March 2018 unsecured consumer delinquencies, excluding hardship reporting changes are 9bps higher than September 2017, and 16bps lower than March 2017
Australian unsecured portfolio ($bn)
10
5 8
23
10
5 7
22
10
5 7
22
Credit cards Personalloans
Auto loans(consumer)
Totalconsumerunsecured
Mar-17 Sep-17 Mar-18
90+ day delinquencies (%) by State Australian consumer unsecured lending portfolio
73
-
1.00
2.00
3.00
Total unsecuredconsumer lending
Credit cards
Total ex-hardship Credit cardsex-hardship
Credit Quality
-
1.00
2.00
3.00NSW/ACT VIC/TAS QLD WA SA/NT
Hardship reporting changes commenced
Hardship reporting changes commenced
-
1.00
2.00
3.00
Personal loans Auto loans
Personal loansex-hardship
Auto loansex-hardship
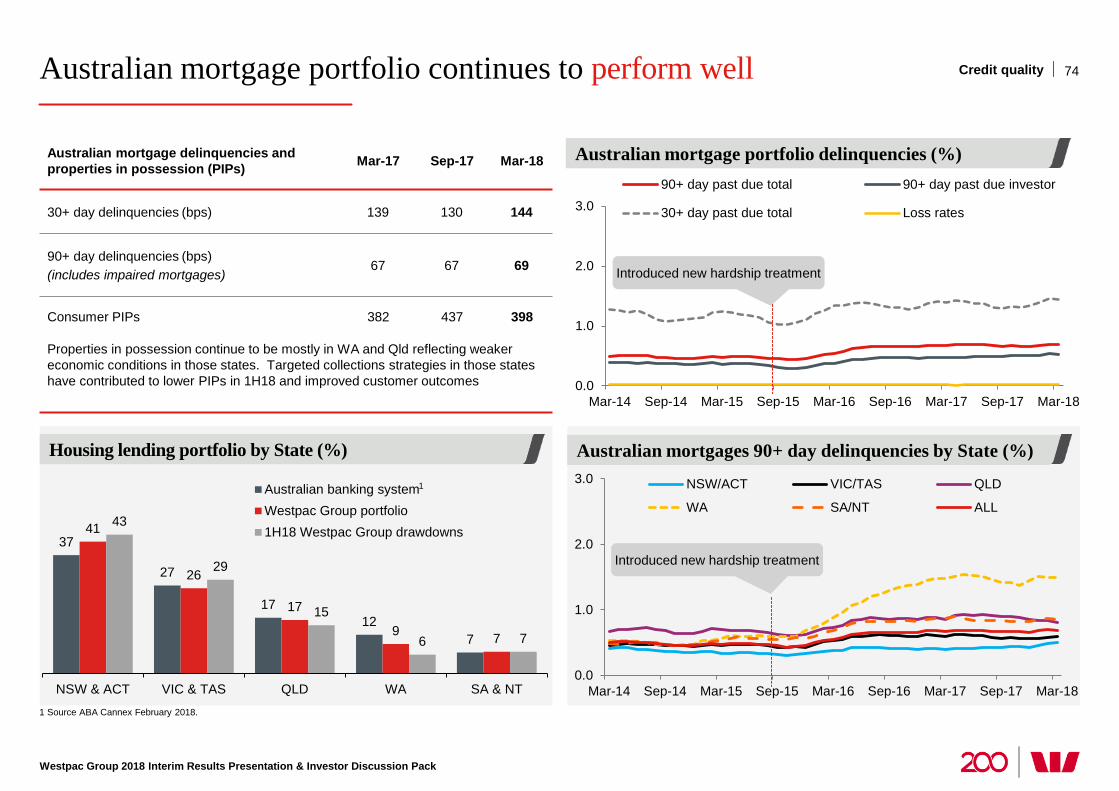
Australian mortgage portfolio continues to perform well
Westpac Group 2018 Interim Results Presentation & Investor Discussion Pack
Australian mortgages 90+ day delinquencies by State (%) Housing lending portfolio by State (%)
Australian mortgage delinquencies and properties in possession (PIPs) Mar-17 Sep-17 Mar-18
30+ day delinquencies (bps) 139 130 144
90+ day delinquencies (bps) (includes impaired mortgages)
67 67 69
Consumer PIPs 382 437 398
Properties in possession continue to be mostly in WA and Qld reflecting weaker economic conditions in those states. Targeted collections strategies in those states have contributed to lower PIPs in 1H18 and improved customer outcomes 0.0
1.0
2.0
3.0
Mar-14 Sep-14 Mar-15 Sep-15 Mar-16 Sep-16 Mar-17 Sep-17 Mar-18
90+ day past due total 90+ day past due investor
30+ day past due total Loss rates
0.0
1.0
2.0
3.0
Mar-14 Sep-14 Mar-15 Sep-15 Mar-16 Sep-16 Mar-17 Sep-17 Mar-18
NSW/ACT VIC/TAS QLD
WA SA/NT ALL
37
27
17 12
7
41
26
17
9 7
43
29
15
6 7
NSW & ACT VIC & TAS QLD WA SA & NT
Australian banking systemWestpac Group portfolio1H18 Westpac Group drawdowns
1 Source ABA Cannex February 2018.
74
1
Introduced new hardship treatment
Australian mortgage portfolio delinquencies (%)
Introduced new hardship treatment
Credit quality
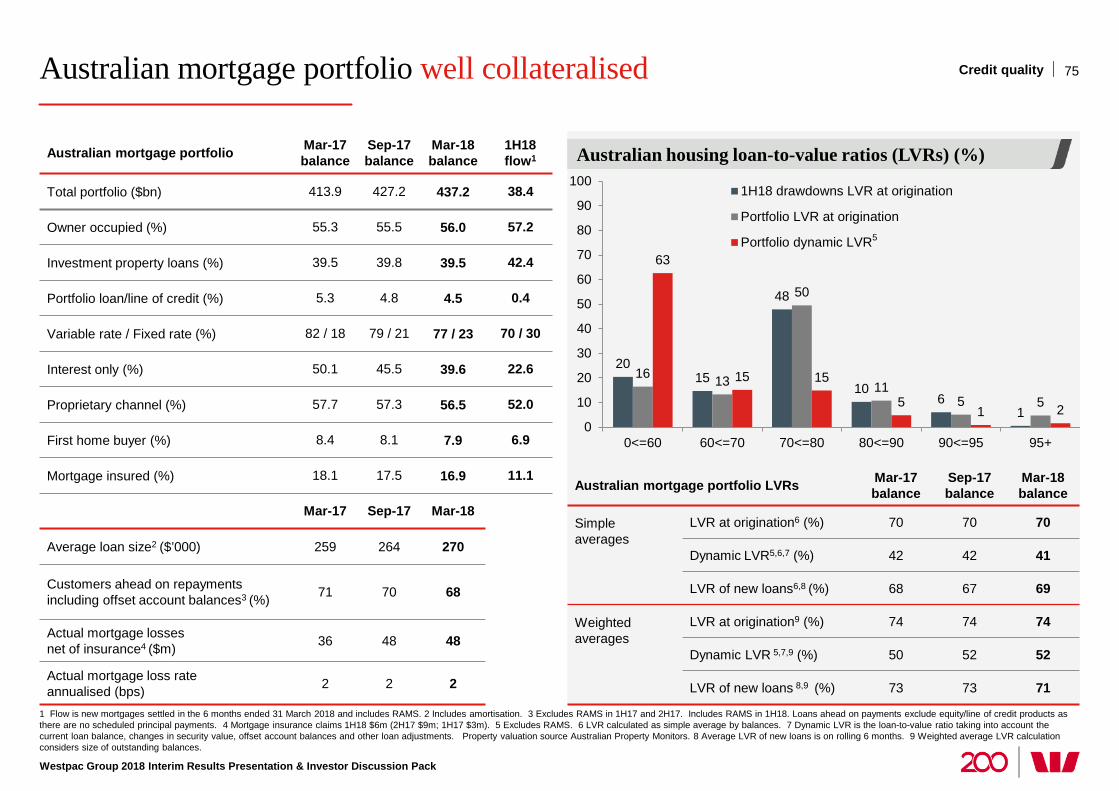
Australian mortgage portfolio well collateralised
Westpac Group 2018 Interim Results Presentation & Investor Discussion Pack
75 Credit quality
1 Flow is new mortgages settled in the 6 months ended 31 March 2018 and includes RAMS. 2 Includes amortisation. 3 Excludes RAMS in 1H17 and 2H17. Includes RAMS in 1H18. Loans ahead on payments exclude equity/line of credit products as there are no scheduled principal payments. 4 Mortgage insurance claims 1H18 $6m (2H17 $9m; 1H17 $3m). 5 Excludes RAMS. 6 LVR calculated as simple average by balances. 7 Dynamic LVR is the loan-to-value ratio taking into account the current loan balance, changes in security value, offset account balances and other loan adjustments. Property valuation source Australian Property Monitors. 8 Average LVR of new loans is on rolling 6 months. 9 Weighted average LVR calculation considers size of outstanding balances.
Australian housing loan-to-value ratios (LVRs) (%)
Australian mortgage portfolio LVRs Mar-17 balance
Sep-17 balance
Mar-18 balance
Simple averages
LVR at origination6 (%) 70 70 70
Dynamic LVR5,6,7 (%) 42 42 41
LVR of new loans6,8 (%) 68 67 69
Weighted averages
LVR at origination9 (%) 74 74 74
Dynamic LVR 5,7,9 (%) 50 52 52
LVR of new loans 8,9 (%) 73 73 71
20 15
48
10 6
1
16 13
50
11 5 5
63
15 15
5 1 2
0
10
20
30
40
50
60
70
80
90
100
0<=60 60<=70 70<=80 80<=90 90<=95 95+
1H18 drawdowns LVR at origination
Portfolio LVR at origination
Portfolio dynamic LVR
Australian mortgage portfolio Mar-17 balance
Sep-17 balance
Mar-18 balance
1H18 flow1
Total portfolio ($bn) 413.9 427.2 437.2 38.4
Owner occupied (%) 55.3 55.5 56.0 57.2
Investment property loans (%) 39.5 39.8 39.5 42.4
Portfolio loan/line of credit (%) 5.3 4.8 4.5 0.4
Variable rate / Fixed rate (%) 82 / 18 79 / 21 77 / 23 70 / 30
Interest only (%) 50.1 45.5 39.6 22.6
Proprietary channel (%) 57.7 57.3 56.5 52.0
First home buyer (%) 8.4 8.1 7.9 6.9
Mortgage insured (%) 18.1 17.5 16.9 11.1
Mar-17 Sep-17 Mar-18
Average loan size2 ($’000) 259 264 270
Customers ahead on repayments including offset account balances3 (%) 71 70 68
Actual mortgage losses net of insurance4 ($m) 36 48 48
Actual mortgage loss rate
annualised (bps) 2 2 2
5
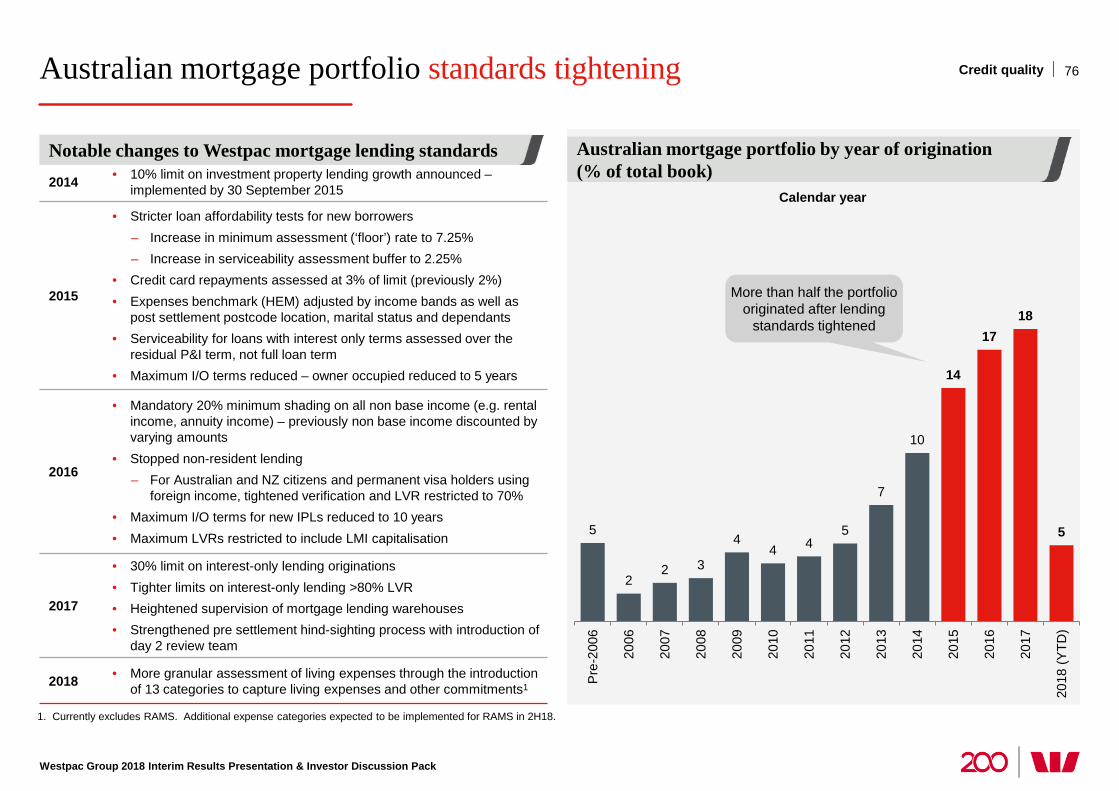
Australian mortgage portfolio standards tightening
Westpac Group 2018 Interim Results Presentation & Investor Discussion Pack
76 Credit quality
Australian mortgage portfolio by year of origination (% of total book)
5
2 2 3
4 4 4
5
7
10
14
17 18
5
Pre
-200
6
2006
2007
2008
2009
2010
2011
2012
2013
2014
2015
2016
2017
2018
(YTD
)
Calendar year 2014 • 10% limit on investment property lending growth announced –
implemented by 30 September 2015
2015
• Stricter loan affordability tests for new borrowers – Increase in minimum assessment (‘floor’) rate to 7.25% – Increase in serviceability assessment buffer to 2.25%
• Credit card repayments assessed at 3% of limit (previously 2%) • Expenses benchmark (HEM) adjusted by income bands as well as
post settlement postcode location, marital status and dependants • Serviceability for loans with interest only terms assessed over the
residual P&I term, not full loan term • Maximum I/O terms reduced – owner occupied reduced to 5 years
2016
• Mandatory 20% minimum shading on all non base income (e.g. rental income, annuity income) – previously non base income discounted by varying amounts
• Stopped non-resident lending – For Australian and NZ citizens and permanent visa holders using
foreign income, tightened verification and LVR restricted to 70% • Maximum I/O terms for new IPLs reduced to 10 years • Maximum LVRs restricted to include LMI capitalisation
2017
• 30% limit on interest-only lending originations • Tighter limits on interest-only lending >80% LVR • Heightened supervision of mortgage lending warehouses • Strengthened pre settlement hind-sighting process with introduction of
day 2 review team
2018 • More granular assessment of living expenses through the introduction of 13 categories to capture living expenses and other commitments1
Notable changes to Westpac mortgage lending standards
More than half the portfolio originated after lending
standards tightened
1. Currently excludes RAMS. Additional expense categories expected to be implemented for RAMS in 2H18.
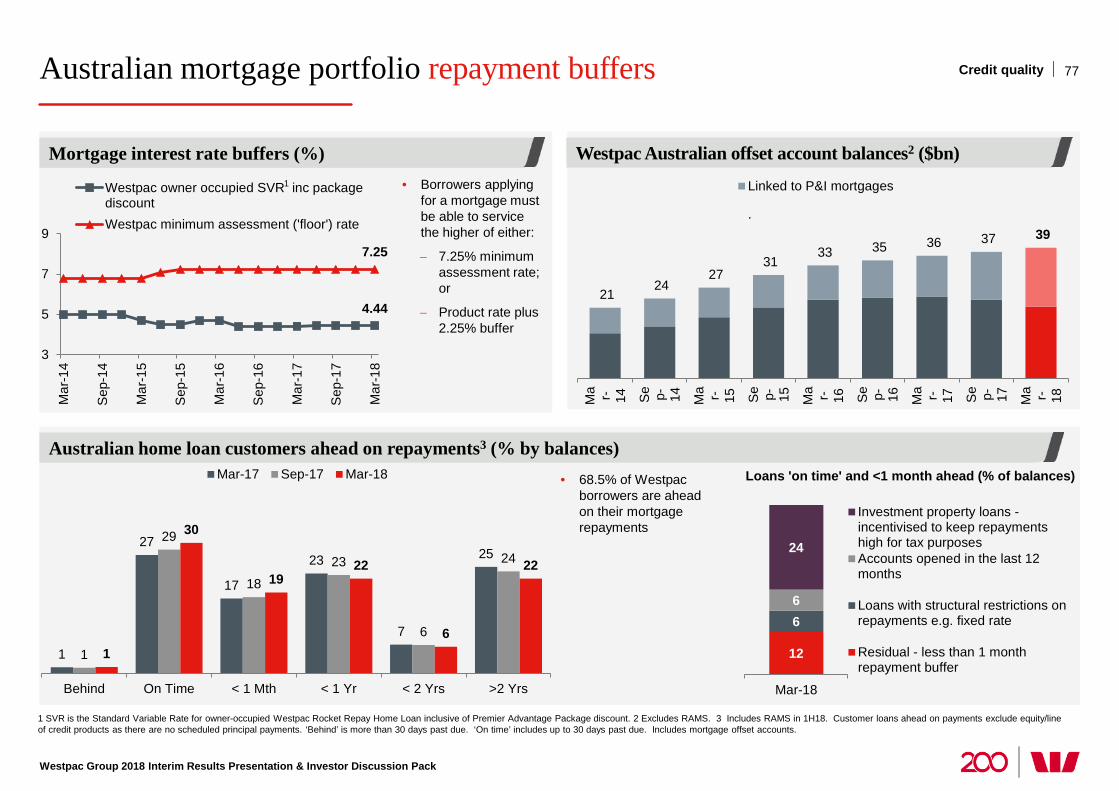
Australian mortgage portfolio repayment buffers
1 SVR is the Standard Variable Rate for owner-occupied Westpac Rocket Repay Home Loan inclusive of Premier Advantage Package discount. 2 Excludes RAMS. 3 Includes RAMS in 1H18. Customer loans ahead on payments exclude equity/line of credit products as there are no scheduled principal payments. ‘Behind’ is more than 30 days past due. ‘On time’ includes up to 30 days past due. Includes mortgage offset accounts.
1
27
17
23
7
25
1
29
18 23
6
24
1
30
19 22
6
22
Behind On Time < 1 Mth < 1 Yr < 2 Yrs >2 Yrs
Mar-17 Sep-17 Mar-18
Westpac Group 2018 Interim Results Presentation & Investor Discussion Pack
77 Credit quality
Australian home loan customers ahead on repayments3 (% by balances)
21 24
27 31
33 35 36 37 39
Ma r- 14 Se p- 14 Ma r- 15 Se p- 15 Ma r- 16 Se p- 16 Ma r- 17 Se p- 17 Ma r- 18
Linked to I/O mortgages
Linked to P&I mortgages
.
• 68.5% of Westpac borrowers are ahead on their mortgage repayments
Westpac Australian offset account balances2 ($bn)
12
6 6
24
Mar-18
Investment property loans -incentivised to keep repaymentshigh for tax purposesAccounts opened in the last 12months
Loans with structural restrictions onrepayments e.g. fixed rate
Residual - less than 1 monthrepayment buffer
Loans 'on time' and <1 month ahead (% of balances)
4.44
7.25
3
5
7
9
Mar
-14
Sep
-14
Mar
-15
Sep
-15
Mar
-16
Sep
-16
Mar
-17
Sep
-17
Mar
-18
Westpac owner occupied SVR inc packagediscountWestpac minimum assessment ('floor') rate
1
Mortgage interest rate buffers (%) • Borrowers applying
for a mortgage must be able to service the higher of either:
− 7.25% minimum assessment rate; or
− Product rate plus 2.25% buffer
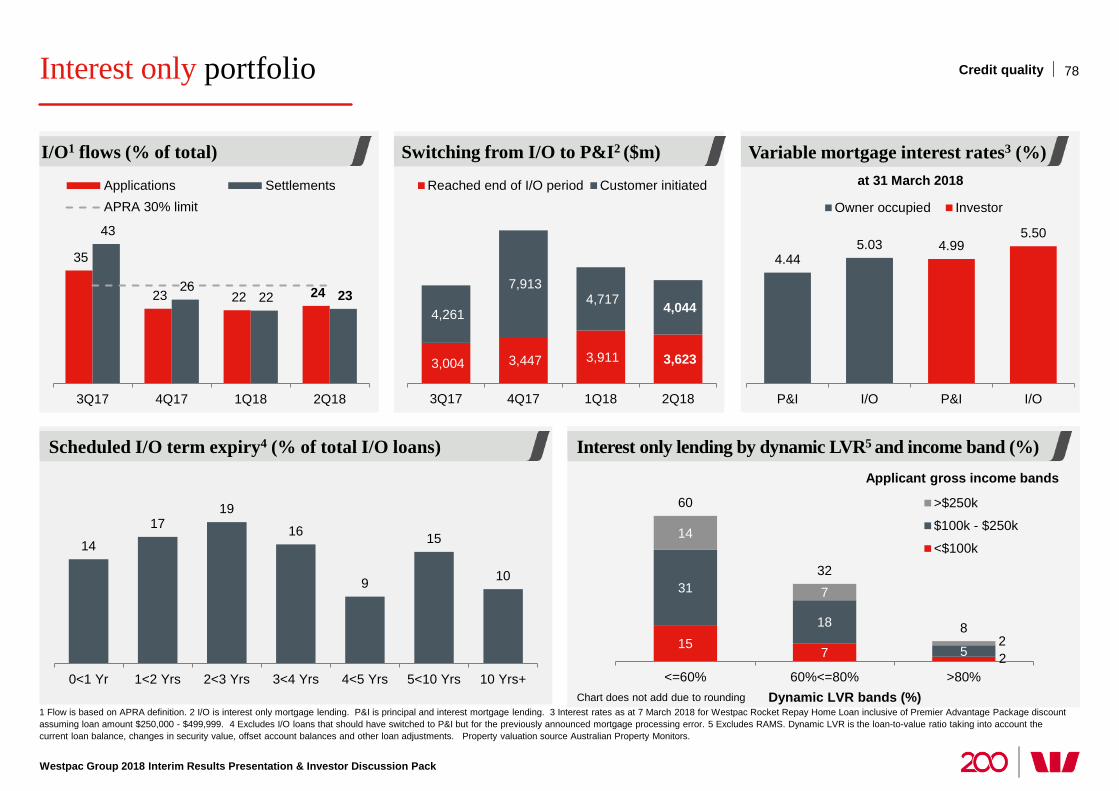
Westpac Group 2018 Interim Results Presentation & Investor Discussion Pack
Interest only portfolio
1 Flow is based on APRA definition. 2 I/O is interest only mortgage lending. P&I is principal and interest mortgage lending. 3 Interest rates as at 7 March 2018 for Westpac Rocket Repay Home Loan inclusive of Premier Advantage Package discount assuming loan amount $250,000 - $499,999. 4 Excludes I/O loans that should have switched to P&I but for the previously announced mortgage processing error. 5 Excludes RAMS. Dynamic LVR is the loan-to-value ratio taking into account the current loan balance, changes in security value, offset account balances and other loan adjustments. Property valuation source Australian Property Monitors.
78 Credit quality
Switching from I/O to P&I2 ($m) I/O1 flows (% of total)
Scheduled I/O term expiry4 (% of total I/O loans)
4.44 5.03 4.99
5.50
P&I I/O P&I I/O
Owner occupied Investor
Variable mortgage interest rates3 (%)
15 7 2
31
18
5
14
7
2
60
32
8
<=60% 60%<=80% >80%Dynamic LVR bands (%)
>$250k
$100k - $250k
<$100k
Applicant gross income bands
Chart does not add due to rounding
Interest only lending by dynamic LVR5 and income band (%)
3,004 3,447 3,911 3,623
4,261
7,913 4,717 4,044
3Q17 4Q17 1Q18 2Q18
Reached end of I/O period Customer initiated
35
23 22 24
43
26 22 23
3Q17 4Q17 1Q18 2Q18
Applications SettlementsAPRA 30% limit
at 31 March 2018
14
17 19
16
9
15
10
0<1 Yr 1<2 Yrs 2<3 Yrs 3<4 Yrs 4<5 Yrs 5<10 Yrs 10 Yrs+
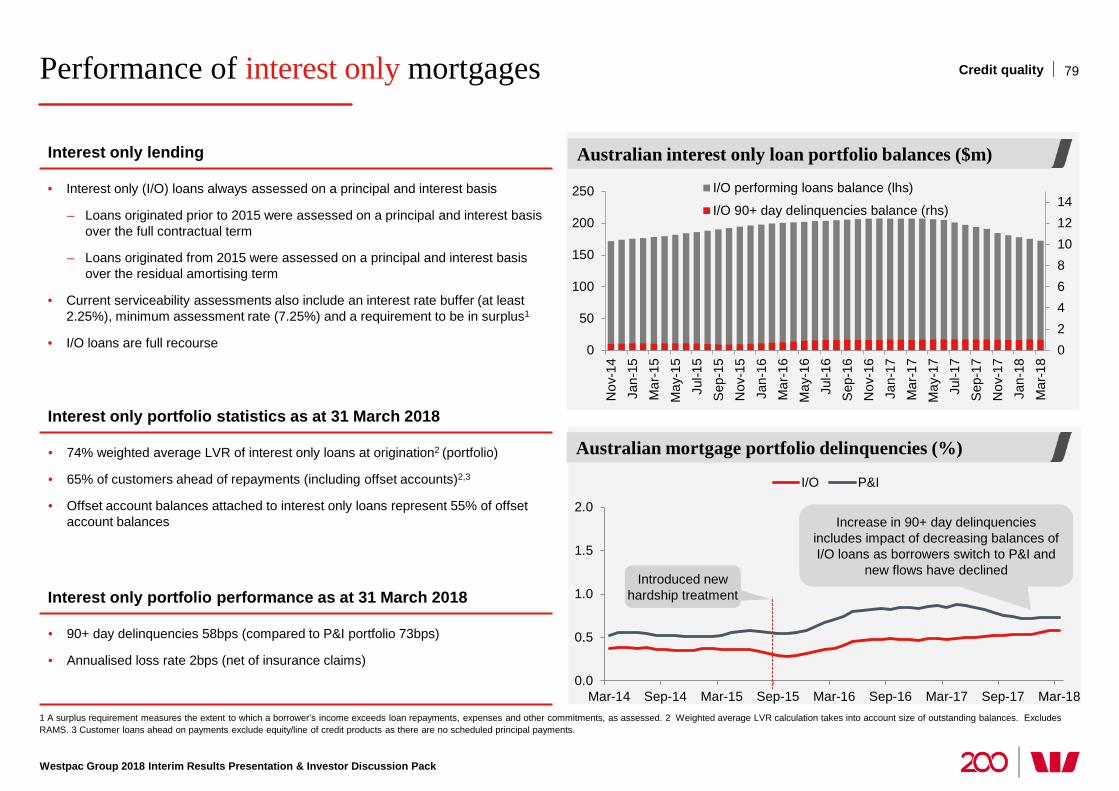
Westpac Group 2018 Interim Results Presentation & Investor Discussion Pack
Performance of interest only mortgages 79 Credit quality
1 A surplus requirement measures the extent to which a borrower’s income exceeds loan repayments, expenses and other commitments, as assessed. 2 Weighted average LVR calculation takes into account size of outstanding balances. Excludes RAMS. 3 Customer loans ahead on payments exclude equity/line of credit products as there are no scheduled principal payments.
Interest only lending
• Interest only (I/O) loans always assessed on a principal and interest basis
– Loans originated prior to 2015 were assessed on a principal and interest basis over the full contractual term
– Loans originated from 2015 were assessed on a principal and interest basis over the residual amortising term
• Current serviceability assessments also include an interest rate buffer (at least 2.25%), minimum assessment rate (7.25%) and a requirement to be in surplus1
• I/O loans are full recourse
Interest only portfolio statistics as at 31 March 2018
• 74% weighted average LVR of interest only loans at origination2 (portfolio)
• 65% of customers ahead of repayments (including offset accounts)2,3
• Offset account balances attached to interest only loans represent 55% of offset account balances
Interest only portfolio performance as at 31 March 2018
• 90+ day delinquencies 58bps (compared to P&I portfolio 73bps)
• Annualised loss rate 2bps (net of insurance claims) 0.0
0.5
1.0
1.5
2.0
Mar-14 Sep-14 Mar-15 Sep-15 Mar-16 Sep-16 Mar-17 Sep-17 Mar-18
I/O P&I
Australian mortgage portfolio delinquencies (%)
Australian interest only loan portfolio balances ($m)
Introduced new hardship treatment
Increase in 90+ day delinquencies includes impact of decreasing balances of I/O loans as borrowers switch to P&I and
new flows have declined
02468101214
0
50
100
150
200
250
Nov
-14
Jan-
15M
ar-1
5M
ay-1
5Ju
l-15
Sep
-15
Nov
-15
Jan-
16M
ar-1
6M
ay-1
6Ju
l-16
Sep
-16
Nov
-16
Jan-
17M
ar-1
7M
ay-1
7Ju
l-17
Sep
-17
Nov
-17
Jan-
18M
ar-1
8
I/O performing loans balance (lhs)
I/O 90+ day delinquencies balance (rhs)
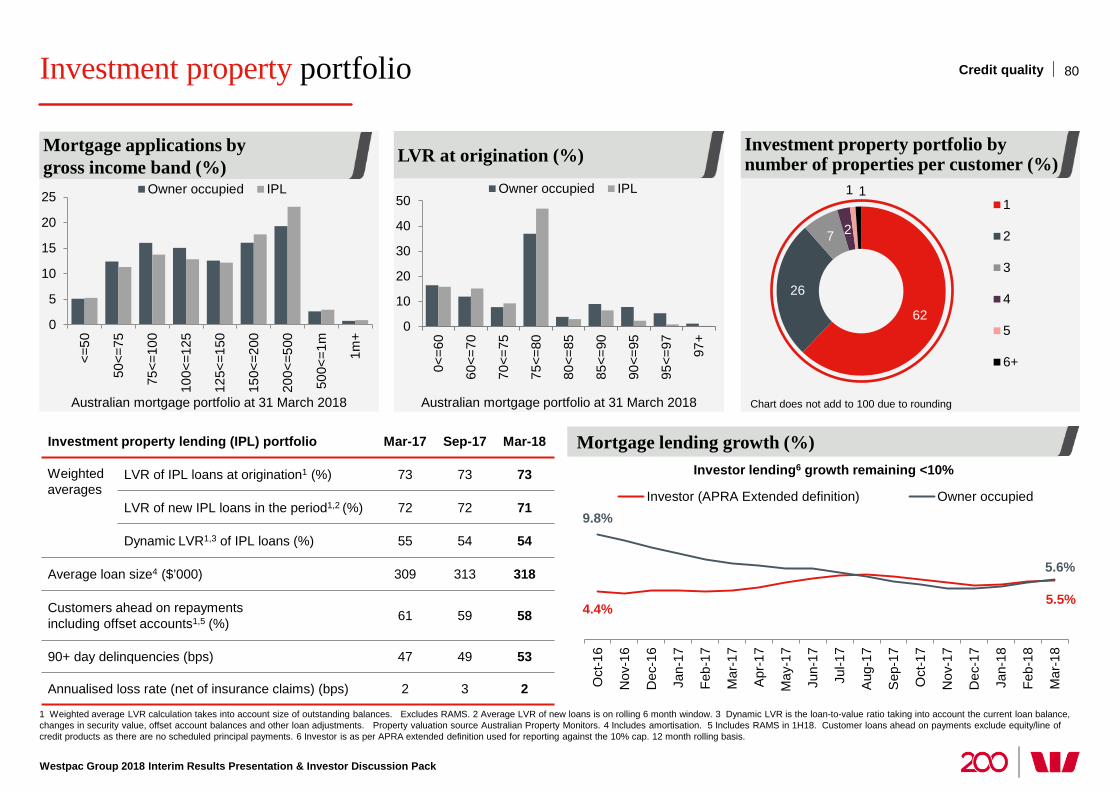
Westpac Group 2018 Interim Results Presentation & Investor Discussion Pack
Investment property portfolio 80 Credit quality
1 Weighted average LVR calculation takes into account size of outstanding balances. Excludes RAMS. 2 Average LVR of new loans is on rolling 6 month window. 3 Dynamic LVR is the loan-to-value ratio taking into account the current loan balance, changes in security value, offset account balances and other loan adjustments. Property valuation source Australian Property Monitors. 4 Includes amortisation. 5 Includes RAMS in 1H18. Customer loans ahead on payments exclude equity/line of credit products as there are no scheduled principal payments. 6 Investor is as per APRA extended definition used for reporting against the 10% cap. 12 month rolling basis.
Investment property lending (IPL) portfolio Mar-17 Sep-17 Mar-18
Weighted averages
LVR of IPL loans at origination1 (%) 73 73 73
LVR of new IPL loans in the period1,2 (%) 72 72 71
Dynamic LVR1,3 of IPL loans (%) 55 54 54
Average loan size4 ($’000) 309 313 318
Customers ahead on repayments including offset accounts1,5 (%) 61 59 58
90+ day delinquencies (bps) 47 49 53
Annualised loss rate (net of insurance claims) (bps) 2 3 2
0
10
20
30
40
50
0<=6
0
60<=
70
70<=
75
75<=
80
80<=
85
85<=
90
90<=
95
95<=
97 97+
Owner occupied IPL
0
5
10
15
20
25
<=50
50<=
75
75<=
100
100<
=125
125<
=150
150<
=200
200<
=500
500<
=1m
1m+
Owner occupied IPL
Investment property portfolio by number of properties per customer (%)
62
26
7 2
1 1 1
2
3
4
5
6+
Investor lending6 growth remaining <10%
Mortgage lending growth (%)
4.4% 5.5%
9.8%
5.6%
Oct
-16
Nov
-16
Dec
-16
Jan-
17
Feb-
17
Mar
-17
Apr
-17
May
-17
Jun-
17
Jul-1
7
Aug
-17
Sep
-17
Oct
-17
Nov
-17
Dec
-17
Jan-
18
Feb-
18
Mar
-18
Investor (APRA Extended definition) Owner occupied
Australian mortgage portfolio at 31 March 2018 Australian mortgage portfolio at 31 March 2018
LVR at origination (%) Mortgage applications by gross income band (%)
Chart does not add to 100 due to rounding
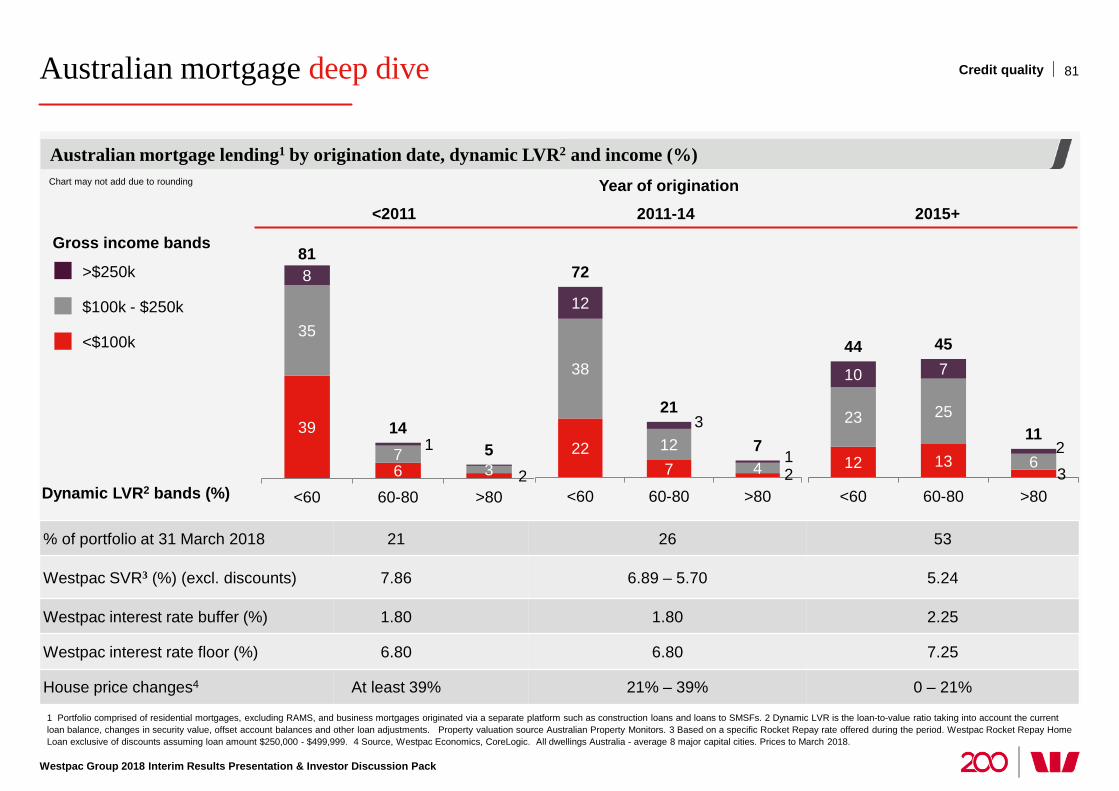
Australian mortgage deep dive
Westpac Group 2018 Interim Results Presentation & Investor Discussion Pack
1 Portfolio comprised of residential mortgages, excluding RAMS, and business mortgages originated via a separate platform such as construction loans and loans to SMSFs. 2 Dynamic LVR is the loan-to-value ratio taking into account the current loan balance, changes in security value, offset account balances and other loan adjustments. Property valuation source Australian Property Monitors. 3 Based on a specific Rocket Repay rate offered during the period. Westpac Rocket Repay Home Loan exclusive of discounts assuming loan amount $250,000 - $499,999. 4 Source, Westpac Economics, CoreLogic. All dwellings Australia - average 8 major capital cities. Prices to March 2018.
Australian mortgage lending1 by origination date, dynamic LVR2 and income (%)
81
22 7 2
38
12 4
12
3
1
72
21
7
<60 60-80 >80
39
6 2
35
7 3
8
1
81
14 5
<60 60-80 >80
12 13 3
23 25
6
10 7
2
44 45
11
<60 60-80 >80
% of portfolio at 31 March 2018 21 26 53
Westpac SVR3 (%) (excl. discounts) 7.86 6.89 – 5.70 5.24
Westpac interest rate buffer (%) 1.80 1.80 2.25
Westpac interest rate floor (%) 6.80 6.80 7.25
House price changes4 At least 39% 21% – 39% 0 – 21%
<2011 2011-14 2015+
Dynamic LVR2 bands (%)
>$250k
$100k - $250k
<$100k
Gross income bands
Credit quality
Year of origination Chart may not add due to rounding
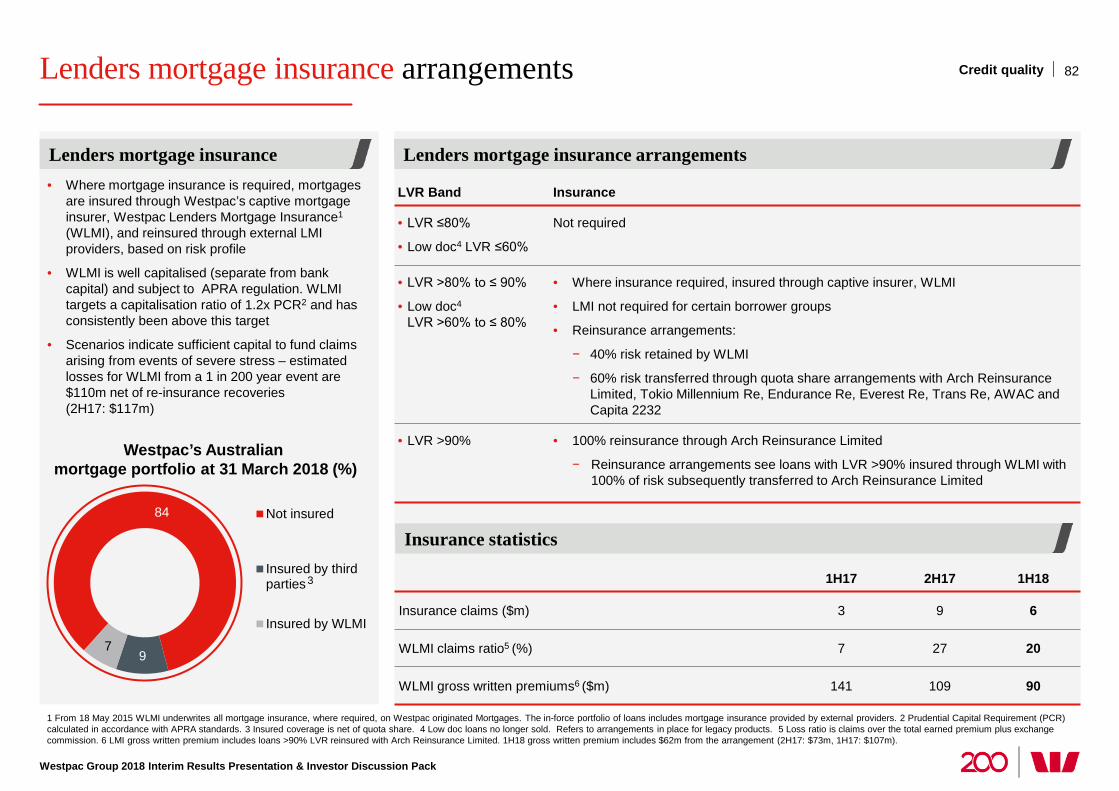
Lenders mortgage insurance arrangements
Westpac Group 2018 Interim Results Presentation & Investor Discussion Pack
1 From 18 May 2015 WLMI underwrites all mortgage insurance, where required, on Westpac originated Mortgages. The in-force portfolio of loans includes mortgage insurance provided by external providers. 2 Prudential Capital Requirement (PCR) calculated in accordance with APRA standards. 3 Insured coverage is net of quota share. 4 Low doc loans no longer sold. Refers to arrangements in place for legacy products. 5 Loss ratio is claims over the total earned premium plus exchange commission. 6 LMI gross written premium includes loans >90% LVR reinsured with Arch Reinsurance Limited. 1H18 gross written premium includes $62m from the arrangement (2H17: $73m, 1H17: $107m).
Lenders mortgage insurance arrangements Lenders mortgage insurance
82
LVR Band Insurance
• LVR ≤80%
• Low doc4 LVR ≤60%
Not required
• LVR >80% to ≤ 90%
• Low doc4 LVR >60% to ≤ 80%
• Where insurance required, insured through captive insurer, WLMI
• LMI not required for certain borrower groups
• Reinsurance arrangements:
− 40% risk retained by WLMI
− 60% risk transferred through quota share arrangements with Arch Reinsurance Limited, Tokio Millennium Re, Endurance Re, Everest Re, Trans Re, AWAC and Capita 2232
• LVR >90% • 100% reinsurance through Arch Reinsurance Limited
− Reinsurance arrangements see loans with LVR >90% insured through WLMI with 100% of risk subsequently transferred to Arch Reinsurance Limited
1H17 2H17 1H18
Insurance claims ($m) 3 9 6
WLMI claims ratio5 (%) 7 27 20
WLMI gross written premiums6 ($m) 141 109 90
Insurance statistics
• Where mortgage insurance is required, mortgages are insured through Westpac’s captive mortgage insurer, Westpac Lenders Mortgage Insurance1
(WLMI), and reinsured through external LMI providers, based on risk profile
• WLMI is well capitalised (separate from bank capital) and subject to APRA regulation. WLMI targets a capitalisation ratio of 1.2x PCR2 and has consistently been above this target
• Scenarios indicate sufficient capital to fund claims arising from events of severe stress – estimated losses for WLMI from a 1 in 200 year event are $110m net of re-insurance recoveries (2H17: $117m)
84
9 7
Not insured
Insured by thirdparties
Insured by WLMI
Westpac’s Australian mortgage portfolio at 31 March 2018 (%)
3
Credit quality
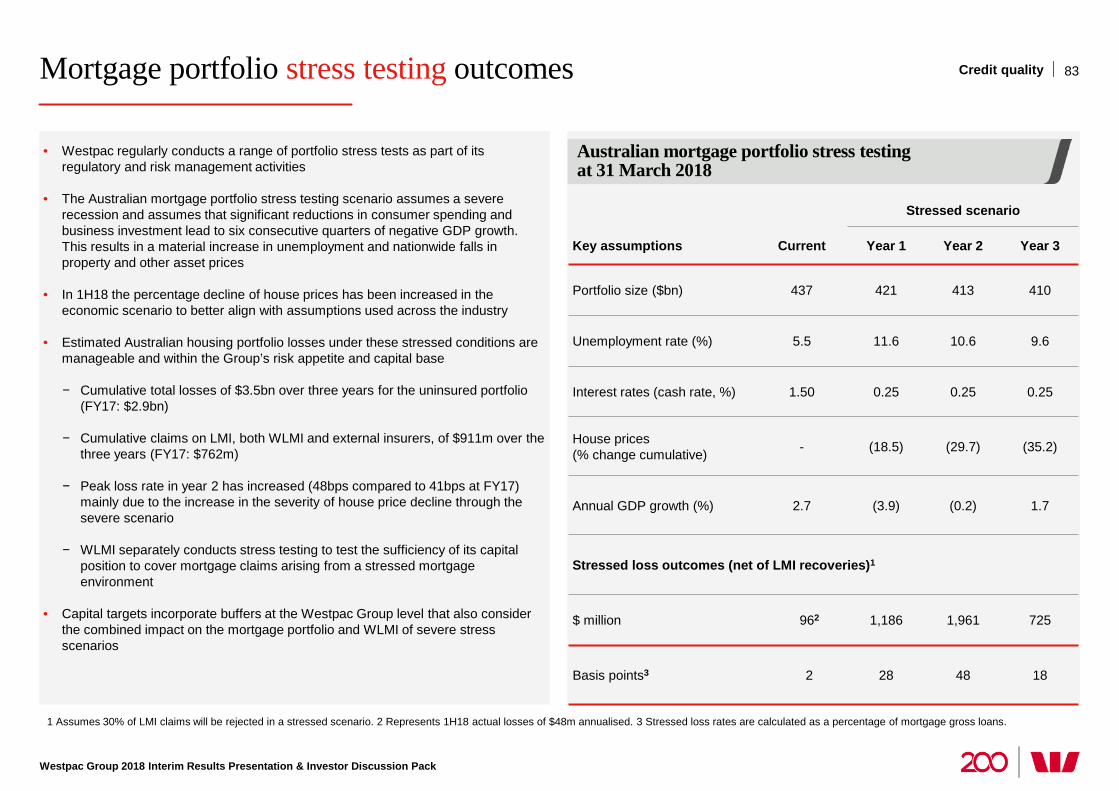
Mortgage portfolio stress testing outcomes
Westpac Group 2018 Interim Results Presentation & Investor Discussion Pack
1 Assumes 30% of LMI claims will be rejected in a stressed scenario. 2 Represents 1H18 actual losses of $48m annualised. 3 Stressed loss rates are calculated as a percentage of mortgage gross loans.
83 Credit quality
Australian mortgage portfolio stress testing at 31 March 2018
Stressed scenario
Key assumptions Current Year 1 Year 2 Year 3
Portfolio size ($bn) 437 421 413 410
Unemployment rate (%) 5.5 11.6 10.6 9.6
Interest rates (cash rate, %) 1.50 0.25 0.25 0.25
House prices (% change cumulative) - (18.5) (29.7) (35.2)
Annual GDP growth (%) 2.7 (3.9) (0.2) 1.7
Stressed loss outcomes (net of LMI recoveries)1
$ million 962 1,186 1,961 725
Basis points3 2 28 48 18
• Westpac regularly conducts a range of portfolio stress tests as part of its regulatory and risk management activities
• The Australian mortgage portfolio stress testing scenario assumes a severe recession and assumes that significant reductions in consumer spending and business investment lead to six consecutive quarters of negative GDP growth. This results in a material increase in unemployment and nationwide falls in property and other asset prices
• In 1H18 the percentage decline of house prices has been increased in the economic scenario to better align with assumptions used across the industry
• Estimated Australian housing portfolio losses under these stressed conditions are manageable and within the Group’s risk appetite and capital base
− Cumulative total losses of $3.5bn over three years for the uninsured portfolio (FY17: $2.9bn)
− Cumulative claims on LMI, both WLMI and external insurers, of $911m over the three years (FY17: $762m)
− Peak loss rate in year 2 has increased (48bps compared to 41bps at FY17) mainly due to the increase in the severity of house price decline through the severe scenario
− WLMI separately conducts stress testing to test the sufficiency of its capital position to cover mortgage claims arising from a stressed mortgage environment
• Capital targets incorporate buffers at the Westpac Group level that also consider the combined impact on the mortgage portfolio and WLMI of severe stress scenarios
Capital, Funding and Liquidity
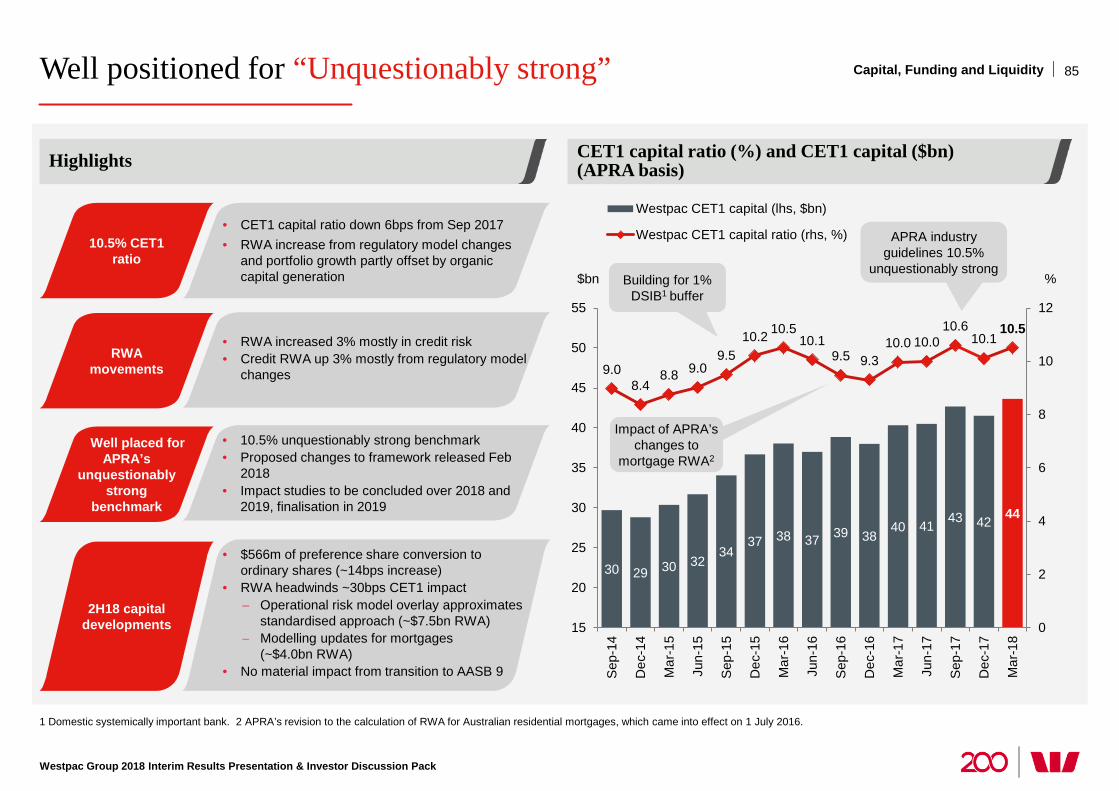
30 29 30 32 34
37 38 37 39 38 40 41 43 42 44
9.0 8.4
8.8 9.0 9.5
10.2 10.5 10.1
9.5 9.3 10.0 10.0
10.6 10.1
10.5
0
2
4
6
8
10
12
15
20
25
30
35
40
45
50
55
Sep
-14
Dec
-14
Mar
-15
Jun-
15
Sep
-15
Dec
-15
Mar
-16
Jun-
16
Sep
-16
Dec
-16
Mar
-17
Jun-
17
Sep
-17
Dec
-17
Mar
-18
Westpac CET1 capital (lhs, $bn)
Westpac CET1 capital ratio (rhs, %)
Well positioned for “Unquestionably strong”
Westpac Group 2018 Interim Results Presentation & Investor Discussion Pack
1 Domestic systemically important bank. 2 APRA’s revision to the calculation of RWA for Australian residential mortgages, which came into effect on 1 July 2016.
CET1 capital ratio (%) and CET1 capital ($bn) (APRA basis) Highlights
Capital, Funding and Liquidity
$bn %
APRA industry guidelines 10.5%
unquestionably strong
10.5% CET1 ratio
RWA movements
Well placed for APRA’s
unquestionably strong
benchmark
2H18 capital developments
• CET1 capital ratio down 6bps from Sep 2017 • RWA increase from regulatory model changes
and portfolio growth partly offset by organic capital generation
• RWA increased 3% mostly in credit risk • Credit RWA up 3% mostly from regulatory model
changes
• 10.5% unquestionably strong benchmark • Proposed changes to framework released Feb
2018 • Impact studies to be concluded over 2018 and
2019, finalisation in 2019
• $566m of preference share conversion to ordinary shares (~14bps increase)
• RWA headwinds ~30bps CET1 impact − Operational risk model overlay approximates
standardised approach (~$7.5bn RWA) − Modelling updates for mortgages
(~$4.0bn RWA) • No material impact from transition to AASB 9
Impact of APRA’s changes to
mortgage RWA2
Building for 1% DSIB1 buffer
85
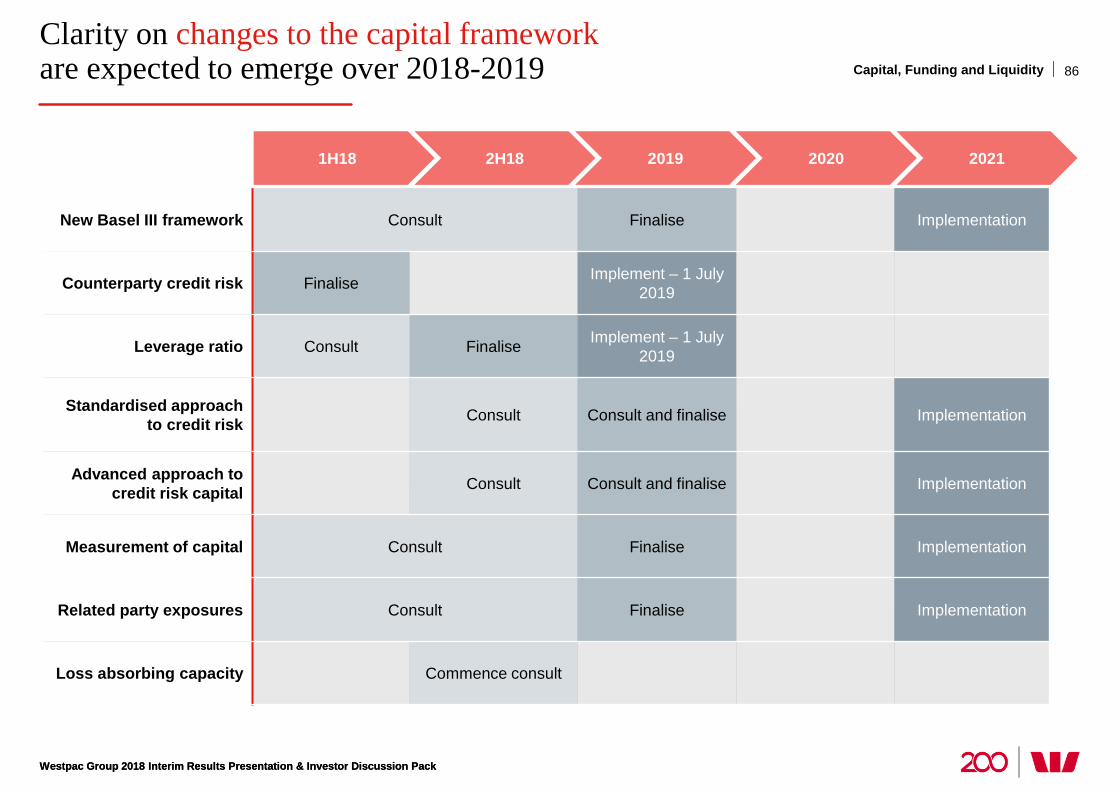
Westpac Group 2018 Interim Results Presentation & Investor Discussion Pack
Clarity on changes to the capital framework are expected to emerge over 2018-2019
Westpac Group 2018 Interim Results Presentation & Investor Discussion Pack
1H18 2H18 2021 2020 2019
New Basel III framework Consult Finalise Implementation
Counterparty credit risk Finalise Implement – 1 July 2019
Leverage ratio Consult Finalise Implement – 1 July 2019
Standardised approach to credit risk Consult Consult and finalise Implementation
Advanced approach to credit risk capital Consult Consult and finalise Implementation
Measurement of capital Consult Finalise Implementation
Related party exposures Consult Finalise Implementation
Loss absorbing capacity Commence consult
86 Capital, Funding and Liquidity
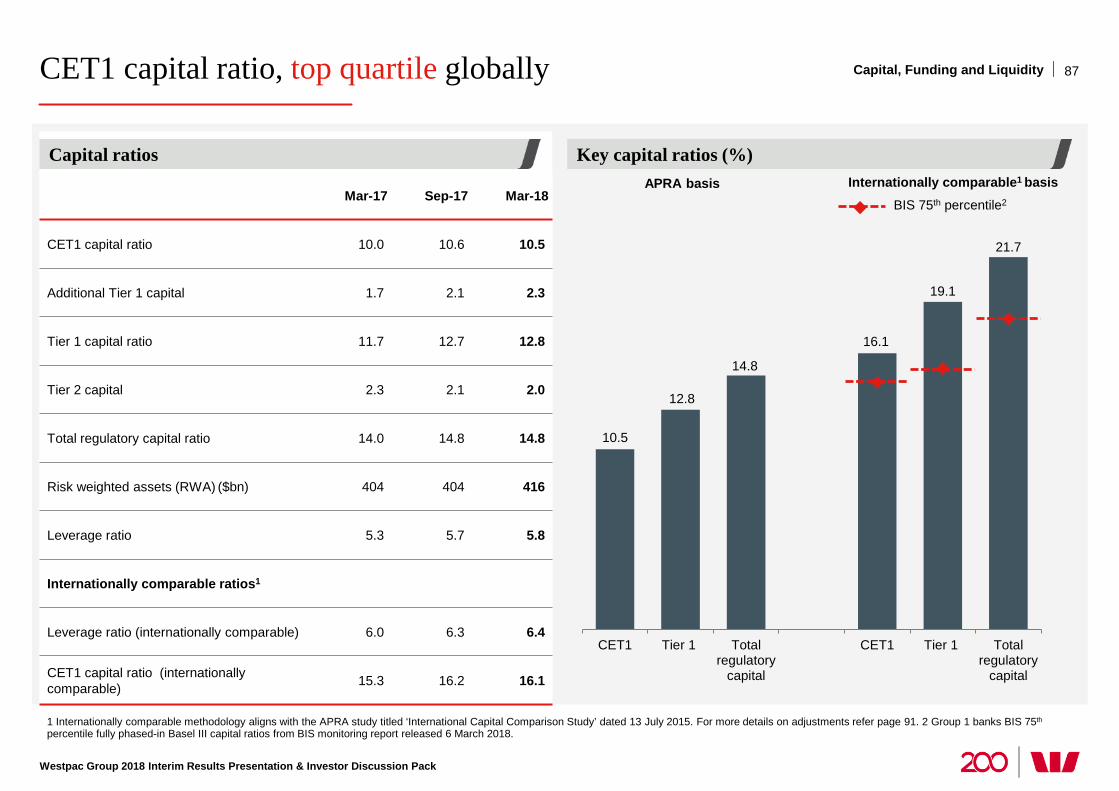
10.5
12.8
14.8
16.1
19.1
21.7
CET1 Tier 1 Totalregulatory
capital
CET1 Tier 1 Totalregulatory
capital
CET1 capital ratio, top quartile globally
Westpac Group 2018 Interim Results Presentation & Investor Discussion Pack
1 Internationally comparable methodology aligns with the APRA study titled ‘International Capital Comparison Study’ dated 13 July 2015. For more details on adjustments refer page 91. 2 Group 1 banks BIS 75th percentile fully phased-in Basel III capital ratios from BIS monitoring report released 6 March 2018.
Key capital ratios (%) Capital ratios
BIS 75th percentile2
APRA basis Internationally comparable1 basis Mar-17 Sep-17 Mar-18
CET1 capital ratio 10.0 10.6 10.5
Additional Tier 1 capital 1.7 2.1 2.3
Tier 1 capital ratio 11.7 12.7 12.8
Tier 2 capital 2.3 2.1 2.0
Total regulatory capital ratio 14.0 14.8 14.8
Risk weighted assets (RWA) ($bn) 404 404 416
Leverage ratio 5.3 5.7 5.8
Internationally comparable ratios1
Leverage ratio (internationally comparable) 6.0 6.3 6.4
CET1 capital ratio (internationally comparable) 15.3 16.2 16.1
Capital, Funding and Liquidity 87
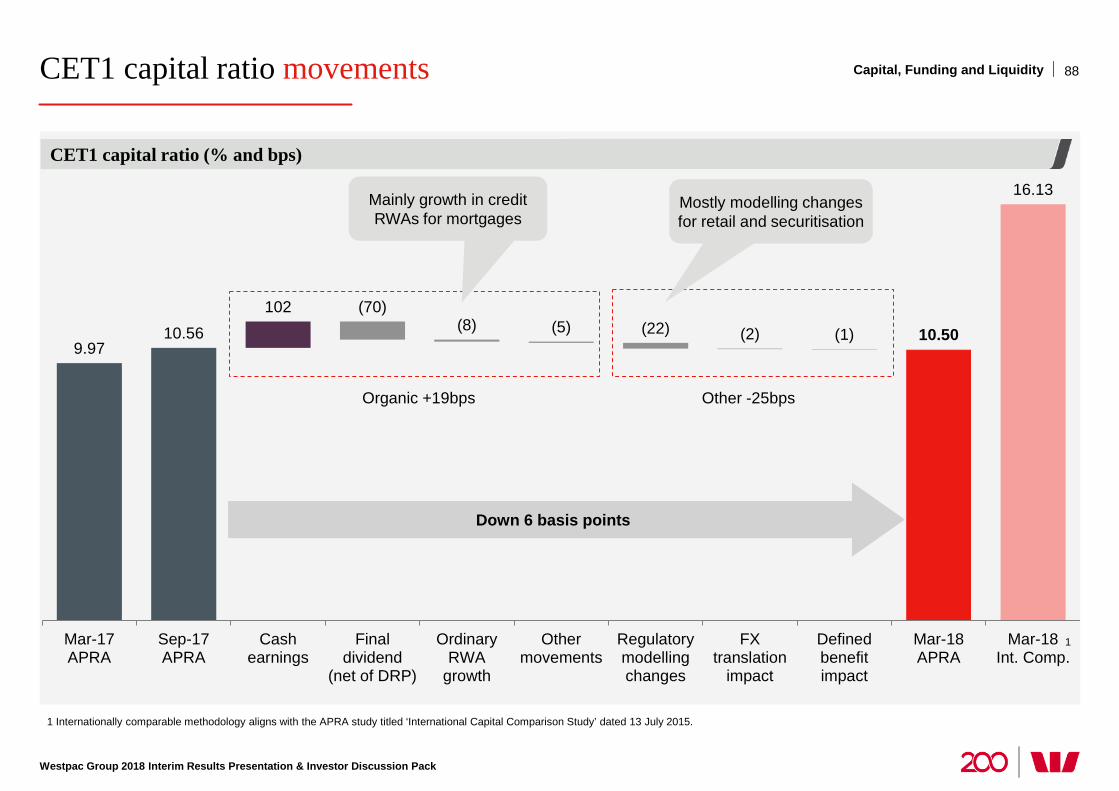
9.97 10.56
102
10.50
16.13
(70) (8) (5) (22) (2) (1)
Mar-17APRA
Sep-17APRA
Cashearnings
Finaldividend
(net of DRP)
OrdinaryRWA
growth
Othermovements
Regulatorymodellingchanges
FXtranslation
impact
Definedbenefitimpact
Mar-18APRA
Mar-18Int. Comp.
CET1 capital ratio movements
Westpac Group 2018 Interim Results Presentation & Investor Discussion Pack
1 Internationally comparable methodology aligns with the APRA study titled ‘International Capital Comparison Study’ dated 13 July 2015.
CET1 capital ratio (% and bps)
Capital, Funding and Liquidity
Down 6 basis points
Mainly growth in credit RWAs for mortgages
Organic +19bps Other -25bps
1
Mostly modelling changes for retail and securitisation
88
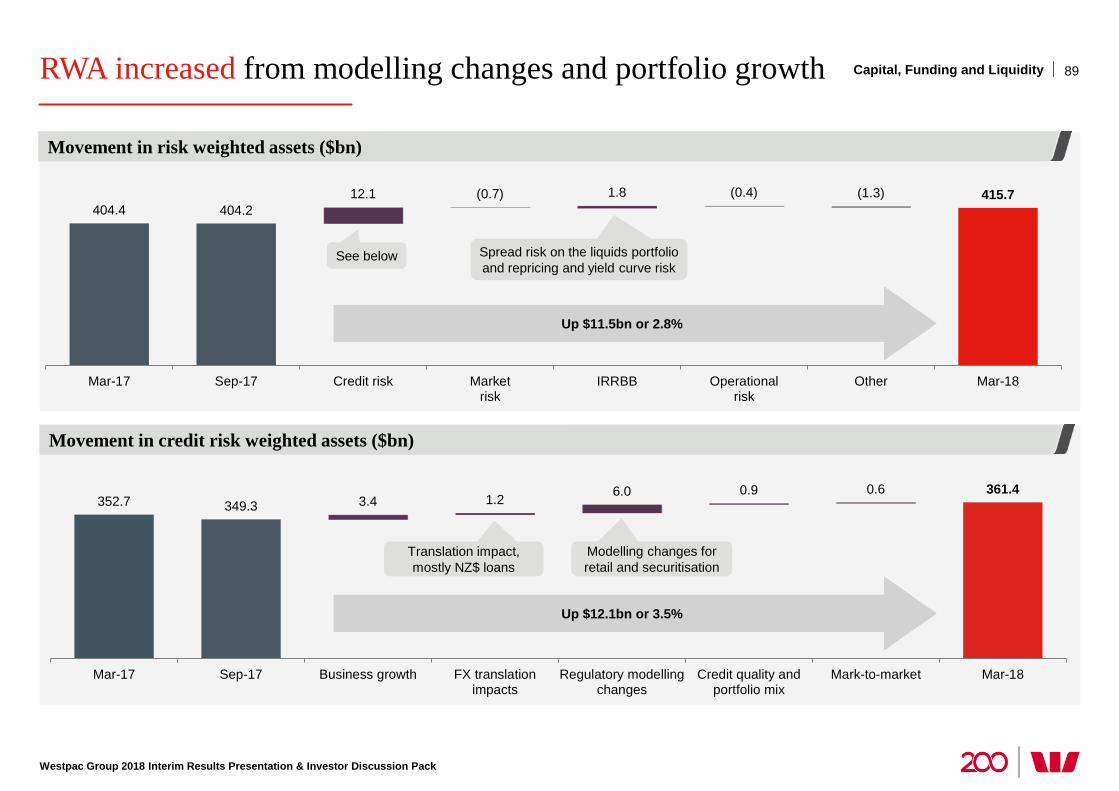
RWA increased from modelling changes and portfolio growth
Westpac Group 2018 Interim Results Presentation & Investor Discussion Pack
Movement in risk weighted assets ($bn)
Movement in credit risk weighted assets ($bn)
Capital, Funding and Liquidity
404.4 404.2 12.1 1.8 415.7 (0.7) (0.4) (1.3)
Mar-17 Sep-17 Credit risk Marketrisk
IRRBB Operationalrisk
Other Mar-18
Up $11.5bn or 2.8%
Spread risk on the liquids portfolio and repricing and yield curve risk
352.7 349.3 3.4 1.2 6.0 0.9 0.6 361.4
Mar-17 Sep-17 Business growth FX translationimpacts
Regulatory modellingchanges
Credit quality andportfolio mix
Mark-to-market Mar-18
Up $12.1bn or 3.5%
Modelling changes for retail and securitisation
See below
89
Translation impact, mostly NZ$ loans
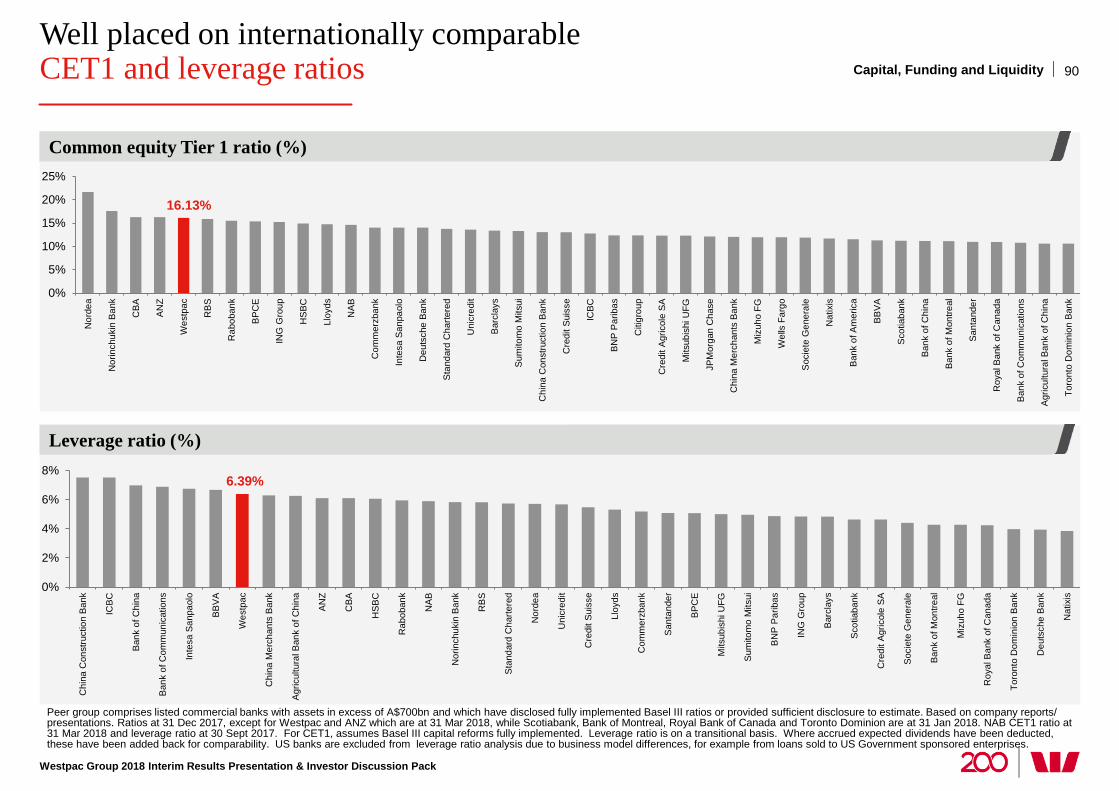
Well placed on internationally comparable CET1 and leverage ratios
Westpac Group 2018 Interim Results Presentation & Investor Discussion Pack
Peer group comprises listed commercial banks with assets in excess of A$700bn and which have disclosed fully implemented Basel III ratios or provided sufficient disclosure to estimate. Based on company reports/ presentations. Ratios at 31 Dec 2017, except for Westpac and ANZ which are at 31 Mar 2018, while Scotiabank, Bank of Montreal, Royal Bank of Canada and Toronto Dominion are at 31 Jan 2018. NAB CET1 ratio at 31 Mar 2018 and leverage ratio at 30 Sept 2017. For CET1, assumes Basel III capital reforms fully implemented. Leverage ratio is on a transitional basis. Where accrued expected dividends have been deducted, these have been added back for comparability. US banks are excluded from leverage ratio analysis due to business model differences, for example from loans sold to US Government sponsored enterprises.
Common equity Tier 1 ratio (%)
Leverage ratio (%)
16.13%
0%
5%
10%
15%
20%
25%
Nor
dea
Nor
inch
ukin
Ban
k
CB
A
AN
Z
Wes
tpac
RB
S
Rab
oban
k
BP
CE
ING
Gro
up
HS
BC
Lloy
ds
NA
B
Com
mer
zban
k
Inte
sa S
anpa
olo
Deu
tsch
e B
ank
Sta
ndar
d C
harte
red
Uni
cred
it
Bar
clay
s
Sum
itom
o M
itsui
Chi
na C
onst
ruct
ion
Ban
k
Cre
dit S
uiss
e
ICB
C
BN
P P
arib
as
Citi
grou
p
Cre
dit A
gric
ole
SA
Mits
ubis
hi U
FG
JPM
orga
n C
hase
Chi
na M
erch
ants
Ban
k
Miz
uho
FG
Wel
ls F
argo
Soc
iete
Gen
eral
e
Nat
ixis
Ban
k of
Am
eric
a
BB
VA
Sco
tiaba
nk
Ban
k of
Chi
na
Ban
k of
Mon
treal
San
tand
er
Roy
al B
ank
of C
anad
a
Ban
k of
Com
mun
icat
ions
Agr
icul
tura
l Ban
k of
Chi
na
Toro
nto
Dom
inio
n B
ank
6.39%
0%
2%
4%
6%
8%
Chi
na C
onst
ruct
ion
Ban
k
ICB
C
Ban
k of
Chi
na
Ban
k of
Com
mun
icat
ions
Inte
sa S
anpa
olo
BB
VA
Wes
tpac
Chi
na M
erch
ants
Ban
k
Agr
icul
tura
l Ban
k of
Chi
na
AN
Z
CB
A
HS
BC
Rab
oban
k
NA
B
Nor
inch
ukin
Ban
k
RB
S
Sta
ndar
d C
harte
red
Nor
dea
Uni
cred
it
Cre
dit S
uiss
e
Lloy
ds
Com
mer
zban
k
San
tand
er
BP
CE
Mits
ubis
hi U
FG
Sum
itom
o M
itsui
BN
P P
arib
as
ING
Gro
up
Bar
clay
s
Sco
tiaba
nk
Cre
dit A
gric
ole
SA
Soc
iete
Gen
eral
e
Ban
k of
Mon
treal
Miz
uho
FG
Roy
al B
ank
of C
anad
a
Toro
nto
Dom
inio
n B
ank
Deu
tsch
e B
ank
Nat
ixis
Capital, Funding and Liquidity 90
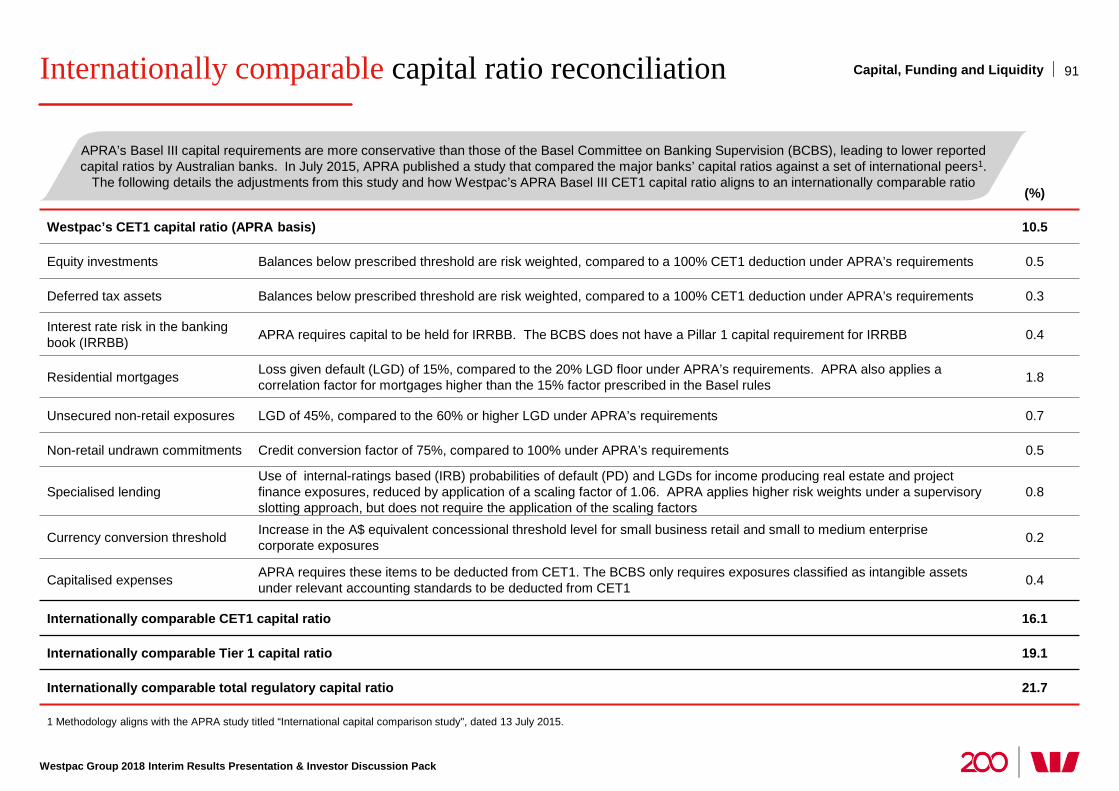
Internationally comparable capital ratio reconciliation
1 Methodology aligns with the APRA study titled “International capital comparison study", dated 13 July 2015.
Capital, Funding and Liquidity
(%)
Westpac’s CET1 capital ratio (APRA basis) 10.5
Equity investments Balances below prescribed threshold are risk weighted, compared to a 100% CET1 deduction under APRA’s requirements 0.5
Deferred tax assets Balances below prescribed threshold are risk weighted, compared to a 100% CET1 deduction under APRA’s requirements 0.3
Interest rate risk in the banking book (IRRBB) APRA requires capital to be held for IRRBB. The BCBS does not have a Pillar 1 capital requirement for IRRBB 0.4
Residential mortgages Loss given default (LGD) of 15%, compared to the 20% LGD floor under APRA’s requirements. APRA also applies a correlation factor for mortgages higher than the 15% factor prescribed in the Basel rules 1.8
Unsecured non-retail exposures LGD of 45%, compared to the 60% or higher LGD under APRA’s requirements 0.7
Non-retail undrawn commitments Credit conversion factor of 75%, compared to 100% under APRA’s requirements 0.5
Specialised lending Use of internal-ratings based (IRB) probabilities of default (PD) and LGDs for income producing real estate and project finance exposures, reduced by application of a scaling factor of 1.06. APRA applies higher risk weights under a supervisory slotting approach, but does not require the application of the scaling factors
0.8
Currency conversion threshold Increase in the A$ equivalent concessional threshold level for small business retail and small to medium enterprise corporate exposures 0.2
Capitalised expenses APRA requires these items to be deducted from CET1. The BCBS only requires exposures classified as intangible assets under relevant accounting standards to be deducted from CET1 0.4
Internationally comparable CET1 capital ratio 16.1
Internationally comparable Tier 1 capital ratio 19.1
Internationally comparable total regulatory capital ratio 21.7
APRA’s Basel III capital requirements are more conservative than those of the Basel Committee on Banking Supervision (BCBS), leading to lower reported capital ratios by Australian banks. In July 2015, APRA published a study that compared the major banks’ capital ratios against a set of international peers1.
The following details the adjustments from this study and how Westpac’s APRA Basel III CET1 capital ratio aligns to an internationally comparable ratio
Westpac Group 2018 Interim Results Presentation & Investor Discussion Pack
91
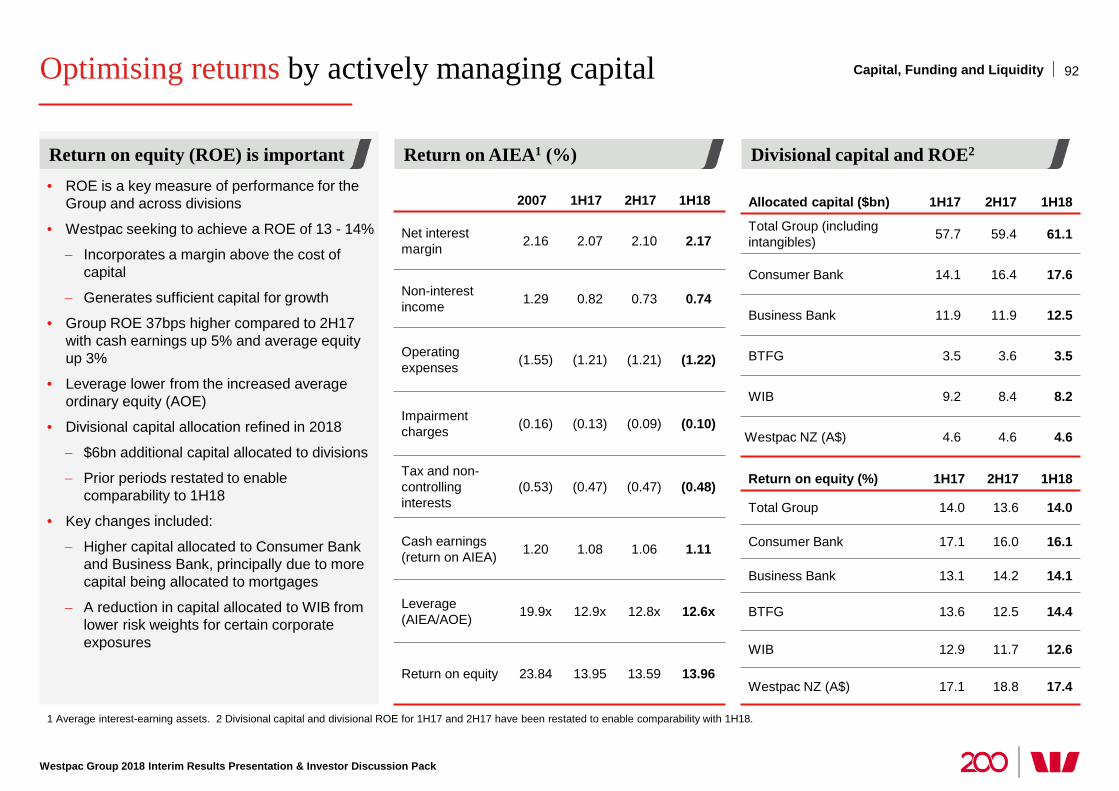
Optimising returns by actively managing capital
Westpac Group 2018 Interim Results Presentation & Investor Discussion Pack
1 Average interest-earning assets. 2 Divisional capital and divisional ROE for 1H17 and 2H17 have been restated to enable comparability with 1H18.
• ROE is a key measure of performance for the Group and across divisions
• Westpac seeking to achieve a ROE of 13 - 14%
− Incorporates a margin above the cost of capital
− Generates sufficient capital for growth
• Group ROE 37bps higher compared to 2H17 with cash earnings up 5% and average equity up 3%
• Leverage lower from the increased average ordinary equity (AOE)
• Divisional capital allocation refined in 2018
− $6bn additional capital allocated to divisions
− Prior periods restated to enable comparability to 1H18
• Key changes included:
− Higher capital allocated to Consumer Bank and Business Bank, principally due to more capital being allocated to mortgages
− A reduction in capital allocated to WIB from lower risk weights for certain corporate exposures
Return on equity (ROE) is important Return on AIEA1 (%) Divisional capital and ROE2
Capital, Funding and Liquidity 92
Allocated capital ($bn) 1H17 2H17 1H18
Total Group (including intangibles) 57.7 59.4 61.1
Consumer Bank 14.1 16.4 17.6
Business Bank 11.9 11.9 12.5
BTFG 3.5 3.6 3.5
WIB 9.2 8.4 8.2
Westpac NZ (A$) 4.6 4.6 4.6
Return on equity (%) 1H17 2H17 1H18
Total Group 14.0 13.6 14.0
Consumer Bank 17.1 16.0 16.1
Business Bank 13.1 14.2 14.1
BTFG 13.6 12.5 14.4
WIB 12.9 11.7 12.6
Westpac NZ (A$) 17.1 18.8 17.4
2007 1H17 2H17 1H18
Net interest margin 2.16 2.07 2.10 2.17
Non-interest income 1.29 0.82 0.73 0.74
Operating expenses (1.55) (1.21) (1.21) (1.22)
Impairment charges (0.16) (0.13) (0.09) (0.10)
Tax and non-controlling interests
(0.53) (0.47) (0.47) (0.48)
Cash earnings (return on AIEA) 1.20 1.08 1.06 1.11
Leverage (AIEA/AOE) 19.9x 12.9x 12.8x 12.6x
Return on equity 23.84 13.95 13.59 13.96
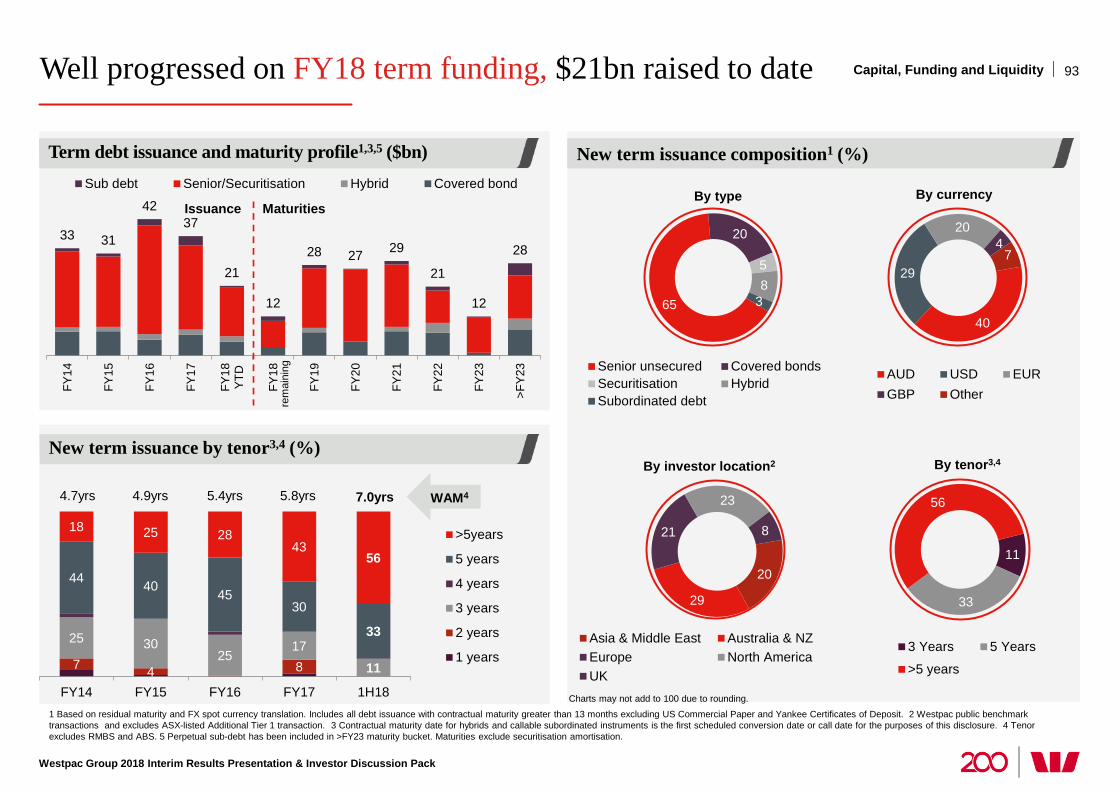
Well progressed on FY18 term funding, $21bn raised to date
1 Based on residual maturity and FX spot currency translation. Includes all debt issuance with contractual maturity greater than 13 months excluding US Commercial Paper and Yankee Certificates of Deposit. 2 Westpac public benchmark transactions and excludes ASX-listed Additional Tier 1 transaction. 3 Contractual maturity date for hybrids and callable subordinated instruments is the first scheduled conversion date or call date for the purposes of this disclosure. 4 Tenor excludes RMBS and ABS. 5 Perpetual sub-debt has been included in >FY23 maturity bucket. Maturities exclude securitisation amortisation.
65
20
5 8
3
By type
Senior unsecured Covered bondsSecuritisation HybridSubordinated debt
20
29
21
23
8
By investor location2
Asia & Middle East Australia & NZEurope North AmericaUK
40
29
20 4
7
By currency
AUD USD EURGBP Other
33 31
42 37
21
12
28 27 29
21
12
28
FY14
FY15
FY16
FY17
FY18
YTD
FY18
FY19
FY20
FY21
FY22
FY23
>FY
23
Sub debt Senior/Securitisation Hybrid Covered bond
Issuance Maturities
Charts may not add to 100 due to rounding.
rem
aini
ng
New term issuance composition1 (%) Term debt issuance and maturity profile1,3,5 ($bn)
93
Westpac Group 2018 Interim Results Presentation & Investor Discussion Pack
11
33
56
By tenor3,4
3 Years 5 Years
>5 years7 4 8
25 30 25
17 11
44 40 45 30
33
18 25 28 43
56
FY14 FY15 FY16 FY17 1H18
>5years
5 years
4 years
3 years
2 years
1 years
4.7yrs 4.9yrs 5.4yrs 5.8yrs
New term issuance by tenor3,4 (%)
7.0yrs WAM4
Capital, Funding and Liquidity
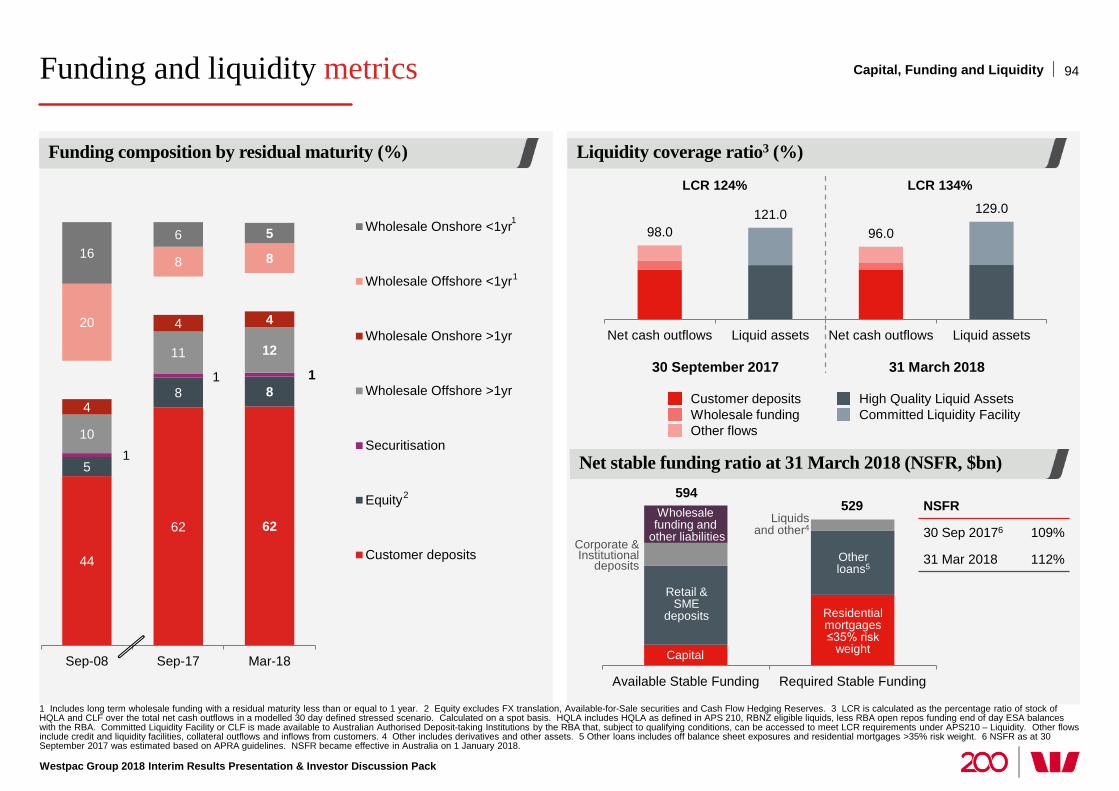
Westpac Group 2018 Interim Results Presentation & Investor Discussion Pack
Funding and liquidity metrics
1 Includes long term wholesale funding with a residual maturity less than or equal to 1 year. 2 Equity excludes FX translation, Available-for-Sale securities and Cash Flow Hedging Reserves. 3 LCR is calculated as the percentage ratio of stock of HQLA and CLF over the total net cash outflows in a modelled 30 day defined stressed scenario. Calculated on a spot basis. HQLA includes HQLA as defined in APS 210, RBNZ eligible liquids, less RBA open repos funding end of day ESA balances with the RBA. Committed Liquidity Facility or CLF is made available to Australian Authorised Deposit-taking Institutions by the RBA that, subject to qualifying conditions, can be accessed to meet LCR requirements under APS210 – Liquidity. Other flows include credit and liquidity facilities, collateral outflows and inflows from customers. 4 Other includes derivatives and other assets. 5 Other loans includes off balance sheet exposures and residential mortgages >35% risk weight. 6 NSFR as at 30 September 2017 was estimated based on APRA guidelines. NSFR became effective in Australia on 1 January 2018.
94
Funding composition by residual maturity (%)
44
62 62
5
8 8
1
1 1
10
11 12
4
4 4 20
8 8 16 6 5
Sep-08 Sep-17 Mar-18
Wholesale Onshore <1yr
Wholesale Offshore <1yr
Wholesale Onshore >1yr
Wholesale Offshore >1yr
Securitisation
Equity
Customer deposits
Net stable funding ratio at 31 March 2018 (NSFR, $bn)
Available Stable Funding Required Stable Funding
594 529
Capital
Retail & SME
deposits
Corporate & Institutional
deposits
Wholesale funding and
other liabilities
Residential mortgages ≤35% risk
weight
Other loans5
Liquids and other4
Liquidity coverage ratio3 (%)
98.0 121.0
96.0
129.0
Net cash outflows Liquid assets Net cash outflows Liquid assets
LCR 124% LCR 134%
30 September 2017 31 March 2018
Customer deposits High Quality Liquid Assets Wholesale funding Committed Liquidity Facility Other flows
NSFR
30 Sep 20176 109%
31 Mar 2018 112%
2
1
1
Capital, Funding and Liquidity
Divisional Results
In the divisional results, prior periods financial results have been restated to ensure they are reported on the same basis as 1H18
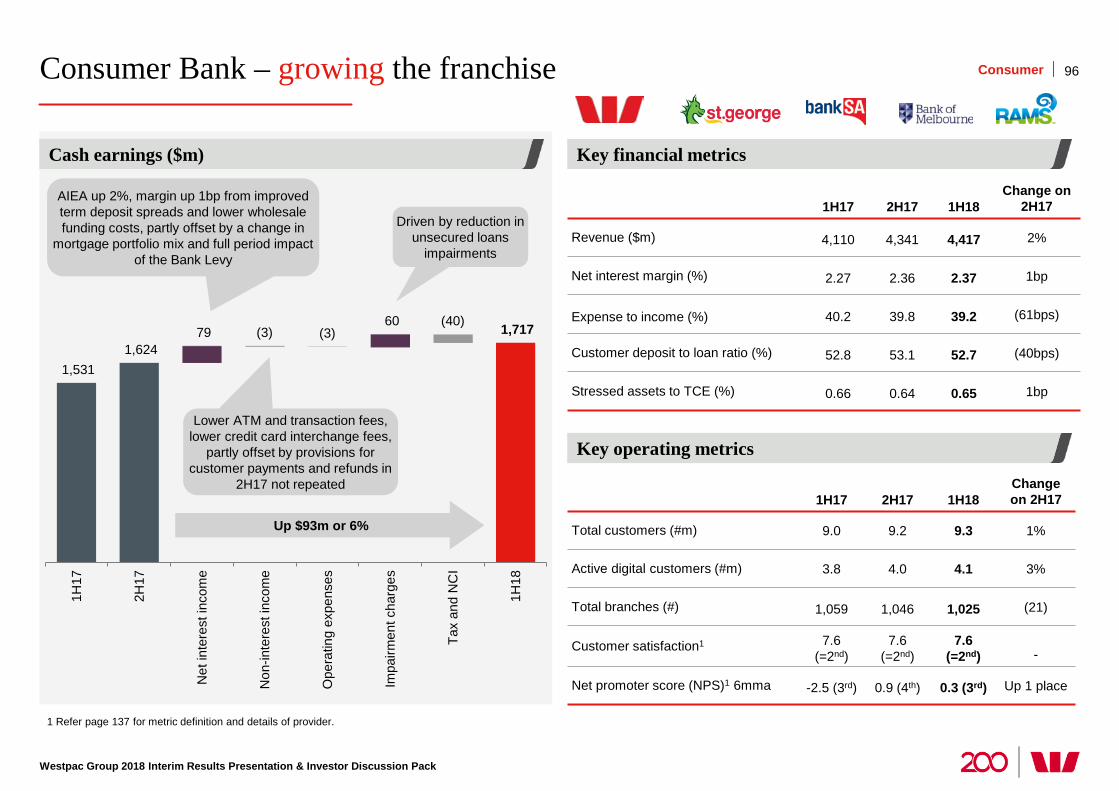
Consumer Bank – growing the franchise
Westpac Group 2018 Interim Results Presentation & Investor Discussion Pack
1 Refer page 137 for metric definition and details of provider.
1,531 1,624
79 60 1,717 (3) (3)
(40)
1H17
2H17
Net
inte
rest
inco
me
Non
-inte
rest
inco
me
Ope
ratin
g ex
pens
es
Impa
irmen
t cha
rges
Tax
and
NC
I
1H18
1H17 2H17 1H18 Change on
2H17
Revenue ($m) 4,110 4,341 4,417 2%
Net interest margin (%) 2.27 2.36 2.37 1bp
Expense to income (%) 40.2 39.8 39.2 (61bps)
Customer deposit to loan ratio (%) 52.8 53.1 52.7 (40bps)
Stressed assets to TCE (%) 0.66 0.64 0.65 1bp
1H17 2H17 1H18 Change on 2H17
Total customers (#m) 9.0 9.2 9.3 1%
Active digital customers (#m) 3.8 4.0 4.1 3%
Total branches (#) 1,059 1,046 1,025 (21)
Customer satisfaction1 7.6 (=2nd)
7.6 (=2nd)
7.6 (=2nd)
-
Net promoter score (NPS)1 6mma -2.5 (3rd) 0.9 (4th) 0.3 (3rd) Up 1 place
Key operating metrics
Key financial metrics Cash earnings ($m)
96 Consumer
AIEA up 2%, margin up 1bp from improved term deposit spreads and lower wholesale funding costs, partly offset by a change in
mortgage portfolio mix and full period impact of the Bank Levy
Lower ATM and transaction fees, lower credit card interchange fees,
partly offset by provisions for customer payments and refunds in
2H17 not repeated
Up $93m or 6%
Driven by reduction in unsecured loans
impairments
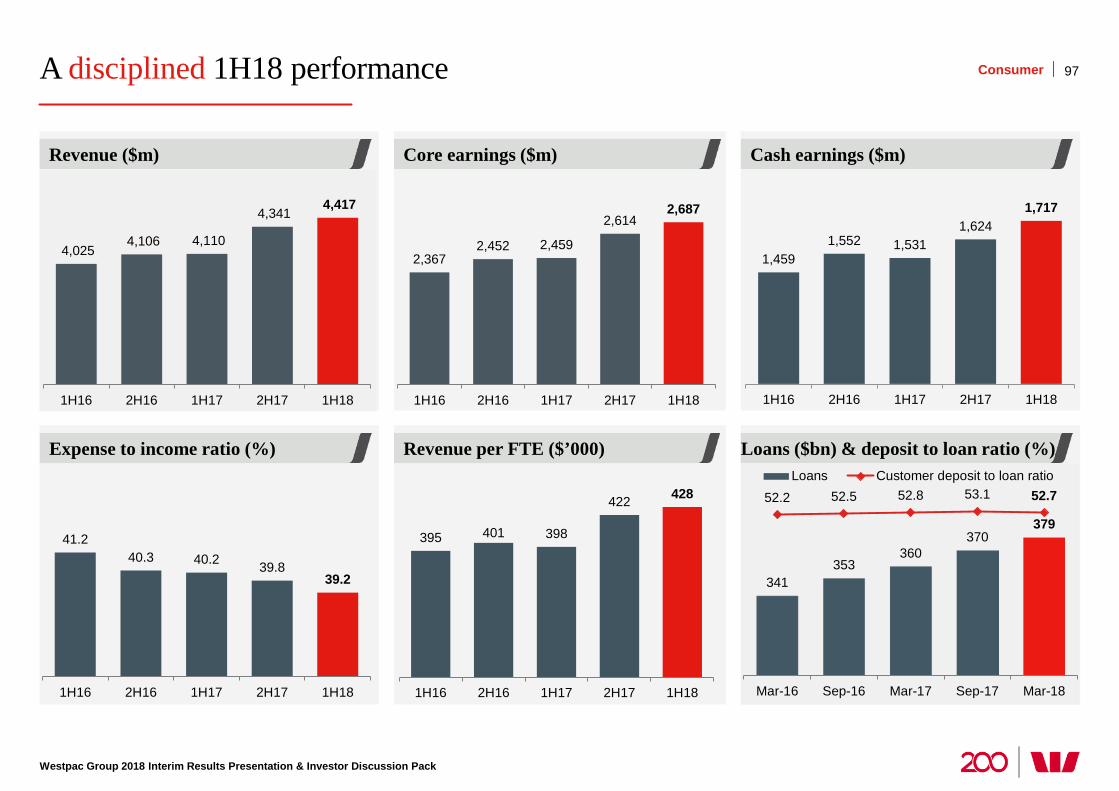
A disciplined 1H18 performance
Westpac Group 2018 Interim Results Presentation & Investor Discussion Pack
Revenue per FTE ($’000) Loans ($bn) & deposit to loan ratio (%) Expense to income ratio (%)
Core earnings ($m) Cash earnings ($m) Revenue ($m)
97 Consumer
4,025 4,106 4,110
4,341 4,417
1H16 2H16 1H17 2H17 1H18
2,367 2,452 2,459
2,614 2,687
1H16 2H16 1H17 2H17 1H18
1,459 1,552 1,531
1,624 1,717
1H16 2H16 1H17 2H17 1H18
41.2 40.3 40.2 39.8
39.2
1H16 2H16 1H17 2H17 1H18
395 401 398
422 428
1H16 2H16 1H17 2H17 1H18
341 353
360 370
379
52.2 52.5 52.8 53.1 52.7
Mar-16 Sep-16 Mar-17 Sep-17 Mar-18
Loans Customer deposit to loan ratio
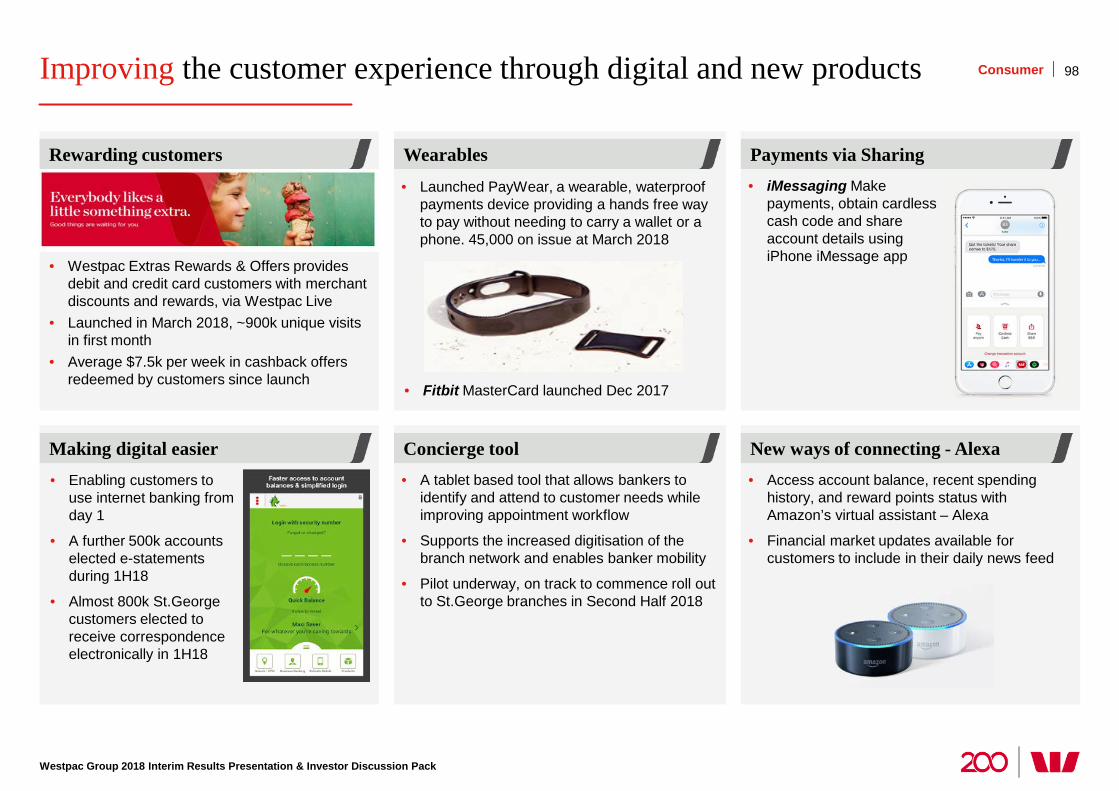
Improving the customer experience through digital and new products
Westpac Group 2018 Interim Results Presentation & Investor Discussion Pack
98 Consumer
Concierge tool New ways of connecting - Alexa Making digital easier
Wearables Payments via Sharing Rewarding customers
• A tablet based tool that allows bankers to identify and attend to customer needs while improving appointment workflow
• Supports the increased digitisation of the branch network and enables banker mobility
• Pilot underway, on track to commence roll out to St.George branches in Second Half 2018
• Access account balance, recent spending history, and reward points status with Amazon’s virtual assistant – Alexa
• Financial market updates available for customers to include in their daily news feed
• Launched PayWear, a wearable, waterproof payments device providing a hands free way to pay without needing to carry a wallet or a phone. 45,000 on issue at March 2018
• Fitbit MasterCard launched Dec 2017
• iMessaging Make payments, obtain cardless cash code and share account details using iPhone iMessage app
• Enabling customers to use internet banking from day 1
• A further 500k accounts elected e-statements during 1H18
• Almost 800k St.George customers elected to receive correspondence electronically in 1H18
• Westpac Extras Rewards & Offers provides debit and credit card customers with merchant discounts and rewards, via Westpac Live
• Launched in March 2018, ~900k unique visits in first month
• Average $7.5k per week in cashback offers redeemed by customers since launch
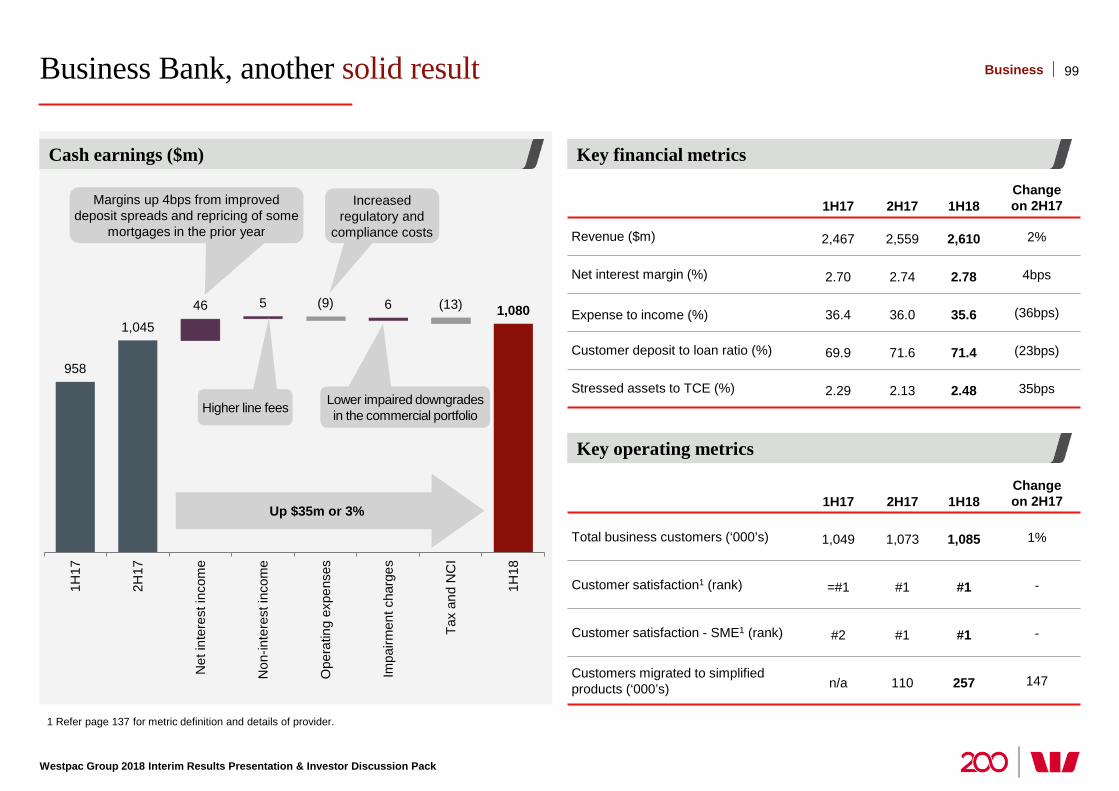
Business Bank, another solid result
Westpac Group 2018 Interim Results Presentation & Investor Discussion Pack
1 Refer page 137 for metric definition and details of provider.
958
1,045 46 5 6 1,080 (9) (13)
1H17
2H17
Net
inte
rest
inco
me
Non
-inte
rest
inco
me
Ope
ratin
g ex
pens
es
Impa
irmen
t cha
rges
Tax
and
NC
I
1H18
1H17 2H17 1H18 Change on 2H17
Revenue ($m) 2,467 2,559 2,610 2%
Net interest margin (%) 2.70 2.74 2.78 4bps
Expense to income (%) 36.4 36.0 35.6 (36bps)
Customer deposit to loan ratio (%) 69.9 71.6 71.4 (23bps)
Stressed assets to TCE (%) 2.29 2.13 2.48 35bps
1H17 2H17 1H18 Change on 2H17
Total business customers (‘000’s) 1,049 1,073 1,085 1%
Customer satisfaction1 (rank) =#1 #1 #1 -
Customer satisfaction - SME1 (rank) #2 #1 #1 -
Customers migrated to simplified products (‘000’s) n/a 110 257 147
Key operating metrics
Key financial metrics Cash earnings ($m)
99 Business
Margins up 4bps from improved deposit spreads and repricing of some
mortgages in the prior year
Higher line fees Lower impaired downgrades in the commercial portfolio
Increased regulatory and
compliance costs
Up $35m or 3%
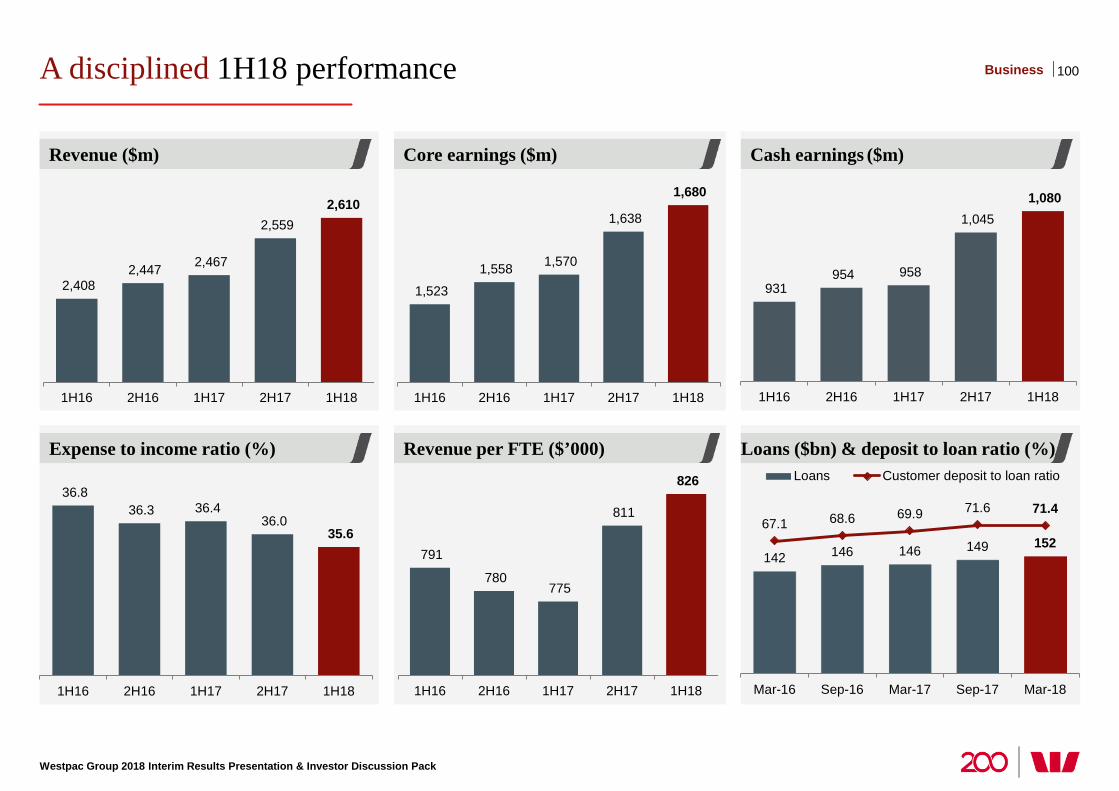
A disciplined 1H18 performance
Westpac Group 2018 Interim Results Presentation & Investor Discussion Pack
Revenue per FTE ($’000) Loans ($bn) & deposit to loan ratio (%) Expense to income ratio (%)
Core earnings ($m) Cash earnings ($m) Revenue ($m)
100 Business
2,408 2,447 2,467
2,559 2,610
1H16 2H16 1H17 2H17 1H18
1,523
1,558 1,570
1,638
1,680
1H16 2H16 1H17 2H17 1H18
931 954 958
1,045 1,080
1H16 2H16 1H17 2H17 1H18
36.8 36.3 36.4
36.0 35.6
1H16 2H16 1H17 2H17 1H18
791
780 775
811
826
1H16 2H16 1H17 2H17 1H18
142 146 146 149 152 67.1 68.6 69.9 71.6 71.4
Mar-16 Sep-16 Mar-17 Sep-17 Mar-18
Loans Customer deposit to loan ratio
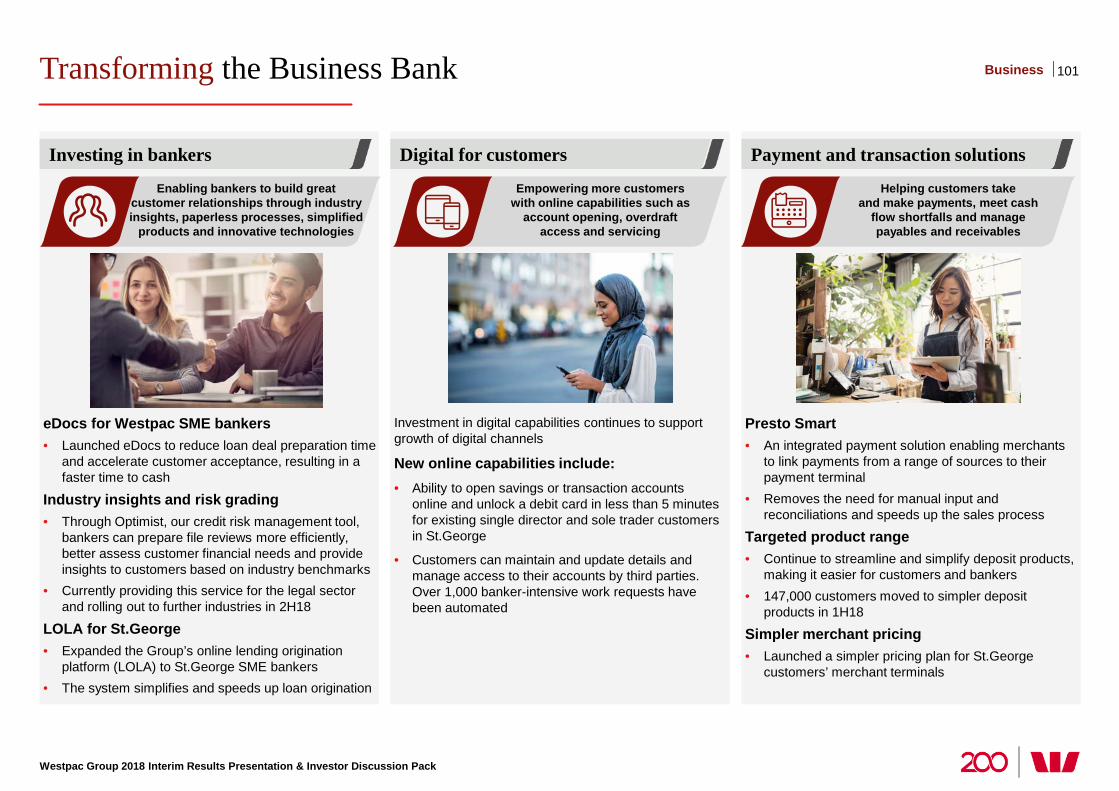
Transforming the Business Bank
Westpac Group 2018 Interim Results Presentation & Investor Discussion Pack
eDocs for Westpac SME bankers • Launched eDocs to reduce loan deal preparation time
and accelerate customer acceptance, resulting in a faster time to cash
Industry insights and risk grading • Through Optimist, our credit risk management tool,
bankers can prepare file reviews more efficiently, better assess customer financial needs and provide insights to customers based on industry benchmarks
• Currently providing this service for the legal sector and rolling out to further industries in 2H18
LOLA for St.George • Expanded the Group’s online lending origination
platform (LOLA) to St.George SME bankers • The system simplifies and speeds up loan origination
Investing in bankers
101
Investment in digital capabilities continues to support growth of digital channels
New online capabilities include: • Ability to open savings or transaction accounts
online and unlock a debit card in less than 5 minutes for existing single director and sole trader customers in St.George
• Customers can maintain and update details and manage access to their accounts by third parties. Over 1,000 banker-intensive work requests have been automated
Digital for customers
Presto Smart • An integrated payment solution enabling merchants
to link payments from a range of sources to their payment terminal
• Removes the need for manual input and reconciliations and speeds up the sales process
Targeted product range • Continue to streamline and simplify deposit products,
making it easier for customers and bankers • 147,000 customers moved to simpler deposit
products in 1H18
Simpler merchant pricing • Launched a simpler pricing plan for St.George
customers’ merchant terminals
Payment and transaction solutions
Business
Empowering more customers with online capabilities such as
account opening, overdraft access and servicing
Helping customers take and make payments, meet cash
flow shortfalls and manage payables and receivables
Enabling bankers to build great customer relationships through industry insights, paperless processes, simplified
products and innovative technologies
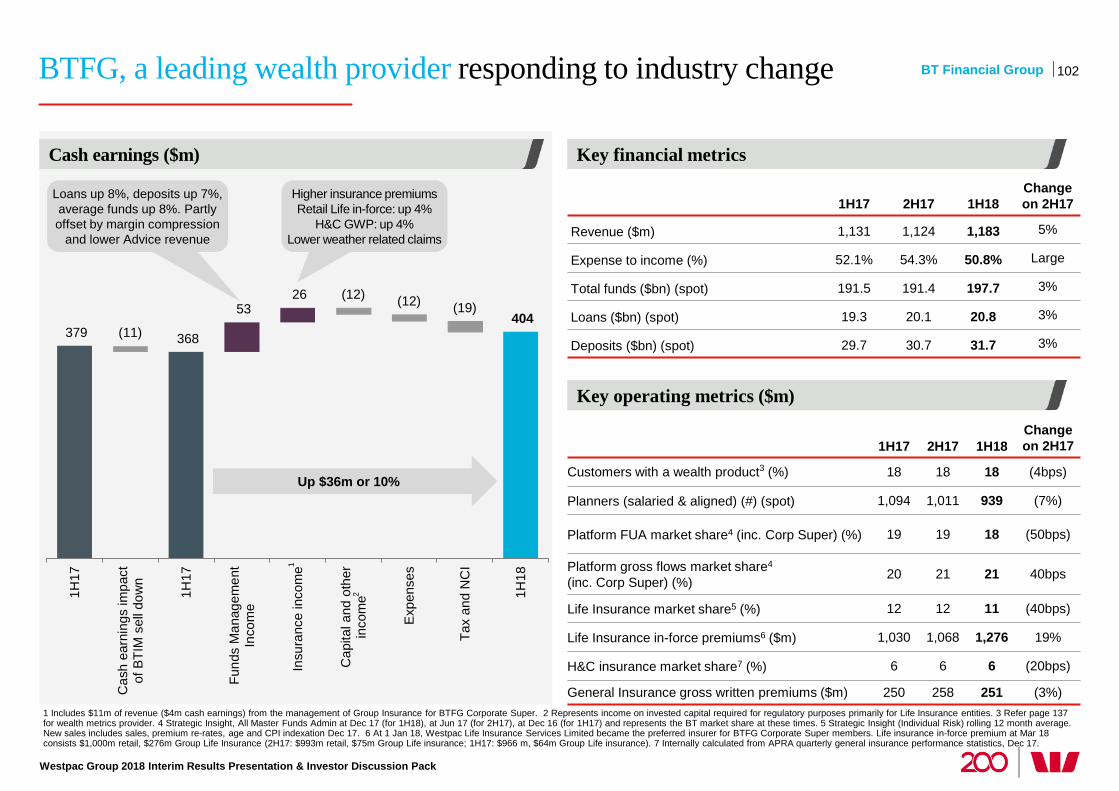
379 368
53 26
404 (11)
(12) (12) (19)
1H17
Cas
h ea
rnin
gs im
pact
of B
TIM
sel
l dow
n
1H17
Fund
s M
anag
emen
tIn
com
e
Insu
ranc
e in
com
e
Cap
ital a
nd o
ther
inco
me
Exp
ense
s
Tax
and
NC
I
1H18
BTFG, a leading wealth provider responding to industry change
Westpac Group 2018 Interim Results Presentation & Investor Discussion Pack
1 Includes $11m of revenue ($4m cash earnings) from the management of Group Insurance for BTFG Corporate Super. 2 Represents income on invested capital required for regulatory purposes primarily for Life Insurance entities. 3 Refer page 137 for wealth metrics provider. 4 Strategic Insight, All Master Funds Admin at Dec 17 (for 1H18), at Jun 17 (for 2H17), at Dec 16 (for 1H17) and represents the BT market share at these times. 5 Strategic Insight (Individual Risk) rolling 12 month average. New sales includes sales, premium re-rates, age and CPI indexation Dec 17. 6 At 1 Jan 18, Westpac Life Insurance Services Limited became the preferred insurer for BTFG Corporate Super members. Life insurance in-force premium at Mar 18 consists $1,000m retail, $276m Group Life Insurance (2H17: $993m retail, $75m Group Life insurance; 1H17: $966 m, $64m Group Life insurance). 7 Internally calculated from APRA quarterly general insurance performance statistics, Dec 17.
1H17 2H17 1H18 Change on 2H17
Revenue ($m) 1,131 1,124 1,183 5%
Expense to income (%) 52.1% 54.3% 50.8% Large
Total funds ($bn) (spot) 191.5 191.4 197.7 3%
Loans ($bn) (spot) 19.3 20.1 20.8 3%
Deposits ($bn) (spot) 29.7 30.7 31.7 3%
1H17 2H17 1H18 Change on 2H17
Customers with a wealth product3 (%) 18 18 18 (4bps)
Planners (salaried & aligned) (#) (spot) 1,094 1,011 939 (7%)
Platform FUA market share4 (inc. Corp Super) (%) 19 19 18 (50bps)
Platform gross flows market share4 (inc. Corp Super) (%) 20 21 21 40bps
Life Insurance market share5 (%) 12 12 11 (40bps)
Life Insurance in-force premiums6 ($m) 1,030 1,068 1,276 19%
H&C insurance market share7 (%) 6 6 6 (20bps)
General Insurance gross written premiums ($m) 250 258 251 (3%)
Key operating metrics ($m)
Key financial metrics Cash earnings ($m)
102 BT Financial Group
2
Up $36m or 10%
Loans up 8%, deposits up 7%, average funds up 8%. Partly offset by margin compression
and lower Advice revenue
Higher insurance premiums Retail Life in-force: up 4%
H&C GWP: up 4% Lower weather related claims
1
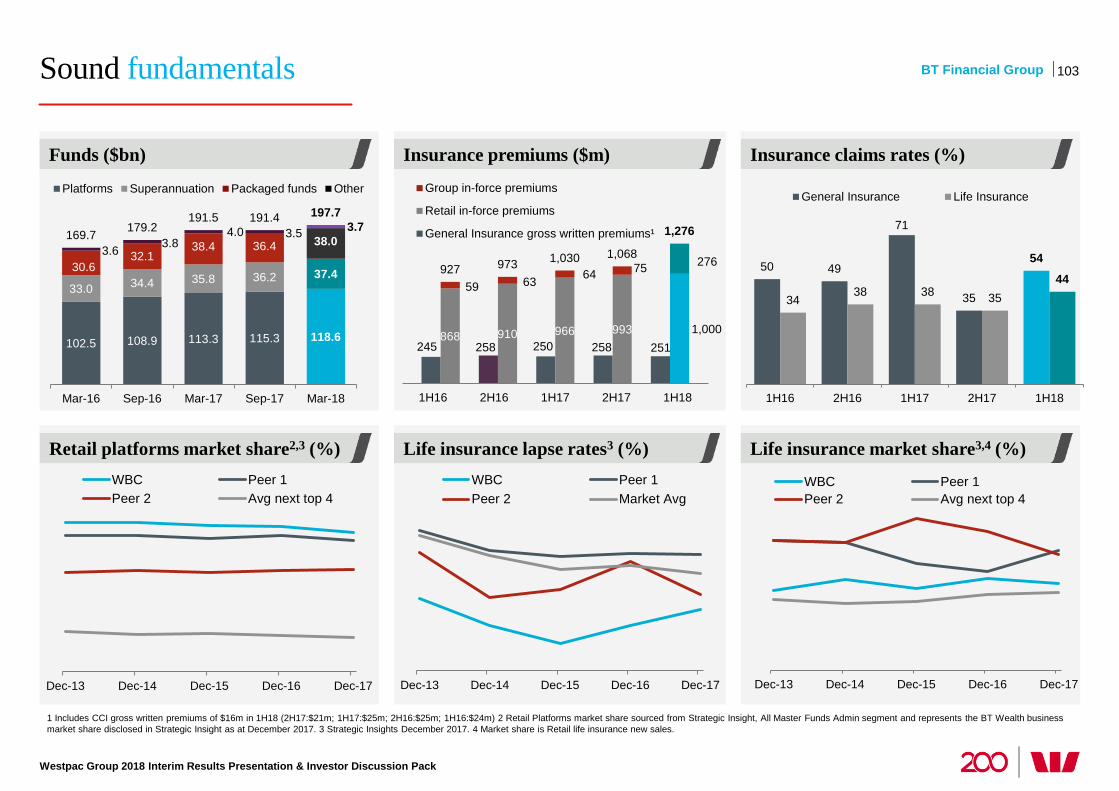
Sound fundamentals
Westpac Group 2018 Interim Results Presentation & Investor Discussion Pack
1 Includes CCI gross written premiums of $16m in 1H18 (2H17:$21m; 1H17:$25m; 2H16:$25m; 1H16:$24m) 2 Retail Platforms market share sourced from Strategic Insight, All Master Funds Admin segment and represents the BT Wealth business market share disclosed in Strategic Insight as at December 2017. 3 Strategic Insights December 2017. 4 Market share is Retail life insurance new sales.
Life insurance lapse rates3 (%) Life insurance market share3,4 (%) Retail platforms market share2,3 (%)
Insurance premiums ($m) Insurance claims rates (%) Funds ($bn)
103 BT Financial Group
245 258 250 258 251 868 910 966 993 1,000
59 63 64 75 276 927 973 1,030 1,068
1,276
1H16 2H16 1H17 2H17 1H18
Group in-force premiums
Retail in-force premiums
General Insurance gross written premiums¹
50 49
71
35
54
34 38 38 35
44
1H16 2H16 1H17 2H17 1H18
General Insurance Life Insurance
Dec-13 Dec-14 Dec-15 Dec-16 Dec-17
WBC Peer 1Peer 2 Avg next top 4
Dec-13 Dec-14 Dec-15 Dec-16 Dec-17
WBC Peer 1Peer 2 Market Avg
Dec-13 Dec-14 Dec-15 Dec-16 Dec-17
WBC Peer 1Peer 2 Avg next top 4
102.5 108.9 113.3 115.3 118.6
33.0 34.4 35.8 36.2 37.4 30.6 32.1
38.4 36.4 38.0 3.6 3.8
4.0 3.5 3.7 169.7 179.2
191.5 191.4 197.7
Mar-16 Sep-16 Mar-17 Sep-17 Mar-18
Platforms Superannuation Packaged funds Other
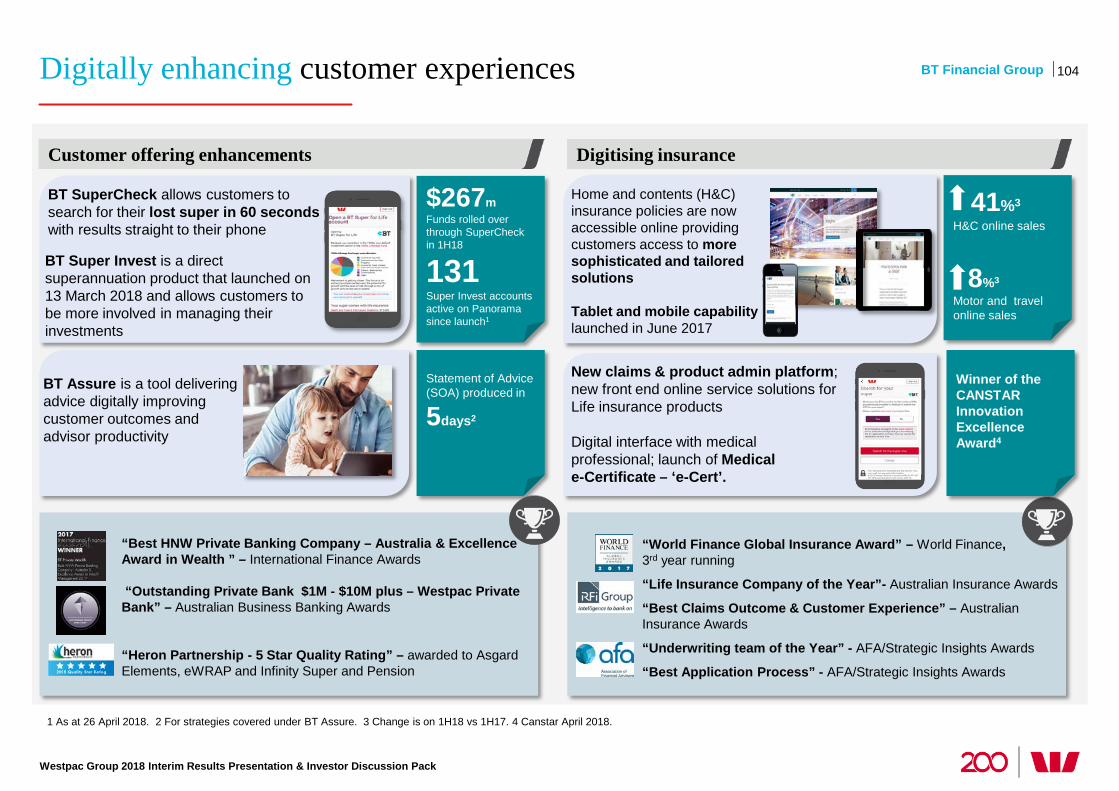
Digitally enhancing customer experiences
Westpac Group 2018 Interim Results Presentation & Investor Discussion Pack
1 As at 26 April 2018. 2 For strategies covered under BT Assure. 3 Change is on 1H18 vs 1H17. 4 Canstar April 2018.
104
Digitising insurance
Home and contents (H&C) insurance policies are now accessible online providing customers access to more sophisticated and tailored solutions Tablet and mobile capability launched in June 2017
41%3 H&C online sales
8%3
Motor and travel online sales
New claims & product admin platform; new front end online service solutions for Life insurance products Digital interface with medical professional; launch of Medical e-Certificate – ‘e-Cert’.
“World Finance Global Insurance Award” – World Finance, 3rd year running
“Life Insurance Company of the Year”- Australian Insurance Awards
“Best Claims Outcome & Customer Experience” – Australian Insurance Awards
“Underwriting team of the Year” - AFA/Strategic Insights Awards
“Best Application Process” - AFA/Strategic Insights Awards
Customer offering enhancements
BT SuperCheck allows customers to search for their lost super in 60 seconds with results straight to their phone
$267m Funds rolled over through SuperCheck in 1H18
131 Super Invest accounts active on Panorama since launch1
Statement of Advice (SOA) produced in
5days2
BT Assure is a tool delivering advice digitally improving customer outcomes and advisor productivity
BT Super Invest is a direct superannuation product that launched on 13 March 2018 and allows customers to be more involved in managing their investments
“Best HNW Private Banking Company – Australia & Excellence Award in Wealth ” – International Finance Awards
“Outstanding Private Bank $1M - $10M plus – Westpac Private Bank” – Australian Business Banking Awards
“Heron Partnership - 5 Star Quality Rating” – awarded to Asgard Elements, eWRAP and Infinity Super and Pension
Winner of the CANSTAR Innovation Excellence Award4
BT Financial Group
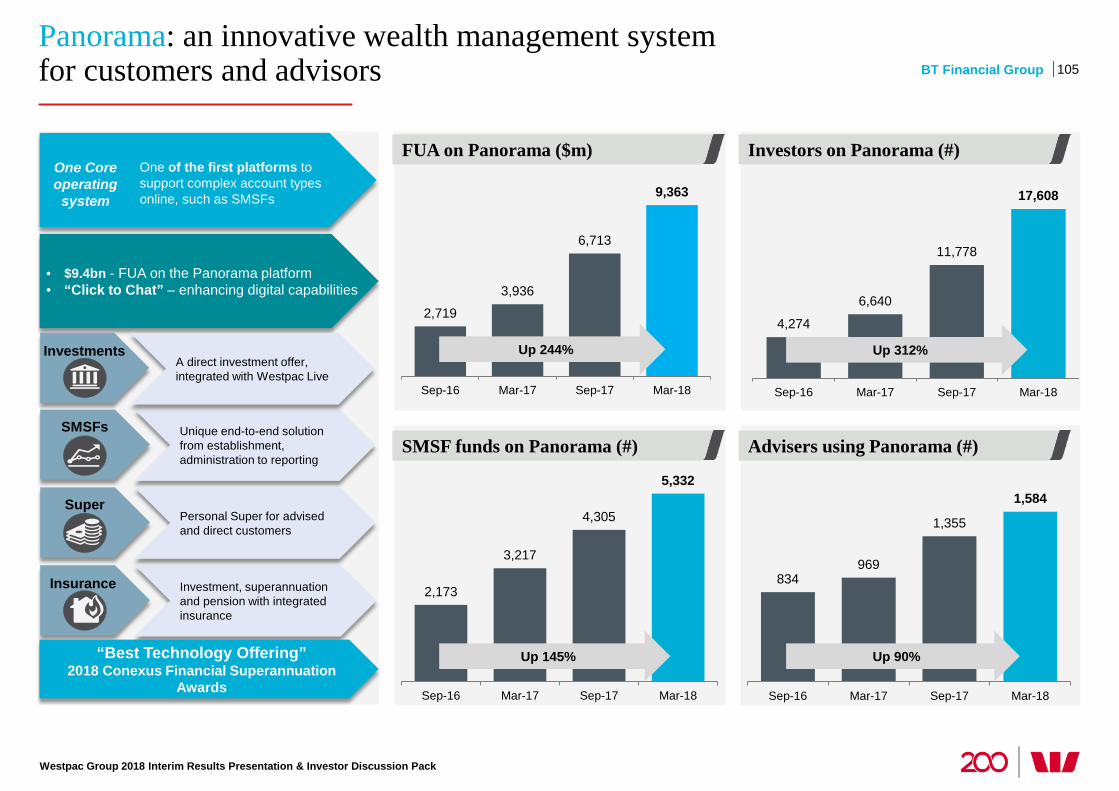
Panorama: an innovative wealth management system for customers and advisors
Westpac Group 2018 Interim Results Presentation & Investor Discussion Pack
Unique end-to-end solution from establishment, administration to reporting
Personal Super for advised and direct customers
Investment, superannuation and pension with integrated insurance
One Core operating
system
One of the first platforms to support complex account types online, such as SMSFs
105 BT Financial Group
4,274
6,640
11,778
17,608
Sep-16 Mar-17 Sep-17 Mar-18
2,719
3,936
6,713
9,363
Sep-16 Mar-17 Sep-17 Mar-18
2,173
3,217
4,305
5,332
Sep-16 Mar-17 Sep-17 Mar-18
834 969
1,355
1,584
Sep-16 Mar-17 Sep-17 Mar-18
Up 244%
Up 90% Up 145%
Up 312%
FUA on Panorama ($m) Investors on Panorama (#)
SMSF funds on Panorama (#) Advisers using Panorama (#)
A direct investment offer, integrated with Westpac Live
“Best Technology Offering” 2018 Conexus Financial Superannuation
Awards
Insurance
Super
SMSFs
Investments
• $9.4bn - FUA on the Panorama platform • “Click to Chat” – enhancing digital capabilities
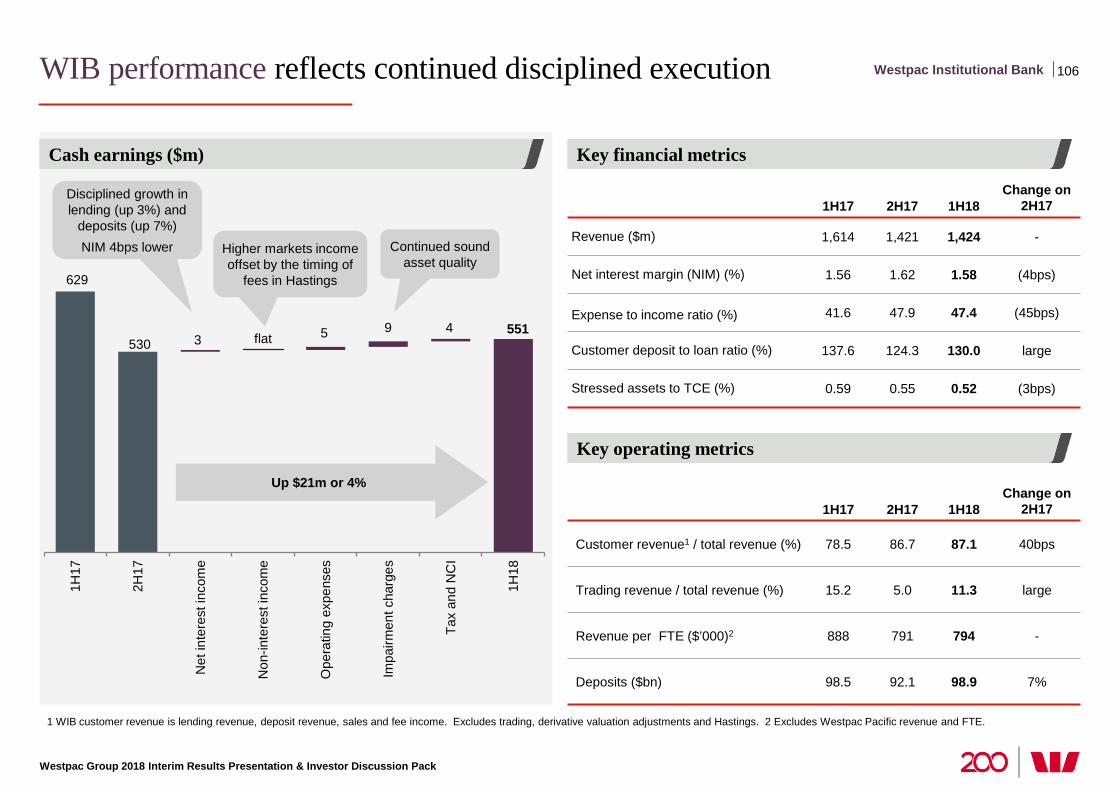
WIB performance reflects continued disciplined execution
Westpac Group 2018 Interim Results Presentation & Investor Discussion Pack
1 WIB customer revenue is lending revenue, deposit revenue, sales and fee income. Excludes trading, derivative valuation adjustments and Hastings. 2 Excludes Westpac Pacific revenue and FTE.
Key operating metrics
Key financial metrics Cash earnings ($m)
106 Westpac Institutional Bank
629
530 551
3 5 9 4 flat
1H17
2H17
Net
inte
rest
inco
me
Non
-inte
rest
inco
me
Ope
ratin
g ex
pens
es
Impa
irmen
t cha
rges
Tax
and
NC
I
1H18
Higher markets income offset by the timing of
fees in Hastings
Disciplined growth in lending (up 3%) and
deposits (up 7%) NIM 4bps lower Continued sound
asset quality
Up $21m or 4%
1H17 2H17 1H18 Change on
2H17
Revenue ($m) 1,614 1,421 1,424 -
Net interest margin (NIM) (%) 1.56 1.62 1.58 (4bps)
Expense to income ratio (%) 41.6 47.9 47.4 (45bps)
Customer deposit to loan ratio (%) 137.6 124.3 130.0 large
Stressed assets to TCE (%) 0.59 0.55 0.52 (3bps)
1H17 2H17 1H18 Change on
2H17
Customer revenue1 / total revenue (%) 78.5 86.7 87.1 40bps
Trading revenue / total revenue (%) 15.2 5.0 11.3 large
Revenue per FTE ($’000)2 888 791 794 -
Deposits ($bn) 98.5 92.1 98.9 7%
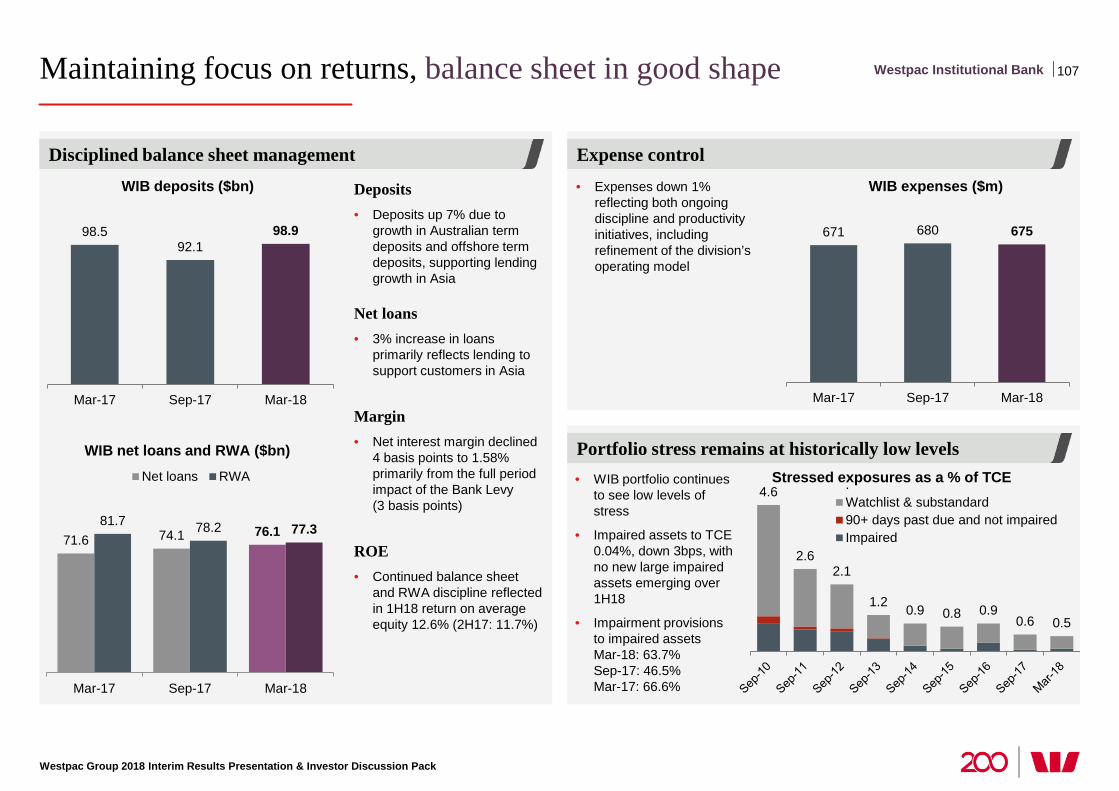
Maintaining focus on returns, balance sheet in good shape
Westpac Group 2018 Interim Results Presentation & Investor Discussion Pack
Deposits • Deposits up 7% due to
growth in Australian term deposits and offshore term deposits, supporting lending growth in Asia
Net loans • 3% increase in loans
primarily reflects lending to support customers in Asia
Margin • Net interest margin declined
4 basis points to 1.58% primarily from the full period impact of the Bank Levy (3 basis points)
ROE • Continued balance sheet
and RWA discipline reflected in 1H18 return on average equity 12.6% (2H17: 11.7%)
• WIB portfolio continues to see low levels of stress
• Impaired assets to TCE 0.04%, down 3bps, with no new large impaired assets emerging over 1H18
• Impairment provisions to impaired assets Mar-18: 63.7% Sep-17: 46.5% Mar-17: 66.6%
Expense control Disciplined balance sheet management
107
4.6
2.6 2.1
1.2 0.9 0.8 0.9 0.6 0.5
.Watchlist & substandard90+ days past due and not impairedImpaired
Westpac Institutional Bank
Stressed exposures as a % of TCE
WIB expenses ($m) • Expenses down 1% reflecting both ongoing discipline and productivity initiatives, including refinement of the division’s operating model
71.6 74.1 76.1 81.7 78.2 77.3
Mar-17 Sep-17 Mar-18
Net loans RWA
98.5 92.1
98.9
Mar-17 Sep-17 Mar-18
WIB deposits ($bn)
WIB net loans and RWA ($bn)
671 680 675
Mar-17 Sep-17 Mar-18
Portfolio stress remains at historically low levels
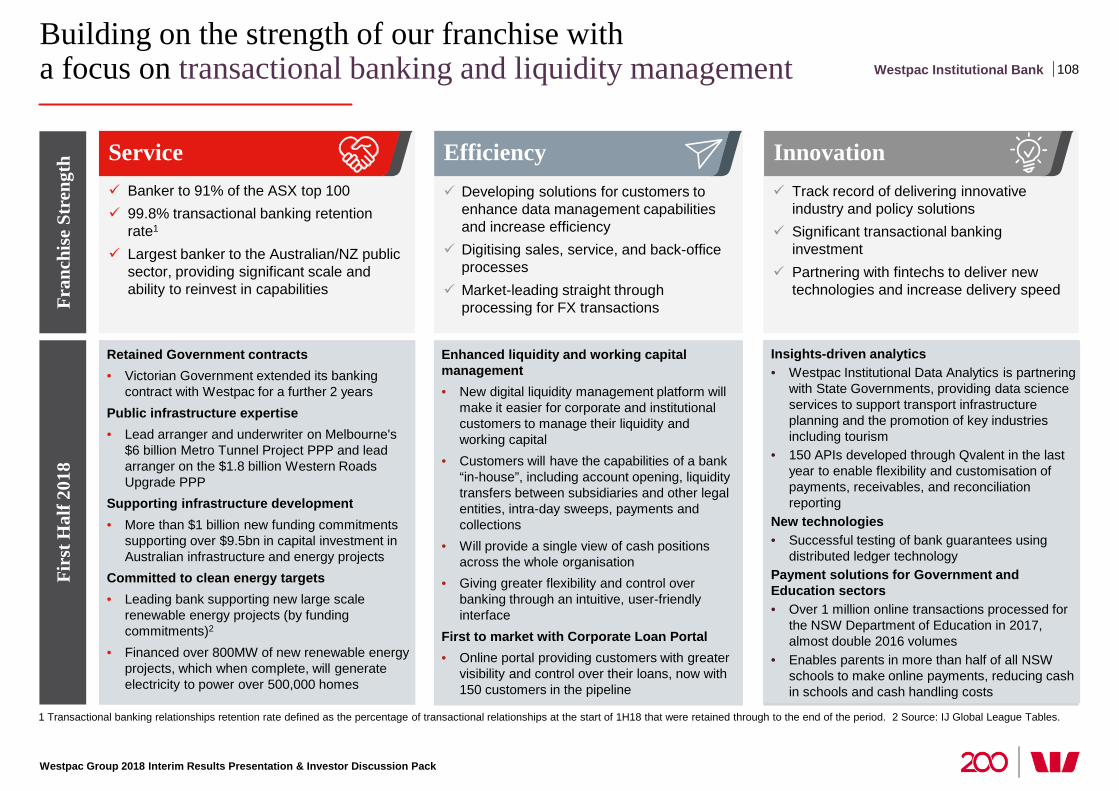
Building on the strength of our franchise with a focus on transactional banking and liquidity management
Westpac Group 2018 Interim Results Presentation & Investor Discussion Pack
108 Westpac Institutional Bank Fi
rst H
alf 2
018
Fran
chis
e St
reng
th
Banker to 91% of the ASX top 100 99.8% transactional banking retention
rate1
Largest banker to the Australian/NZ public sector, providing significant scale and ability to reinvest in capabilities
Retained Government contracts • Victorian Government extended its banking
contract with Westpac for a further 2 years Public infrastructure expertise • Lead arranger and underwriter on Melbourne's
$6 billion Metro Tunnel Project PPP and lead arranger on the $1.8 billion Western Roads Upgrade PPP
Supporting infrastructure development • More than $1 billion new funding commitments
supporting over $9.5bn in capital investment in Australian infrastructure and energy projects
Committed to clean energy targets • Leading bank supporting new large scale
renewable energy projects (by funding commitments)2
• Financed over 800MW of new renewable energy projects, which when complete, will generate electricity to power over 500,000 homes
Developing solutions for customers to enhance data management capabilities and increase efficiency
Digitising sales, service, and back-office processes
Market-leading straight through processing for FX transactions
Track record of delivering innovative industry and policy solutions
Significant transactional banking investment
Partnering with fintechs to deliver new technologies and increase delivery speed
Enhanced liquidity and working capital management • New digital liquidity management platform will
make it easier for corporate and institutional customers to manage their liquidity and working capital
• Customers will have the capabilities of a bank “in-house”, including account opening, liquidity transfers between subsidiaries and other legal entities, intra-day sweeps, payments and collections
• Will provide a single view of cash positions across the whole organisation
• Giving greater flexibility and control over banking through an intuitive, user-friendly interface
First to market with Corporate Loan Portal • Online portal providing customers with greater
visibility and control over their loans, now with 150 customers in the pipeline
Insights-driven analytics • Westpac Institutional Data Analytics is partnering
with State Governments, providing data science services to support transport infrastructure planning and the promotion of key industries including tourism
• 150 APIs developed through Qvalent in the last year to enable flexibility and customisation of payments, receivables, and reconciliation reporting
New technologies • Successful testing of bank guarantees using
distributed ledger technology Payment solutions for Government and Education sectors • Over 1 million online transactions processed for
the NSW Department of Education in 2017, almost double 2016 volumes
• Enables parents in more than half of all NSW schools to make online payments, reducing cash in schools and cash handling costs
1 Transactional banking relationships retention rate defined as the percentage of transactional relationships at the start of 1H18 that were retained through to the end of the period. 2 Source: IJ Global League Tables.
Service Efficiency Innovation
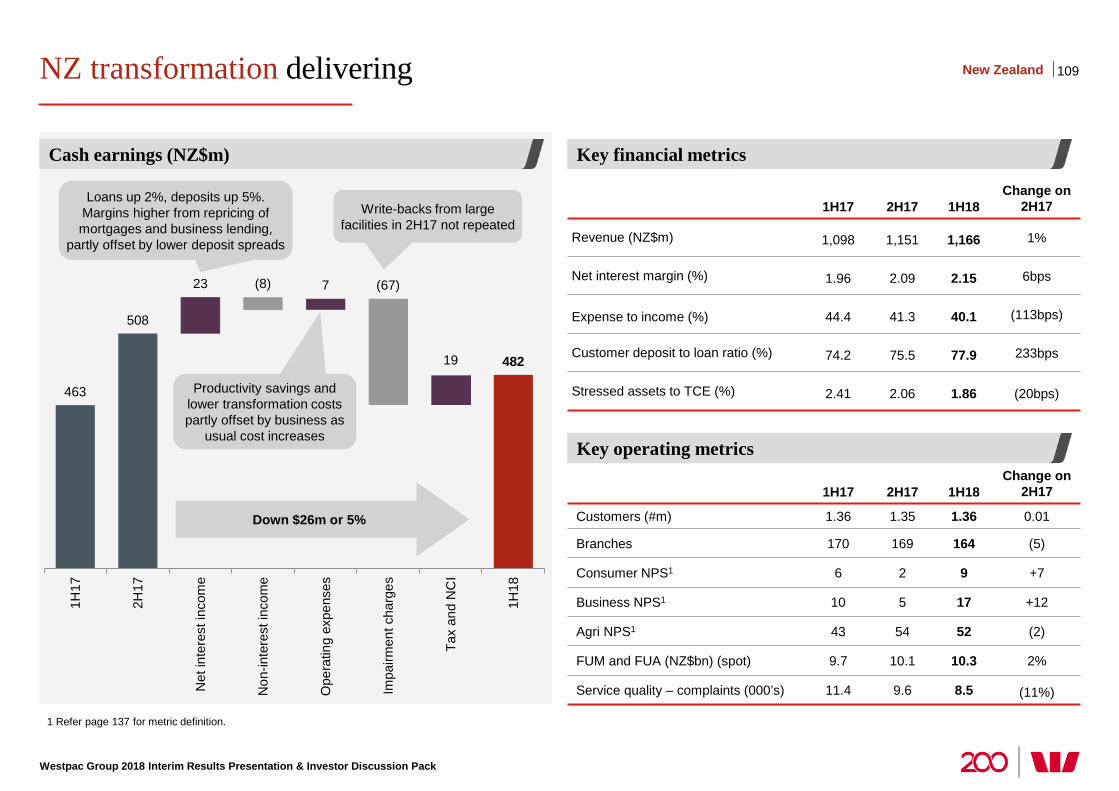
NZ transformation delivering
Westpac Group 2018 Interim Results Presentation & Investor Discussion Pack
1 Refer page 137 for metric definition.
463
508
23 7
19 482
(8) (67)
1H17
2H17
Net
inte
rest
inco
me
Non
-inte
rest
inco
me
Ope
ratin
g ex
pens
es
Impa
irmen
t cha
rges
Tax
and
NC
I
1H18
1H17 2H17 1H18 Change on
2H17
Revenue (NZ$m) 1,098 1,151 1,166 1%
Net interest margin (%) 1.96 2.09 2.15 6bps
Expense to income (%) 44.4 41.3 40.1 (113bps)
Customer deposit to loan ratio (%) 74.2 75.5 77.9 233bps
Stressed assets to TCE (%) 2.41 2.06 1.86 (20bps)
1H17 2H17 1H18 Change on
2H17
Customers (#m) 1.36 1.35 1.36 0.01
Branches 170 169 164 (5)
Consumer NPS1 6 2 9 +7
Business NPS1 10 5 17 +12
Agri NPS1 43 54 52 (2)
FUM and FUA (NZ$bn) (spot) 9.7 10.1 10.3 2%
Service quality – complaints (000’s) 11.4 9.6 8.5 (11%)
Key operating metrics
Key financial metrics Cash earnings (NZ$m)
109 New Zealand
Down $26m or 5%
Loans up 2%, deposits up 5%. Margins higher from repricing of mortgages and business lending,
partly offset by lower deposit spreads
Productivity savings and lower transformation costs partly offset by business as
usual cost increases
Write-backs from large facilities in 2H17 not repeated
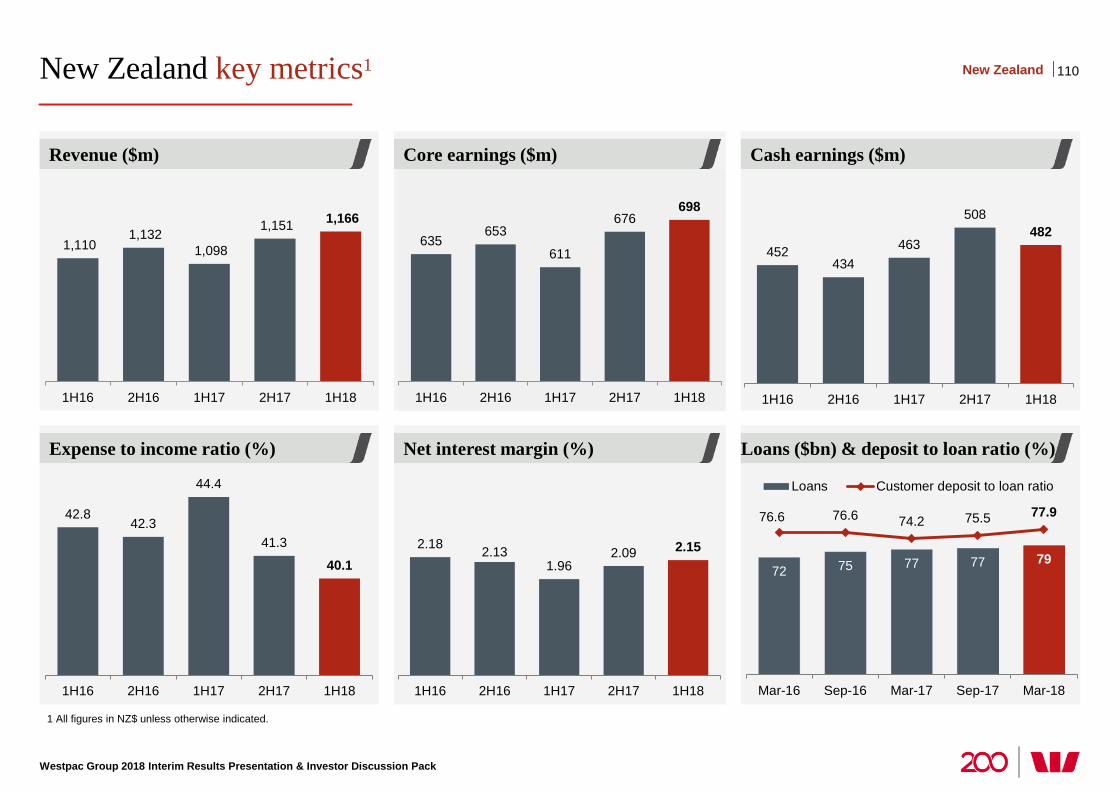
New Zealand key metrics1
Westpac Group 2018 Interim Results Presentation & Investor Discussion Pack
1 All figures in NZ$ unless otherwise indicated.
Net interest margin (%) Loans ($bn) & deposit to loan ratio (%) Expense to income ratio (%)
Core earnings ($m) Cash earnings ($m) Revenue ($m)
110 New Zealand
1,110 1,132
1,098
1,151 1,166
1H16 2H16 1H17 2H17 1H18
635 653
611
676 698
1H16 2H16 1H17 2H17 1H18
452 434
463
508 482
1H16 2H16 1H17 2H17 1H18
42.8 42.3
44.4
41.3
40.1
1H16 2H16 1H17 2H17 1H18
2.18 2.13 1.96
2.09 2.15
1H16 2H16 1H17 2H17 1H18
72 75 77 77 79
76.6 76.6 74.2 75.5 77.9
Mar-16 Sep-16 Mar-17 Sep-17 Mar-18
Loans Customer deposit to loan ratio
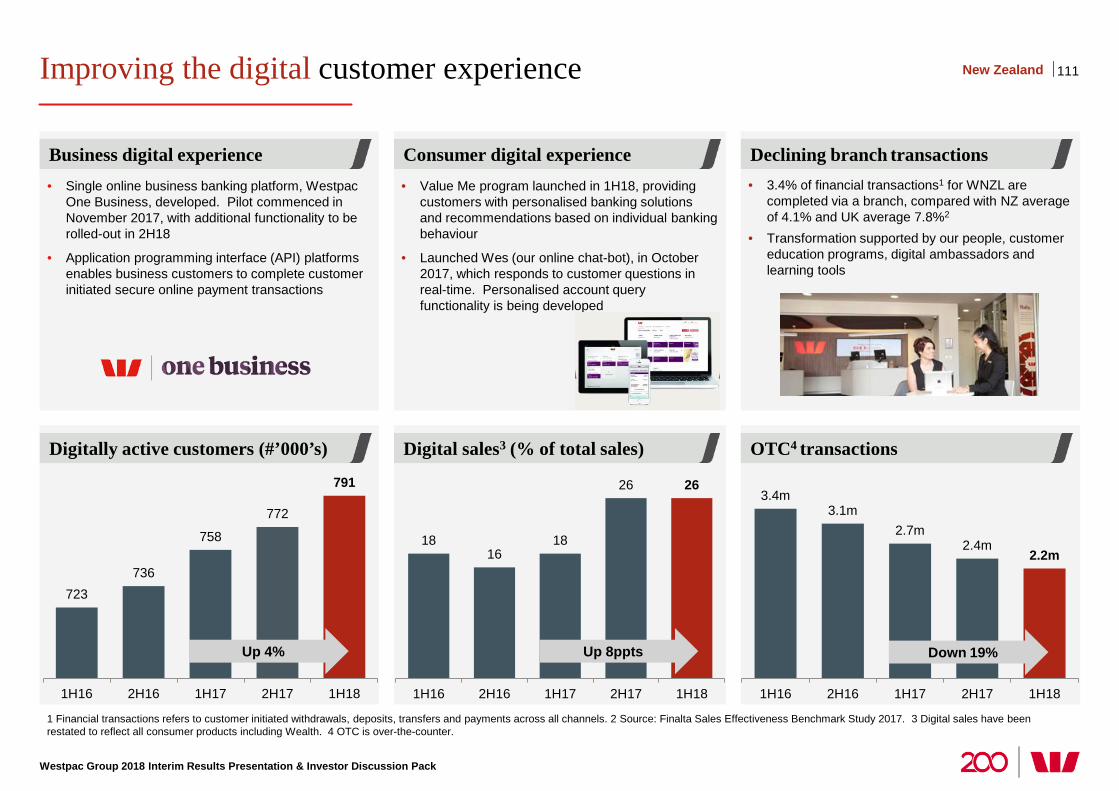
3.4m 3.1m
2.7m 2.4m
2.2m
1H16 2H16 1H17 2H17 1H18
Improving the digital customer experience
Westpac Group 2018 Interim Results Presentation & Investor Discussion Pack
1 Financial transactions refers to customer initiated withdrawals, deposits, transfers and payments across all channels. 2 Source: Finalta Sales Effectiveness Benchmark Study 2017. 3 Digital sales have been restated to reflect all consumer products including Wealth. 4 OTC is over-the-counter.
Digital sales3 (% of total sales) OTC4 transactions Digitally active customers (#’000’s)
Consumer digital experience Declining branch transactions Business digital experience
111 New Zealand
723 736
758
772
791
1H16 2H16 1H17 2H17 1H18
Up 4%
18 16
18
26 26
1H16 2H16 1H17 2H17 1H18
Up 8ppts Down 19%
• Single online business banking platform, Westpac One Business, developed. Pilot commenced in November 2017, with additional functionality to be rolled-out in 2H18
• Application programming interface (API) platforms enables business customers to complete customer initiated secure online payment transactions
• Value Me program launched in 1H18, providing customers with personalised banking solutions and recommendations based on individual banking behaviour
• Launched Wes (our online chat-bot), in October 2017, which responds to customer questions in real-time. Personalised account query functionality is being developed
• 3.4% of financial transactions1 for WNZL are completed via a branch, compared with NZ average of 4.1% and UK average 7.8%2
• Transformation supported by our people, customer education programs, digital ambassadors and learning tools
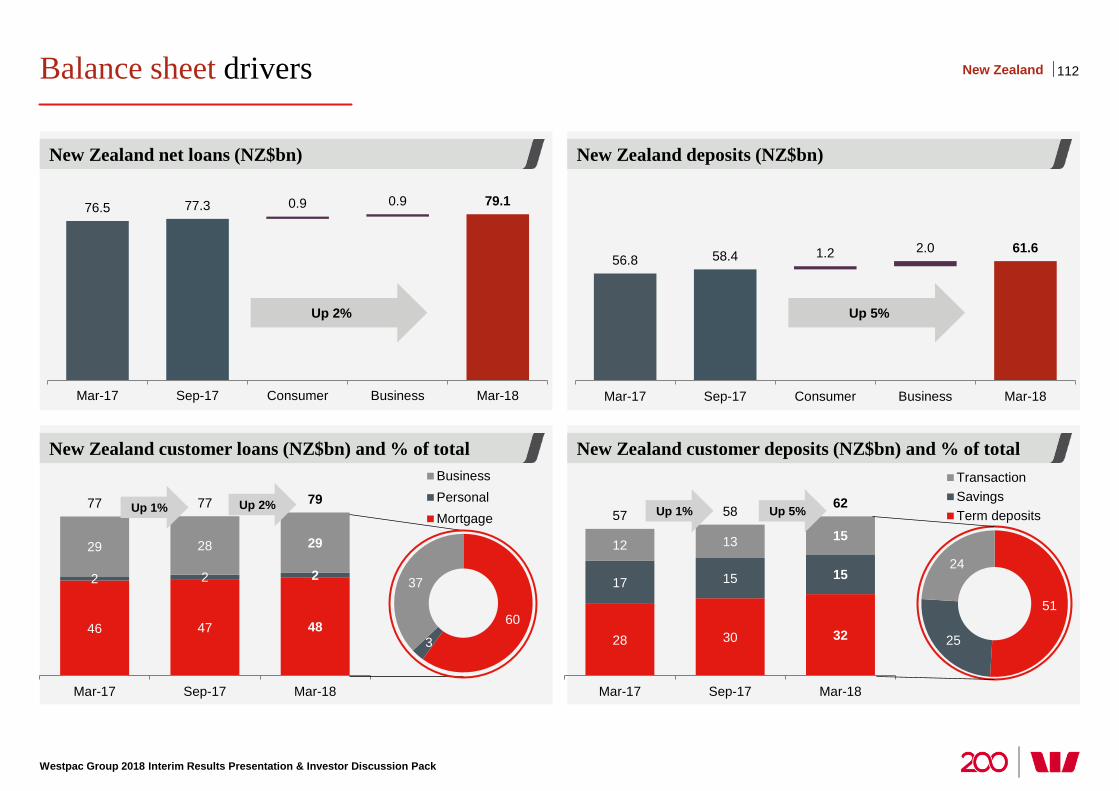
Balance sheet drivers
Westpac Group 2018 Interim Results Presentation & Investor Discussion Pack
New Zealand deposits (NZ$bn)
New Zealand customer deposits (NZ$bn) and % of total
New Zealand net loans (NZ$bn)
New Zealand customer loans (NZ$bn) and % of total
112 New Zealand
76.5 77.3 0.9 0.9 79.1
Mar-17 Sep-17 Consumer Business Mar-18
28 30 32
17 15 15
12 13 15 57 58 62
Mar-17 Sep-17 Mar-18
TransactionSavingsTerm deposits
51
25
24
Up 1% Up 5%
46 47 48
2 2 2
29 28 29
77 77 79
Mar-17 Sep-17 Mar-18
BusinessPersonalMortgage
60
3
37
Up 1% Up 2%
56.8 58.4 1.2 2.0 61.6
Mar-17 Sep-17 Consumer Business Mar-18
Up 5% Up 2%
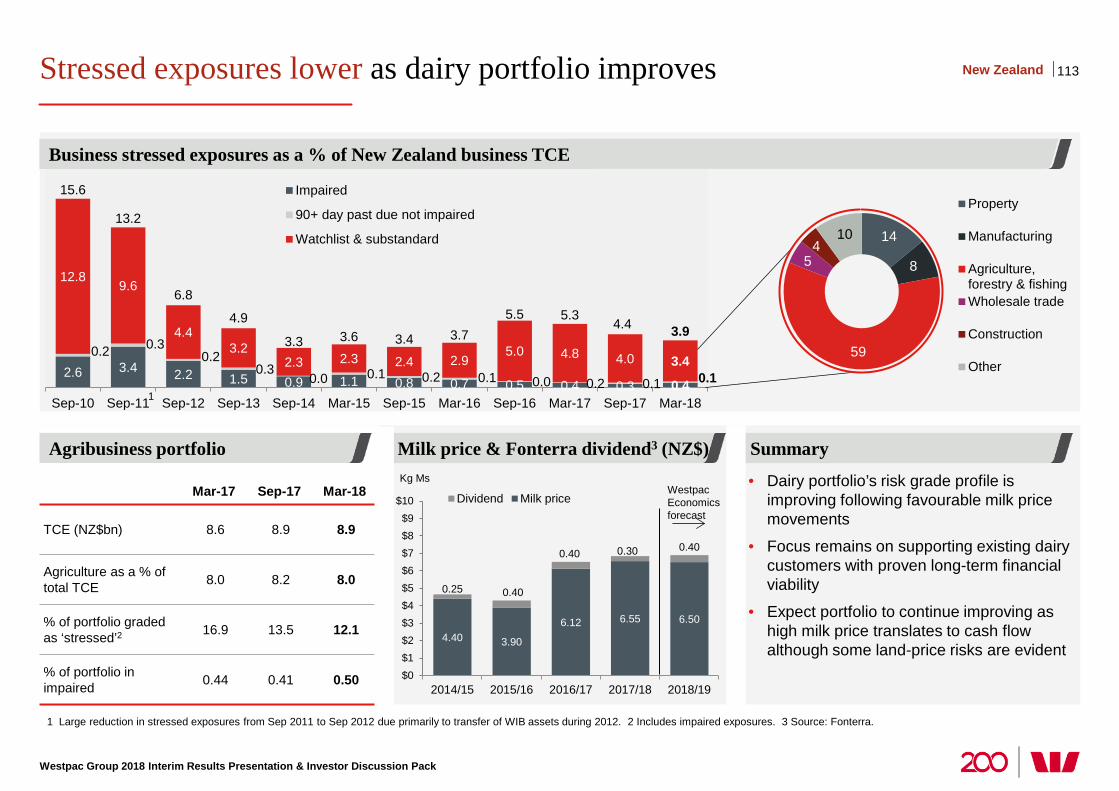
4.40 3.90
6.12 6.55 6.50
0.25 0.40
0.40 0.30 0.40
$0$1$2$3$4$5$6$7$8$9
$10
2014/15 2015/16 2016/17 2017/18 2018/19
Kg Ms
Dividend Milk price
14
8
59
5 4
10
Property
Manufacturing
Agriculture,forestry & fishingWholesale trade
Construction
Other2.6 3.4 2.2 1.5 0.9 1.1 0.8 0.7 0.5 0.4 0.3 0.4
0.2 0.3 0.2
0.3 0.0 0.1 0.2 0.1 0.0 0.2 0.1 0.1
12.8 9.6
4.4 3.2
2.3 2.3 2.4 2.9 5.0 4.8 4.0 3.4
15.6
13.2
6.8
4.9
3.3 3.6 3.4 3.7 5.5 5.3
4.4 3.9
Sep-10 Sep-11 Sep-12 Sep-13 Sep-14 Mar-15 Sep-15 Mar-16 Sep-16 Mar-17 Sep-17 Mar-18
Impaired
90+ day past due not impaired
Watchlist & substandard
Stressed exposures lower as dairy portfolio improves
Westpac Group 2018 Interim Results Presentation & Investor Discussion Pack
1 Large reduction in stressed exposures from Sep 2011 to Sep 2012 due primarily to transfer of WIB assets during 2012. 2 Includes impaired exposures. 3 Source: Fonterra.
113
Business stressed exposures as a % of New Zealand business TCE
Agribusiness portfolio Milk price & Fonterra dividend3 (NZ$) Summary
New Zealand
Mar-17 Sep-17 Mar-18
TCE (NZ$bn) 8.6 8.9 8.9
Agriculture as a % of total TCE 8.0 8.2 8.0
% of portfolio graded as ‘stressed’2 16.9 13.5 12.1
% of portfolio in impaired 0.44 0.41 0.50
Westpac Economics forecast
• Dairy portfolio’s risk grade profile is improving following favourable milk price movements
• Focus remains on supporting existing dairy customers with proven long-term financial viability
• Expect portfolio to continue improving as high milk price translates to cash flow although some land-price risks are evident
1
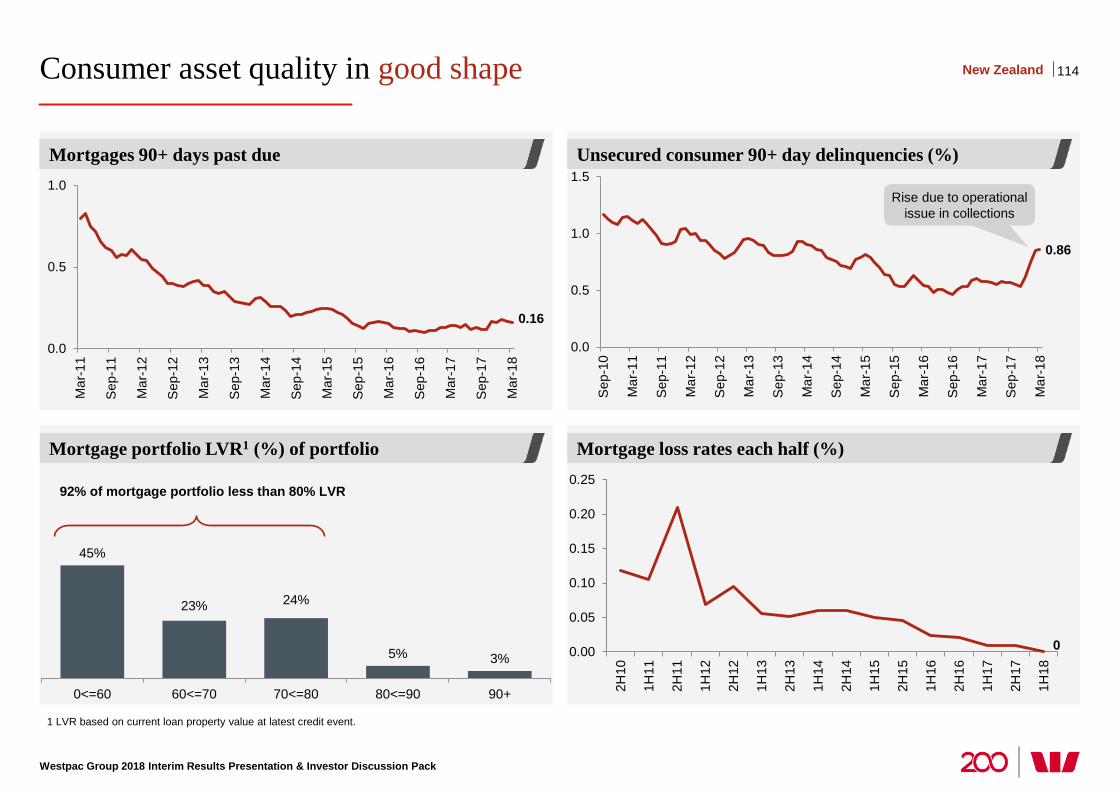
Consumer asset quality in good shape
Westpac Group 2018 Interim Results Presentation & Investor Discussion Pack
Unsecured consumer 90+ day delinquencies (%)
Mortgage loss rates each half (%)
Mortgage 90+ day delinquencies (%)
Mortgage portfolio LVR1 (%) of portfolio
1 LVR based on current loan property value at latest credit event.
114 New Zealand
Mortgages 90+ day delinquencies
0.16
0.0
0.5
1.0
Mar
-11
Sep
-11
Mar
-12
Sep
-12
Mar
-13
Sep
-13
Mar
-14
Sep
-14
Mar
-15
Sep
-15
Mar
-16
Sep
-16
Mar
-17
Sep
-17
Mar
-18
0.86
0.0
0.5
1.0
1.5
Sep
-10
Mar
-11
Sep
-11
Mar
-12
Sep
-12
Mar
-13
Sep
-13
Mar
-14
Sep
-14
Mar
-15
Sep
-15
Mar
-16
Sep
-16
Mar
-17
Sep
-17
Mar
-18
45%
23% 24%
5% 3%
0<=60 60<=70 70<=80 80<=90 90+
92% of mortgage portfolio less than 80% LVR
Mortgages 90+ days past due
0 0.00
0.05
0.10
0.15
0.20
0.25
2H10
1H11
2H11
1H12
2H12
1H13
2H13
1H14
2H14
1H15
2H15
1H16
2H16
1H17
2H17
1H18
Rise due to operational issue in collections

Economics
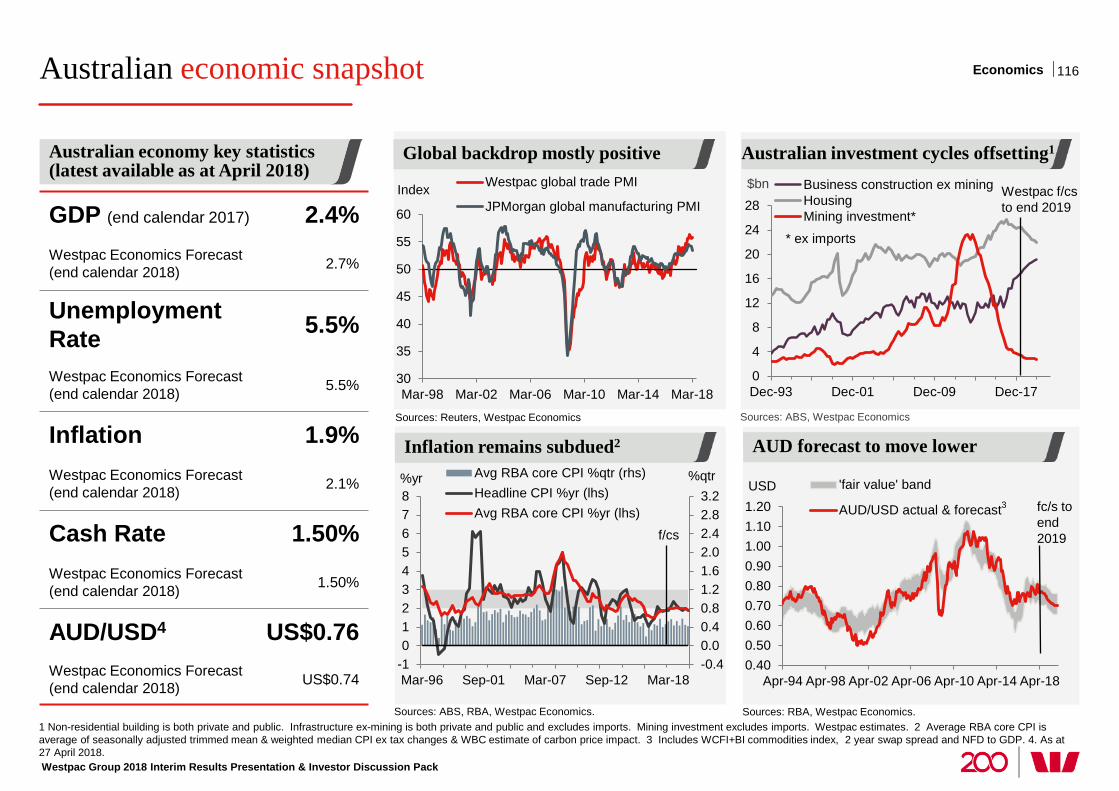
Australian economic snapshot
Australian economy key statistics (latest available as at April 2018)
Sources: ABS, RBA, Westpac Economics.
Inflation remains subdued2
Sources: Reuters, Westpac Economics
116
Westpac Group 2018 Interim Results Presentation & Investor Discussion Pack
Sources: ABS, Westpac Economics
GDP (end calendar 2017) 2.4% Westpac Economics Forecast (end calendar 2018) 2.7%
Unemployment Rate 5.5%
Westpac Economics Forecast (end calendar 2018) 5.5%
Inflation 1.9% Westpac Economics Forecast (end calendar 2018) 2.1%
Cash Rate 1.50% Westpac Economics Forecast (end calendar 2018) 1.50%
AUD/USD4 US$0.76 Westpac Economics Forecast (end calendar 2018) US$0.74
30
35
40
45
50
55
60
Mar-98 Mar-02 Mar-06 Mar-10 Mar-14 Mar-18
Westpac global trade PMI
JPMorgan global manufacturing PMIIndex
Sources: RBA, Westpac Economics.
AUD forecast to move lower
Global backdrop mostly positive Australian investment cycles offsetting1
1 Non-residential building is both private and public. Infrastructure ex-mining is both private and public and excludes imports. Mining investment excludes imports. Westpac estimates. 2 Average RBA core CPI is average of seasonally adjusted trimmed mean & weighted median CPI ex tax changes & WBC estimate of carbon price impact. 3 Includes WCFI+BI commodities index, 2 year swap spread and NFD to GDP. 4. As at 27 April 2018.
0.400.500.600.700.800.901.001.101.20
Apr-94 Apr-98 Apr-02 Apr-06 Apr-10 Apr-14 Apr-18
USD 'fair value' band
AUD/USD actual & forecast fc/s to end 2019
3
0
4
8
12
16
20
24
28
Dec-93 Dec-01 Dec-09 Dec-17
$bn Business construction ex miningHousingMining investment*
Westpac f/cs to end 2019
* ex imports
-0.40.00.40.81.21.62.02.42.83.2
-1012345678
Mar-96 Sep-01 Mar-07 Sep-12 Mar-18
%qtr %yr Avg RBA core CPI %qtr (rhs)Headline CPI %yr (lhs)Avg RBA core CPI %yr (lhs)
f/cs
Economics
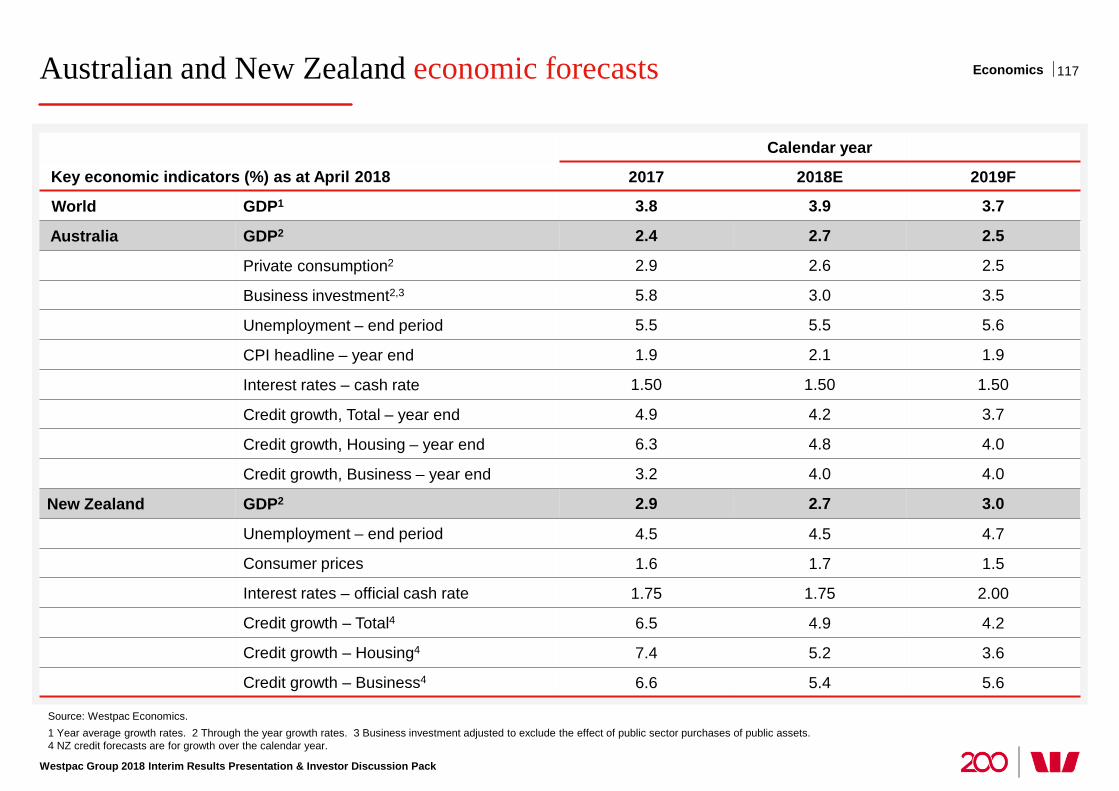
Westpac Group 2018 Interim Results Presentation & Investor Discussion Pack
Australian and New Zealand economic forecasts 117
Calendar year
Key economic indicators (%) as at April 2018 2017 2018E 2019F
World GDP1 3.8 3.9 3.7
Australia GDP2 2.4 2.7 2.5
Private consumption2 2.9 2.6 2.5
Business investment2,3 5.8 3.0 3.5
Unemployment – end period 5.5 5.5 5.6
CPI headline – year end 1.9 2.1 1.9
Interest rates – cash rate 1.50 1.50 1.50
Credit growth, Total – year end 4.9 4.2 3.7
Credit growth, Housing – year end 6.3 4.8 4.0
Credit growth, Business – year end 3.2 4.0 4.0
New Zealand GDP2 2.9 2.7 3.0
Unemployment – end period 4.5 4.5 4.7
Consumer prices 1.6 1.7 1.5
Interest rates – official cash rate 1.75 1.75 2.00
Credit growth – Total4 6.5 4.9 4.2
Credit growth – Housing4 7.4 5.2 3.6
Credit growth – Business4 6.6 5.4 5.6
Source: Westpac Economics. 1 Year average growth rates. 2 Through the year growth rates. 3 Business investment adjusted to exclude the effect of public sector purchases of public assets. 4 NZ credit forecasts are for growth over the calendar year.
Economics
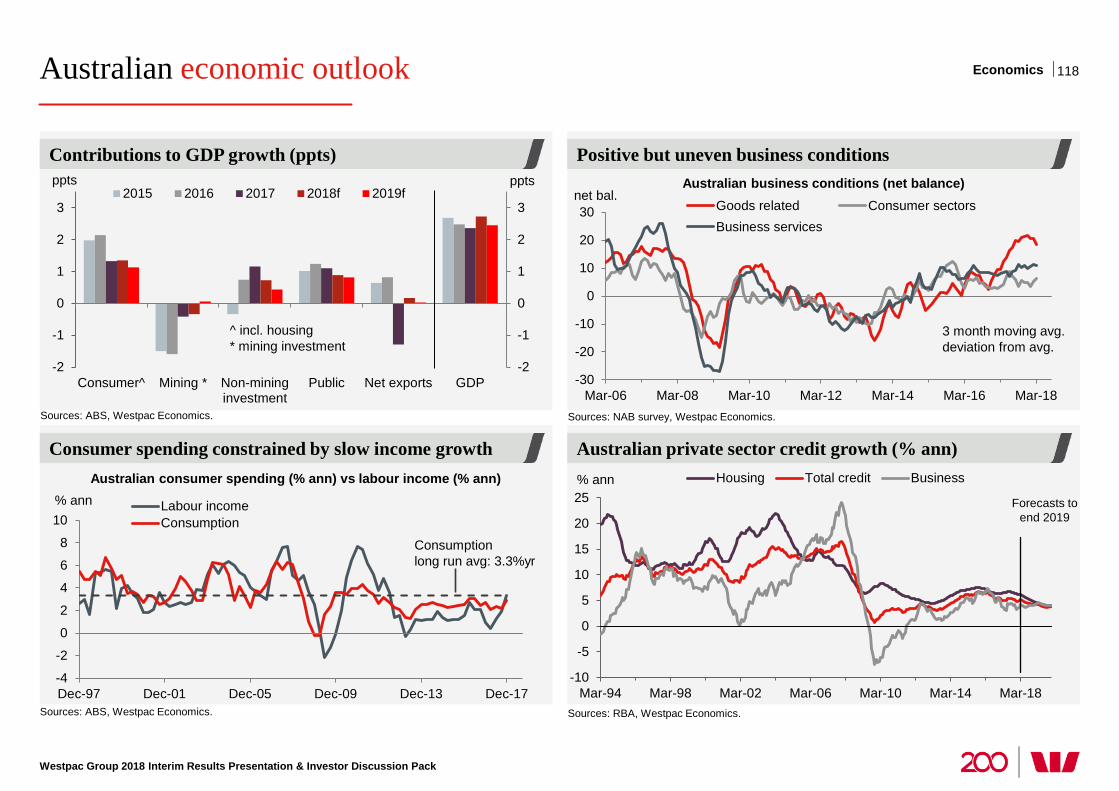
Australian economic outlook
Westpac Group 2018 Interim Results Presentation & Investor Discussion Pack
Positive but uneven business conditions
Australian private sector credit growth (% ann)
Contributions to GDP growth (ppts)
Consumer spending constrained by slow income growth
118
Sources: NAB survey, Westpac Economics.
-30
-20
-10
0
10
20
30
Mar-06 Mar-08 Mar-10 Mar-12 Mar-14 Mar-16 Mar-18
net bal. Goods related Consumer sectorsBusiness services
3 month moving avg. deviation from avg.
Australian consumer spending (% ann) vs labour income (% ann)
Australian business conditions (net balance)
Sources: ABS, Westpac Economics.
-2
-1
0
1
2
3
-2
-1
0
1
2
3
Consumer^ Mining * Non-mininginvestment
Public Net exports GDP
ppts ppts 2015 2016 2017 2018f 2019f
^ incl. housing * mining investment
Sources: ABS, Westpac Economics.
-4
-2
0
2
4
6
8
10
Dec-97 Dec-01 Dec-05 Dec-09 Dec-13 Dec-17
% ann Labour incomeConsumption
Consumption long run avg: 3.3%yr
Sources: RBA, Westpac Economics.
% ann
-10
-5
0
5
10
15
20
25
Mar-94 Mar-98 Mar-02 Mar-06 Mar-10 Mar-14 Mar-18
Housing Total credit Business
Forecasts to end 2019
Economics
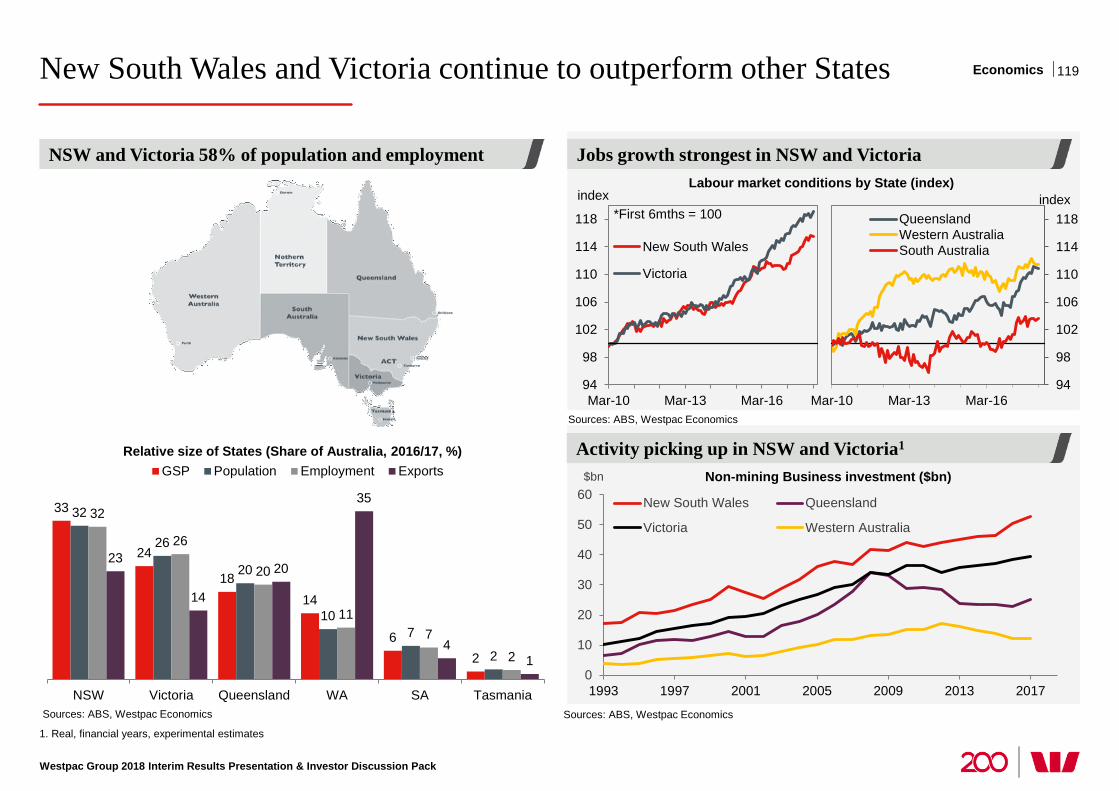
Westpac Group 2018 Interim Results Presentation & Investor Discussion Pack
New South Wales and Victoria continue to outperform other States 119
33
24
18 14
6 2
32
26
20
10 7
2
32
26
20
11 7
2
23
14
20
35
4 1
NSW Victoria Queensland WA SA Tasmania
GSP Population Employment Exports
0
10
20
30
40
50
60
1993 1997 2001 2005 2009 2013 2017
$bn
New South Wales Queensland
Victoria Western Australia
Non-mining Business investment ($bn)
1. Real, financial years, experimental estimates
Sources: ABS, Westpac Economics
Sources: ABS, Westpac Economics
Sources: ABS, Westpac Economics
Labour market conditions by State (index)
NSW and Victoria 58% of population and employment
Relative size of States (Share of Australia, 2016/17, %)
Jobs growth strongest in NSW and Victoria
Activity picking up in NSW and Victoria1
94
98
102
106
110
114
118
Mar-10 Mar-13 Mar-16
New South Wales
Victoria
index *First 6mths = 100
94
98
102
106
110
114
118
Mar-10 Mar-13 Mar-16
QueenslandWestern AustraliaSouth Australia
index
Economics
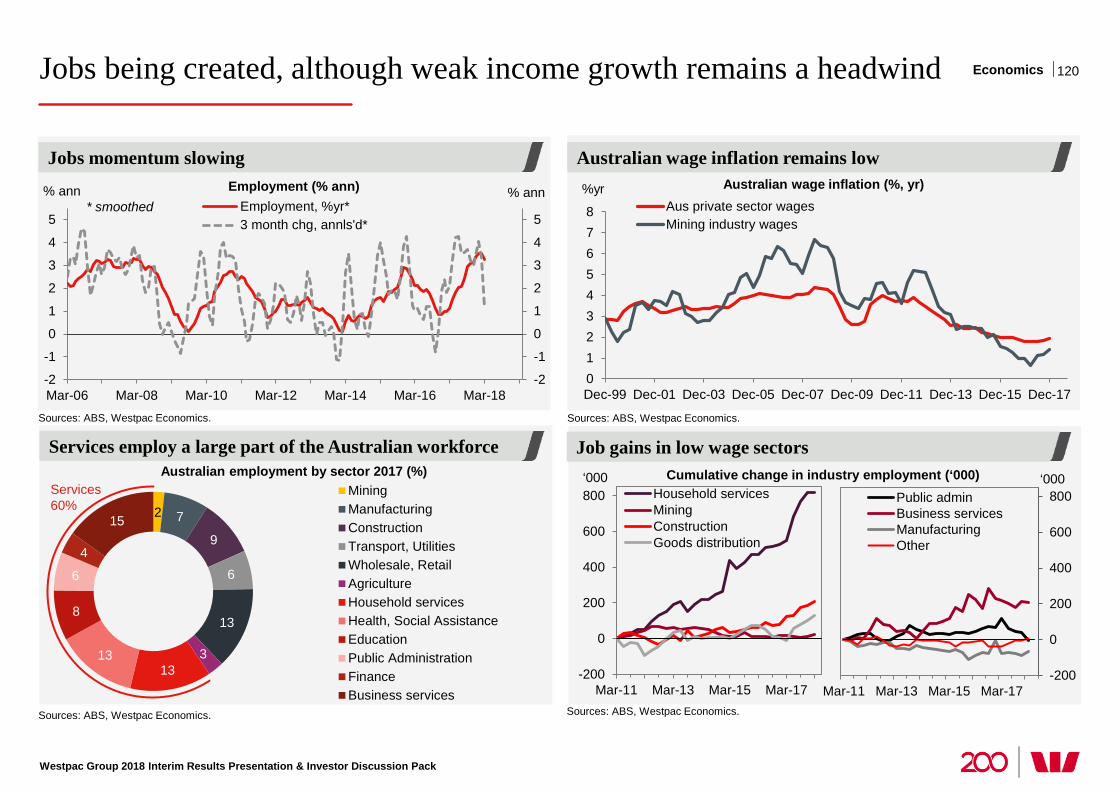
Westpac Group 2018 Interim Results Presentation & Investor Discussion Pack
Jobs being created, although weak income growth remains a headwind 120
Sources: ABS, Westpac Economics. Sources: ABS, Westpac Economics.
Australian wage inflation (%, yr)
Job gains in low wage sectors
Australian wage inflation remains low
Services employ a large part of the Australian workforce
Jobs momentum slowing Employment (% ann)
-2
-1
0
1
2
3
4
5
-2
-1
0
1
2
3
4
5
Mar-06 Mar-08 Mar-10 Mar-12 Mar-14 Mar-16 Mar-18
% ann % ann Employment, %yr*3 month chg, annls'd*
* smoothed
Sources: ABS, Westpac Economics.
Sources: ABS, Westpac Economics.
2 7
9
6
13
3 13
13
8
6
4
15
MiningManufacturingConstructionTransport, UtilitiesWholesale, RetailAgricultureHousehold servicesHealth, Social AssistanceEducationPublic AdministrationFinanceBusiness services
Australian employment by sector 2017 (%) Services 60%
012345678
Dec-99 Dec-01 Dec-03 Dec-05 Dec-07 Dec-09 Dec-11 Dec-13 Dec-15 Dec-17
%yr Aus private sector wagesMining industry wages
-200
0
200
400
600
800
Mar-11 Mar-13 Mar-15 Mar-17
Household servicesMiningConstructionGoods distribution
‘000 Cumulative change in industry employment (‘000)
-200
0
200
400
600
800
Mar-11 Mar-13 Mar-15 Mar-17
Public adminBusiness servicesManufacturingOther
‘000
Economics
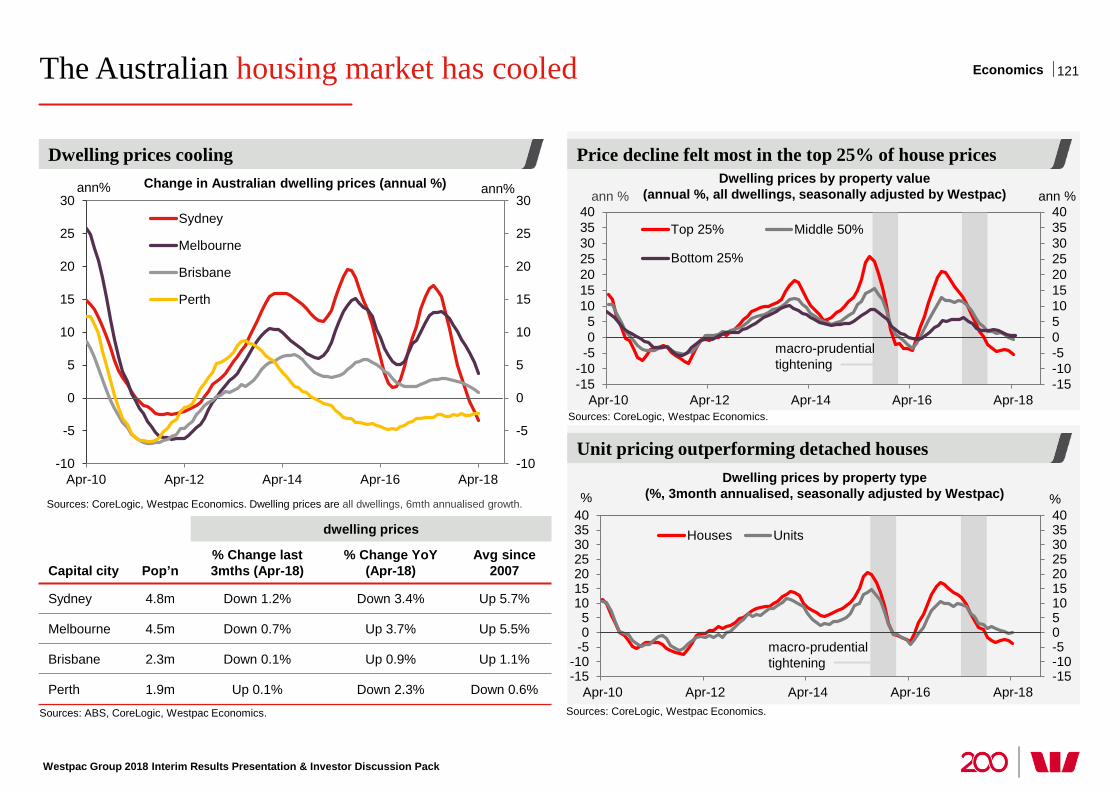
The Australian housing market has cooled
Westpac Group 2018 Interim Results Presentation & Investor Discussion Pack
Price decline felt most in the top 25% of house prices
121
Sources: CoreLogic, Westpac Economics.
Dwelling prices cooling
Unit pricing outperforming detached houses
Sources: CoreLogic, Westpac Economics.
Dwelling prices by property type (%, 3month annualised, seasonally adjusted by Westpac)
-15-10-50510152025303540
-15-10
-505
10152025303540
Apr-10 Apr-12 Apr-14 Apr-16 Apr-18
% %
Houses Units
macro-prudential tightening
Dwelling prices by property value (annual %, all dwellings, seasonally adjusted by Westpac)
-15-10-50510152025303540
-15-10
-505
10152025303540
Apr-10 Apr-12 Apr-14 Apr-16 Apr-18
ann % ann %
Top 25% Middle 50%
Bottom 25%
macro-prudential tightening
Sources: ABS, CoreLogic, Westpac Economics.
Sources: CoreLogic, Westpac Economics. Dwelling prices are all dwellings, 6mth annualised growth.
Change in Australian dwelling prices (annual %)
-10
-5
0
5
10
15
20
25
30
-10
-5
0
5
10
15
20
25
30
Apr-10 Apr-12 Apr-14 Apr-16 Apr-18
ann% ann%
Sydney
Melbourne
Brisbane
Perth
dwelling prices
Capital city Pop’n % Change last 3mths (Apr-18)
% Change YoY (Apr-18)
Avg since 2007
Sydney 4.8m Down 1.2% Down 3.4% Up 5.7%
Melbourne 4.5m Down 0.7% Up 3.7% Up 5.5%
Brisbane 2.3m Down 0.1% Up 0.9% Up 1.1%
Perth 1.9m Up 0.1% Down 2.3% Down 0.6%
Economics
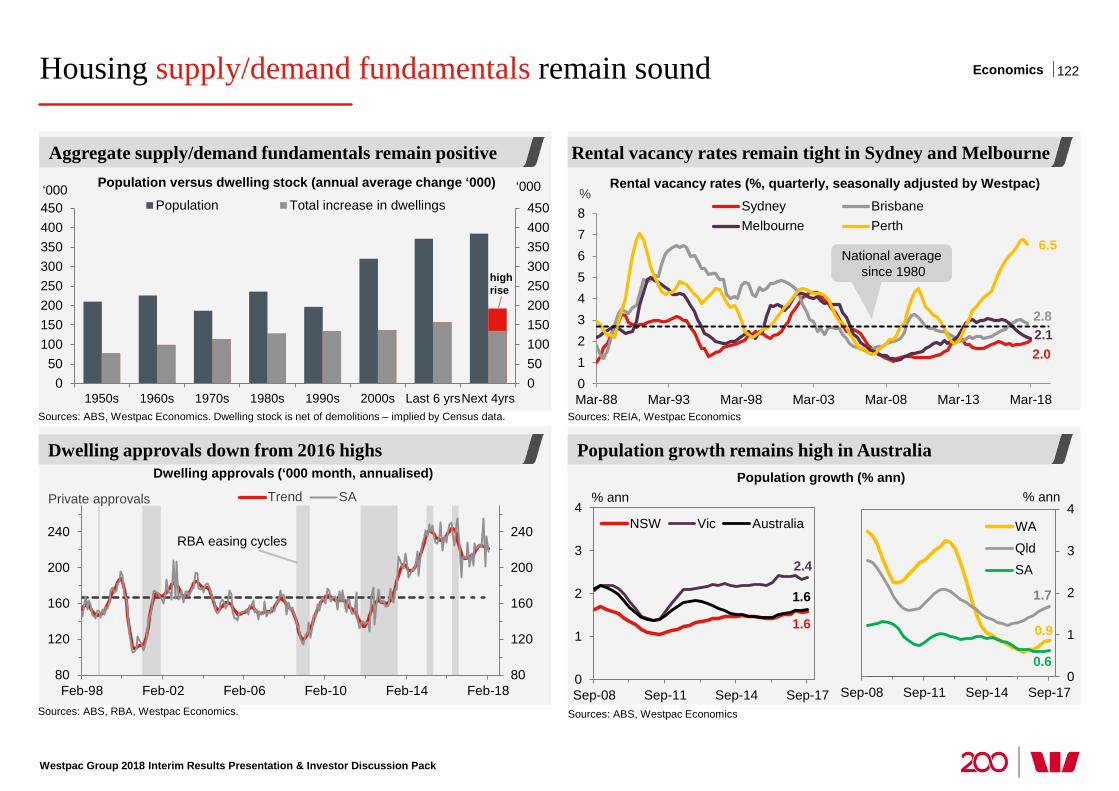
Westpac Group 2018 Interim Results Presentation & Investor Discussion Pack
Housing supply/demand fundamentals remain sound 122
Sources: ABS, Westpac Economics. Dwelling stock is net of demolitions – implied by Census data.
Population versus dwelling stock (annual average change ‘000)
Sources: REIA, Westpac Economics
Rental vacancy rates (%, quarterly, seasonally adjusted by Westpac)
Aggregate supply/demand fundamentals remain positive Rental vacancy rates remain tight in Sydney and Melbourne
Population growth remains high in Australia
2.0
2.8 2.1
6.5
012345678
Mar-88 Mar-93 Mar-98 Mar-03 Mar-08 Mar-13 Mar-18
% Sydney BrisbaneMelbourne Perth
050100150200250300350400450
050
100150200250300350400450
1950s 1960s 1970s 1980s 1990s 2000s Last 6 yrsNext 4yrs
‘000 ‘000 Population Total increase in dwellings
high rise
Sources: ABS, RBA, Westpac Economics.
Dwelling approvals (‘000 month, annualised) Dwelling approvals down from 2016 highs
80
120
160
200
240
80
120
160
200
240
Feb-98 Feb-02 Feb-06 Feb-10 Feb-14 Feb-18
Trend SAPrivate approvals
RBA easing cycles
Sources: ABS, Westpac Economics
Population growth (% ann)
1.6
2.4
1.6
0
1
2
3
4
Sep-08 Sep-11 Sep-14 Sep-17
NSW Vic Australia
% ann
0.9
1.7
0.6 0
1
2
3
4
Sep-08 Sep-11 Sep-14 Sep-17
WAQldSA
% ann
National average since 1980
Economics
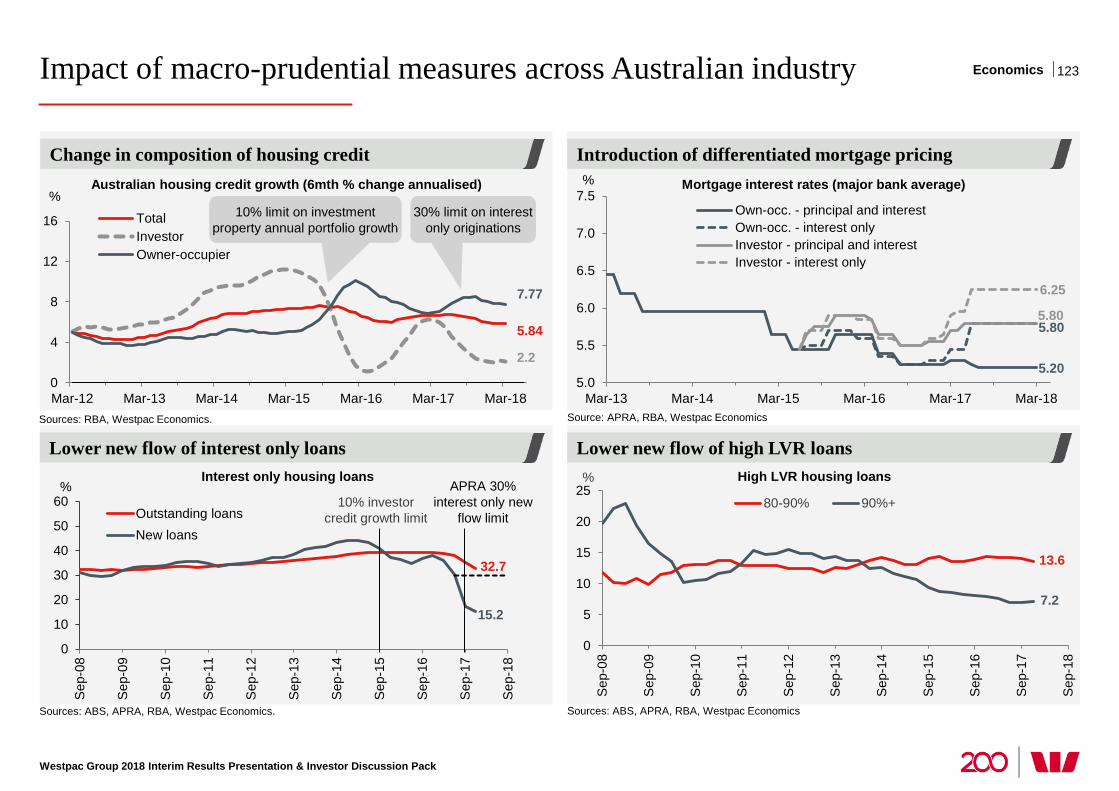
Impact of macro-prudential measures across Australian industry
Westpac Group 2018 Interim Results Presentation & Investor Discussion Pack
Lower new flow of high LVR loans
Change in composition of housing credit
Lower new flow of interest only loans
123
Sources: RBA, Westpac Economics.
Sources: ABS, APRA, RBA, Westpac Economics. Sources: ABS, APRA, RBA, Westpac Economics
Source: APRA, RBA, Westpac Economics
High LVR housing loans
5.20
5.80 5.80
6.25
5.0
5.5
6.0
6.5
7.0
7.5
Mar-13 Mar-14 Mar-15 Mar-16 Mar-17 Mar-18
%
Own-occ. - principal and interestOwn-occ. - interest onlyInvestor - principal and interestInvestor - interest only
Mortgage interest rates (major bank average)
32.7
15.2
0
10
20
30
40
50
60
Sep
-08
Sep
-09
Sep
-10
Sep
-11
Sep
-12
Sep
-13
Sep
-14
Sep
-15
Sep
-16
Sep
-17
Sep
-18
%
Outstanding loansNew loans
10% investor credit growth limit
APRA 30% interest only new
flow limit
13.6
7.2
0
5
10
15
20
25
Sep
-08
Sep
-09
Sep
-10
Sep
-11
Sep
-12
Sep
-13
Sep
-14
Sep
-15
Sep
-16
Sep
-17
Sep
-18
%
80-90% 90%+
Interest only housing loans
Introduction of differentiated mortgage pricing
5.84
2.2
7.77
0
4
8
12
16
Mar-12 Mar-13 Mar-14 Mar-15 Mar-16 Mar-17 Mar-18
TotalInvestorOwner-occupier
Australian housing credit growth (6mth % change annualised) %
10% limit on investment property annual portfolio growth
30% limit on interest only originations
Economics
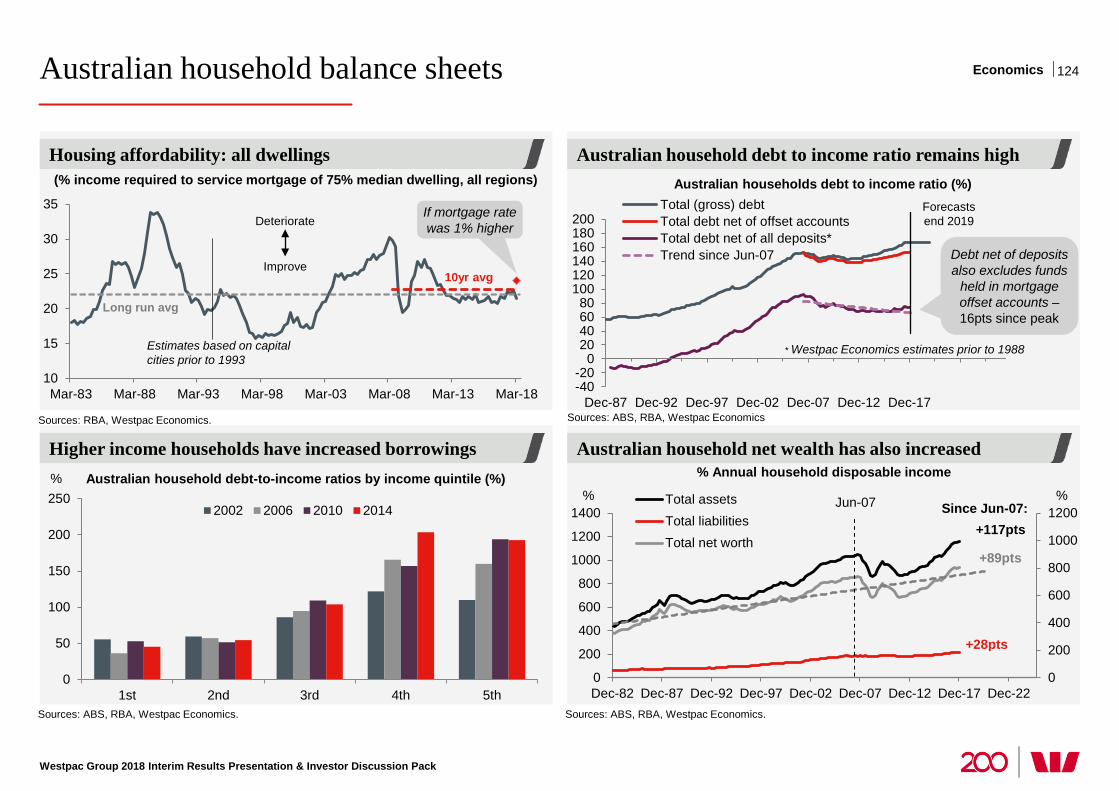
Australian household balance sheets
Westpac Group 2018 Interim Results Presentation & Investor Discussion Pack
Australian household debt to income ratio remains high
Australian household net wealth has also increased
Housing affordability: all dwellings
Higher income households have increased borrowings
124
Sources: ABS, RBA, Westpac Economics. Sources: ABS, RBA, Westpac Economics.
0
200
400
600
800
1000
1200
1400
Dec-82 Dec-87 Dec-92 Dec-97 Dec-02 Dec-07 Dec-12 Dec-17 Dec-220
200
400
600
800
1000
1200% % Total assets
Total liabilitiesTotal net worth
+89pts
+117pts
+28pts
Jun-07 Since Jun-07:
% Annual household disposable income
Sources: RBA, Westpac Economics.
(% income required to service mortgage of 75% median dwelling, all regions)
Australian household debt-to-income ratios by income quintile (%)
0
50
100
150
200
250
1st 2nd 3rd 4th 5th
2002 2006 2010 2014
%
Sources: ABS, RBA, Westpac Economics
-40-20
020406080
100120140160180200
Dec-87 Dec-92 Dec-97 Dec-02 Dec-07 Dec-12 Dec-17
Total (gross) debtTotal debt net of offset accountsTotal debt net of all deposits*Trend since Jun-07
* Westpac Economics estimates prior to 1988
Forecasts end 2019
Australian households debt to income ratio (%)
10
15
20
25
30
35
Mar-83 Mar-88 Mar-93 Mar-98 Mar-03 Mar-08 Mar-13 Mar-18
Estimates based on capital cities prior to 1993
Long run avg
Deteriorate
Improve 10yr avg
Debt net of deposits also excludes funds
held in mortgage offset accounts –16pts since peak
If mortgage rate was 1% higher
Economics
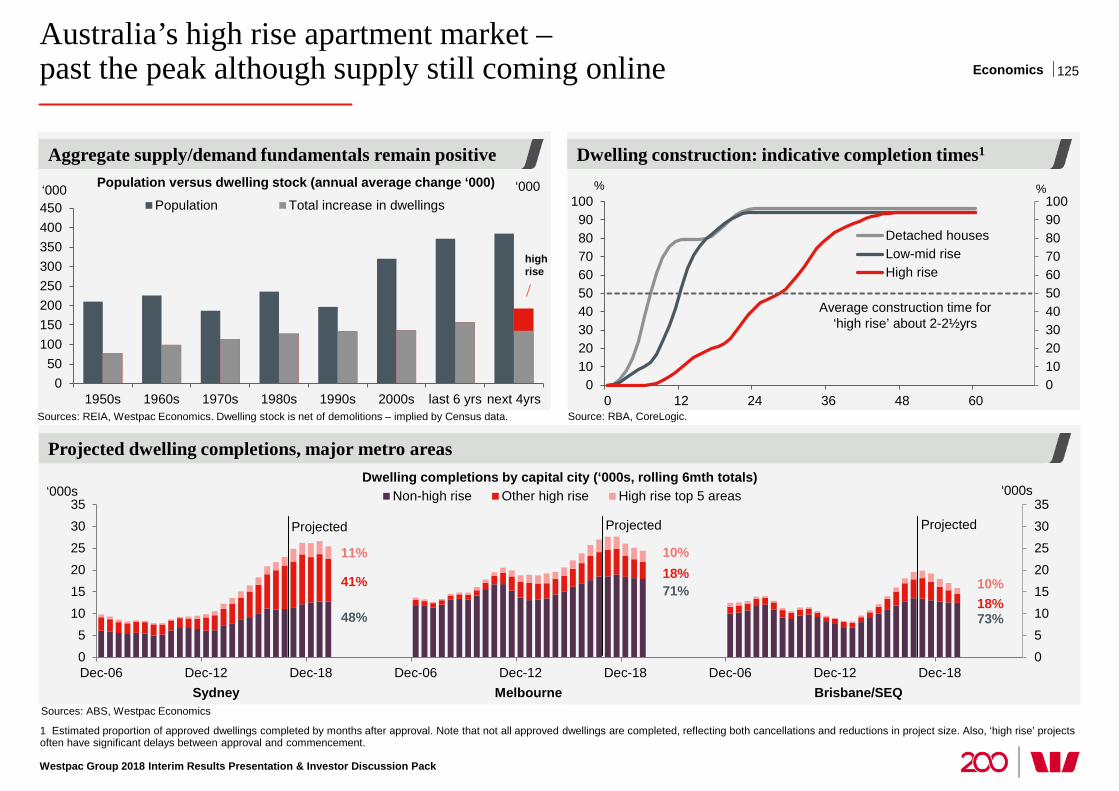
Australia’s high rise apartment market – past the peak although supply still coming online
Westpac Group 2018 Interim Results Presentation & Investor Discussion Pack
1 Estimated proportion of approved dwellings completed by months after approval. Note that not all approved dwellings are completed, reflecting both cancellations and reductions in project size. Also, ‘high rise’ projects often have significant delays between approval and commencement.
Dwelling construction: indicative completion times1
125
0102030405060708090100
0102030405060708090
100
0 12 24 36 48 60
% %
Detached housesLow-mid riseHigh rise
Average construction time for ‘high rise’ about 2-2½yrs
Dwelling completions by capital city (‘000s, rolling 6mth totals)
Sources: ABS, Westpac Economics
05101520253035
05
101520253035
Dec-06 Dec-12 Dec-18 Dec-06 Dec-12 Dec-18 Dec-06 Dec-12 Dec-18
‘000s ‘000s Non-high rise Other high rise High rise top 5 areas
Projected
Sydney Brisbane/SEQ Melbourne
41%
11%
48%
18% 10%
71% 18% 10%
73%
Projected Projected
Source: RBA, CoreLogic. Sources: REIA, Westpac Economics. Dwelling stock is net of demolitions – implied by Census data.
Population versus dwelling stock (annual average change ‘000)
Aggregate supply/demand fundamentals remain positive
050
100150200250300350400450
1950s 1960s 1970s 1980s 1990s 2000s last 6 yrs next 4yrs
‘000 ‘000 Population Total increase in dwellings
high rise
Projected dwelling completions, major metro areas
Economics
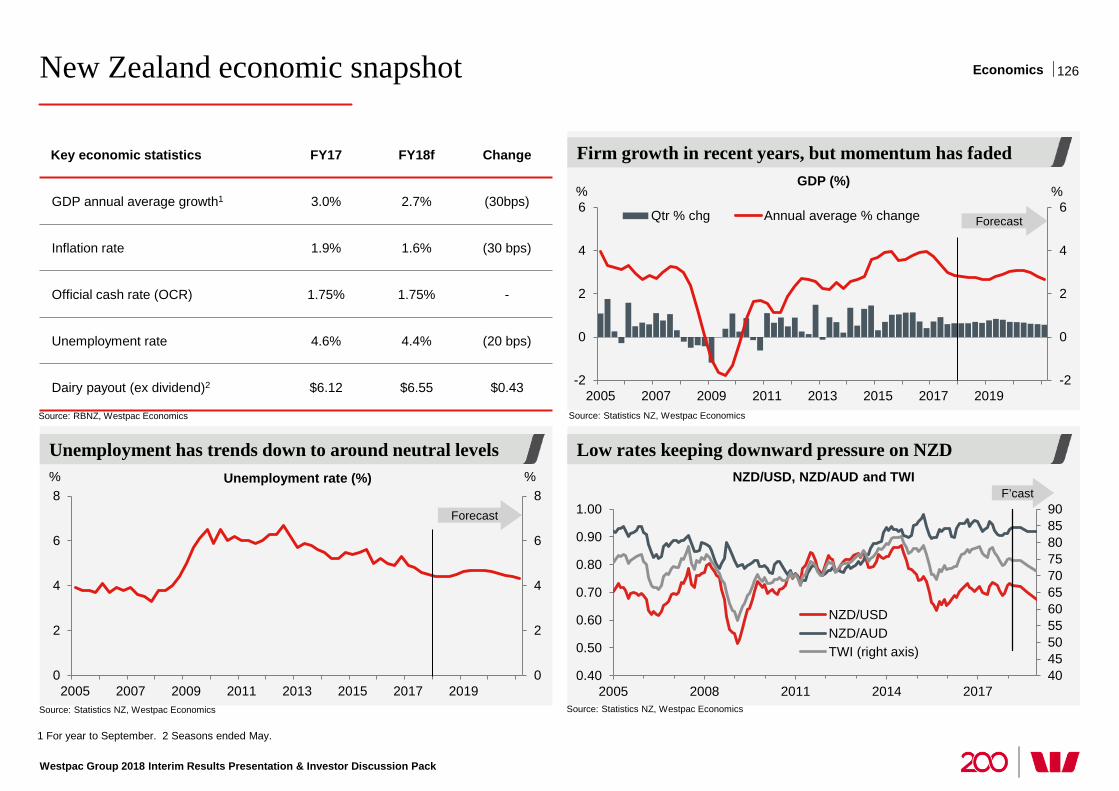
0
2
4
6
8
0
2
4
6
8
2005 2007 2009 2011 2013 2015 2017 2019
New Zealand economic snapshot
Westpac Group 2018 Interim Results Presentation & Investor Discussion Pack
Low rates keeping downward pressure on NZD Unemployment has trends down to around neutral levels
1 For year to September. 2 Seasons ended May.
126
Key economic statistics FY17 FY18f Change
GDP annual average growth1 3.0% 2.7% (30bps)
Inflation rate 1.9% 1.6% (30 bps)
Official cash rate (OCR) 1.75% 1.75% -
Unemployment rate 4.6% 4.4% (20 bps)
Dairy payout (ex dividend)2 $6.12 $6.55 $0.43
Source: RBNZ, Westpac Economics
Firm growth in recent years, but momentum has faded
4045505560657075808590
0.40
0.50
0.60
0.70
0.80
0.90
1.00
2005 2008 2011 2014 2017
NZD/USDNZD/AUDTWI (right axis)
Forecast
F’cast
Source: Statistics NZ, Westpac Economics Source: Statistics NZ, Westpac Economics
Unemployment rate (%) NZD/USD, NZD/AUD and TWI
-2
0
2
4
6
-2
0
2
4
6
2005 2007 2009 2011 2013 2015 2017 2019
Qtr % chg Annual average % change
GDP (%)
Forecast
% %
% %
Source: Statistics NZ, Westpac Economics
Economics
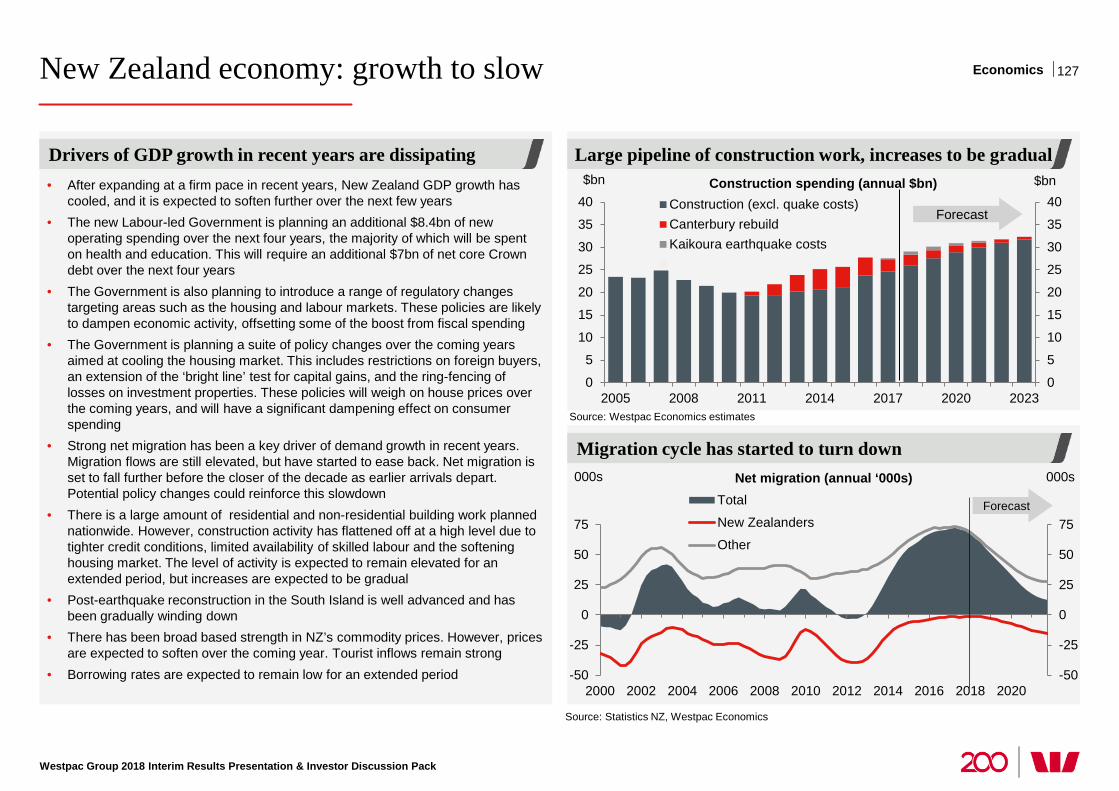
New Zealand economy: growth to slow
Westpac Group 2018 Interim Results Presentation & Investor Discussion Pack
0
5
10
15
20
25
30
35
40
0
5
10
15
20
25
30
35
40
2005 2008 2011 2014 2017 2020 2023
$bn $bn
Construction (excl. quake costs)Canterbury rebuildKaikoura earthquake costs
Migration cycle has started to turn down
Large pipeline of construction work, increases to be gradual Drivers of GDP growth in recent years are dissipating
127
Construction spending (annual $bn)
Forecast
Source: Statistics NZ, Westpac Economics
Source: Westpac Economics estimates
Net migration (annual ‘000s)
• After expanding at a firm pace in recent years, New Zealand GDP growth has cooled, and it is expected to soften further over the next few years
• The new Labour-led Government is planning an additional $8.4bn of new operating spending over the next four years, the majority of which will be spent on health and education. This will require an additional $7bn of net core Crown debt over the next four years
• The Government is also planning to introduce a range of regulatory changes targeting areas such as the housing and labour markets. These policies are likely to dampen economic activity, offsetting some of the boost from fiscal spending
• The Government is planning a suite of policy changes over the coming years aimed at cooling the housing market. This includes restrictions on foreign buyers, an extension of the ‘bright line’ test for capital gains, and the ring-fencing of losses on investment properties. These policies will weigh on house prices over the coming years, and will have a significant dampening effect on consumer spending
• Strong net migration has been a key driver of demand growth in recent years. Migration flows are still elevated, but have started to ease back. Net migration is set to fall further before the closer of the decade as earlier arrivals depart. Potential policy changes could reinforce this slowdown
• There is a large amount of residential and non-residential building work planned nationwide. However, construction activity has flattened off at a high level due to tighter credit conditions, limited availability of skilled labour and the softening housing market. The level of activity is expected to remain elevated for an extended period, but increases are expected to be gradual
• Post-earthquake reconstruction in the South Island is well advanced and has been gradually winding down
• There has been broad based strength in NZ’s commodity prices. However, prices are expected to soften over the coming year. Tourist inflows remain strong
• Borrowing rates are expected to remain low for an extended period
-50
-25
0
25
50
75
-50
-25
0
25
50
75
2000 2002 2004 2006 2008 2010 2012 2014 2016 2018 2020
000s 000s
Total
New Zealanders
Other
Forecast
Economics
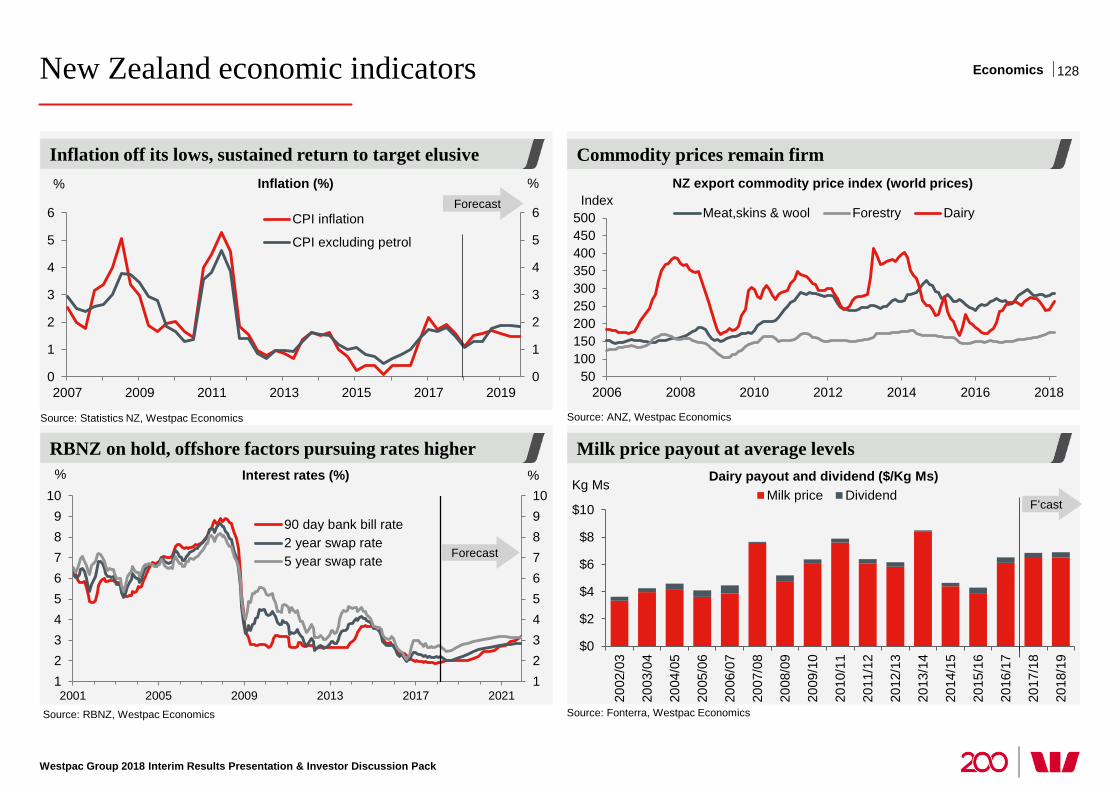
New Zealand economic indicators
Westpac Group 2018 Interim Results Presentation & Investor Discussion Pack
128
RBNZ on hold, offshore factors pursuing rates higher
Inflation off its lows, sustained return to target elusive
0
1
2
3
4
5
6
0
1
2
3
4
5
6
2007 2009 2011 2013 2015 2017 2019
% %
CPI inflation
CPI excluding petrol
12345678910
123456789
10
2001 2005 2009 2013 2017 2021
% %
90 day bank bill rate2 year swap rate5 year swap rate
Inflation (%)
Source: Statistics NZ, Westpac Economics
Source: RBNZ, Westpac Economics
Forecast
Forecast
Interest rates (%)
$0
$2
$4
$6
$8
$10
2002
/03
2003
/04
2004
/05
2005
/06
2006
/07
2007
/08
2008
/09
2009
/10
2010
/11
2011
/12
2012
/13
2013
/14
2014
/15
2015
/16
2016
/17
2017
/18
2018
/19
Kg Ms Milk price Dividend
Milk price payout at average levels
Commodity prices remain firm
50100150200250300350400450500
2006 2008 2010 2012 2014 2016 2018
Meat,skins & wool Forestry DairyIndex
Source: ANZ, Westpac Economics
NZ export commodity price index (world prices)
Dairy payout and dividend ($/Kg Ms)
Source: Fonterra, Westpac Economics
F’cast
Economics
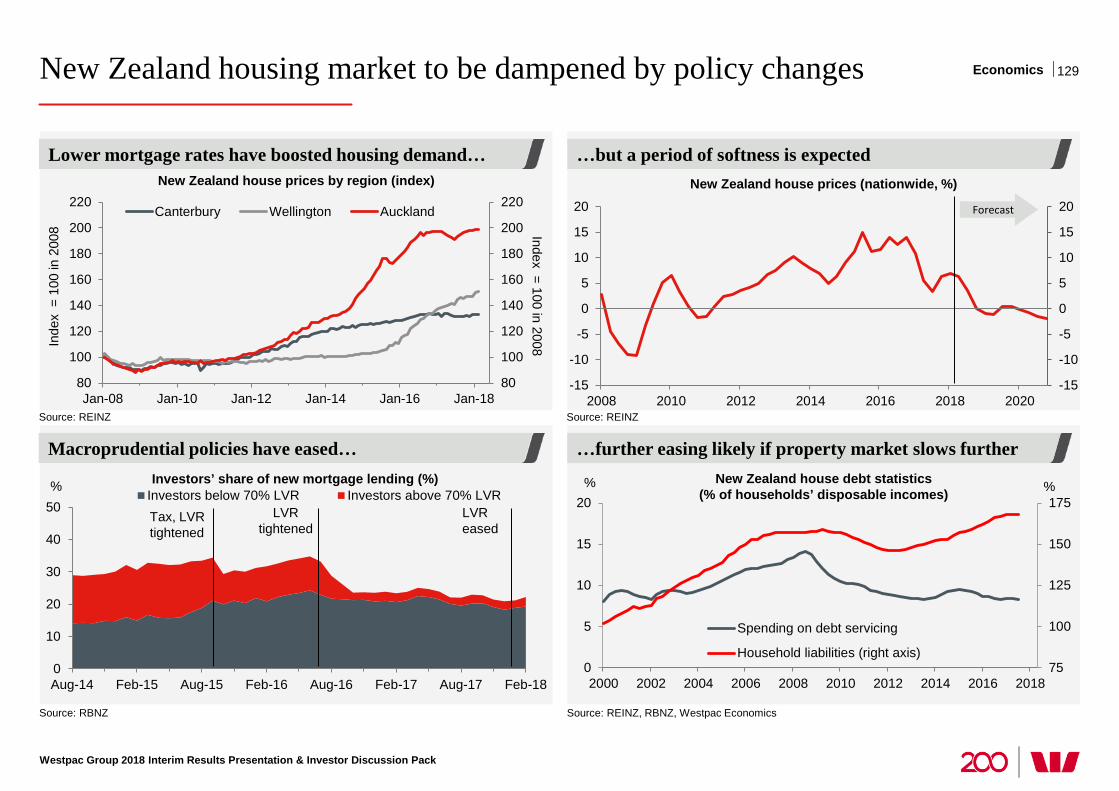
New Zealand housing market to be dampened by policy changes
Westpac Group 2018 Interim Results Presentation & Investor Discussion Pack
129
-15
-10
-5
0
5
10
15
20
-15
-10
-5
0
5
10
15
20
2008 2010 2012 2014 2016 2018 2020
Forecast
New Zealand house prices by region (index)
…but a period of softness is expected Lower mortgage rates have boosted housing demand…
Source: REINZ Source: REINZ
New Zealand house prices (nationwide, %)
75
100
125
150
175
0
5
10
15
20
2000 2002 2004 2006 2008 2010 2012 2014 2016 2018
Spending on debt servicing
Household liabilities (right axis)
% %
…further easing likely if property market slows further
New Zealand house debt statistics (% of households’ disposable incomes)
Macroprudential policies have eased…
Investors’ share of new mortgage lending (%)
Source: RBNZ Source: REINZ, RBNZ, Westpac Economics
80
100
120
140
160
180
200
220
80
100
120
140
160
180
200
220
Jan-08 Jan-10 Jan-12 Jan-14 Jan-16 Jan-18
Canterbury Wellington Auckland
Inde
x =
100
in 2
008 Index = 100 in 2008
0
10
20
30
40
50
Aug-14 Feb-15 Aug-15 Feb-16 Aug-16 Feb-17 Aug-17 Feb-18
% Investors below 70% LVR Investors above 70% LVRTax, LVR tightened
LVR tightened
LVR eased
Economics
Appendix and Disclaimer
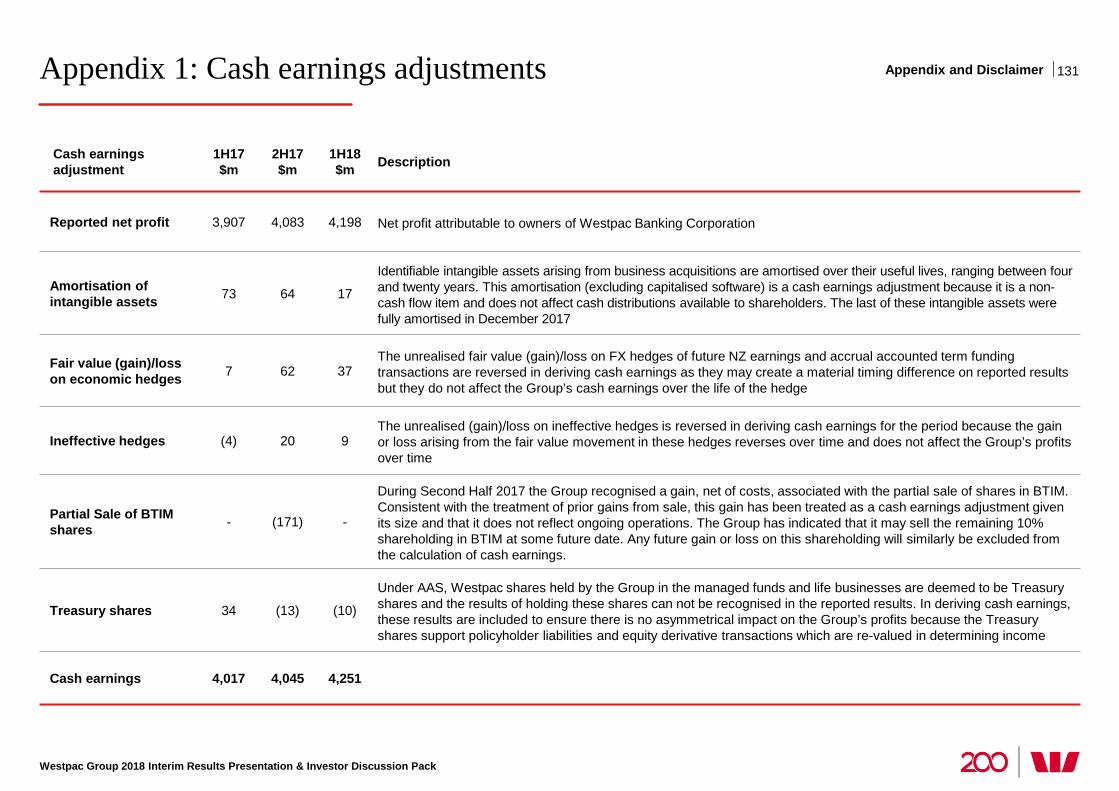
Appendix 1: Cash earnings adjustments Appendix and Disclaimer
Cash earnings adjustment
1H17 $m
2H17 $m
1H18 $m Description
Reported net profit 3,907 4,083 4,198 Net profit attributable to owners of Westpac Banking Corporation
Amortisation of intangible assets 73 64 17
Identifiable intangible assets arising from business acquisitions are amortised over their useful lives, ranging between four and twenty years. This amortisation (excluding capitalised software) is a cash earnings adjustment because it is a non-cash flow item and does not affect cash distributions available to shareholders. The last of these intangible assets were fully amortised in December 2017
Fair value (gain)/loss on economic hedges 7 62 37
The unrealised fair value (gain)/loss on FX hedges of future NZ earnings and accrual accounted term funding transactions are reversed in deriving cash earnings as they may create a material timing difference on reported results but they do not affect the Group’s cash earnings over the life of the hedge
Ineffective hedges (4) 20 9 The unrealised (gain)/loss on ineffective hedges is reversed in deriving cash earnings for the period because the gain or loss arising from the fair value movement in these hedges reverses over time and does not affect the Group’s profits over time
Partial Sale of BTIM shares - (171) -
During Second Half 2017 the Group recognised a gain, net of costs, associated with the partial sale of shares in BTIM. Consistent with the treatment of prior gains from sale, this gain has been treated as a cash earnings adjustment given its size and that it does not reflect ongoing operations. The Group has indicated that it may sell the remaining 10% shareholding in BTIM at some future date. Any future gain or loss on this shareholding will similarly be excluded from the calculation of cash earnings.
Treasury shares 34 (13) (10)
Under AAS, Westpac shares held by the Group in the managed funds and life businesses are deemed to be Treasury shares and the results of holding these shares can not be recognised in the reported results. In deriving cash earnings, these results are included to ensure there is no asymmetrical impact on the Group’s profits because the Treasury shares support policyholder liabilities and equity derivative transactions which are re-valued in determining income
Cash earnings 4,017 4,045 4,251
Westpac Group 2018 Interim Results Presentation & Investor Discussion Pack
131
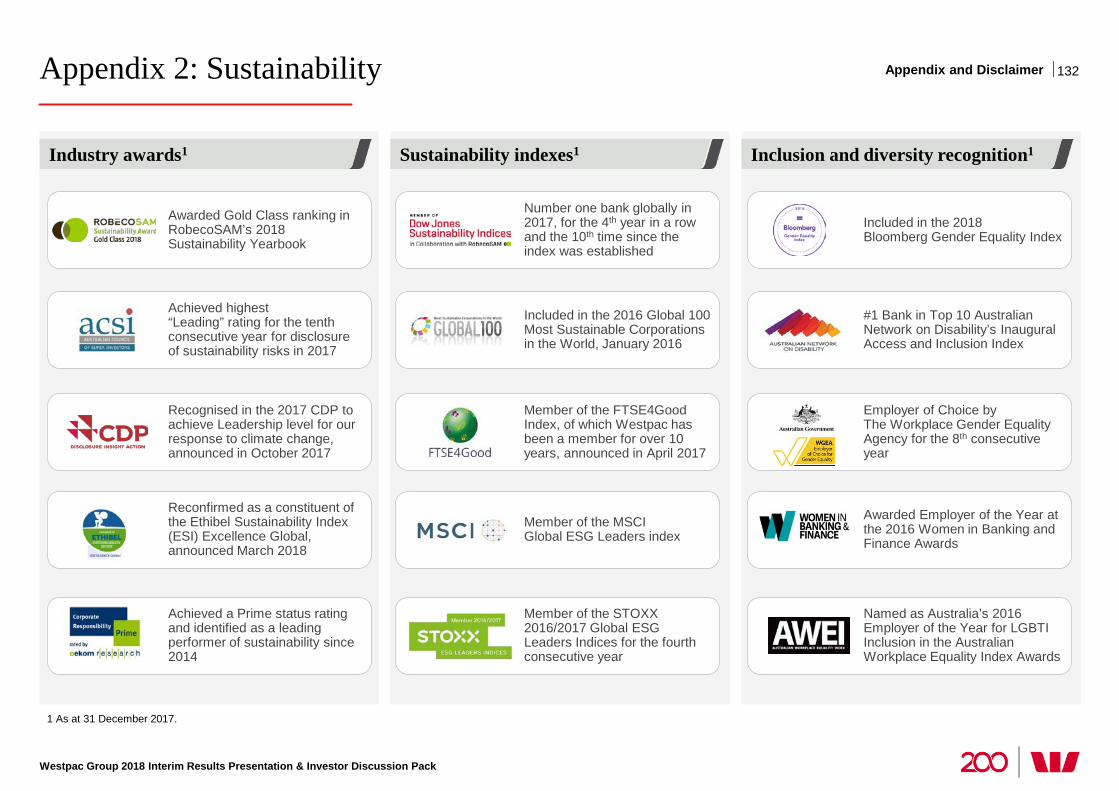
Appendix 2: Sustainability
Westpac Group 2018 Interim Results Presentation & Investor Discussion Pack
1 As at 31 December 2017.
Industry awards1
132
Sustainability indexes1 Inclusion and diversity recognition1
Achieved a Prime status rating and identified as a leading performer of sustainability since 2014
Member of the STOXX 2016/2017 Global ESG Leaders Indices for the fourth consecutive year
Named as Australia’s 2016 Employer of the Year for LGBTI Inclusion in the Australian Workplace Equality Index Awards
Reconfirmed as a constituent of the Ethibel Sustainability Index (ESI) Excellence Global, announced March 2018
Member of the MSCI Global ESG Leaders index
Awarded Employer of the Year at the 2016 Women in Banking and Finance Awards
Achieved highest “Leading” rating for the tenth consecutive year for disclosure of sustainability risks in 2017
Included in the 2016 Global 100 Most Sustainable Corporations in the World, January 2016
#1 Bank in Top 10 Australian Network on Disability’s Inaugural Access and Inclusion Index
Awarded Gold Class ranking in RobecoSAM’s 2018 Sustainability Yearbook
Number one bank globally in 2017, for the 4th year in a row and the 10th time since the index was established
Included in the 2018 Bloomberg Gender Equality Index
Recognised in the 2017 CDP to achieve Leadership level for our response to climate change, announced in October 2017
Member of the FTSE4Good Index, of which Westpac has been a member for over 10 years, announced in April 2017
Employer of Choice by The Workplace Gender Equality Agency for the 8th consecutive year
Appendix and Disclaimer
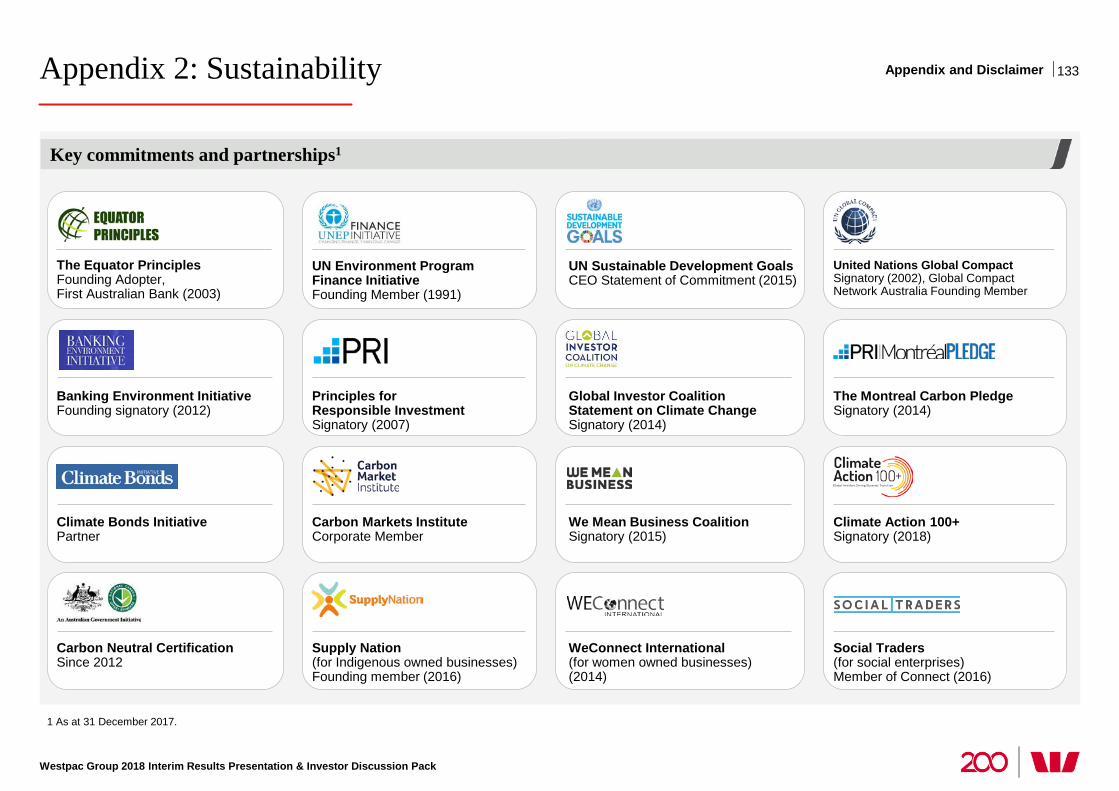
Appendix 2: Sustainability
Westpac Group 2018 Interim Results Presentation & Investor Discussion Pack
1 As at 31 December 2017.
Key commitments and partnerships1
133
The Equator Principles Founding Adopter, First Australian Bank (2003)
Banking Environment Initiative Founding signatory (2012)
Climate Bonds Initiative Partner
Carbon Neutral Certification Since 2012
UN Sustainable Development Goals CEO Statement of Commitment (2015)
Global Investor Coalition Statement on Climate Change Signatory (2014)
We Mean Business Coalition Signatory (2015)
WeConnect International (for women owned businesses) (2014)
United Nations Global Compact Signatory (2002), Global Compact Network Australia Founding Member
The Montreal Carbon Pledge Signatory (2014)
Climate Action 100+ Signatory (2018)
Social Traders (for social enterprises) Member of Connect (2016)
UN Environment Program Finance Initiative Founding Member (1991)
Principles for Responsible Investment Signatory (2007)
Carbon Markets Institute Corporate Member
Supply Nation (for Indigenous owned businesses) Founding member (2016)
Appendix and Disclaimer
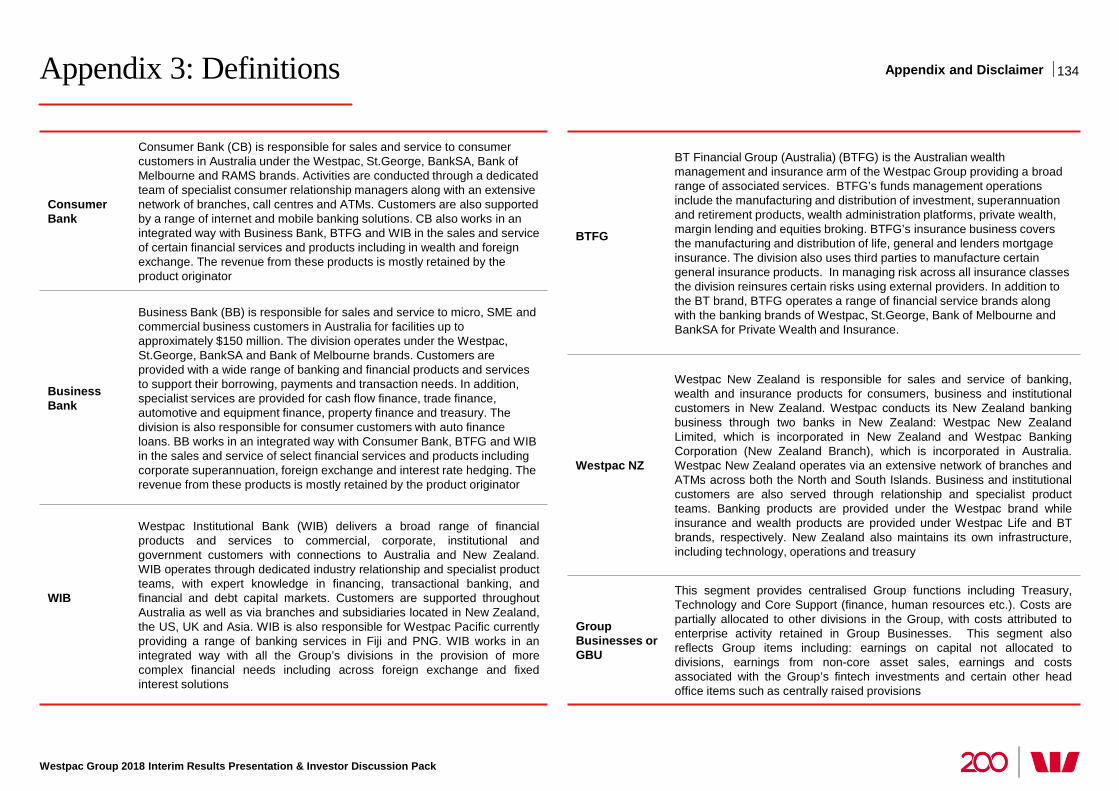
Appendix 3: Definitions
Westpac Group 2018 Interim Results Presentation & Investor Discussion Pack
134 Appendix and Disclaimer
Consumer Bank
Consumer Bank (CB) is responsible for sales and service to consumer customers in Australia under the Westpac, St.George, BankSA, Bank of Melbourne and RAMS brands. Activities are conducted through a dedicated team of specialist consumer relationship managers along with an extensive network of branches, call centres and ATMs. Customers are also supported by a range of internet and mobile banking solutions. CB also works in an integrated way with Business Bank, BTFG and WIB in the sales and service of certain financial services and products including in wealth and foreign exchange. The revenue from these products is mostly retained by the product originator
Business Bank
Business Bank (BB) is responsible for sales and service to micro, SME and commercial business customers in Australia for facilities up to approximately $150 million. The division operates under the Westpac, St.George, BankSA and Bank of Melbourne brands. Customers are provided with a wide range of banking and financial products and services to support their borrowing, payments and transaction needs. In addition, specialist services are provided for cash flow finance, trade finance, automotive and equipment finance, property finance and treasury. The division is also responsible for consumer customers with auto finance loans. BB works in an integrated way with Consumer Bank, BTFG and WIB in the sales and service of select financial services and products including corporate superannuation, foreign exchange and interest rate hedging. The revenue from these products is mostly retained by the product originator
WIB
Westpac Institutional Bank (WIB) delivers a broad range of financial products and services to commercial, corporate, institutional and government customers with connections to Australia and New Zealand. WIB operates through dedicated industry relationship and specialist product teams, with expert knowledge in financing, transactional banking, and financial and debt capital markets. Customers are supported throughout Australia as well as via branches and subsidiaries located in New Zealand, the US, UK and Asia. WIB is also responsible for Westpac Pacific currently providing a range of banking services in Fiji and PNG. WIB works in an integrated way with all the Group’s divisions in the provision of more complex financial needs including across foreign exchange and fixed interest solutions
BTFG
BT Financial Group (Australia) (BTFG) is the Australian wealth management and insurance arm of the Westpac Group providing a broad range of associated services. BTFG’s funds management operations include the manufacturing and distribution of investment, superannuation and retirement products, wealth administration platforms, private wealth, margin lending and equities broking. BTFG’s insurance business covers the manufacturing and distribution of life, general and lenders mortgage insurance. The division also uses third parties to manufacture certain general insurance products. In managing risk across all insurance classes the division reinsures certain risks using external providers. In addition to the BT brand, BTFG operates a range of financial service brands along with the banking brands of Westpac, St.George, Bank of Melbourne and BankSA for Private Wealth and Insurance.
Westpac NZ
Westpac New Zealand is responsible for sales and service of banking, wealth and insurance products for consumers, business and institutional customers in New Zealand. Westpac conducts its New Zealand banking business through two banks in New Zealand: Westpac New Zealand Limited, which is incorporated in New Zealand and Westpac Banking Corporation (New Zealand Branch), which is incorporated in Australia. Westpac New Zealand operates via an extensive network of branches and ATMs across both the North and South Islands. Business and institutional customers are also served through relationship and specialist product teams. Banking products are provided under the Westpac brand while insurance and wealth products are provided under Westpac Life and BT brands, respectively. New Zealand also maintains its own infrastructure, including technology, operations and treasury
Group Businesses or GBU
This segment provides centralised Group functions including Treasury, Technology and Core Support (finance, human resources etc.). Costs are partially allocated to other divisions in the Group, with costs attributed to enterprise activity retained in Group Businesses. This segment also reflects Group items including: earnings on capital not allocated to divisions, earnings from non-core asset sales, earnings and costs associated with the Group’s fintech investments and certain other head office items such as centrally raised provisions
Appendix 3: Definitions
Westpac Group 2018 Interim Results Presentation & Investor Discussion Pack
135 Appendix and Disclaimer
Capital ratios As defined by APRA (unless stated otherwise)
Risk weighted assets or RWA
Assets (both on and off-balance sheet) are risk weighted according to each asset’s inherent potential for default and what the likely losses would be in case of default. In the case of non-asset-backed risks (ie. market and operational risk), RWA is determined by multiplying the capital requirements for those risks by 12.5
Leverage ratio
As defined by APRA (unless stated otherwise). Tier 1 capital divided by ‘exposure measure’ and expressed as a percentage. ‘Exposure measure’ is the sum of on-balance sheet exposures, derivative exposures, securities financing transaction exposures and other off-balance sheet exposures
Internationally comparable ratios
Internationally comparable regulatory capital ratios are Westpac’s estimated ratios after adjusting the capital ratios determined under APRA Basel III regulations for various items. Analysis aligns with the APRA study titled “International capital comparison study” dated 13 July 2015
Liquidity coverage ratio (LCR)
An APRA requirement to maintain an adequate level of unencumbered high quality liquid assets, to meet liquidity needs for a 30 calendar day period under an APRA-defined severe stress scenario. Absent a situation of financial stress, the value of the LCR must not be less than 100%, effective 1 January 2015. LCR is calculated as the percentage ratio of stock of HQLA and CLF over the total net cash out-flows in a modelled 30 day defined stressed scenario
High quality liquid assets (HQLA)
Assets which meet APRA’s criteria for inclusion as HQLA in the numerator of the LCR
Committed liquidity facility (CLF)
The RBA makes available to Australian Authorised Deposit-taking Institutions a CLF that, subject to qualifying conditions, can be accessed to meet LCR requirements under APS210 Liquidity
Net stable funding ratio (NSFR)
The NSFR is defined as the ratio of the amount of available stable funding (ASF) to the amount of required stable funding (RSF) defined by APRA. The amount of ASF is the portion of an ADI’s capital and liabilities expected to be a reliable source of funds over a one year time horizon. The amount of RSF is a function of the liquidity characteristics and residual maturities of an ADI’s assets and off-balance sheet activities. ADI’s must maintain an NSFR of at least 100%
90 days past due and not impaired
Includes facilities where: • contractual payments of interest and / or principal are 90 or more
calendar days overdue, including overdrafts or other revolving facilities that remain continuously outside approved limits by material amounts for 90 or more calendar days (including accounts for customers who have been granted hardship assistance); or
• an order has been sought for the customer’s bankruptcy or similar legal action has been instituted which may avoid or delay repayment of its credit obligations; and
• the estimated net realisable value of assets / security to which Westpac has recourse is sufficient to cover repayment of all principal and interest, or where there are otherwise reasonable grounds to expect payment in full and interest is being taken to profit on an accrual basis.
These facilities, while in default, are not treated as impaired for accounting purposes
Collectively assessed provisions or CAPs
Loans not found to be individually impaired or significant will be collectively assessed in pools of similar assets with similar risk characteristics. The size of the provision is an estimate of the losses already incurred and will be estimated on the basis of historical loss experience for assets with credit characteristics similar to those in the collective pool. The historical loss experience will be adjusted based on current observable data. Included in the collectively assessed provision is an economic overlay provision which is calculated based on changes that occurred in sectors of the economy or in the economy as a whole
Appendix 3: Definitions
Westpac Group 2018 Interim Results Presentation & Investor Discussion Pack
136 Appendix and Disclaimer
Impaired assets
Includes exposures that have deteriorated to the point where full collection of interest and principal is in doubt, based on an assessment of the customer’s outlook, cashflow, and the net realisation of value of assets to which recourse is held and includes: • facilities 90 days or more past due, and full recovery is in doubt:
exposures where contractual payments are 90 or more days in arrears and the net realisable value of assets to which recourse is held may not be sufficient to allow full collection of interest and principal, including overdrafts or other revolving facilities that remain continuously outside approved limits by material amounts for 90 or more calendar days;
• non-accrual assets: exposures with individually assessed impairment provisions held against them, excluding restructured loans;
• restructured assets: exposures where the original contractual terms have been formally modified to provide for concessions of interest or principal for reasons related to the financial difficulties of the customer;
• other assets acquired through security enforcement (includes other real estate owned): includes the value of any other assets acquired as full or partial settlement of outstanding obligations through the enforcement of security arrangements; and
• any other assets where the full collection of interest and principal is in doubt
Individually assessed provisions or IAPs
Provisions raised for losses that have already been incurred on loans that are known to be impaired and are assessed on an individual basis. The estimated losses on these impaired loans is based on expected future cash flows discounted to their present value and, as this discount unwinds, interest will be recognised in the income statement
Stressed assets
Watchlist and substandard, 90 days past due and not impaired and impaired assets
Watchlist and substandard
Loan facilities where customers are experiencing operating weakness and financial difficulty but are not expected to incur loss of interest or principal
Total committed exposures (TCE)
Represents the sum of the committed portion of direct lending (including funds placement overall and deposits placed), contingent and pre-settlement risk plus the committed portion of secondary market trading and underwriting risk
Average interest-earning assets (AIEA)
The average balance of assets held by the Group that generate interest income. Where possible, daily balances are used to calculate the average balance for the period
Cash earnings per ordinary share
Cash earnings divided by the weighted average ordinary shares (cash earnings basis)
Core earnings Net operating income less operating expenses
Full-time equivalent employees (FTE)
A calculation based on the number of hours worked by full and part-time employees as part of their normal duties. The full-time equivalent of one FTE is 76 hours paid work per fortnight
Net interest margin (NIM)
Calculated by dividing net interest income by average interest-earning assets
Net tangible assets per ordinary share
Net tangible assets (total equity less goodwill and other intangible assets less minority interests) divided by the number of ordinary shares on issue (reported)
Weighted average ordinary shares (cash earnings)
Weighted average number of fully paid ordinary shares listed on the ASX for the relevant period
Women in Leadership
Women in Leadership refers to the proportion of women (permanent and maximum term) in leadership roles across the Group. It includes the CEO, Group Executive, General Managers, senior leaders with significant influence on business outcomes,(direct reports to General Managers and their direct reports), large (3+) team people leaders three levels below general manager, and Bank and Assistant Bank Managers
Appendix 3: Definitions
Westpac Group 2018 Interim Results Presentation & Investor Discussion Pack
137 Appendix and Disclaimer
Australian customers with wealth products metrics provider
Data based on DBM Consultants, Respondents aged 18+ and 12 month rolling. Wealth penetration is defined as the proportion of Australians who have a Deposit Product, Lending Product or Credit/Debit Card with a Banking Group and also have Managed Funds, Superannuation or Insurance with the same Banking Group. Note: Westpac and St.George use Managed Funds, Superannuation or Insurance with Westpac Group. Westpac includes Westpac and Challenge Bank. St.George includes St.George, BankSA, Bank of Melbourne, RAMS and Dragondirect. Westpac Group includes Westpac, Challenge Bank, St.George, BankSA, Bank of Melbourne, RAMS, Dragondirect, Advance Asset Management, Asgard, Bankers Trust, BT, Rothschild and Sealcorp. Peers includes: ANZ Group, CBA Group and NAB Group.
Customer satisfaction or CSat
The Customer Satisfaction score is an average of customer satisfaction ratings of the customer’s main financial institution for business banking on a scale of 0 to 10 (0 means ‘extremely dissatisfied’ and 10 means ‘extremely satisfied’)
CSat – overall consumer
Source: DBM Consultants Consumer Atlas, March 2016 – March 2018, 6MMA. MFI customers
CSat – overall business
Source: DBM Consultants Business Financial Services Monitor, March 2016 – March 2018, 6MMA. MFI customers, all businesses
C Sat (Westpac NZ)
3 month rolling Retail Market Monitor data (survey conducted by Camorra Research). Main bank customers are asked to rate the overall level of service they receive from their main bank on a scale of 1 (poor) to 5 (excellent). Results represent the % of customers who rate the service as either 4 (very good) or 5 (excellent), excluding “don’t know”
Westpac Group rank
The ranking refers to Westpac Group’s position relative to the other three major Australian banking groups (ANZ Group, CBA Group and NAB Group)
Net Promoter Score or NPS
Net Promoter Score measures the net likelihood of recommendation to others of the customer’s main financial institution. Net Promoter ScoreSM is a trademark of Bain & Co Inc., Satmetrix Systems, Inc., and Mr Frederick Reichheld. Using a scale of 0 to 10 (0 means ‘extremely unlikely’ and 10 means ‘extremely likely’), the 0-6 raters (detractors) are deducted from the 9-10 raters (promoters)
NPS – overall consumer
Source: DBM Consultants Consumer Atlas, March 2016 – March 2018, 6MMA. MFI customers
NPS – overall business
Source: DBM Consultants Business Financial Services Monitor, March 2016 – March 2018, 6MMA. MFI customers, all businesses
NPS – SME
Source: DBM Consultants Business Financial Services Monitor, March 2016 – March 2018, 6MMA. MFI customers, SME businesses. SME businesses are those organisations with annual turnover under $5 million (excluding Agribusinesses)
NPS Consumer (Westpac NZ)
Source: 3 month rolling Retail Market Monitor data (survey conducted by Camorra Research). Respondents are asked about likelihood to recommend their main bank to family and friends on a scale of 1 (extremely unlikely) to 10 (extremely likely). Net Promoter Score is represents % of Promoters (recommend score of 9 or 10) minus % of Detractors (recommend score of 1 to 6)
NPS Business (Westpac NZ)
Source: 6 month rolling Business Finance Monitor data (survey conducted by Kantar TNS among businesses with an annual turnover of $5 to $150 million). Respondents are asked about likelihood to recommend their main business bank to business colleagues and associates on a scale of 1 (extremely unlikely) to 10 (extremely likely). Net Promoter Score is represents % of Promoters (recommend score of 9 or 10) minus % of Detractors (recommend score of 1 to 6)
NPS Agri (Westpac NZ)
6 month rolling Agri Market Monitor data (survey conducted by Key Research). Respondents are asked about likelihood to recommend their main business bank to business colleagues, friends or family on a scale of 1 (extremely unlikely) to 10 (extremely likely). Net Promoter Score is represents % of Promoters (recommend score of 9 or 10) minus % of Detractors (recommend score of 1 to 6)
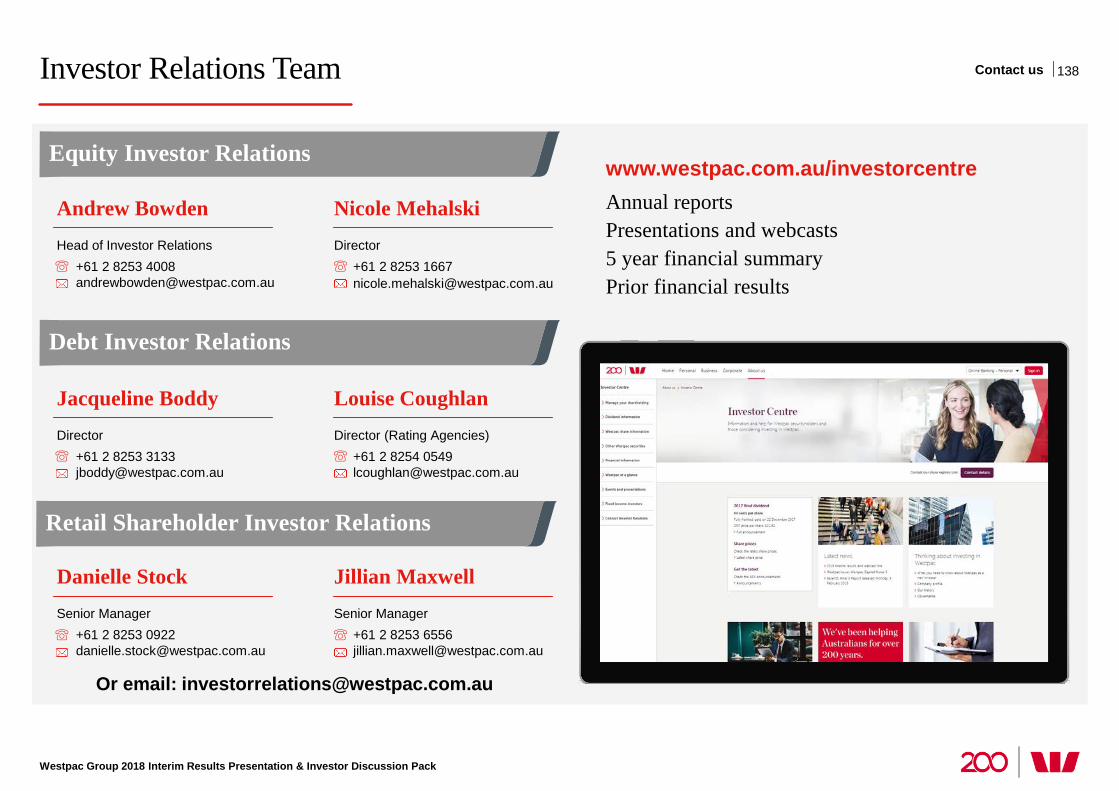
Westpac Group 2018 Interim Results Presentation & Investor Discussion Pack
Investor Relations Team 138 Contact us
Equity Investor Relations
Nicole Mehalski Director +61 2 8253 1667 [email protected]
Andrew Bowden Head of Investor Relations +61 2 8253 4008 [email protected]
Debt Investor Relations
Louise Coughlan Director (Rating Agencies) +61 2 8254 0549 [email protected]
Jacqueline Boddy Director +61 2 8253 3133 [email protected]
Retail Shareholder Investor Relations
Jillian Maxwell Senior Manager +61 2 8253 6556 [email protected]
Danielle Stock Senior Manager +61 2 8253 0922 [email protected]
Or email: [email protected]
www.westpac.com.au/investorcentre Annual reports Presentations and webcasts 5 year financial summary Prior financial results
Disclaimer
The material contained in this presentation is intended to be general background information on Westpac Banking Corporation (Westpac) and its activities.
The information is supplied in summary form and is therefore not necessarily complete. It is not intended that it be relied upon as advice to investors or potential investors, who should consider seeking independent professional advice depending upon their specific investment objectives, financial situation or particular needs. The material contained in this presentation may include information derived from publicly available sources that have not been independently verified. No representation or warranty is made as to the accuracy, completeness or reliability of the information.
All amounts are in Australian dollars unless otherwise indicated.
Unless otherwise noted, financial information in this presentation is presented on a cash earnings basis. Cash earnings is a non-GAAP measure. Refer to Westpac’s 2018 Interim Financial Results (incorporating the requirements of Appendix 4D) for the six months ended 31 March 2018 available at www.westpac.com.au for details of the basis of preparation of cash earnings. Refer to slide 36 for an explanation of cash earnings and Appendix 1 slide 131 for a reconciliation of reported net profit to cash earnings.
This presentation contains statements that constitute “forward-looking statements” within the meaning of Section 21E of the US Securities Exchange Act of 1934. Forward-looking statements are statements about matters that are not historical facts. Forward-looking statements appear in a number of places in this presentation and include statements regarding our intent, belief or current expectations with respect to our business and operations, market conditions, results of operations and financial condition, including, without limitation, future loan loss provisions, financial support to certain borrowers, indicative drivers, forecasted economic indicators and performance metric outcomes.
We use words such as ‘will’, ‘may’, ‘expect’, 'indicative', ‘intend’, ‘seek’, ‘would’, ‘should’, ‘could’, ‘continue’, ‘plan’, ‘probability’, ‘risk’, ‘forecast’, ‘likely’, ‘estimate’, ‘anticipate’, ‘believe’, ‘aim’, or other similar words to identify forward-looking statements. These forward-looking statements reflect our current views with respect to future events and are subject to change, certain risks, uncertainties and assumptions which are, in many instances, beyond our control, and have been made based upon management’s expectations and beliefs concerning future developments and their potential effect upon us. There can be no assurance that future developments will be in accordance with our expectations or that the effect of future developments on us will be those anticipated. Actual results could differ materially from those which we expect, depending on the outcome of various factors. Factors that may impact on the forward-looking statements made include, but are not limited to, those described in the Section titled ‘Risk factors' in Westpac’s 2018 Interim Financial Results for the six months ended 31 March 2018 (or Annual Report for the year ended 30 September 2017) available at www.westpac.com.au. When relying on forward-looking statements to make decisions with respect to us, investors and others should carefully consider such factors and other uncertainties and events. We are under no obligation to update any forward-looking statements contained in this presentation, whether as a result of new information, future events or otherwise, after the date of this presentation.
Westpac Group 2018 Interim Results Presentation & Investor Discussion Pack
139