Embed Size (px)
Citation preview

Investor Discussion Pack
Shayne Elliott Chief Financial Officer
AUSTRALIA AND NEW ZEALAND BANKING GROUP LIMITED
September 2013

Delivering ANZ‟s strategy
Super Regional Strategy To become the best connected and most respected bank across the region
Strengthen our position in Australia
& New Zealand
Manage risk, balance sheet and capital to drive superior return for shareholders
Capture faster growing regional
flows in trade, capital and wealth
Diversify revenue streams by product,
geography and customer
Drive operational efficiency and productivity
2
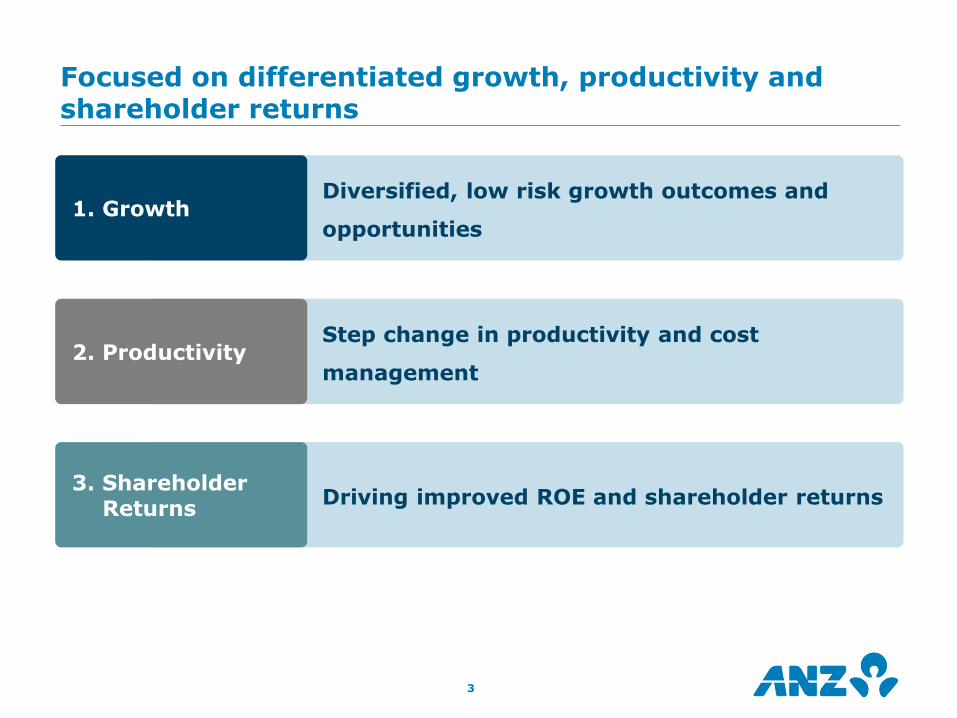
Focused on differentiated growth, productivity and shareholder returns
Diversified, low risk growth outcomes and
opportunities 1. Growth
Step change in productivity and cost
management 2. Productivity
Driving improved ROE and shareholder returns 3. Shareholder
Returns
3

Our differentiated strategy is delivering for shareholders and customers
Singapore – 2,100
Indonesia – 1,800
India – 5,600
Hong Kong – 1,000
Taiwan – 1,500
China – 800
Greater Mekong1 – 1,400
Philippines – 1,300
Japan & Korea – 200
Markets / No. Staff
Global Hub
ANZ has built a substantial business in Asia
Average 5 year GDP growth
2.9% 1.4%
7.8%
Australia New Zealand Asia
(ex. Japan)
Established network to support faster growing regional flows in trade, capital
and wealth
Intra-Asia Trade: US$1.6trn
Asia-US Trade: US$0.8trn
Asia-Europe Trade: US$1.0trn
Australia/NZ-Asia
Trade: US$235b
Source: World Trade Organisation
1. Greater Mekong includes Vietnam, Cambodia & Laos.
4

0%
10%
20%
30%
40%
50%
60%
70%
-75 -50 -25 0 25 50 75
Import
ant
Rela
tionship
s
Bank A
Bank B
Bank C
Bank F
Bank E
Bank D
Bank I
Bank H
Bank G
2012
Greenwich Quality Index1 - Overall Relationship Quality (Difference from the Average)
2011
2010
8,800 ~2,800 ~400
~200
6,900
ANZ Peer 1 Peer 2 Peer 3
Asia Staff (FTE)
We have built scale, capability and momentum in Asia
ANZ has built a substantial business in Asia
1. The Greenwich Quality Index score is based upon a normalized composite of all qualitative evaluations transformed to a scale of 0 to 1,000 with the difference from the average shown. Note: Cross-hairs are calculated by the average of the banks shown in graph.
A top 4 Corporate Bank in Asia
6% 12%
11%
11%
17%
24%
17%
15,700
Global Hubs
Significantly larger presence than domestic peers
Greenwich Associates Large Corporate Survey Overall Relationship Quality
322
622 877
1,257
1,840 2,109
1,024 1,085 1,135
FY07 FY08 FY09 FY10 FY11 FY12 1H12 2H12 1H13
USDm Asia Operating Income
+46% CAGR +11% PCP
5

Diversified, low risk growth outcomes and opportunities
New Zealand
Global Wealth
Australia
International & Institutional Banking
1.3x 1.2x
Mortgages Household Deposits
12 month growth vs system1
42.6 42.9 45.4
8.4 8.8 9.4
51.0 51.7 54.8
Mar 12 Sep 12 Mar 13
+8%
Australia
New Zealand
Funds Under Management ($b)
1. Source: Mortgage system based on RBA data. Household deposit system based on APRA banking statistics. 2. Source: RBNZ, Share of all providers. Mortgages at February 2013, Deposits as at December 2012
1.6x 1.4x
Mortgages Deposits
12 month growth vs system2
21% 23%
33% 34%
30% 26%
11% 11%
5% 6%
1H11 1H13
Partnerships
Retail Asia Pacific
Global Loans
Global Markets
Transaction Banking
Operating Income Mix 1H13
6

Step change in productivity and cost management
Operating Expense Growth Cost to Income Ratio
35%
40%
45%
50%
55%
1H12 2H12 1H13
Group
Australia Division
International & Institutional Banking Division
New Zealand Division
-8%
-3%
-10%
-2% -2% -1%
Group Australia IIB
1H13 v 2H12 1H13 v 1H12
-13%
-7%
-10%
-2%
New Zealand Global Wealth
7

Shareholders are benefitting from ANZ‟s momentum driving increased returns
Diverse Funding Mix Return on Equity
16.1%
15.2% 15.5%
14.7%
15.5%
1H11 2H11 1H12 2H12 1H13
Short Term Wholesale Funding Customer Funding
Term Debt < 1 year Residual Maturity
Shareholders equity & Hybrid debt
Term Debt > 1 year Residual Maturity
7% 8% 8% 8%
50% 57% 61% 61%
14%
16% 12% 11% 7%
6% 5% 5%
22% 13% 14% 15%
Sep 08 Sep 10 Sep 12 Mar 13
29% 19% 19% 20%
Ordinary Share Dividends Paid
2,396
3,213 3,665
3,919
1,769 2,003
2009 2010 2011 2012 1H12 1H13
$m
8
13 HALF YEAR
RESULTS
AUSTRALIA AND NEW ZEALAND BANKING GROUP LIMITED
30 April 2013
Balance Sheet & Treasury

Customer Deposits by Geography
Balance Sheet composition by Geography
10
Customer Lending1 by Geography
1. Customer lending represents Net Loans & Advances including acceptances
71%
11%
18%
43%
3%
14%
11% 1%
10%
10%
7%
1%
Australia
APEA
New Zealand
Australia Retail Mortgages
Australia Commercial
Australia Institutional
NZ Commercial
New Zealand Retail & Wealth
New Zealand Institutional
Australia Other Retail
APEA Retail & Wealth
APEA Commercial & Institutional
30%
12%
15%
4% 23%
11%
2%
3% 57%
27%
16% Australia
APEA
New Zealand
Australia Retail
Australia Institutional
NZ Commercial
New Zealand Retail & Wealth
New Zealand Institutional
Australia Commercial
APEA Retail & Wealth
APEA Commercial & Institutional

Customer Deposits by Segment
Balance Sheet composition by Segment
11
30%
4%
11%
13%
2%
15%
22%
3%
45%
15% 40%
Retail & Wealth
Commercial Institutional
Australia Retail & Wealth
New Zealand Retail & Wealth
Australia Commercial APEA
Institutional
Australia Institutional
New Zealand Institutional
APEA Retail & Wealth
New Zealand Commercial
Customer Lending1 by Segment
1. Customer lending represents Net Loans & Advances including acceptances
46%
2%
10%
14% 6%
11%
10%
1% 58%
20%
22%
Retail & Wealth
Commercial
Institutional
Australia Retail & Wealth
New Zealand Retail & Wealth
Australia Commercial
APEA Institutional
Australia Institutional
New Zealand Institutional
APEA Retail & Wealth
New Zealand Commercial

Capital levels are well positioned (CET1)
CET1 Tier-1 Total Capital
Mar-13 APRA 8.2% 9.8% 11.7%
10% allowance for investments in insurance subs and ADIs 0.8% 0.8% 0.7%
Mortgage 20% LGD floor and other measures 0.4% 0.5% 0.6%
IRRBB RWA (APRA Pillar 1 approach) 0.4% 0.5% 0.5%
Up to 5% allowance for deferred tax asset 0.2% 0.2% 0.2%
Other capital items 0.3% 0.3% 0.3%
Mar-13 Internationally Harmonised 10.3% 12.1% 14.0%
Capital position reconciliation under Basel 3
Capital overview
2.5% Capital Conservation
Buffer
4.5% CET1 Minimum
7.5% 7.8% 8.0% 8.2%
9.5% 9.8% 10.0% 10.3%
Sep 11 Mar 12 Sep 12 Mar 13
APRA Basel 3 Internationally Harmonised Basel 3
Strongly capitalised under new Basel 3 rules
• ANZ remains at the upper end of global peer
group under new B3 rules
• Well placed in regards to capital targets and
focused on driving capital efficiencies with further
initiatives completed in 1H13
• Full year Dividend Payout in the range of 65% to
70% of Cash Earnings with a bias towards the
upper end of the range in the near term.
12

8.02 8.18
10.30
1.01 0.16
0.01 (0.31) (0.18)
(0.53)
Sep-12APRA
Basel 3
CashNPAT (1)
RWAUsage (2)
Non RWABusiness
Usage (3)
CapitalInitiatives (4)
Dividends(net DRP)
Other (5) Mar-13APRA
Basel 3
Mar-13Internationally
Harmonised
Basel 3
1. Cash earnings net of pref shares. 2. Includes impact of expected loss versus eligible provision shortfall 3. Includes capital retention of deconsolidated entities, capitalised software (before write off) and other intangibles. 4. Includes external refinance of ANZ Wealth. 5. Includes net FX, Non-Core NPAT items, portfolio data review, net deferred tax assets.
Capital Position (APRA Basel 3 Common Equity Tier 1)
Up 16bps
Portfolio growth 25bp
Risk Migration (incl EL vs EP) flat
Non credit RWA 6bp
Organic capital generation and capital initiatives have improved capital levels
13

Deposit growth has stabilised
Short Term Wholesale Funding
Customer Funding
Term Debt < 1 year Residual Maturity
Shareholders equity & Hybrid debt
Term Debt > 1 year Residual Maturity
Liquid Assets Lending
Other Short Term Assets
Other Fixed Assets
Trade Loans
Shortened asset tenor
7% 8% 8% 8%
50% 57% 61% 61%
14%
16% 12% 11% 7%
6% 5% 5%
22% 13% 14% 15%
Sep 08 Sep 10 Sep 12 Mar 13
29% 19% 19% 20%
4% 4% 3% 3%
80% 77% 74% 71%
1% 2%
3% 4%
8% 7%
6% 8%
7% 10% 14% 14%
Sep 08 Sep 10 Sep 12 Mar 13
16% 19% 23% 26%
Structural liquidity position strengthened – driven by growth in customer funding and shortened asset tenor
14

50
100
150
200
2007 2008 2009 2010 2011 2012 2013
ANZ Westpac NAB CBA
Source: APRA (Feb 13) and latest bank published financial statements
$b
ANZ Westpac NAB CBA
Loan – Deposit Ratio (%) 128% 148% 146% 141%
Loan – Deposit Gap ($b) 97 167 156 157
Australia Household Funding Gap ($b) 112 184 126 170
ANZ has achieved a substantially lower LDR Australian Household Funding Gap
100%
120%
140%
160%
180%
Sep
2007
Sep
2008
Sep
2009
Sep
2010
Sep
2011
Sep
2012
Mar
2013
ANZ Loan – Deposit Ratio
Lowest structural funding gap provides funding flexibility
15

Senior Unsecured Government Guaranteed
Covered Bonds Subordinated
Issuance since 1-Apr-13
Note: Funding shown in year of issuance. Includes transactions with a call date or maturity date greater than 12 months at time of issue.
Issuance Maturities
$b
Indicative annual issuance volume
24
26 24
16
26
12 13
15
17 18
11
7 7
FY08
FY09
FY10
FY11
FY12
1H
13
2H
13
FY14
FY15
FY16
FY17
FY18
FY19+
A sustainable term wholesale funding profile
16

50bp
100bp
150bp
Sep 2011 Sep 2012 Sep 2013
Actual portfolio cost
Forecast portfolio cost basedon current market levels
Term Wholesale Funding Portfolio Costs Retail deposit and wholesale funding
margins (to 3mth BBSW)
0bp
50bp
100bp
150bp
200bp
Sep 2011 Mar 2012 Sep 2012 Mar 2013
Average Bank "special"Term Deposit Rate(all terms)
AUD Wholesale Bank UnsecuredFunding Rate(3 yrs, AA Rated)
Source: RBA, ANZ (3 month rolling averages)
-50bp
0bp
50bp
100bp
Sep 2011 Mar 2012 Sep 2012 Mar 2013
Deposit Rates VsWholesale Rates
Spread between retail deposit rates and wholesale funding rates
Portfolio wholesale funding costs stabilising, deposit costs remain relatively high
17

Internal RMBS
Private Sector Securities and precious metals
Cash, Government & Semi-Government Securities
35 47
62 68
9
13
15 15
31
31
38 39
75
91
115 122
Sep 10 Sep 11 Sep 12 Mar 13
Liquidity Portfolio Basel 3 Liquidity Rules
● In January 2013, the Basel Committee announced revised details on the Liquidity Coverage Ratio (“LCR”) including amendments to the outflow assumptions
● APRA is yet to finalise the LCR requirements for Australian banks, although this is expected shortly
● As a result of the shortage of HQLA (including Government bonds) in Australia, banks will be permitted to meet some of their liquidity requirement via the Committed Liquidity Facility (“CLF”)
● The size and availability of the CLF has yet to be agreed with APRA and the RBA
Strong liquid asset position
18

AUD
65%
NZD 18% Hedges in place for ~70% FY13
earnings
Non AUD & NZD 17%
Hedges in place for ~70% FY13
earnings
USD
CNY
IDR
Other PGK
MYR TWD
1H13 Earnings composition by Currency EPS impact from Hedging
-0.40%
0.60%
-0.90%
0.10%
1H13 HOH 1H13 PCP
Inclusive of Hedging Unhedged
Hedging has partially offset the impact on earnings of sustained $A strength
19

2
3
4
5
6
2H10 1H11 2H11 1H12 2H12 1H13
Australia Capital and Replicating Portfolio
New Zealand Capital and Replicating Portfolio
Portfolio Earnings rate
(%)
Average Cash Rate (%)
25
30
35
40
45
2H10 1H11 2H11 1H12 2H12 1H13
0
1
2
3
4
5
6
2H10 1H11 2H11 1H12 2H12 1H13
0
5
10
15
2H10 1H11 2H11 1H12 2H12 1H13
Average Cash Rate (%)
Portfolio Earnings rate
(%)
Contribution to Group NIM (ex Markets)
Contribution to Group NIM (ex Markets)
bps
bps
Portfolio Earnings & Spread to Cash
Portfolio Earnings & Spread to Cash
HOH Impact: -4.3 bps
HOH Impact: -0.5 bps
Benefit to 1H13 Group NIM (ex
Markets) is +3 bps
Benefit to 1H13 Group NIM (ex
Markets) is +8 bps
Capital and Replicating Portfolio – Earnings impacted by lower interest rates, but portfolio management mitigates full impact
%
%
20

13 HALF YEAR RESULTS
AUSTRALIA AND NEW ZEALAND BANKING GROUP LIMITED
30 April 2013
Investor Discussion Pack
Risk Management

Credit quality in line with expectations
22
Credit Quality trends Provision Charge
Impaired Assets
0
1,000
2,000
3,000
4,000
5,000
6,000
7,000
1H09 2H09 1H10 2H10 1H11 2H11 1H12 2H12 1H13
$m Gross Impaired Assets New Impaired Assets
-0.20%0.00%0.20%0.40%0.60%0.80%1.00%1.20%1.40%1.60%
-2500
250500750
1,0001,2501,5001,7502,000
1H
07
2H
07
1H
08
2H
08
1H
09
2H
09
1H
10
2H
10
1H
11
2H
11
1H
12
2H
12
1H
13
$m Individual Provision Charge (LHS)
Collective provision Charge (LHS)
Total Provision Charge as % Avg. net Advances
Avg. $0.4b decline in Gross Impaired Assets
HOH since 2H10
• The 1H13 Provision charge of $599m
represents a 13% reduction HOH
• This lower Provision charge driven by
reduction in both new individual provisions
and top-up provisions to existing impaireds
• ANZ remains appropriately provided for the
collective provision ratio at 1.01% following
the introduction of APRA Basel III standards
(1.06% on a Basel II basis)
• This coverage level reflects the ongoing
improvement in credit quality of the Group's
portfolio
• New impaired assets declined 15% HOH to
$1.6b, with all divisions seeing HOH
reductions in new impaireds
• Gross impaired assets reduced 10% HOH to
$4.7b

Collective Provisioning Coverage reflects Global Institutional Portfolio credit quality improvement
Global Institutional Sub Investment Grade1 Exposures continue to decline Trend in Global Institutional composition
Global Institutional Portfolio composition
0%
5%
10%
15%
20%
25%
30%
35%
40%
0
20
40
60
80
100
120
140
160
FY09 FY10 FY11 FY12 1H13 Institu
tional (%
of
sub-i
nvestm
ent
gra
de lendin
g)
CP /
Cre
dit R
WA (
bps)
Group CP/CRWA Ratio (Basel III)
Group CP/CRWA Ratio (Basel II)
Institutional Sub-Investment Grade Exposure (RHS)Investment Grade Sub-Investment Grade Default
FY09 Total Portfolio: $187b
66%
1H13 Total Portfolio: $286b
32%
2%
1%
21%
78%
20%
30%
40%
50%
60%
0
100
200
300
400
FY09 FY10 FY11 FY12 1H13
Investment Grade (LHS) Sub-Investment Grade (LHS)
Default (LHS) Institutional Basel II CRWA Rate
CRWA Rate2
Global Institutional Credit Exposure $b
1. Sub-investment grade defined as exposures with a rating below BBB- 2. CRWA Rate defined as Credit Risk Weighted Assets as a percentage of Exposure at Default (EAD)
23

Individual Provision Charge
24
Individual Provision Charge by Segment Individual Provision Charge Composition
Individual Provision Charge by Region
0
200
400
600
800
1,000
1,200
1H10 2H10 1H11 2H11 1H12 2H12 1H13
$m
Australia New Zealand APEA
1,062
761
595 618 722
915
595
-500
0
500
1,000
1,500
1H10 2H10 1H11 2H11 1H12 2H12 1H13
$m
New Increased Writebacks & Recoveries
915 1,062 761
595 618 722
595
0
200
400
600
800
1,000
1,200
1H10 2H10 1H11 2H11 1H12 2H12 1H13
$m
Institutional Commercial Consumer
1,062
761
595 618
722
915
595

Continued improvement in Credit RWA rate
25
Group Exposure at Default and Credit Risk Weighted Assets
Global Institutional Exposure at Default and Credit Risk Weighted Assets
522
550 564
615 630
658
692
220 234 233
249 250 255 261
42% 42% 41% 40% 40%
39% 38%
40%
Mar 10 Sep 10 Mar 11 Sep 11 Mar 12 Sep 12 Mar 13
Exposure at Default ($b)
Basel II Credit Risk Weighted Assets ($b)
CRWA / EAD (%) - Basel II
CRWA / EAD (%) - Basel III
275 Basel III CRWAs
193 206 203
239 248 265
287
100 110 101 112 113 115 117
52%
54%
50%
47% 46%
43%
41%
45%
Mar 10 Sep 10 Mar 11 Sep 11 Mar 12 Sep 12 Mar 13
Exposure at Default ($b)
Basel II Credit Risk Weighted Assets ($b)
CRWA / EAD (%) - Basel II
CRWA / EAD (%) - Basel III
130 Basel III CRWAs

Risk Weighted Assets
26
Total Risk Weighted Assets Total Risk Weighted Assets
movement 1H13 v 2H12
Total Risk Weighted Assets movement by Division 1H13 v 2H12
220 234 233
249 250 255 261 275
29
31 31
31 35
45 48
48
249
264 264
280 285
300 309
323
Mar 10 Sep 10 Mar 11 Sep 11 Mar 12 Sep 12 Mar 13Basel II
Mar 13Basel
III
Market & Operational Risk Weighted Assets
Credit Risk Weighted Assets
300.1
322.6 6.0
14.1 2.4
0.0
2H12 Basel IICredit Risk
Basel IIICredit RiskImpacts
Markets &IRRBB Risk
OperationalRisk
1H13Basel III
Basis
$b
300.1 322.6
7.0 13.7 1.0 0.8
2H12 Australia IIB NZ GWPB 1H13Basel III
Basis
$b
$b
Up 7%
Up 7%

254.9
275.0 14.1
0.8
9.0
2.1
0.1
2H12 Basel IIIIntro-
duction
Risk Growth PortfolioData
Review
FXImpact
1H13
Credit Risk Weighted Assets
27
Credit Risk Weighted Assets ($b) Credit Risk Weighted Assets movement 1H13 v 2H12 ($b)
Credit Risk Weighted Assets movement by Division 1H13 v 2H12 ($b)
254.9 260.9 275.0
2.6 2.6 1.4
0.6
0.2 12.5 0.1 1.3
2H
12
Austr
alia
IIB
NZ
Oth
er
1H
13
Basel II
Austr
alia
IIB
NZ
Oth
er
1H
13
Basel II
I
258
230 220
234 233 249 250 255 261
1.06%
1.32%
1.38%
1.35% 1.36%
1.28%
1.20%
1.08% 1.06%
1.01%
Mar 09 Sep 09 Mar 10 Sep 10 Mar 11 Sep 11 Mar 12 Sep 12 Mar 13
Basel II Credit Risk Weighted Assets
Collective Provision as a % of CRWA (Basel II)
Collective Provision as a % of CRWA (Basel III)
275 Basel III CRWAs
Basel II Impacts Basel III Impacts
Up 8%

Control List and Risk Grade Profiles
28
Group Sub-Investment Grade1 Exposures
as % Exposure at Default Control List
Group Risk Grade Profile
0
50
100
150
200
250
300
Sep 0
8
Mar
09
Sep 0
9
Mar
10
Sep 1
0
Mar
11
Sep 1
1
Mar
12
Sep 1
2
Mar
13
Control List by Limits Control List by No. Groups
72% 72% 74% 74% 76% 77% 78%
28% 28% 26% 26% 24% 23% 22%
Mar 10 Sep 10 Mar 11 Sep 11 Mar 12 Sep 12 Mar 13
Investment Grade Sub-Investment Grade
6% 6% 6% 6% 5% 5% 4%
9% 9% 8% 8%
7% 7% 7%
13% 13%
12% 12%
12% 11%
11%
Mar 10 Sep 10 Mar 11 Sep 11 Mar 12 Sep 12 Mar 13
13% 13% 12% 12% 12% 11%
9%9%
8% 8%7% 8%
6%6%
6%6%
5% 5%
Mar 10 Sep 10 Mar 11 Sep 11 Mar 12 Sep 12
BB+ to BB BB- <BB-
Index Sep 08 = 100
28% 28%
26% 26%
24% 23%
22%
1. Sub-investment grade defined as exposures with a rating below BBB-
1

Gross Impaired Assets
29
Gross Impaired Assets by Type Gross Impaired Assets by Size of Exposure
0
1,000
2,000
3,000
4,000
5,000
6,000
7,000
8,000
Mar 10 Sep 10 Mar 11 Sep 11 Mar 12 Sep 12 Mar 13
$m Impaired Loans NPCCD Restructured
6,561 6,561 6,221
5,581 5,343
5,196
0
1,000
2,000
3,000
4,000
5,000
6,000
7,000
8,000
Mar 10Sep 10Mar 11Sep 11Mar 12Sep 12Mar 13
$m > $100m $10-$99m < $10m
6,561 6,561 6,221
5,581 5,343
5,196
4,685 4,685
Avg. $375m decline HOH since 2H10

Impaired Assets
30
New Impaired Assets by Division Net Impaired Assets by Division
0
500
1,000
1,500
2,000
2,500
3,000
3,500
1H10 2H10 1H11 2H11 1H12 2H12 1H13
Institutional Australia New Zealand Other
0
1,000
2,000
3,000
4,000
5,000
6,000
Mar 10 Sep 10 Mar 11 Sep 11 Mar 12 Sep 12 Mar 13
Institutional Australia New Zealand Other
3,126
2,319 2,437
1,831
2,356
1,847
4,968 4,686 4,503 3,884 3,630 3,423
Impaired Assets Concentration by number of Customers
Impaired Assets Concentration by value of Impaired Assets
20% 29%
39% 37% 39% 42% 47% 22%
29% 29% 31% 28% 18%
21% 25% 11%
8% 5% 11% 16%
9%
33% 31% 24% 27% 22% 24% 23%
Mar 10 Sep 10 Mar 11 Sep 11 Mar 12 Sep 12 Mar 13
10-50m 51-100m 101-200m >200m
61% 72% 78% 77% 78% 82% 83%
22% 20%
18% 19% 16% 11% 11% 11% 4%
2% 1% 3% 4% 3% 6% 4% 2% 3% 3% 3% 3%
Mar 10 Sep 10 Mar 11 Sep 11 Mar 12 Sep 12 Mar 13
10-50m 51-100m 101-200m >200m
1,571 3,142
$m $m

Total lending exposures by Geography
31
Exposure by Geography Exposure at Default by Line of Business
55%
17%
28%
Australia
47%
29%
24%
New Zealand
5% 1%
94%
APEA
Retail
Commercial
Institutional
Retail
Commercial
Institutional
Retail
Commercial
Institutional
2%
3%
3%
5%
1%
4%
3%
Australia 63%
APEA 21%
New Zealand 16%
UK & Europe
Americas
Pacific
Singapore
Hong Kong
Other South East Asia
Other North East Asia
Total Exposure at Default (Mar 13) - $693.2b1
Australia New Zealand APEA
$437.1 $111.5 $144.6
1. EAD excludes amounts for „Securitisation‟ and „Other Assets‟ Basel asset classes

Total lending exposures by industry sector
32
Category EAD % in Non
Performing
Sep 12 Mar 13 Sep 12 Mar 13
Consumer Lending 41.0% 40.4% 0.3% 0.2%
Finance, Investment & Insurance
14.9% 16.8% 0.5% 0.2%
Property Services 7.5% 7.1% 1.6% 1.6%
Manufacturing 6.0% 6.1% 1.2% 1.0%
Agriculture, Forestry, Fishing
4.5% 4.2% 3.9% 4.1%
Government & Official Institutions
4.2% 3.9% 0.0% 0.0%
Wholesale trade 3.9% 4.0% 0.6% 0.6%
Retail Trade 2.9% 2.9% 0.9% 0.8%
Transport & Storage 2.3% 2.2% 3.2% 2.0%
Business Services 2.0% 1.9% 0.9% 0.7%
Electricity, Gas & Water Supply
1.8% 1.7% 0.2% 0.1%
Construction 1.7% 1.6% 1.4% 1.2%
Resources (Mining) 1.6% 1.8% 0.2% 0.2%
Other 5.7% 5.4% 0.1% 0.1%
Exposure at Default (EAD) as a % of group total
40%
17% 7%
6%
4%
4%
4%
3%
2% 2%
2% 2%
2% 5%
ANZ Group
Total EAD (Mar 13)
$693.2b

Global Agriculture
33
Agriculture Exposure by Sector (EAD) Agriculture Exposure by Geography
Agriculture Security Levels 37%
14%
10%
14%
3%
8%
4% 6% 4%
Dairy Beef
Sheep & Other Livestock Grain
Wheat Horticulture/Fruit
Other Crops Forestry & Fishing
Agriculture Services
42%
1%
57%1
Australia
APEA
New Zealand
70% 56%
80%
17% 25%
11% 7%
10% 4%
6% 9% 5%
Group Australia New Zealand
Fully Secured 80-100% Secured
60-80% Secured <60% Secured
Agriculture
Total EAD (Mar 13) As a % of Group EAD
$29.2b 4.2%
1. 60% of NZ Agriculture exposure is to Dairy Cattle Farming

Manufacturing
34
Risk Rating Profile (% EAD) Exposure Mix by Geography (EAD)
Total Exposure by Geography (EAD)
75% 63%
86%
25% 37%
14%
Group Australia APEA
Investment Grade Sub-Investment Grade
35% 43%
48% 55%
49% 43%
41% 35%
16% 14% 11% 10%
Sep 10 Sep 11 Sep 12 Mar 13
APEA Australia New Zealand
0
10
20
30
40
50
Sep 10 Sep 11 Sep 12 Mar 13
APEA Australia New Zealand
$b
Manufacturing
Total EAD (Mar 13) As a % of Group EAD
$41.9b 6.1%
1. Sub-investment grade defined as exposures with a rating below BBB-
1

Resources
35
Resources Exposure by Sector (% EAD) Resources Exposure by Geography (EAD)
Resources Exposure by Geography (EAD) 35%
16%
23%
18%
8%
Oil & Gas Coal
Metal Ore Mining Services
Other
56%
20%
5%
19%
Australia
Asia
New Zealand
Europe, America,
Pacific & Other
0
5
10
15
Sep 10 Sep 11 Sep 12 Mar 13
$b
Australia Non-Australia
Includes Iron Ore 5%
Resources
Total EAD (Mar 13) As a % of Group EAD
$12.5b 1.8%

Commercial Property credit exposure
36
Commercial Property Exposure Gross Loans and Advances by Region Commercial Property Exposure by Sector
Exposure to REIT‟s, Listed Property Companies and/or their subsidiaries
21.3 19.9 20.8 21.3 22.1 21.2
6.1
5.2 5.9 5.0
5.3 5.2
0.8
1.0 1.1 3.0
3.5 3.8
6.9%
6.2%
6.4%
6.6%
6.8%
7.0%
7.2%
7.4%
7.6%
7.8%
8.0%
0
5
10
15
20
25
30
35
Sep 08 Sep 09 Sep 10 Sep 11 Sep 12 Dec 12
APEA (LHS) New Zealand (LHS)
Australia (LHS) % of Group GLA's (RHS)
26%
30%
25%
14%
2% 3%
Offices
Retail
Residential
Industrial
Tourism
Other
29% 71%
Exposure to REITs, listed
property companies and/or their subsidiaries
Other Commercial
Property
28.2 26.1
27.8 29.3
30.9 30.2
$b % GLA
% GLA

Australia 90+ day delinquencies
37
Australia Retail 90+ day delinquencies
Australia Commercial 90+ day delinquencies
0.0%
0.5%
1.0%
1.5%
2.0%
Mar 08 Sep 08 Mar 09 Sep 09 Mar 10 Sep 10 Mar 11 Sep 11 Mar 12 Sep 12 Mar 13
Total Mortgage Portfolio NSW & ACT Mortgages QLD Mortgages
VIC Mortgages WA Mortgages Total Credit Cards
0.0%
0.5%
1.0%
1.5%
2.0%
2.5%
3.0%
Mar 08 Sep 08 Mar 09 Sep 09 Mar 10 Sep 10 Mar 11 Sep 11 Mar 12 Sep 12 Mar 13
Business Banking Regional Business Banking Esanda Small Business Banking Total Commercial

Australia Division - Mortgages
38
1. One month or more ahead of repayments. Excludes funds in offset accounts. 2. % of Portfolio of Instalment Loans. Excludes funds in Equity Manager Accounts.
Mortgages have low loss rates
Individual Provision Loss Rates
1H11 2H11 1H12 2H12 1H13
Group 0.32% 0.31% 0.36% 0.43% 0.27%
Australia Mortgages 0.01% 0.03% 0.03% 0.02% 0.01%
Dynamic Loan to Valuation Ratio
Mortgage portfolio by State
Portfolio statistics
Total Number of Mortgage Accounts 860k
Total Mortgage FUM $188b
% of Total Australia Region Lending 60%
% of Total Group Lending 43%
Owner Occupied Loans - % of Portfolio 62%
Average Loan Size at Origination $262k
Average LVR at Origination 65%
Average Dynamic LVR of Portfolio 52%
% of Portfolio Ahead on Repayments1 59%
First Home Owners - % of New Lending 6%
% of Portfolio Paying Interest Only2 32%
0%
10%
20%
30%
40%
50%
60%
0-60% 61-75% 76-80% 81-90% 91-95% 95%+
Mar-11 Sep-11 Mar-12 Sep-12 Mar-13
% Portfolio
Portfolio >90% LVR = 4.5% (Mar 13)
26%
18%
30%
16% 10%
NSW & ACT
QLD
VIC
WA
Other

New Zealand - Mortgages
39
1. 12 month average 2. Excludes revolving credit facilities
Dynamic Loan to Valuation Ratio
Mortgage portfolio by Region
Portfolio statistics
Total Number of Mortgage Accounts 474k
Total Mortgage FUM NZD 57b
% of Total New Zealand Lending 56%
% of Total Group Lending 10%
Owner Occupied Loans - % of Portfolio 78%
Average Loan Size at Origination1 NZD 229k
Average LVR at Origination 66%
Average Dynamic LVR of Portfolio 47%
% of Portfolio Paying Interest Only2 21%
38%
12% 6%
29%
12% 3%
Auckland
Wellington
Christchurch
Rest of North Island
Rest of South Island
Other
Mortgages have low loss rates
Individual Provision Loss Rates
1H11 2H11 1H12 2H12 1H13
Group 0.32% 0.31% 0.36% 0.43% 0.27%
New Zealand Mortgages 0.06% 0.07% 0.05% 0.03% 0.02%
41%
17%
21%
12%
9% 0-60%
61-70%
71-80%
81-90%
90%+

New Zealand Geography – credit quality
40
Net impaired assets Total provision charge
90+ days delinquencies (New Zealand Division)
1,230
1,463
1,685
1,307
1,169
990
884 1.26%
1.50%
1.74%
1.38%
1.23%
1.02%
0.90%
Mar 10 Sep 10 Mar 11 Sep 11 Mar 12 Sep 12 Mar 13
Net Impaired Assets NIA as % GLA
NZDm
-100
0
100
200
300
400
1H10 2H10 1H11 2H11 1H12 2H12 1H13
NZDm
IP Charge CP Charge
1. Spikes in 2012 Commercial 90 day delinquencies are primarily due to internal classifications rather than any deterioration in underlying credit quality.
325
131 85
105 98 96
43
0.0%
0.4%
0.8%
1.2%
2007 2008 2009 2010 2011 2012 2013
Mortgages Commercial Rural1

13 HALF YEAR RESULTS
AUSTRALIA AND NEW ZEALAND BANKING GROUP LIMITED
30 April 2013
Investor Discussion Pack
Divisional Snapshots
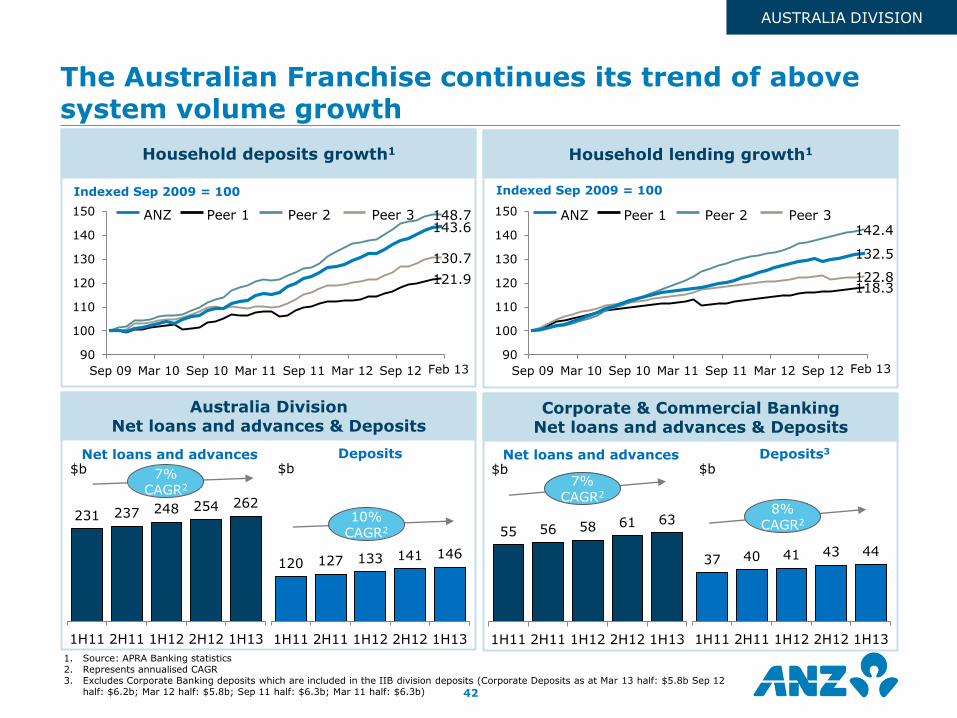
The Australian Franchise continues its trend of above system volume growth
42
1. Source: APRA Banking statistics 2. Represents annualised CAGR 3. Excludes Corporate Banking deposits which are included in the IIB division deposits (Corporate Deposits as at Mar 13 half: $5.8b Sep 12
half: $6.2b; Mar 12 half: $5.8b; Sep 11 half: $6.3b; Mar 11 half: $6.3b)
Household lending growth1 Household deposits growth1
Corporate & Commercial Banking Net loans and advances & Deposits
Australia Division Net loans and advances & Deposits
120 127 133 141 146
1H11 2H11 1H12 2H12 1H13
231 237 248 254 262
1H11 2H11 1H12 2H12 1H13
Net loans and advances Deposits $b $b
10% CAGR2
7% CAGR2
37 40 41 43 44
1H11 2H11 1H12 2H12 1H13
55 56 58 61 63
1H11 2H11 1H12 2H12 1H13
Net loans and advances Deposits3
$b $b
Feb 13 Feb 13
7% CAGR2
8% CAGR2
121.9
130.7
148.7 143.6
90
100
110
120
130
140
150
Sep 09 Mar 10 Sep 10 Mar 11 Sep 11 Mar 12 Sep 12
118.3 122.8
142.4
132.5
90
100
110
120
130
140
150
Sep 09 Mar 10 Sep 10 Mar 11 Sep 11 Mar 12 Sep 12
ANZ Peer 1 Peer 2 Peer 3
Indexed Sep 2009 = 100 Indexed Sep 2009 = 100
ANZ Peer 1 Peer 2 Peer 3
AUSTRALIA DIVISION

0%
10%
20%
30%
40%
50%
60%
0-60% 61-75% 76-80% 81-90% 91-95% 95%+
Mar 11 Sep 11 Mar 12 Sep 12 Mar 13
Strong mortgage performance
43
• Strong volume growth
Increase in mortgage market share from 14.5% (Feb 12) to 14.7% (Feb 13)1
Above system mortgage growth for 13 consecutive quarters1
Leveraging our network capability and driving growth from other channels delivered a 10% increase YOY in proprietary mortgage sales
• Divisional margin improved 3 bps HOH as a result of active management of pricing, basis, discounting, broker commissions, and an increase in proprietary mortgage sales
• Asset quality maintained
Continued acquisition focus on 75-90% LVR
Over 95% of mortgage portfolio has a dynamic LVR less than 90%
No change in underwriting standards
90+ delinquencies down 2bps HOH to 41 bps
Mortgagee in Possession volumes reduced by 13%
Mortgages growth
Asset quality remains strong
179
182
188
Mar 12 Sep 12 Mar 13
862
871
884
Mar 12 Sep 12 Mar 13
Mortgage FUM
$b „000
Number of accounts
Dynamic Loan to Valuation Ratio % Portfolio Portfolio >90% LVR
= 4.5% (Mar 13)
1. Source: APRA Banking statistics excluding the impact of the sale of Origin Mortgage Management Services
AUSTRALIA DIVISION
251
308
Proprietary Broker
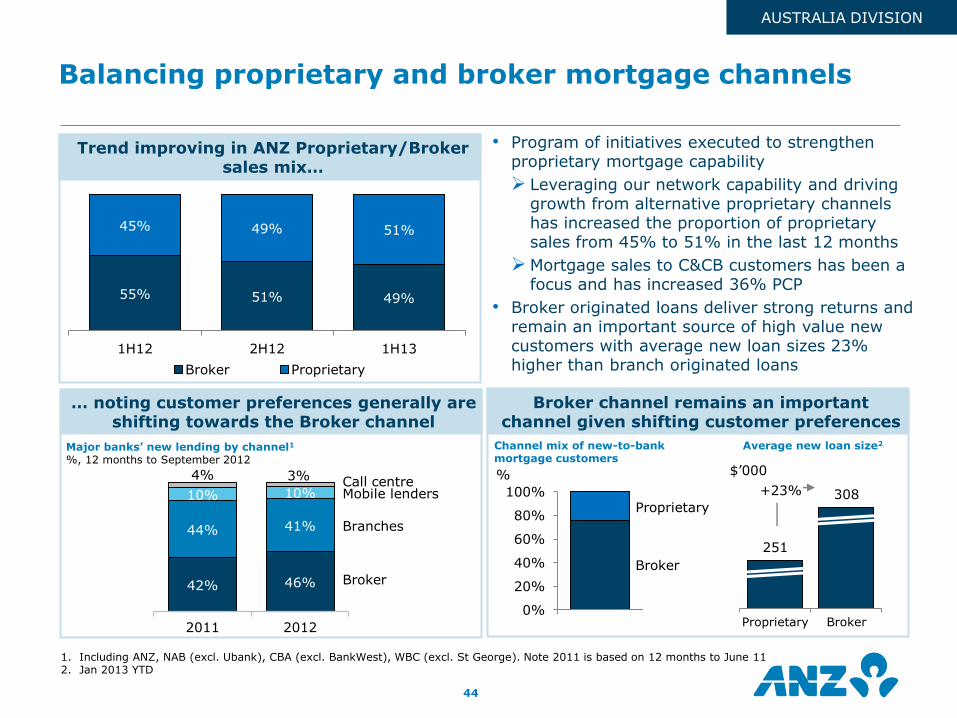
Balancing proprietary and broker mortgage channels
44
• Program of initiatives executed to strengthen proprietary mortgage capability
Leveraging our network capability and driving growth from alternative proprietary channels has increased the proportion of proprietary sales from 45% to 51% in the last 12 months
Mortgage sales to C&CB customers has been a focus and has increased 36% PCP
• Broker originated loans deliver strong returns and remain an important source of high value new customers with average new loan sizes 23% higher than branch originated loans
1. Including ANZ, NAB (excl. Ubank), CBA (excl. BankWest), WBC (excl. St George). Note 2011 is based on 12 months to June 11 2. Jan 2013 YTD
Major banks‟ new lending by channel1
%, 12 months to September 2012
55% 51% 49%
45% 49% 51%
1H12 2H12 1H13
Broker Proprietary
Trend improving in ANZ Proprietary/Broker sales mix…
… noting customer preferences generally are shifting towards the Broker channel
Broker channel remains an important channel given shifting customer preferences
Channel mix of new-to-bank mortgage customers
Average new loan size2
+23%
0%
20%
40%
60%
80%
100%Proprietary
Broker
$‟000 %
Broker
Mobile lenders Call centre
Branches
42% 46%
44% 41%
10% 10%
4% 3%
2011 2012
AUSTRALIA DIVISION

41 43 44
Mar 12 Sep 12 Mar 13
58 61 63
Mar 12 Sep 12 Mar 13
Corporate & Commercial Banking growing strongly
45
• 1H13 cash profit up 8% HOH driven by strong asset growth and tight cost control
• Strong volume growth with net loans and advances up 9% and deposits up 7% over the 12 months to March 2013
Asset growth over past 12 months has outperformed system growth in the business lending market1
• Overall margin flat with improvement in lending margin offset by impact of lower interest rate environment and deposit price competition
1. System represents business lending as reported in RBA Lending and Credit Aggregates monthly data series, scaled to APRA total lending to business (excluding APRA non-fin corps lending) data series on a quarterly basis
2. Excludes Corporate Banking deposits which are included in the IIB division deposits (Corporate Deposits as at Mar 13 half: $5.8b Sep 12 half: $6.2b; Mar 12 half: $5.8b; Sep 11 half: $6.3b; Mar 11 half: $6.3b)
3. Numbers reported post tax
$b $b
543
589
33
4
3 7
7
2H12 Volume Margin Other Expenses Prov-isions
1H13
$m
Up 8%
Cash Profit movement – 1H13 v 2H123
Deposits2 Lending
+9%
+7%
AUSTRALIA DIVISION

Whole of customer focus delivering 11% cross sell revenue growth
Asset quality being maintained Revenue per FTE up, cost per FTE declining
160
180
200
220
240
260
280
300
460
480
500
520
540
560
580
600
1H12 2H12 1H13
Revenue / FTE (LHS)Operating Expenses / FTE (RHS)
Corporate & Commercial Banking remains well managed
46
• Strong growth in cross sell revenue led by sales of mortgages to C&CB customers up 36% and Trade up 15% PCP
• Credit quality is well controlled and stable with a weighted average customer credit rating of 6.2 over the last 3 halves
• Focus on productivity has improved operational efficiency with revenue per FTE improving 4% HOH and 10% PCP and operating expenses per FTE down 1% HOH and up 3% PCP
Customer Credit Rating (CCR) Profiles by EAD
10% 8% 9%
16% 14% 15%
31% 32% 32%
31% 33% 31%
10% 10% 10%
3% 3% 3%
Mar 12 Sep 12 Feb 13
0-3
4
Strong
Fair
6
Impaired 8-10
5
7-8
Weighted Avg. CCR
6.2 6.2 6.2 $‟000 $‟000
0
100
200
300
400
500
600
1H12 2H12 1H13
Retail Institutional Wealth
+11% $m
AUSTRALIA DIVISION

818 870
895
Mar 12 Sep 12 Mar 13
ANZ FastPay - Australia‟s first mobile payment App for small business
Corporate & Commercial Banking is winning business through customer growth driven by a differentiated value proposition
• Leveraging ANZ‟s super regional advantage and „connectivity‟ brand awareness (cross border referrals up 33% PCP)
• Focus on innovation to meet changing customer needs (23,000 downloads of ANZ FastPay app)
• Improving Banker capability
1,300 staff up-skilled (super regional, credit and sales skills)
Enhanced sales tools and processes
35.3
29.7
27.1
29.9
25
30
35
40
Mar 11 Sep 11 Mar 12 Sep 12
ANZ Peer 1 Peer 2 Peer 3
Brand Metric: “Can Service My Business Needs Across Australia, NZ and Asia”1
(%)
Feb 13
1. DBM Business Financial Services Monitor, 3-month rolling average. Defined as the proportion of all commercial banking customers with $1m to less than $40m turnover, who think 'Can service my business needs across Australia, New Zealand and Asia' applies to each bank
2. Financial Insights Innovation Awards (FIIA) 2013 3. 2013 Banking & Payments Asia Trailblazer Awards 47
Customer numbers increasing ANZ‟s super regional offering is front of
customers‟ minds
+9%
Winner of Trailblazer Award
for „Channel Excellence in
Mobile – Payments‟3
Winner „Innovative in
Mobile Payments Award‟2
Customer numbers
(„000)
AUSTRALIA DIVISION

The Banking on Australia program
48
The „Banking on Australia‟ program responds to changing customer expectations and the competitive domestic banking landscape. It‟s about putting customers in control of their finances and making it easy for them to bank with us.
Investing $1.5 billion over five years to 2017 to reshape the way we do business
• Transforming our distribution network to deliver an improved customer experience through presenting the full array of ANZ‟s banking, wealth and institutional solutions
• Building our online and digital banking capabilities
• Simplifying our products and processes to free up productive time and make doing business easier for staff and customers
• Leveraging the connectivity of our unique super regional footprint
• Building the capability of our people to meet changing customer needs through better training, support, insights and customer analytics
Aiming to be the best connected, most respected bank across the Asia Pacific region
• Acquiring more quality customers than any other major domestic bank
• Achieving the highest customer satisfaction of the major banks
• Being the #1 Corporate and Commercial Bank
• Building our lead in digital and mobile banking
• Continuing to build a highly engaged workforce proud to work for ANZ
AUSTRALIA DIVISION

49
• Digital channels will define the way we operate
• Focusing on customer acquisition and servicing and deepening the customer relationship
• Recognised leader in mobile banking platforms
ANZ goMoney – over 1m users and 1m logons in a day
ANZ Fast Pay – winner „Innovative in Mobile Payments award‟1 & Trailblazer Award for „Channel Excellence in Mobile Payments‟2
ANZ Transactive for mobile – 2,000 users processed $9b in payments3
• Unified view of customers relationship with ANZ providing actionable customer insights
• Analytic capabilities enable tailored personalised offers across Retail and Commercial customers
• First phase of warehousing platforms already commissioned
Customer
Data Examples
Name, Birth date,
Address, income, channel preferences for sales and contact
Profitability attrition risk
Transactions, interactions, appointments
ANZ-related tweets, posts
Building our online and digital banking capabilities
Developing deeper analytic capabilities; enhancing our understanding of customers and ability to tailor offerings
1. Financial Insights Innovation Awards (FIIA) 2013 2. 2013 Banking & Payments Asia Trailblazer Awards 3. As at May 2013
Digital - central to banking in the future; we are the market leader in mobile banking platforms
AUSTRALIA DIVISION

IIB growing in line with strategy while improving productivity
50
-6%
6% 14%
32% 40% 47%
GlobalLoans
Trade &SupplyChain
FX CommercialAsia
CapitalMarkets
MarketsTrading &BalanceSheet
Operating Income growth 1H13 v 2H12
Operating Income growth 1H13 v 2H12
3% 6%
1%
16% 16%
IIB APEA exPartnerships
AustraliaInstitutional
New ZealandInstitutional
AsiaInstitutional
10% 14% 15%
17%
Cross BorderLending
FX Turnover Retail Lending Trade & SupplyChain Lending
Volume growth 1H13 v 2H12
• Income growth continues IIB income growth of 3%, with Asia organic
franchise income up 8% Improved connectivity and growing volumes
have countered margin pressures Markets Trading and Balance Sheet grew 47%
from strong customer flow and tightening credit spreads – average traded VaR down, now 47% lower than 2011
• We have a substantial business in Asia
Recognised as a Top 4 Corporate Bank in Asia1 Now generating over USD2bn per annum in
income; CAGR of 46% since 2007
• In line with strategy, diversifying revenue streams to reduce reliance on lending Increased focus on flow and value added
products such as markets, trade and cash management
Targeting less lending reliant FIG and Resource customer segments – trade volumes grew 17% and 13% respectively
• Positive JAWS of 4% through disciplined cost
management and productivity initiatives
All growth rates reflect 1H13 v 2H12 unless otherwise stated 1. Greenwich Large Corporate Banking Survey, 2013
IIB DIVISION

52%
8%
40%
46%
8%
46%
23%
34% 6%
11%
26%
Increasing contribution of flow and value added product
21%
33% 5%
11%
30%
Increasing earnings diversity and focusing on higher return products and segments
51
Diversifying Income by Geography
1H11
1H13
Australia Asia Pacific, Europe & America
New Zealand
1H11
1H13
Retail
Partnerships
Global Loans
-3%
6% 9%
17%
Australia New Zealand APEA ex-Partnerships
APEAInstitutional
Operating Income Growth
2year CAGR
-5%
4%
13%
19%
Global Loans Retail Markets FX Trade & SupplyChain
Operating Income Growth
2 year CAGR
Transaction Banking
Global Markets
Flow & Value Added
1. Normalised for RBS acquisition non-recurring gains
1
IIB DIVISION

Maintaining a leading position in Australia / New Zealand and gaining recognition in Asia
52
Leading in Priority products
Foreign Exchange & Commodities
Number 1 primary supplier of spot FX and forward FX in Australia (East & Partners 2012)
Best for Asian Currencies & Best for Client Service in Asia Time Zone (Euromoney FX Survey 2012)
Best for FX Options as voted by Financial Institutions (AsiaMoney FX Poll 2012)
Ranked No. 4 in the 2012 AsiaMoney Commodity Poll (unranked in 2011)
Trade Finance
Best Trade Finance Bank Australia for 6 years running (Global Finance)
Best Trade Finance Bank New Zealand for 5 years running (Global Finance)
Best Trade Bank in Asia Pacific (Trade and Forfaiting Review
2012)
Debt Capital Markets
No. 1 Mandated Lead Arranger and Bookrunner in Australia / New Zealand (Thomson Reuters LPC 2012)
Market-leading Syndicated Loan Team in Asia Pacific (Asia-
Pacific Syndicated Loan House of the Year, APLMA 2012)
Top four underwriter/arranger in the SGD and Dim Sum Bond Markets
USD900 MILLION
Syndicated Receivables Purchase Facility
Pegatron Corporation
Bookrunner, Coordinating Arranger, Facility Agent and Collection Bank
October 2012
Winning Flow & Value Added Deals
Pegatron is a world leader in the electronic and computing design and manufacturing services industry
ANZ provided a scalable supply chain solution to facilitate the purchase of receivables from Apple Inc.
This required an in-depth understanding of both companies, skills in structuring and syndicating the large USD900m deal, product expertise, operational controls, as well as appropriate risk appetite
This deal was recognised as Deal of the Year 2012 by Trade Finance and Best Telecommunications & Technology Trade Finance Solution, Taiwan by The Asset in 2013
Leveraging ANZ‟s regional network and expertise in Trade & Supply Chain, Cash Management and
Debt Capital Markets
IIB DIVISION

322
622
877
1,257
1,840
2,109
1,024 1,085
1,135
FY07 FY08 FY09 FY10 FY11 FY12 1H12 2H12 1H13
USDm Asia Operating Income
A focus on growth and scale in Asia to drive improved returns
53
Significant growth achieved since commencing super regional strategy
+46% CAGR
Volume growth has remained strong
+11% PCP Achieved scale in core franchise markets
11% 17%
20% 26% 28%
InternationalPayments
RetailDeposits
Investment &Insurance
FX SalesTxns
Trade Txns
Asia Volume growth (1H13 v 1H12)
79 112
166 159 180
303
GreaterMekong
Taiwan Hong Kong China Indonesia Singapore
Operating Income – 1H13
133
244 280 313 390
484
GreaterMekong
Taiwan Hong Kong China Indonesia Singapore
USDm Operating Income – FY12
IIB DIVISION

Improving income quality whilst continuing to drive volume growth
54
Improving quality of earnings through growth of Non-Interest Income
Driving volumes growth to counter margin pressures and mix changes in our business
1H10 2H10 1H11 2H11 1H12 2H12 1H13
AUDb
IIB Operating Income
Net Interest Income Other Operating Income
+8% CAGR
11%
5%
CAGR (1H10-1H13)
2.6
2.9 3.1
2.9
3.3 3.2
3.3 3.30%
2.91%
2.77% 3.05%
2.66%
2.54%
2.00%
2.40%
2.80%
3.20%
3.60%
4.00%
1H
08
2H
08
1H
09
2H
09
1H
10
2H
10
1H
11
2H
11
1H
12
2H
12
1H
13
Net Interest Margin ex-Markets
IIB ex Markets Institutional ex Markets
13% 17%
33%
Resources FIG Commercial
Strong Trade volume growth in
Priority Segments 1H13 v 2H12 (%)
OOI
NII
IIB DIVISION
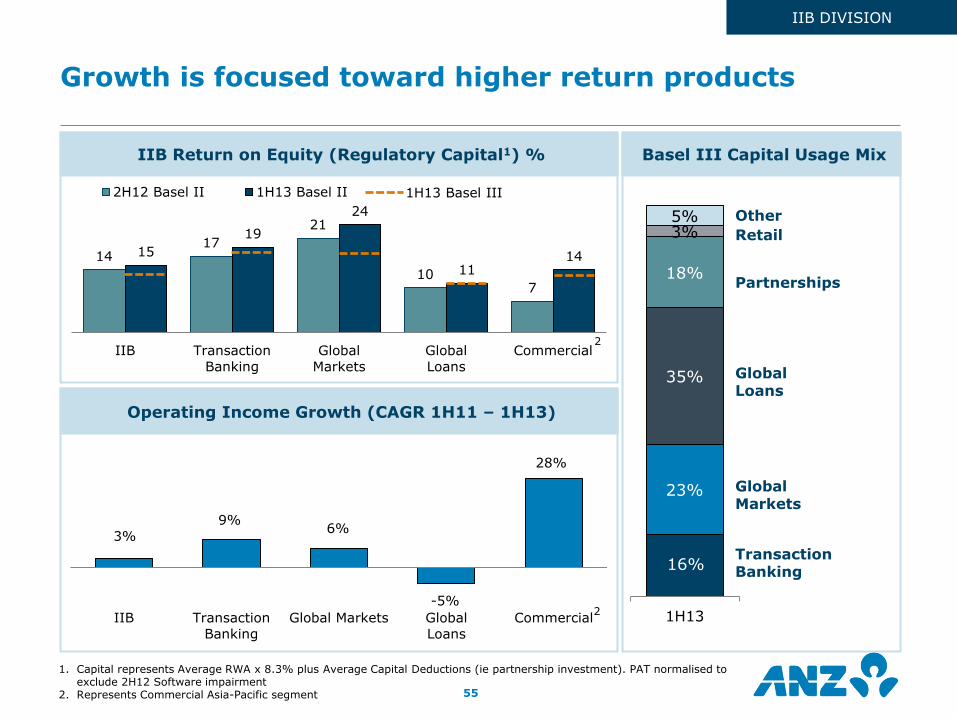
Growth is focused toward higher return products
55
Operating Income Growth (CAGR 1H11 – 1H13)
Basel III Capital Usage Mix IIB Return on Equity (Regulatory Capital1) %
14 17
21
10 7
15
19
24
11 14
IIB Transaction
Banking
Global
Markets
Global
Loans
Commercial
2H12 Basel II 1H13 Basel II
2
3%
9% 6%
-5%
28%
IIB Transaction
Banking
Global Markets Global
Loans
Commercial
16%
23%
35%
18%
3% 5%
1H13
Transaction Banking
Global Markets
Global Loans
Partnerships
Retail
Other
1. Capital represents Average RWA x 8.3% plus Average Capital Deductions (ie partnership investment). PAT normalised to exclude 2H12 Software impairment
2. Represents Commercial Asia-Pacific segment
1H13 Basel III
2
IIB DIVISION

NZ Division is harnessing the benefits of scale to compete in a lower growth, highly competitive market
56
… in a lower growth, highly competitive market2 …
… we are harnessing the benefits of scale to drive greater value
● Simplify the business and reduce duplication
One management structure
One set of systems
One process and product set
One brand
● Develop a distinctive banking proposition across all businesses. Compared to peers:
More branches
More ATMs
More specialists in local markets
Branch network optimised to provide greater coverage of NZ
● Increase cross-sell
Grow Markets, Trade and Cash Management revenues in Commercial customer base
Grow sales of Life Insurance and Kiwisaver in Retail customer base
● Increase productivity and operational efficiency
Become the most efficient bank in New Zealand, reflective of our scale
As the largest bank in New Zealand …
0
20
40
60
80
100
120
ANZ NZ Peer 1 Peer 2 Peer 3
Th
ou
san
ds
Gross Loans and Advances (NZDm)1
1 Based on Geographic Disclosure Statement data as at 31 December 2012 2 RBNZ real gross domestic product and household credit data
-5.0
0.0
5.0
10.0
15.0
20.0
Mar
00
Sep 0
0
Mar
01
Sep 0
1
Mar
02
Sep 0
2
Mar
03
Sep 0
3
Mar
04
Sep 0
4
Mar
05
Sep 0
5
Mar
06
Sep 0
6
Mar
07
Sep 0
7
Mar
08
Sep 0
8
Mar
09
Sep 0
9
Mar
10
Sep 1
0
Mar
11
Sep 1
1
Mar
12
Sep 1
2Household Credit Growth YoY % GDP Annual avg. % change
NEW ZEALAND DIVISION

Maintained momentum through a period of significant change
57
1. Source: Ipsos Branch Tracker - consumers saying the brand is their first choice or is seriously considered 2. Source: RBNZ, February 2013 3. Source: RBNZ, December 2012
Consideration up1
Mortgage Share growing2
CTI down
27% 35%
2010 1H13
29.9%
30.3%
2010 1H13
29.5%
30.0%
2010 1H13
Return on Risk Weighted Assets
Increased Cross Sell
Growth 1H13 v 1H12 • ANZ@work +63% • Merchant services +12% • Trade +10% • Kiwisaver FUM +35% • Insurance sales +34%
Frontline Engagement
63%
76%
2010 1H13
Increased Profitability
624
240
728 497
PBP NPAT
1H10 1H1349% 49%
45% 43%
NZ Division NZ Geography
1H10 1H13
199% 173%
2010 1H13
Loan to Deposit Ratio
Deposit Share growing3 Improved Funding Mix
0.9%
2.0%
1H10 1H13
NEW ZEALAND DIVISION

Next phase focused on leveraging our scale
58
Scale advantage 2016+
Leverage Scale 2013-2015
Harness Scale 2010 - 2012
Leverage scale through a focus on service, efficiency and cross sell
• Continue to drive productivity benefits from simplified business model
Committed focus on productivity and efficiency measures
• Greater focus on service
Branch upgrades designed around greater sales activities
Further increase in branch coverage
Increasing number of business bankers in local branches
• Continue to drive cross-sell
Improve diversity of income base through continuing to grow cross-sell across NZ franchise
Deploying a new modular branch design that requires 20% less floor space
NEW ZEALAND DIVISION

1H13 Strategic scorecard – Wealth Division
• Net increase in Wealth solutions held by bank customers of 9% PCP
• ANZ Smart Choice Super exceeding 800 account openings per week with a funding rate over 36% and day-1 insurance take-up of 50%
• ANZ Financial Planning productivity up 21% PCP and 6% PCP per adviser for risk sales and investment inflows respectively
• Direct Insurance sales to ANZ customers up 17% PCP in Australia and 34% PCP in New Zealand
• Insurance inforce premiums up 10% PCP (Life & GI)
• Turnaround in netflows from aligned dealer groups (1H13 v 1H12)
• FUM up 8% PCP, although market share declined 40bps in Australia (6 months to Dec 12)1
• CTI improved 280 bps PCP to 62% driven by business simplification and leveraging the global model
• New fiduciary and internal governance structure to improve risk compliance and governance
• Centralised the Chief Investment Office to improve consistency and quality of investment decisions
• MySuper license application submitted
1. Source: Plan For Life
Comments Scorecard
59
Grow relationships with existing ANZ customers:
Wealth solutions sold to ANZ customers
Size of ANZ Financial Planning
Productivity of ANZ Financial Planning
Direct channel sales
Drive higher returns from existing businesses:
Grow Retail Life
Netflows from aligned dealer groups
Above market FUM growth
Simplify the business and leverage global capabilities:
Lower cost to income
Reduce risk
Leverage global model
MySuper & FoFA ready
GLOBAL WEALTH DIVISION

ANZ Smart Choice Super
• See your super alongside other accounts
• Never lose your super again
• 24/7 access
• Life stage investments
• Choose how involved you want to be with quality investment options
ANZ Smart Choice Super – a low cost and innovative solution
Average Australian Super fund
Average Industry
fund
300
521
716
Visibility
Choice & Control
Great Value1
• One low investment fee (0.50%)
• 42% lower fees than the average industry fund
Over 17,000 accounts already opened
36% of these have rolled over their existing superannuation or
commenced contributions
50% of accounts opened also take life insurance through
ANZ Smart Choice Super
Activation team now in place with strong customer response
1. Note: Fee comparison based on the average total annual Investment Management fees, Performance fees, Administration fees, Asset Management fees and Member fees of 319 superannuation products in Australia (including 126 industry funds), on a $50,000 account balance. Sourced from SuperRatings Pty Ltd's 'Fees Analysis' dated 21/11/2012 analysing fees current at 30/9/2012. All fees are subject to change
ANZ Smart Choice
Super
60
ANZ Smart Choice Super fees vs other super funds (from 1 Dec 2012)1
GLOBAL WEALTH DIVISION

7%
10% 9%
Australia New Zealand Total
18
22
24
1H12 2H12 1H13
120 129
141
1H12 2H12 1H13
KiwiSaver1
2H12 1H13
Deepening relationships with existing ANZ Customers
61
Wealth Solutions to Bank Customers1 Direct Investments
Direct Insurance Australia Direct Insurance New Zealand
Growth in wealth solutions held by ANZ customers (PCP)
Direct Life & General Insurance Sales – Australia
Direct Life & General Insurance Sales – New Zealand
1H12 2H12 1H13
Smart Choice Super
+17% +34% $m NZDm
ANZ Customers („000)
ANZ Customers („000)
+278%
1. Source: ANZ Customer Analytics
+16%
GLOBAL WEALTH DIVISION

The material in this presentation is general background information about the Bank‟s activities current at the date of the presentation. It is information given in summary form and does not purport to be complete. It is not intended to be relied upon as advice to investors or potential investors and does not take into account the investment objectives, financial situation or needs of any particular investor. These should be considered, with or without professional advice when deciding if an investment is appropriate
This presentation may contain forward-looking statements including statements regarding our intent, belief or current expectations with respect to ANZ‟s business and operations, market conditions, results of operations and financial condition, capital adequacy, specific provisions and risk management practices. When used in this presentation, the words “estimate”, “project”, “intend”, “anticipate”, “believe”, “expect”, “should” and similar expressions, as they relate to ANZ and its management, are intended to identify forward-looking statements. Readers are cautioned not to place undue reliance on these forward-looking statements, which speak only as of the date hereof. Such statements constitute “forward-looking statements” for the purposes of the United States Private Securities Litigation Reform Act of 1995. ANZ does not undertake any obligation to publicly release the result of any revisions to these forward-looking statements to reflect events or circumstances after the date hereof to reflect the occurrence of unanticipated events.
For further information visit
www.anz.com
or contact
Jill Craig Group General Manager Investor Relations
ph: (613) 8654 7749 fax: (613) 8654 9977 e-mail: [email protected]