Embed Size (px)
Citation preview
1
Empresas Copec S.A.
October 2010
www.empresascopec.cl

2
Empresas Copec
Natural Resources Energy
Empresas Copec participates in natural resources and energy.
Forestry Fishing Fuels Power generation

3
75 years of history
1934Incorporation
1950 - 1960Expansion in fuels
1970 - 1980Diversification
1986Entry of Angelini Group
1986 - 2000Investments and Growth
2000 - 2005Consolidation and Strategic Focus
� Financial restructuring
� Strategic development plan
2003Corporate restructuring: • Creation of Empresas Copec
� Angelini assumes control of the Company
� Divestiture of shares in non-core businesses
� Focus in fuels, forestry and fishing.
� Alto Paraná� Arauco II� Licancel� Metrogas
� Abastible� Sonacol
2004 – 2010EC, a world scale player: • Investments in Valdivia & Nueva Aldea
allowed Arauco to become the secondmain producer of market pulp

4Source: Empresas Copec
Ownership structure
50,00 %
74,29 %
60,82 %
Angelini Group
99,98 %
Grupo Anglini *Forestry Fuels Fishing Other investments
99,99 % 99,05 % 39,83 %
40,80 % 12,00 %
81,93 % **
83,50% 30,64 %
25,00 % 99,87 %
Others
25,71 %

5
17.085
15.676 15.62715.234
13.648
11.169
EmpresasCopec
Falabella Santander Enersis Cencosud Endesa SQM Chile
[US$ million]
Market Capitalization of Chilean Companies
Size
• Empresas Copec is Chile’s largest publicly traded company.
• It represents around 11.5% of total market capitalization and 12% of the IPSA Index.
24.307 23.536

6
2nd market pulp producer in the world
1st producer of sawn timber in Latin America
Largest fuels distributor in Chile*
Largest lubricants distributor in Chile**
2nd largest player in LPG distribution in Chile**
Main fishing company in Chile and 3rd largest player
in the world**
(**) Share in industrial catches year 2009
(*) Market share as of 2009
Leadership in all businesses in which it participates
1.575
1.610
1.675
1.685
1.700
1.730
1.820
2.020
2.065
2.430
5.245
3.205
Suzano
Domtar
Canfor Corp
Stora Enso
UPM-Kymmene
APP
Weyerhaeuser
CMPC
Sodra
APRIL
Arauco
Fibria
2.046
2.625
3.007
3.145
3.370
4.100
5.900
5.919
7.143
7.960
Georgia-Pacific
Abitibi-Consolidated
Arauco
Sierra Pacific
Tollko Industries
Klausner Group
Stora Enso
Canfor
Weyerhaeuser
West Fraser Timber
Source: Hawkins Wright, Arauco, Empresas Copec
Abastible
34%
Gasco
28%
Grupo
Lipigas
38%
Esso
6%Shell
28%
Castrol
3%
Texaco
6%
Mobil
43%Others
14%
San José
9%Corpesca
25%
SPK
8%
Others
19%
Itata
7%
Alimar
9%Camanchaca
15%
El Golfo
8%
Copec
63,6%
Shell
14,7% Esso /
Petrobras
9,1%
Terpel
9,2%
Others
3,4%

7
Financial Strength
• Empresas Copec generates healthy cash flows which allow it to finance its investment
plan, distribute attractive dividends and maintain low levels of indebtedness.
• International risk rating: BBB+
Debt to Equity Ratio1998 - 2009
0
300
600
900
1.200
1.500
1.800
2.100
98 99 00 01 02 03 04 05 06 07 08 09
EBITDA *1998 – 2009 [US$ million]
* Operating income + Depreciation + Stumpage
0,00
0,10
0,20
0,30
0,40
0,50
98 99 00 01 02 03 04 05 06 07 08 09
8
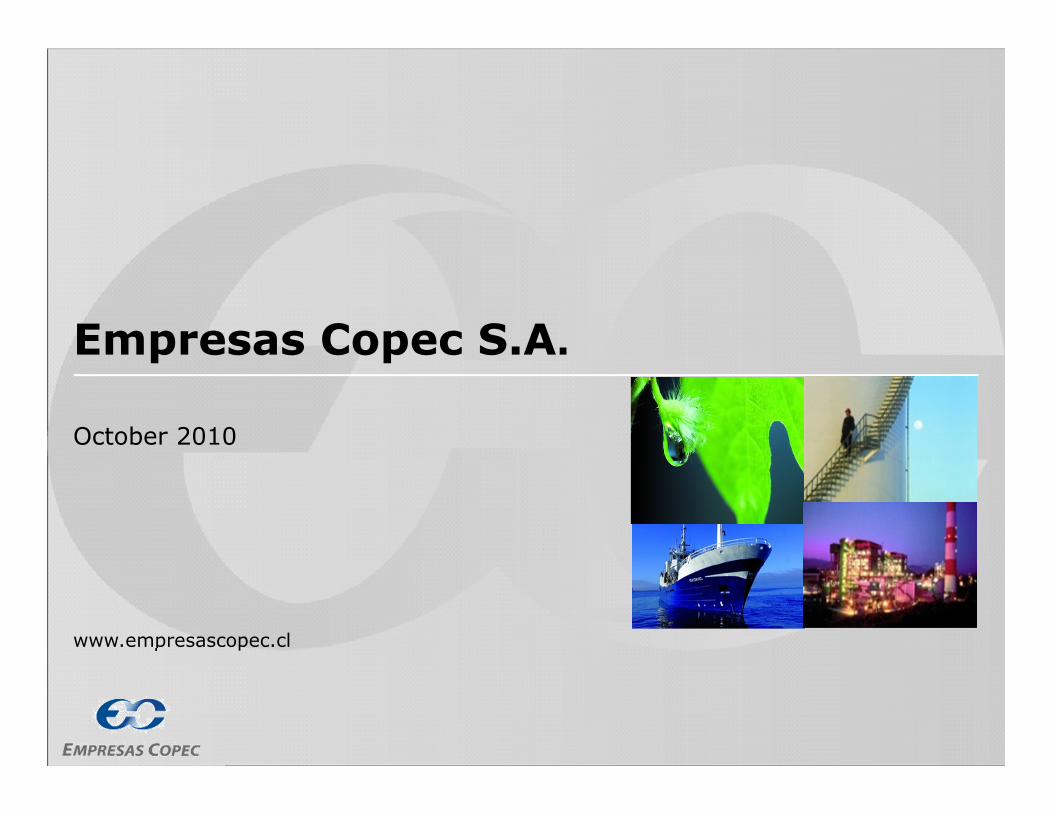
EBITDA*
December - 2009
Fuels
32,4%
Forestry
65,7%
Fishing
1,9%
T o ta l: US$ 1,098 millio n
Business Sectors: Fuels, forestry, fishing and other investments
Consolidated Assets
December - 2009
Fishing
2,9%
Fuels
14,8%
Forestry
73,3%
Others
9,0%
T o tal: US$ 15,580 millio n
Consolidated Sales
December - 2009
Fuels
67,8%
Forestry
31,3%
Fishing
0,9%
T o tal: US$ 9 ,942 millio n
* Operating income + Depreciation + stumpage
Consolidated Investments
December - 2009
Fuels
14,1%
Forestry
77,4%
Fishing
1,8%
T o ta l: US$ 918 millio n
Fuels29,2%
Forestry61,3%
Fishing1,2%
Net Income December - 2009
Total: US$ 576 million

9
Improvements in management systems and industrial & logistic processes
• Efficient use of non dangerous residuals: Biomass for the production of energy in Arauco
• Treatment and permanent monitoring of effluents
• Reduction of greenhouse gas emissions (Kyoto Protocol)
• Vía Limpia project
• System of collection of unloadings in Coronel
Important contribution to Education, Culture, Sports and
the Community
• Education:
• Arauco Foundation (59 programs in 29 districts, benefitting 470 schools, 4,066 teachers and 71,268 students)
• Arauco, Constitución and Cholguán schools
• Belén Educa and Enseña Chile initiatives
• Sports: Copec and Arauco soccer cups, and Rally Mobil.
• Applied R&D: Copec – Catholic University Foundation.
• CERTFOR, ISO 9001, ISO 14001 and OHSAS 18001 certifications in Arauco.
• Protocols for handling of industrial residuals
• Certified chains of custody
• 520 hectares declared as Areas of High Environmental Value in danger of extinction or vulnerable
• Marine ecosystem environmental surveillance Program
Conservation and protection of biodiversity
Reduction and management of environmental impact
Strong commitment with society and the environment

10
Empresas Copec: One of the most respected companies in Chile
1st Financial strength
2nd Integrity and transparency
2nd Capacity to attract the best professionals
2nd Customer satisfaction
3rd Environment
3rd Social responsibility
Ranking per attribute measured
1 Lan
2 Empresas Copec
3 Nestlé
4 CMPC
5 Minera Escondida
6 Falabella
7 Concha y Toro
8 Cencosud
9 Coca Cola
10 Procter & Gamble
11 3M
12 Unilever
13 Entel
14 Banco Santander
15 CCU
Global Ranking 2010
Source: Adimark, Diario La Segunda

11
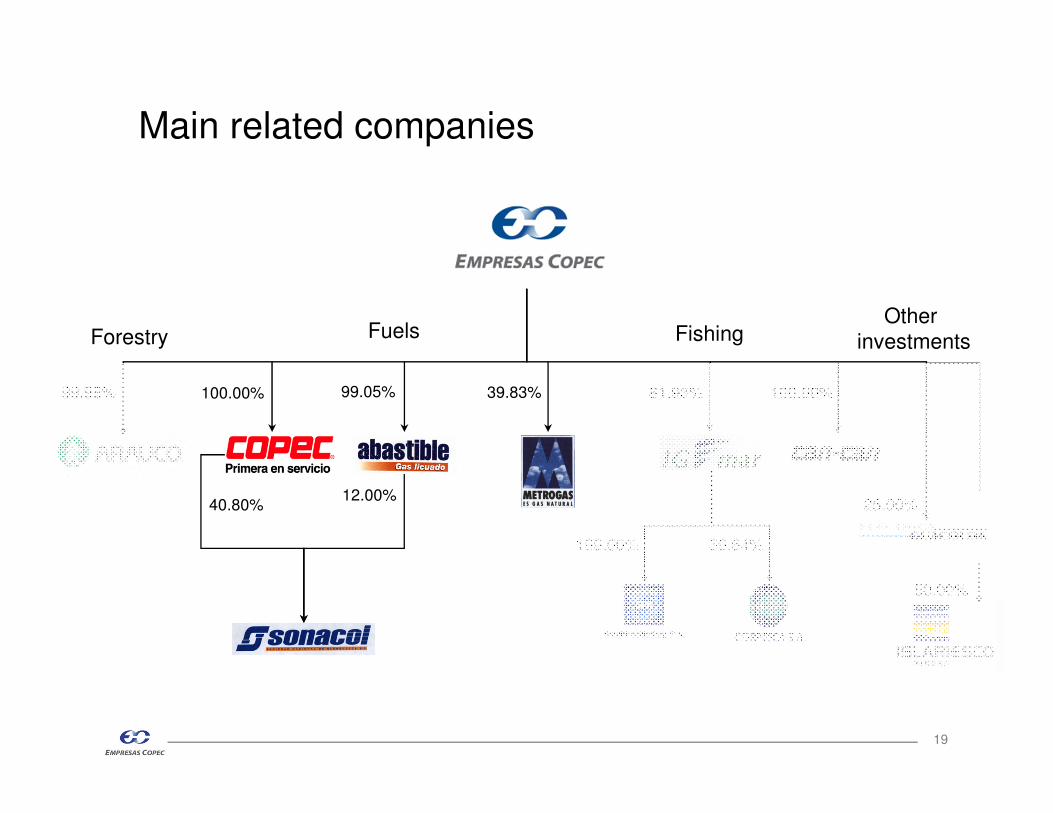
Main related companies
Forestry Fuels FishingOther
investments
99.98% 100.00% 99.05% 39.83% 81.93% 100.00% 25.00%
100.00% 30.64%
40.80%12.00%
25.00%
50.00%

12
Sawntimber
8 sawmills
2.36 million m3
2 sawmills
470,000 m3
10 sawmills2.8 million m3
Pulp
5 mills
2.86 million tons
6 mills3.2 million tons
1 mill
350 Th. tons
Panels
3 facilities
Plywood: 805 Th m3
MDF: 520 Th m3
Hardboard: 60 Thm3
8 facilities3.0 million m3
2 facilities
MDF: 305 Th m3
PB : 260 Th m3
3 facilities
MDF: 705 Th. m3
PB : 530 Th m3
Forestry
721,468 hectares
126,147 hectares
981,497 hectares*
68,849 hectares
65,033 hectares
Paraguay
Uruguay
Bolivia
Peru
Colombia
Venezuela
Guyana
Suriname
FrenchGuyana
Saw Mill
Forests
Pulp Mill
Head Offices
Panel mill
CHILE
Santiago
Valdivia
AraucoCholguán
Constitución
ARGENTINA
Buenos Aires
AltoParaná
BRASIL
Ecuador
Colombia
Ecuador
N.Aldea
Port
Forestry
Energy
7 plants
538 MW
Surplus:
174 MW
7 plants538 MWSurplus174 MW
* Includes plantations corresponding to the joint venture with Stora Enso

13
The integral and efficient use of resources allows Arauco to maximize the value of the forest…
Biomass
SawmillPanel Mill
Pulp Mill+
Recovery Boiler
Energy to the Grid (134 MW)
Steam
Carbon Bonds (Kyoto Protocol)
Log Merchandising
Forest
Power Plant
Steam
Energy to the Industrial Complex
504MW
Steam
Biomass
Nueva Aldea Industrial Complex

14
World Pulp Supply Curve
ForestryComparative Advantages
Source: Hawkins Wright; BCI
• Chile‘s position in the supply curve assures a superior operating performance.
0
100
200
300
400
500
600
700
0
2.000
4.000
6.000
8.000
10.000
12.000
14.000
16.000
18.000
20.000
US
$/T
on
Thousands of Tons
BSKP BEKP
Sweden
France
Germany
Austria
U.S.A. CanadaFinland
Brazil Indonesia Chile
Sweden
Portugal
Spain
CanadaFinland
U.S.AChile
155
70
40
31
35
Wood
Chemichals
Labor
Others *
Depreciation
Arauco’s Cash Cost
Total Cash Cost: US$ 338 / ton
* Includes: energy, materials and other production costs

AfricaIndia
Brazil
Russia
ChinaMexicoChile
FranceSpain
KoreaItaly
UK
Canada
Japan
Germany
Sweeden
USA
0
50
100
150
200
250
300
0 10 20 30 40 50 60
Kg
. p
er
cap
ita
GDP* per capita.
15
ForestryGrowth drivers
Source: Bloomberg, Arauco
• With 36% of the world’s population, China and India still have a long path to walk …
* GDP is measured in thousands of US dollars adjusted by PPP
Paper Intensity of Use

16
ForestryGeographic and Product Diversification
Chile
14.0%
North America
15,5%
Europe
16.0%
Asia
31.0%
Others
3.0%
Others
America
19.0%
America
12,0%
Europe
16,0%
Africa
1,0%
China
50,0%
Asia ex China
21,0%
Europe
3,0%
Latin America
33,0%
North America
30,0%
Asia
21,0%
M iddle East &
Africa
13,0%
Pulp volumes (3.1 million tons) Sawn timber volumes (2.2 million m3) Panels volumes (2.6 million m3)
• Arauco has exposure to different markets
Figures as of 2009
• Consolidated sales by countryTotal: US$ 3.113 million
Rest of Latin
America
8,0%
Europe
7,0%
Asia & Others
4,0%
Argentina
10,0%
Chile
13,0% Brazil
26,0%
North
America
32,0%

17
ForestryLatest Developments: consolidation of the
“Paraná” cluster
• August 2009: Arauco acquires Tafisa Brazil
• May 2009: Arauco and Stora Enso agreed to purchase the
majority of Ence operations in Uruguay
• 2007: Arauco finished negotiations with Stora Enso, resulting in
the acquisition of plantations, a sawmill and a paper mill
• 2006: Acquisitions of land and plantations in Brazil
• 2005: Acquisition of panel companies and plantations in Brazil and
Argentina:
Paraguay
Uruguay
Bolivia
Peru
Colombia
Venezuela
Guyana
Suriname
FrenchGuyana
Saw Mill
ForestsPulp Mill
Head Offices
Port
Panel mill
CHILE
Santiago
Valdivia
AraucoCholguán
Constitución
ARGENTINABuenos Aires
AltoParaná
BRASIL
Ecuador
Colombia
Ecuador
N.Aldea
Port
Latest acquisitions allow for progressive integration of previous operations:

18
• Joint Venture between Arauco and Stora Enso to build a world class pulp mill in PuntaPereira, Uruguay
• Project includes a port terminal integrated to the pulp mill, in a free trade zone
• Montes del Plata has a forest base of 254,000 hectares of land and 126,000 of plantationsafter the acquisition of forestry assets in May 2009 for US$ 343 million.
• Legal and environmental permits granted
• Deep impact in the Uruguayan economy
• Estimated Investment: US$1.500 million
• Estimated Capacity: 1,300,000 Adt / year
• Production start date: 2013 (E)
ForestryUpdate on Montes del Plata project
19
Main related companies
Forestry Fuels FishingOther
investments
99.98% 100.00% 99.05% 39.83% 81.93% 100.00% 25.00%
100.00% 30.64%
40.80%12.00%
25.00%
50.00%

20
Convenience stores
Industrial clients
Service stations
AviationLubricants
Copec Liquid Fuels division

21
• Coverage:
• 629 service stations
• 14 storage plants
• COPEC consistently outperforms the rest of the market in terms of operating efficiency:
• Prime locations
• Brand recognition
Fuel sales per Service Station (thousand m3)
Source: Internal Estimates
Fuels Liquid Fuels: COPEC
4.5 4.3 4.4 4.1 4.2 3.9 4.04.6
5.2 5.3
8.07,6
6,6
3.2 3.4 3.5 3.63.1 3.2 3.2 3.1 3.2 3.3
3.7 4,1 4,0
1997 1999 2001 2003 2005 2007 2009
COPEC Rest of the Market

22
• During the last 2-3 years, COPEC has increased its market share to over 60%.
• COPEC has supplied the largest part of the additional fuel demand generated by gas shortages from
Argentina.
• Consolidation of the new service stations network.
• Customer satisfaction has reached record levels.
• Improvements in logistics and service have allowed to increase market share in the industrial
channel.
30
40
50
60
70
Dic-02 Dic-03 Dic-04 Dic-05 Dic-06 Dic-07 Dic-08 Dic-09
Liquid Fuels ShareLiquid Fuels- Market Share
2009
Terpel
9,2%
Shell
14,7%
Petrobras
9,1%
Copec
63,6%
Others
3,4%
Source: Internal Estimates
Fuels Historical performance in fuels business:

23
• In May 2010, Copec acquires rights in companies controlling Terpel Colombia
• Main player in the Colombian market with 37% market share and more than 1,270 gas stations
• The acquisition includes assets in Ecuador, Panamá and Chile (Chilean operations to be divested)
• Total investment: US$ 239 million
• Significant value drivers:
• Similar to Chilean market structure, which allows to take advantage of Copec’s know-how
• High growth potential in the Colombian market:
• Colombia’s vehicular penetration is lower than in Chile
• Low highway vehicular flows
• Low market penetration of convenience stores business
• Areas in which both company’s expertise can generate mutual benefits
• Copec’s efficiency in its gas stations operation
• Terpel’s experience in the natural gas for vehicles (NGV) market
Fuels Acquisition of Terpel Colombia:

24
• Country distribution
Fuels Acquisition of Terpel Colombia:

25
Abastible
33.6%
Gasco
28.2%
Grupo
Lipigas
38.2%
• Distributor of liquefied petroleum gas (LPG) to residential and industrial customers.
• Stable sales growth and market share.
Fuels Liquefied Gas: Abastible
0
100
200
300
400
500
97 98 99 00 01 02 03 04 05 06 07 08 09
Sales Volumes
(Thousand tons)
LPG - Market Share2009
• Significant development potential:
• Substitution of natural gas and firewood
• Expansion of geographic coverage
• New applications

26
Fuels Natural Gas: Metrogas
• Distributes natural gas to more than 450,000 customers in the Metropolitan Region andsupplies 90% of industrial consumption.
• Was subject to supply shortages as a result of price freezing within Argentina.
• New US$ 1 billion LNG terminal operating since September 09
• Participates with Enap, Endesa and BG
Increase in clients base
(Thousand)
803698 664
397
278
391
2004 2005 2006 2007 2008 2009
191
451
0
100
200
300
400
500
1999 2000 2001 2002 2003 2004 2005 2006 2007 2008 2009
CAC: 9,0%
Volumes
(Million of m3)

27
New projects in energy
Minera Isla Riesco
• Empresas Copec returns to the coal exploration and production business by entering Sociedad Minera Isla
Riesco S.A.
• The project involves a total investment of approximately US$450 million.
• Estimated reserves of over 200 million tons to date will allow to supply coal for several decades to the local
market.
• Port Environmental impact study approved in December 2009.
• US$50 million were paid in January 2009 to the state agency Corfo for the mining properties.
• Acquisition of BHP Billiton’s coal deposits for US$20 million.
Projected Coal
Demand

28
New projects in energy
Eléctrica Guacolda
• Two new units (152 MW each) have doubled total capacity
• Total investment of US$600 million
• Unit 3: connected to the grid on July 31st 2009
• Unit 4: connected to the grid on March 1st 2010
• EIS for a 5th unit approved

29
Forestry Fuels FishingOther
investments
99.98% 100.00% 99.05% 39.83% 81.93% 100.00% 25.00%
100.00% 30.64%
40.80%12.00%
25.00%
50.00%
Main related companies
30
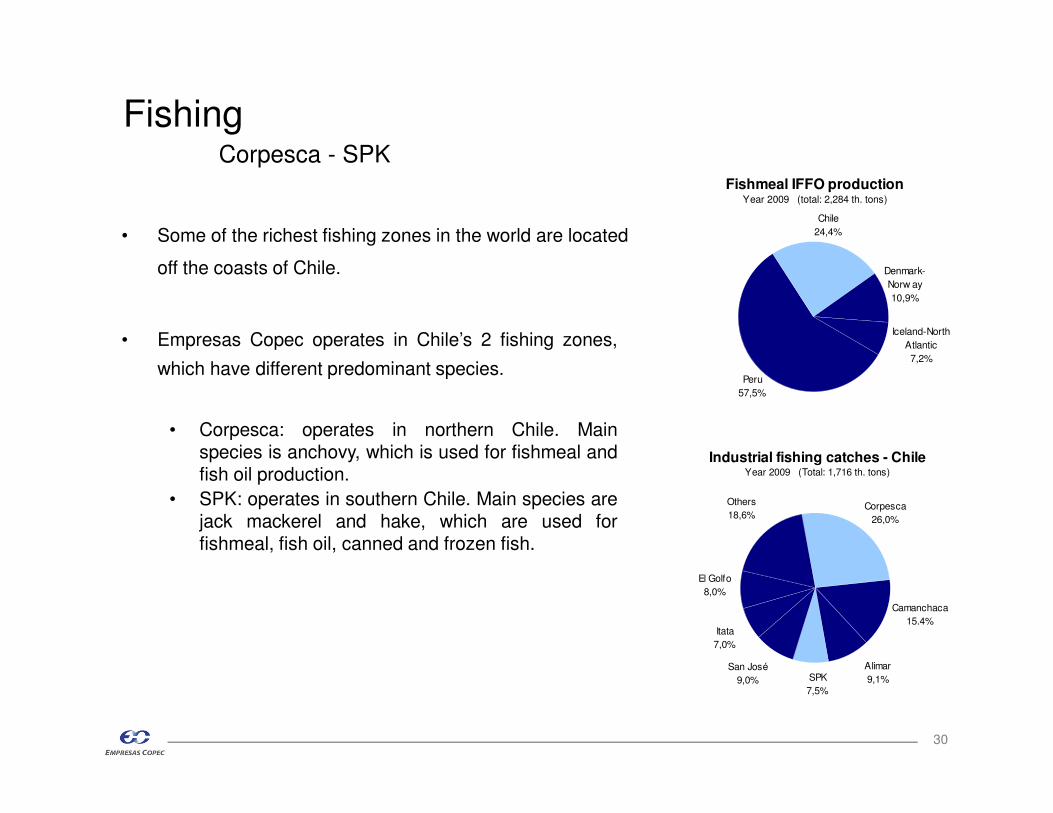
Industrial fishing catches - ChileYear 2009 (Total: 1,716 th. tons)
Itata
7,0%
El Golfo
8,0%
Others
18,6%
Alimar
9,1%
Corpesca
26,0%
SPK
7,5%
San José
9,0%
Camanchaca
15.4%
• Empresas Copec operates in Chile’s 2 fishing zones,
which have different predominant species.
• Corpesca: operates in northern Chile. Mainspecies is anchovy, which is used for fishmeal andfish oil production.
• SPK: operates in southern Chile. Main species arejack mackerel and hake, which are used forfishmeal, fish oil, canned and frozen fish.
• Some of the richest fishing zones in the world are located
off the coasts of Chile.
FishingCorpesca - SPK
Fishmeal IFFO productionYear 2009 (total: 2,284 th. tons)
Chile
24,4%
Iceland-North
Atlantic
7,2%
Peru
57,5%
Denmark-
Norw ay
10,9%

31
Latest Developments: SPK & San José Merge
� Igemar will control the new company with a 50,1%
ownership
� 23% of the central-south fishing zone quota
� Important synergies to be achieved:
� Operational, productive and comercial
� Diversification:
- geographic area
- type of products

32
Other developments
Empresas Copec
• US$290 million debenture issued in the local capital market at record spread levels
• IFRS adopted in Q1 2009

33
Empresas Copec S.A.
October 2010
www.empresascopec.cl