Embed Size (px)
Citation preview

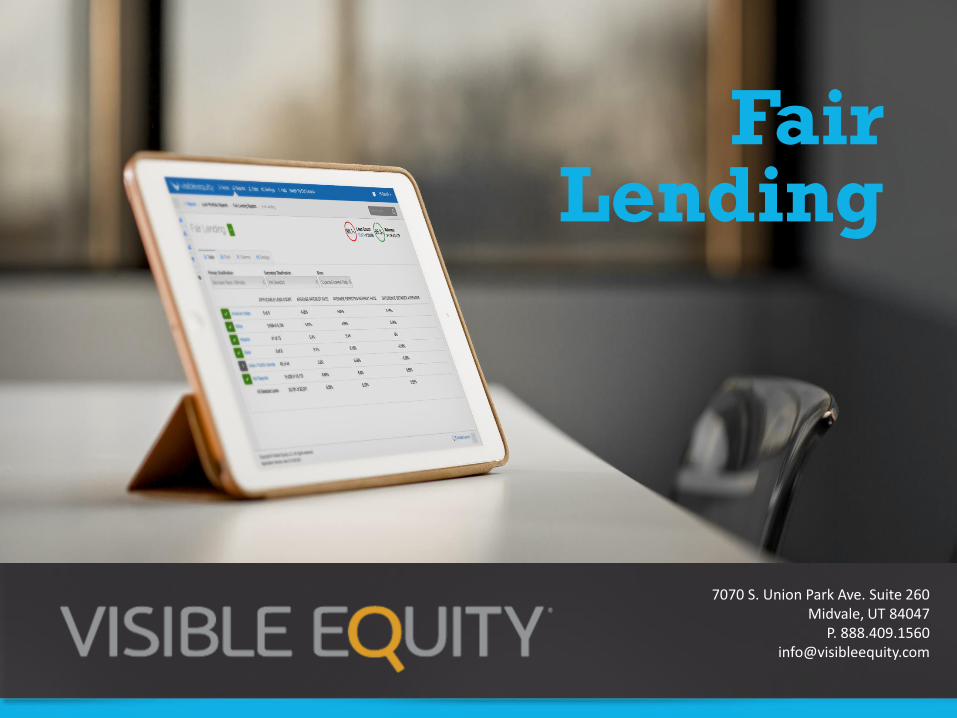
ABOUT US Visible Equity is a software development company that focuses on web-based applications for financial institutions.
Our team is comprised of experts in financial economics, mathematical and statistical modeling, and intelligent data systems. We specialize in transforming slow, expensive, and complex tasks into real time, cost effective, and simple results.
Our valuation capabilities, predictive analytics, and advanced modeling applications give you the insight and tools to effectively manage your portfolio and make better informed, data-driven decisions.
Our user friendly, web-based system merges your data with our advanced analytics and market data to produce reports and analysis that are current, relevant, and insightful.
In a nutshell, we help make the obscure visible, allowing our clients to maximize their return on equity.
For more information please visit
your website:
www.visibleequity.com
2 of 58

Fair Lending Agenda
Fair Lending The Basics Assessing Your Fair Lending Risk
Fair Lending Performance Reports Statistical Modeling
and Comparative File Reviews
Building a Fair Lending Program
3 of 58
4 of 58
Fair Lending the Basics
5 of 58
www.visibleequity.com
Fair Lending the Basics
6 of 58
Fair Lending the Basics
7 of 58
Fair Lending the Basics

Fair Lending the Basics
8 of 58
ECOA BOTH FH Act
Equal Credit Opportunity Act (ECOA) Prohibits discrimination in any aspect of a consumer credit transaction (including small businesses).
Fair Housing Act (FH Act) Prohibits discrimination in residential real estate transactions: -making loans to buy, build, repair, improve a dwelling -purchasing real estate loans -selling, brokering, or appraising residential real estate -selling or renting a dwelling
-Handicap -Race or color -Marital Status
-Familial Status -Religion -Age
-National Origin -Source of Income
-Sex
Fair Lending Laws and Prohibited Basis Groups
+ Reg B, HMDA, and CRA are related

Fair Lending the Basics
9 of 58
Fair Lending and The Lending Cycle
Pre-Application
Application
Underwriting /
Closing
Servicing / Post-closing
-Advertising & Market Selection -Channels -Responding to Inquiries
-Level of Assistance -Use of 3rd Parties -Initial Terms & Conditions -Approval Criteria
-Final Terms & Conditions -Appraisal Practices
-Modifications -Default Remedies
-REO
Fair Lending the Basics
10 of 58
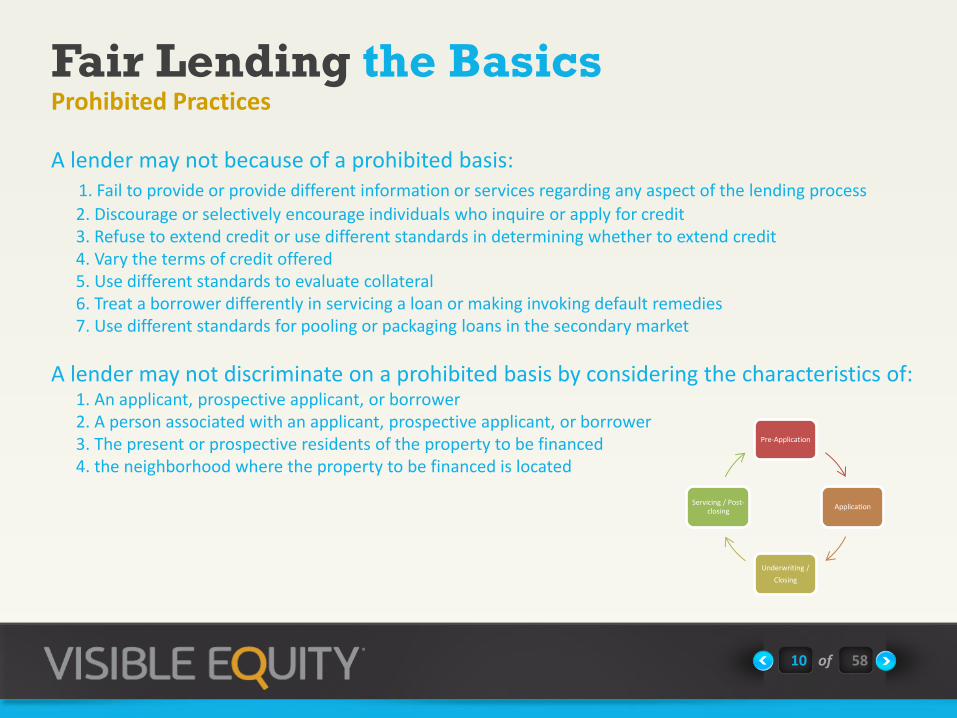
A lender may not because of a prohibited basis: 1. Fail to provide or provide different information or services regarding any aspect of the lending process
2. Discourage or selectively encourage individuals who inquire or apply for credit 3. Refuse to extend credit or use different standards in determining whether to extend credit 4. Vary the terms of credit offered 5. Use different standards to evaluate collateral 6. Treat a borrower differently in servicing a loan or making invoking default remedies 7. Use different standards for pooling or packaging loans in the secondary market
A lender may not discriminate on a prohibited basis by considering the characteristics of: 1. An applicant, prospective applicant, or borrower 2. A person associated with an applicant, prospective applicant, or borrower 3. The present or prospective residents of the property to be financed 4. the neighborhood where the property to be financed is located
Prohibited Practices
Pre-Application
Application
Underwriting /
Closing
Servicing / Post-closing

Fair Lending the Basics
11 of 58
1. Disparate Treatment
Types of Discrimination
Treating an applicant or borrower differently due to a prohibited basis during any aspect of the lending process.
>Overt Discrimination -Lender openly discriminates on a prohibited basis (can be written or verbal)
>Comparative Evidence -Differences in treatment not fully explained by legitimate non-discriminatory factors
*Does not require evidence the lender intended to discriminate or was motivated by prejudice
2. Disparate Impact (“Effects Test”)
When an otherwise neutral policy or practice has a disproportionately negative impact on persons from a prohibited basis group. *A disparate impact claim must show the challenged policy or practice is either not justified by a valid business propose or that the business justification could be accomplished using a less discriminatory alternative.

Fair Lending the Basics
12 of 58
Discrimination?
Example 1
-For joint applicants, combine the debts and income of married joint applicants to calculate debt-to-income ratio and for unmarried joint applicants calculate an individual debt-to-income ratio for each applicant.
Yes!
Prohibited Basis: Age
Discrimination Type: Disparate Treatment-Overt
Prohibited Practice: Vary the terms of credit offered
Example 2
Credit Card Limits: -$750 for age 21-30 -$1,500 for age over 30
Yes!
Prohibited Basis: Marital Status
Discrimination Type: Disparate Treatment-Overt
Prohibited Practice: Refuse to extend credit or use different standards in determining whether to extend credit
Fair Lending the Basics www.visibleequity.com
13 of 58
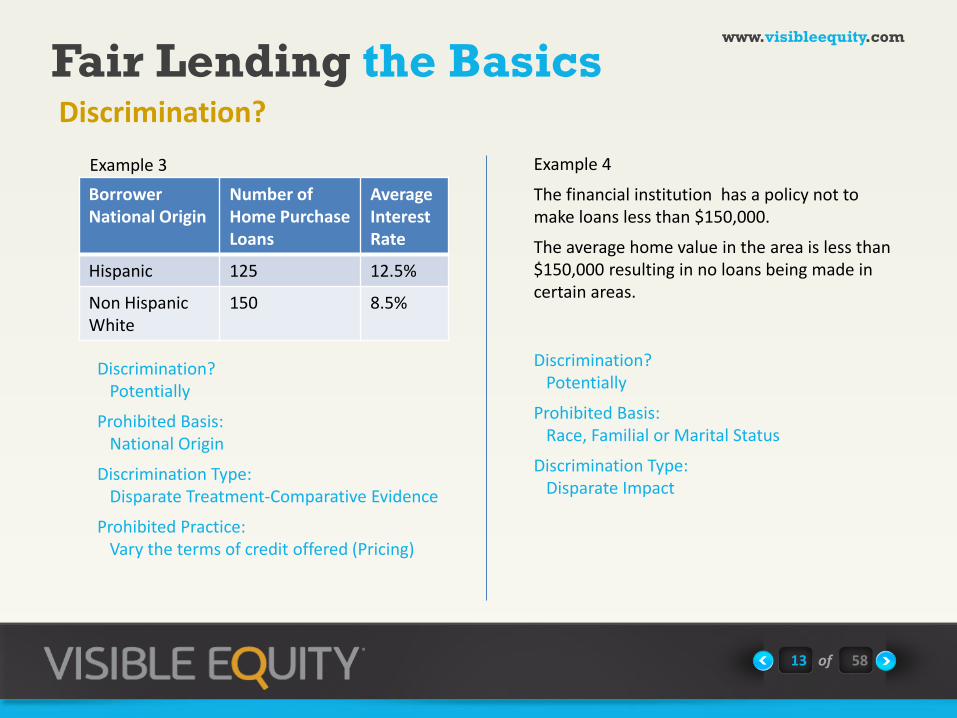
Discrimination?
Example 4
The financial institution has a policy not to make loans less than $150,000.
The average home value in the area is less than $150,000 resulting in no loans being made in certain areas.
Discrimination? Potentially
Prohibited Basis: National Origin
Discrimination Type: Disparate Treatment-Comparative Evidence
Prohibited Practice: Vary the terms of credit offered (Pricing)
Borrower National Origin
Number of Home Purchase Loans
Average Interest Rate
Hispanic 125 12.5%
Non Hispanic White
150 8.5%
Example 3
Discrimination? Potentially
Prohibited Basis: Race, Familial or Marital Status
Discrimination Type: Disparate Impact
Fair Lending the Basics
14 of 58
U.S. Department of Housing and Urban Development Office of Policy Development and Research
All Other Things Being Equal:
A Paired Testing Study of
Mortgage Lending Institutions
Final Report
April 2002

Fair Lending the Basics
15 of 58
All Other Things Being Equal:
A Paired Testing Study of
Mortgage Lending Institutions
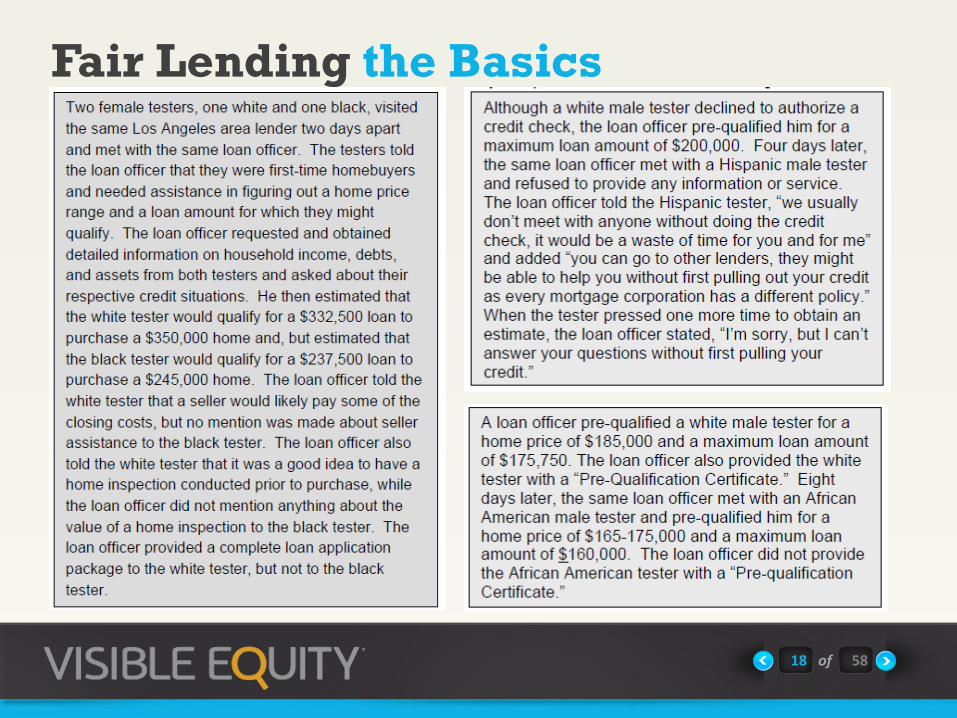
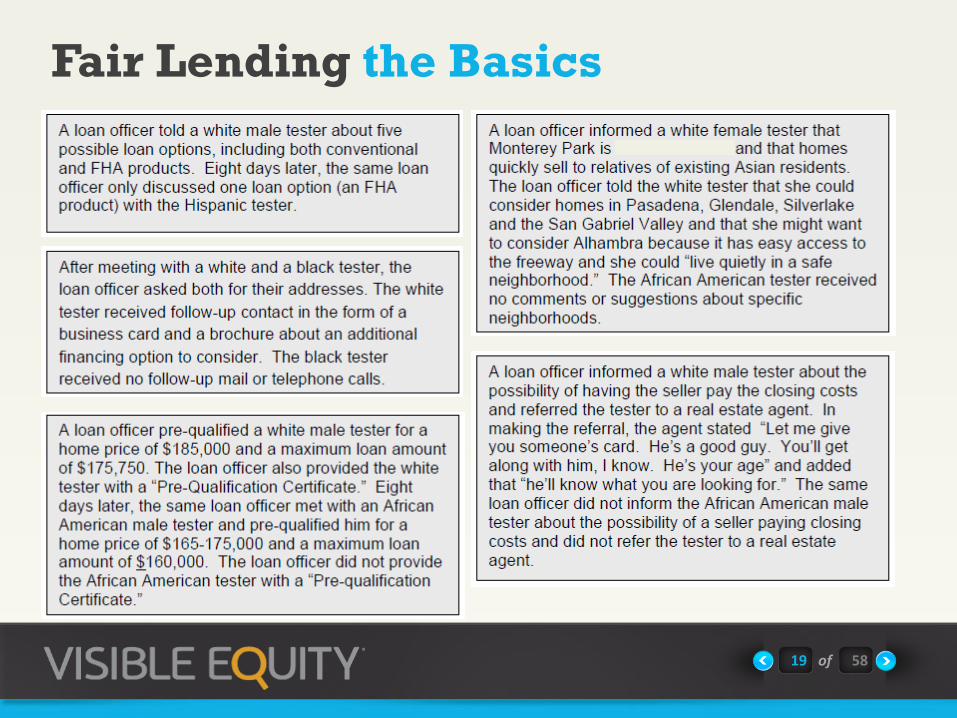
In a paired test, two individuals―one white and one minority―pose as
homebuyers and inquire about the availability and terms for home
mortgage loans. Because the two members of a tester team present
themselves as equally qualified borrowers in every respect except their
race or ethnicity, systematic differences in the treatment they receive
provide direct evidence of adverse treatment discrimination.
The Results?

Fair Lending the Basics
16 of 58
In Los Angeles -
Blacks were offered less coaching than comparable white homebuyers and were
more likely to be encouraged to consider an FHA loan.
Hispanics were denied basic information about loan amount and house price, told
about fewer products, and received less follow-up than comparable Anglo
homebuyers.
In Chicago –
Blacks were denied basic information about loan amount and house price, told about
fewer products, offered less coaching, and received less follow-up than comparable
white homebuyers.
Hispanics were quoted lower loan amounts or house prices, told about fewer
products, and offered less coaching than comparable Anglo homebuyers.
The Results

Fair Lending the Basics
17 of 58
Fair Lending the Basics
18 of 58
Fair Lending the Basics
19 of 58

Fair Lending the Basics-
20 of 58

Fair Lending the Basics
21 of 58
Discrimination Type:
Disparate Treatment-Comparative Evidence (Statistical Analysis & Interviews)
Prohibited Practices:
Steering Claims (vary the terms of credit, others)
Pricing Claims (vary the terms of credit)
Findings:
African Americans 3x more likely to be put in a “subprime” product than similarly
situated white borrowers
Sources of Fair Lending Risk:
Policies and procedures inadequate
Loan officers were given discretion in setting rates, fees, and terms
Loan officers were compensated for putting buyers in higher priced loans
Bank of America Settlement ($335 M)- Accused of Discriminatory Lending (at Countrywide Home Loans)

Fair Lending Assessing Your Risk
22 of 58
The 5* Main Sources of Potential Fair Lending Risk
1. Marketing Activities
2. Discretion Permitted
3. Exceptions
4. Role of Third Parties
5. Incentives & Compensation
*In addition to overt discrimination and the technical requirements of Reg B and other fair lending
laws.
Fair Lending Assessing Your Risk
23 of 58
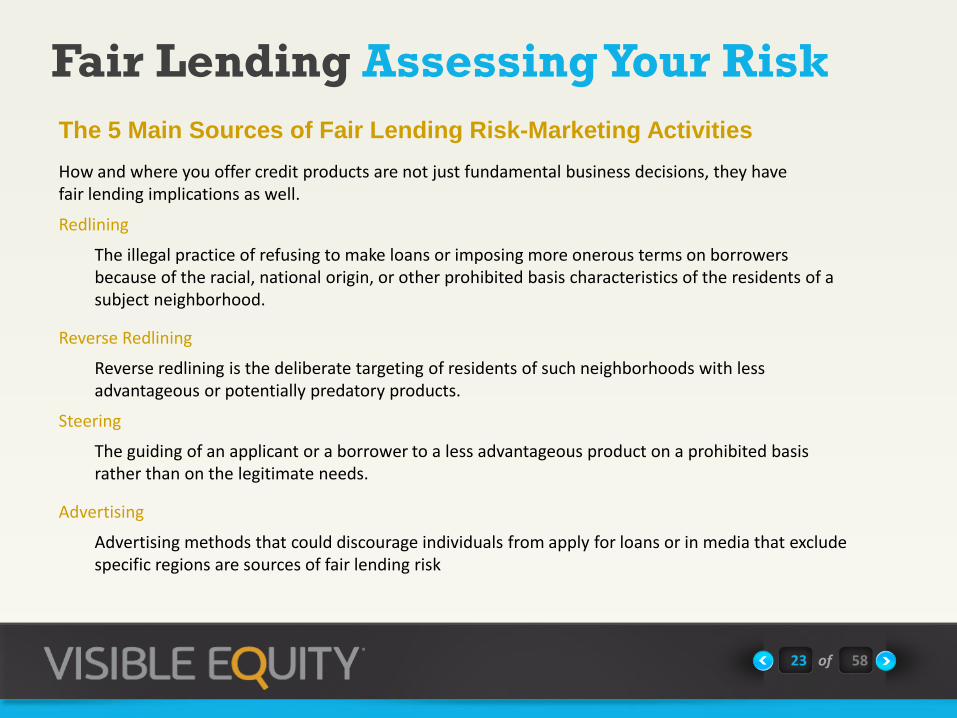
The 5 Main Sources of Fair Lending Risk-Marketing Activities
Redlining
The illegal practice of refusing to make loans or imposing more onerous terms on borrowers because of the racial, national origin, or other prohibited basis characteristics of the residents of a subject neighborhood.
Reverse Redlining
Reverse redlining is the deliberate targeting of residents of such neighborhoods with less advantageous or potentially predatory products.
Steering
The guiding of an applicant or a borrower to a less advantageous product on a prohibited basis rather than on the legitimate needs.
Advertising
Advertising methods that could discourage individuals from apply for loans or in media that exclude specific regions are sources of fair lending risk
How and where you offer credit products are not just fundamental business decisions, they have fair lending implications as well.
Fair Lending Assessing Your Risk
24 of 58
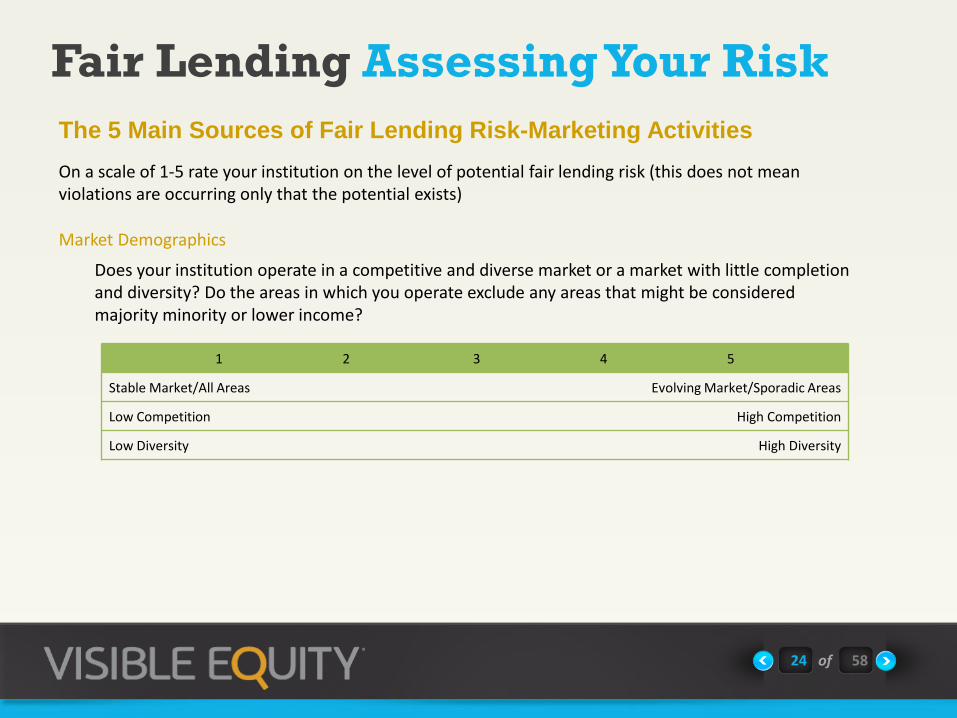
The 5 Main Sources of Fair Lending Risk-Marketing Activities
Market Demographics
Does your institution operate in a competitive and diverse market or a market with little completion and diversity? Do the areas in which you operate exclude any areas that might be considered majority minority or lower income?
On a scale of 1-5 rate your institution on the level of potential fair lending risk (this does not mean violations are occurring only that the potential exists)
1 2 3 4 5
Stable Market/All Areas Evolving Market/Sporadic Areas
Low Competition High Competition
Low Diversity High Diversity

Fair Lending Assessing Your Risk
25 of 58
The 5 Main Sources of Fair Lending Risk-Marketing Activities
Delivery Channels
Does your institution have multiple delivery channels (e.g. website, telephone, face-to-face, third parties, etc.)? Do decisions and processes related to application processing, underwriting, pricing, servicing, etc. vary by channel? Do you have “subprime” or similar subsidiaries or related businesses you refer certain applicants to?
On a scale of 1-5 rate your institution on the level of potential fair lending risk (this does not mean violations are occurring only that the potential exists)
1 2 3 4 5
Limited Channels Multiple Channels
Decisions/Processes do not vary by channel Decisions/Processes vary by channel
No Subprime Subsidiaries/Partners No Subprime Subsidiaries/Partners

Fair Lending Assessing Your Risk
26 of 58
The 5 Main Sources of Fair Lending Risk-Marketing Activities
Product Complexity Do you offer “non-traditional”, “subprime” or other products the industry would consider complex,
difficult to understand, or potentially less advantageous than traditional products?
On a scale of 1-5 rate your institution on the level of potential fair lending risk (this does not mean violations are occurring only that the potential exists)
1 2 3 4 5
Traditional Product Mix Complex and Non-traditional Product Mix
New Products Reviewed for Fair Lending Compliance New Products Not Reviewed
Advertising How complex is your advertising program? Do you advertise in multiple media platforms and/or in
multiple languages? Is your advertising constantly changing? Do you advertise exclusively in areas or through media that is targeted at areas considered majority minority or lower income? Could any of your advertising pieces be considered threatening or discouraging to a protected class?
1 2 3 4 5
Limited Advertising Extensive Advertising
No Recent Changes Constantly Changing Advertising
Broad Based Targeted
Fair Lending Assessing Your Risk
27 of 58
The 5 Main Sources of Fair Lending Risk-Marketing Activities
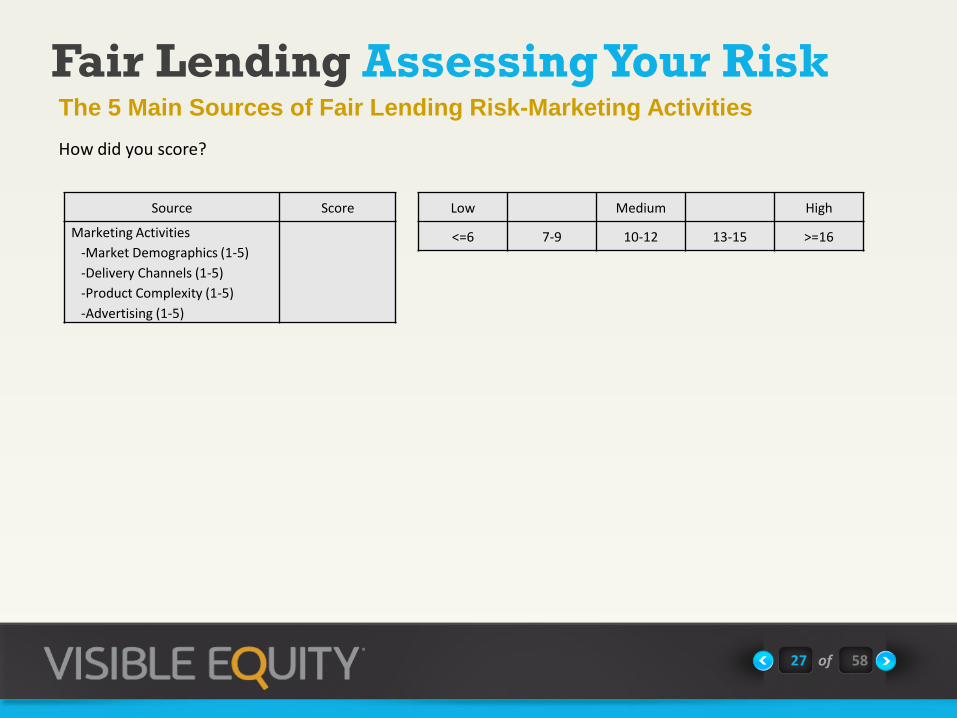
How did you score?
Source Score
Marketing Activities
-Market Demographics (1-5)
-Delivery Channels (1-5)
-Product Complexity (1-5)
-Advertising (1-5)
Low Medium High
<=6 7-9 10-12 13-15 >=16

Fair Lending Assessing Your Risk
28 of 58
The 5 Main Sources of Fair Lending Risk-Discretion Permitted
Discretion Permitted
How much discretion is permitted? Does the degree of permitted discretion vary by geography, channel, or activity? Can the exercise of discretion impact compensation? Do disparities by a prohibited basis group exist in the discretion exercised?
On a scale of 1-5 rate your institution on the level of potential fair lending risk (this does not mean violations are occurring only that the potential exists)
1 2 3 4 5
Limited and Consistent Discretion Broad and Variable Discretion
Discretion criteria is clear Discretion criteria is broad or non-existent
Discretion does not impact compensation Discretion does impact compensation
No Disparities Resulting From Exercised Discretion Unexplained Discrepancies Exists
Allowing discretion has many benefits and in fact is usually used in the favor of the applicant or borrower.
However, the level of individual discretion permitted in certain activities such as approvals or pricing increases an institution’s fair lending risk. Centralized lending operations with clear and objective non discriminatory policies and procedures that are taught, followed, and monitored significantly reduces the level of fair lending risk.

Fair Lending Assessing Your Risk
29 of 58
The 5 Main Sources of Fair Lending-Discretion Permitted
How did you score?
Source Score
Marketing Activities
Discretion Permitted
Low Medium High
<=6 7-9 10-12 13-15 >=16
1 2 3 4 5
Fair Lending Assessing Your Risk
30 of 58
The 5 Main Sources of Fair Lending Risk-Exception Handling
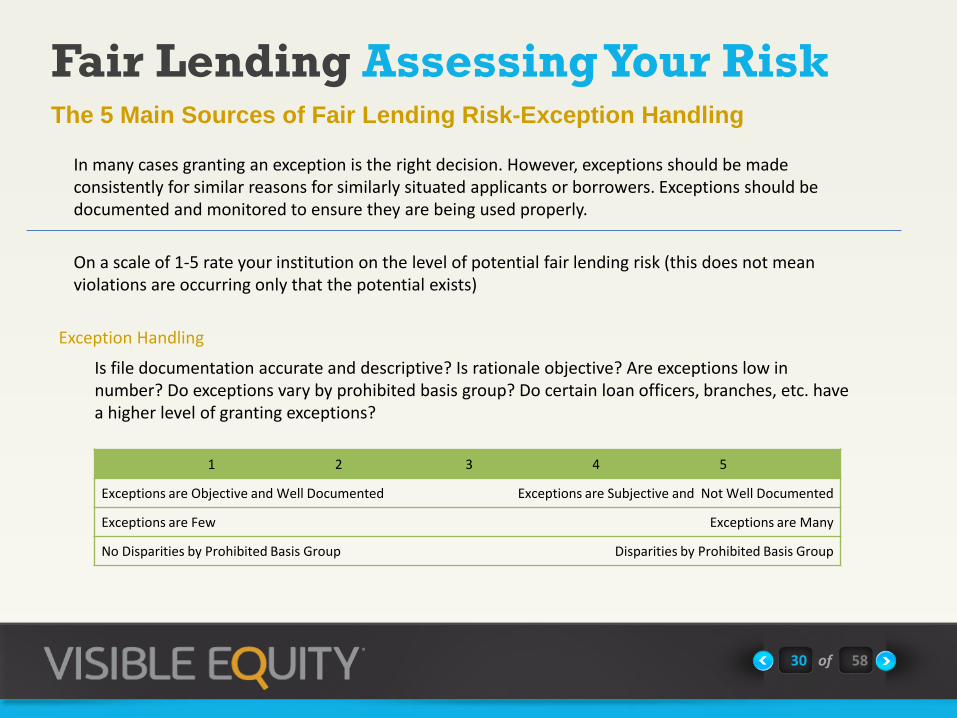
Exception Handling
Is file documentation accurate and descriptive? Is rationale objective? Are exceptions low in number? Do exceptions vary by prohibited basis group? Do certain loan officers, branches, etc. have a higher level of granting exceptions?
On a scale of 1-5 rate your institution on the level of potential fair lending risk (this does not mean violations are occurring only that the potential exists)
1 2 3 4 5
Exceptions are Objective and Well Documented Exceptions are Subjective and Not Well Documented
Exceptions are Few Exceptions are Many
No Disparities by Prohibited Basis Group Disparities by Prohibited Basis Group
In many cases granting an exception is the right decision. However, exceptions should be made consistently for similar reasons for similarly situated applicants or borrowers. Exceptions should be documented and monitored to ensure they are being used properly.
Fair Lending Assessing Your Risk
31 of 58
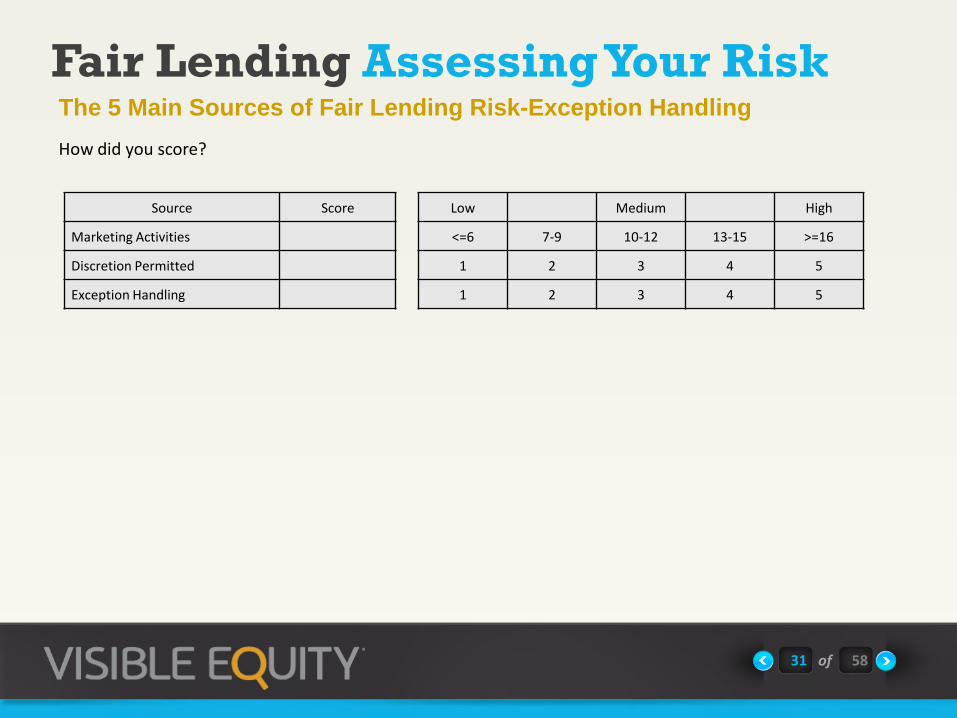
The 5 Main Sources of Fair Lending Risk-Exception Handling
How did you score?
Source Score
Marketing Activities
Discretion Permitted
Exception Handling
Low Medium High
<=6 7-9 10-12 13-15 >=16
1 2 3 4 5
1 2 3 4 5

Fair Lending Assessing Your Risk
32 of 58
The 5 Main Sources of Fair Lending Risk-Role of Third Parties
Third party operators (TPOs) such as mortgage brokers and auto dealers offer legitimate opportunities to extend lending operations and enhance product offerings.
From a fair lending perspective TPOs are the financial institution and if any TPO does not comply with fair lending regulations the financial institution may be as culpable as if you were the initial creditor.
Fair Lending Assessing Your Risk
33 of 58
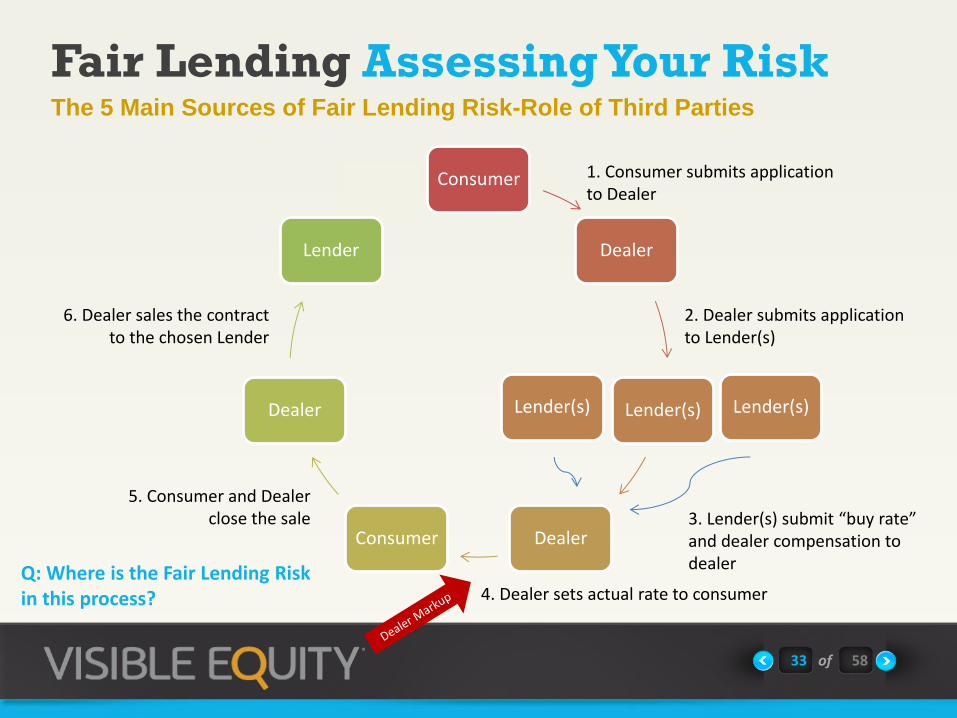
The 5 Main Sources of Fair Lending Risk-Role of Third Parties
Consumer
Dealer
Lender(s)
Dealer Consumer
Dealer
Lender
1. Consumer submits application to Dealer
2. Dealer submits application to Lender(s)
3. Lender(s) submit “buy rate” and dealer compensation to dealer
4. Dealer sets actual rate to consumer
5. Consumer and Dealer close the sale
Lender(s) Lender(s)
6. Dealer sales the contract to the chosen Lender
Q: Where is the Fair Lending Risk in this process?
Fair Lending Assessing Your Risk
34 of 58
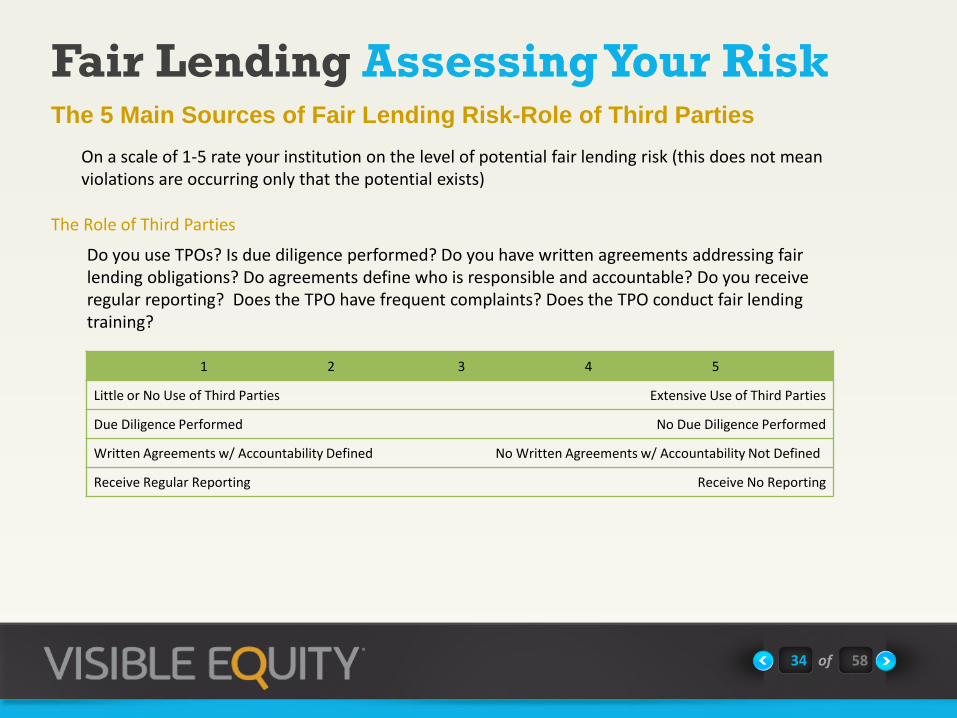
The 5 Main Sources of Fair Lending Risk-Role of Third Parties
The Role of Third Parties
Do you use TPOs? Is due diligence performed? Do you have written agreements addressing fair lending obligations? Do agreements define who is responsible and accountable? Do you receive regular reporting? Does the TPO have frequent complaints? Does the TPO conduct fair lending training?
On a scale of 1-5 rate your institution on the level of potential fair lending risk (this does not mean violations are occurring only that the potential exists)
1 2 3 4 5
Little or No Use of Third Parties Extensive Use of Third Parties
Due Diligence Performed No Due Diligence Performed
Written Agreements w/ Accountability Defined No Written Agreements w/ Accountability Not Defined
Receive Regular Reporting Receive No Reporting

Fair Lending Assessing Your Risk
35 of 58
The 5 Main Sources of Fair Lending Risk-Role of 3rd Parties (TPOs)
How did you score?
Source Score
Marketing Activities
Discretion Permitted
Exception Handling
Role of Third Parties
Low Medium High
<=6 7-9 10-12 13-15 >=16
1 2 3 4 5
1 2 3 4 5
1 2 3 4 5

Fair Lending Assessing Your Risk
36 of 58
The 5 Main Sources of Fair Lending-Incentives & Compensation
Incentives & Compensation
Are your loan officer and other decision makers compensated on loan production? Is compensation tied to higher pricing or higher fees?
On a scale of 1-5 rate your institution on the level of potential fair lending risk (this does not mean violations are occurring only that the potential exists)
1 2 3 4 5
Incentives & Compensation Not Tied to Loan
Production Incentives & Compensation Tied to Loan Production
Incentives & Compensation Not Tied to Loan Pricing
and/or Fees
Incentives & Compensation Tied to Loan Pricing and/or
Fees
Compensation tied to loan production can be a great motivator for a tough job, but it can also lead to significant fair lending issues. If loan officers or other decision makers are incented to steer borrowers into certain products disparate impact against protected groups can occur.

Fair Lending Assessing Your Risk
37 of 58
The 5 Main Sources of Fair Lending Risk-Incentives & Compensation
How did you score?
Source Score
Marketing Activities
Discretion Permitted
Exception Handling
Role of Third Parties
Incentives & Compensation
TOTAL
Low Medium-Low Medium Medium-High High
<=6 7-9 10-12 13-15 >=16
1 2 3 4 5
1 2 3 4 5
1 2 3 4 5
1 2 3 4 5
<=12 13-19 20-26 27-33 >=34
Fair Lending Assessing Your Risk
38 of 58
Fair Lending Assessing Your Risk
39 of 58
Fair Lending Performance Reports
40 of 58
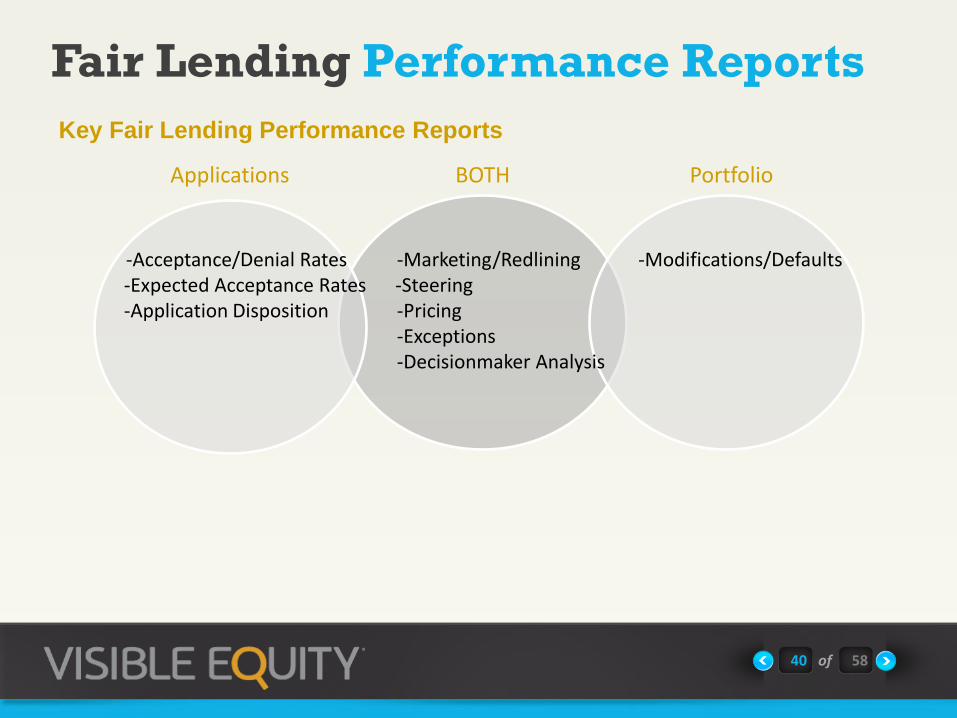
Key Fair Lending Performance Reports
Portfolio BOTH Applications
-Acceptance/Denial Rates -Marketing/Redlining -Modifications/Defaults -Expected Acceptance Rates -Steering -Application Disposition -Pricing -Exceptions -Decisionmaker Analysis

Fair Lending Performance Reports
41 of 58
Key Fair Lending Performance Reports-Application Rates
Approved
Applications
Denied
Applications Total Applications
Approval /Denial
Rates
Denial Relative
Impact
White 1000 100 1100 90.9%/9.1% 1.0
Hispanic 500 200 700 71.4%/28.6% 3.14
Black 150 150 300 50%/50% 5.5
Etc.
-Application Rates by Race/Ethnicity, Gender, Age, Marital Status, Census Tract Metric (Income, Majority Minority, Etc.
-Higher denial rates indicate potential disparate treatment.

Fair Lending Performance Reports
42 of 58
Key Fair Lending Performance Reports-Expected Approval Rates
Actual Approval
Rate
Expected
Approval Rate Status
White 92.3% 90.0% OK
Hispanic 55.0% 58.2% OK
Black 22.3% 43.4% !
Etc.
-Approval Rates by Race/Ethnicity, Gender, Age, Marital Status, Census Tract Metric (Income, Majority Minority, Etc.
-The Expected Approval Rate incorporates borrower and collateral risk. Differences are an indication of disparate treatment.
-The difference between actual and expected must be significant in terms of both statistical accuracy and magnitude.

Fair Lending Performance Reports
43 of 58
Key Fair Lending Performance Reports-Application Disposition
Total Applications Approved
Applications
Denied
Applications
Withdrawn
Applications Etc.
White 1200 1000 (83.3%) 100 (8.3%) 25 (2.0%)
Hispanic 800 500 (62.5%) 200 (25.0%) 50 (6.2%)
Black 400 150 (37.5%) 150 (37.5%) 60 (15.0%)
Etc.
-Application Disposition by Race/Ethnicity, Gender, Age, Marital Status, Census Tract Metric (Income, Majority Minority, Etc.), Etc.
-High Levels of withdrawn applications are an indicator of potential disparate treatment.

Fair Lending Performance Reports
44 of 58
Key Fair Lending Performance Reports-Marketing/Redlining
% of Loan Count % of Market Area Market Relative
Impact
Upper Income 12.5% 10% .8
Middle Income 70% 60% .86
Moderate Income 12.5% 5% .4
Low Income 5% 25% 5.0
-Applications or Loans by Race/Ethnicity, Gender, Age, Marital Status, Census Tract Metrics (Income, Majority Minority, Etc.), Etc.
-Disparities between application or portfolio mix and market area mix are an indication of potential redlining.
Fair Lending Performance Reports
45 of 58
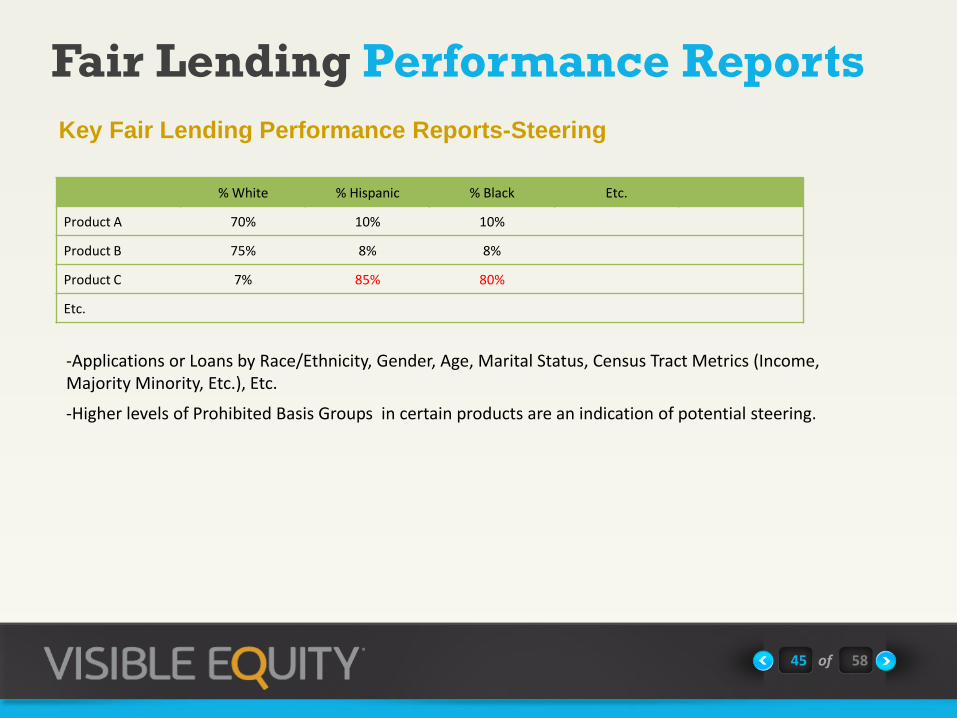
Key Fair Lending Performance Reports-Steering
% White % Hispanic % Black Etc.
Product A 70% 10% 10%
Product B 75% 8% 8%
Product C 7% 85% 80%
Etc.
-Applications or Loans by Race/Ethnicity, Gender, Age, Marital Status, Census Tract Metrics (Income, Majority Minority, Etc.), Etc.
-Higher levels of Prohibited Basis Groups in certain products are an indication of potential steering.
Fair Lending Performance Reports
46 of 58
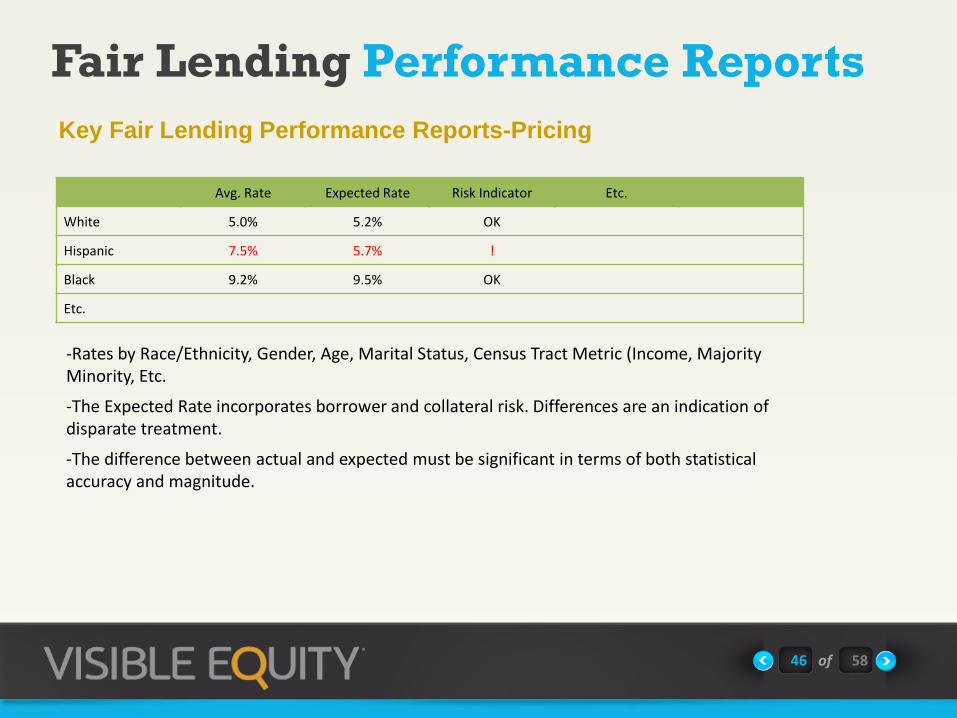
Key Fair Lending Performance Reports-Pricing
Avg. Rate Expected Rate Risk Indicator Etc.
White 5.0% 5.2% OK
Hispanic 7.5% 5.7% !
Black 9.2% 9.5% OK
Etc.
-Rates by Race/Ethnicity, Gender, Age, Marital Status, Census Tract Metric (Income, Majority Minority, Etc.
-The Expected Rate incorporates borrower and collateral risk. Differences are an indication of disparate treatment.
-The difference between actual and expected must be significant in terms of both statistical accuracy and magnitude.
Fair Lending Performance Reports
47 of 58
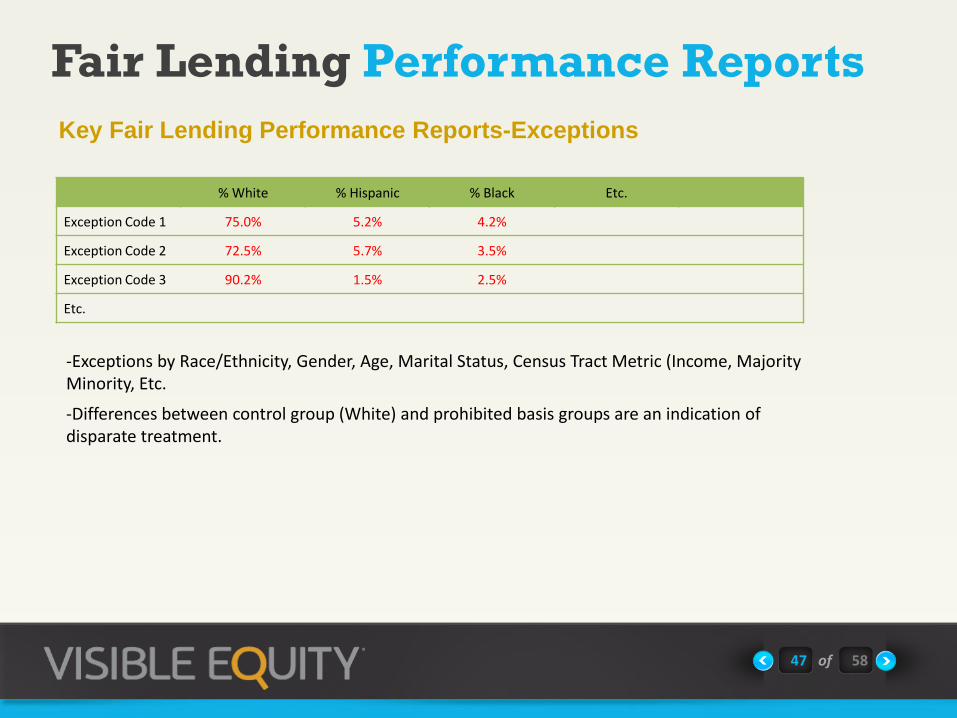
Key Fair Lending Performance Reports-Exceptions
% White % Hispanic % Black Etc.
Exception Code 1 75.0% 5.2% 4.2%
Exception Code 2 72.5% 5.7% 3.5%
Exception Code 3 90.2% 1.5% 2.5%
Etc.
-Exceptions by Race/Ethnicity, Gender, Age, Marital Status, Census Tract Metric (Income, Majority Minority, Etc.
-Differences between control group (White) and prohibited basis groups are an indication of disparate treatment.
Fair Lending Performance Reports
48 of 58
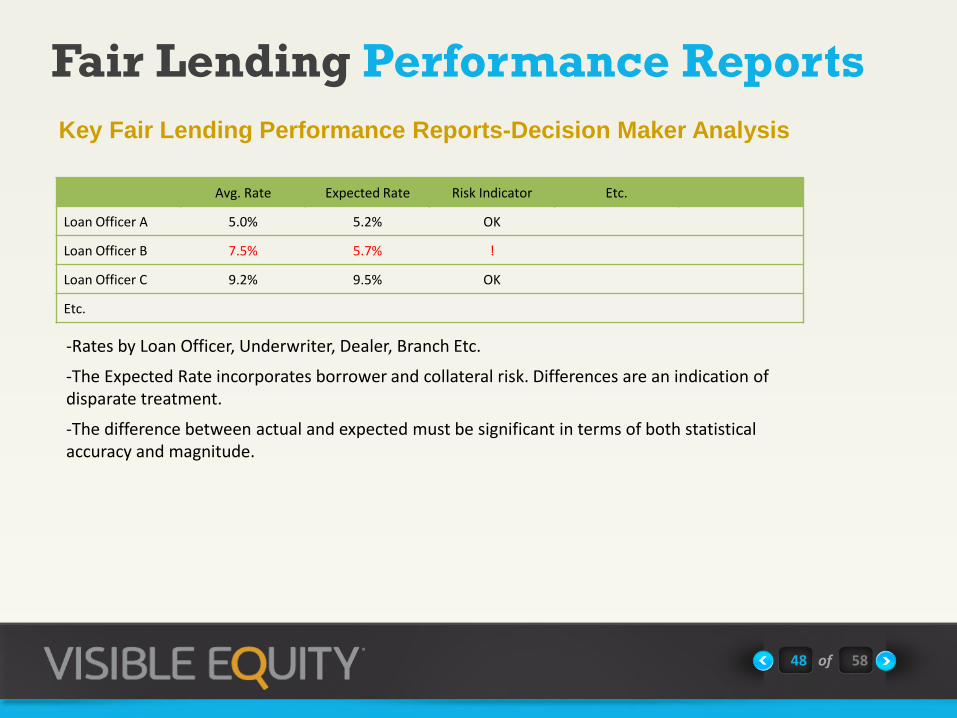
Key Fair Lending Performance Reports-Decision Maker Analysis
Avg. Rate Expected Rate Risk Indicator Etc.
Loan Officer A 5.0% 5.2% OK
Loan Officer B 7.5% 5.7% !
Loan Officer C 9.2% 9.5% OK
Etc.
-Rates by Loan Officer, Underwriter, Dealer, Branch Etc.
-The Expected Rate incorporates borrower and collateral risk. Differences are an indication of disparate treatment.
-The difference between actual and expected must be significant in terms of both statistical accuracy and magnitude.
Fair Lending Performance Reports
49 of 58
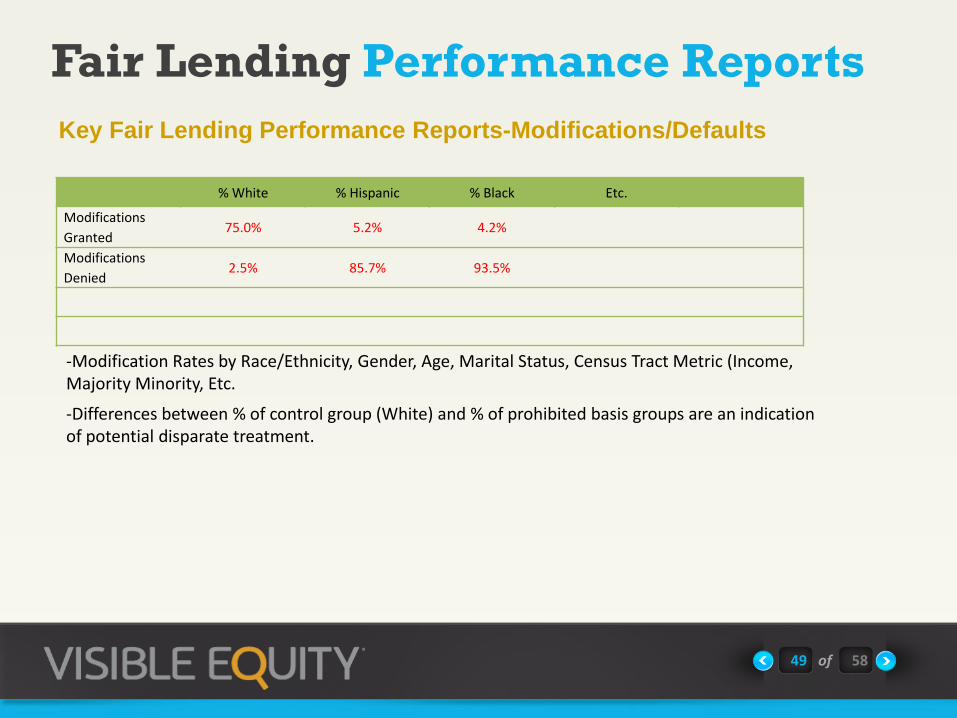
Key Fair Lending Performance Reports-Modifications/Defaults
% White % Hispanic % Black Etc.
Modifications
Granted 75.0% 5.2% 4.2%
Modifications
Denied 2.5% 85.7% 93.5%
-Modification Rates by Race/Ethnicity, Gender, Age, Marital Status, Census Tract Metric (Income, Majority Minority, Etc.
-Differences between % of control group (White) and % of prohibited basis groups are an indication of potential disparate treatment.
Fair Lending Statistical Analysis
50 of 58
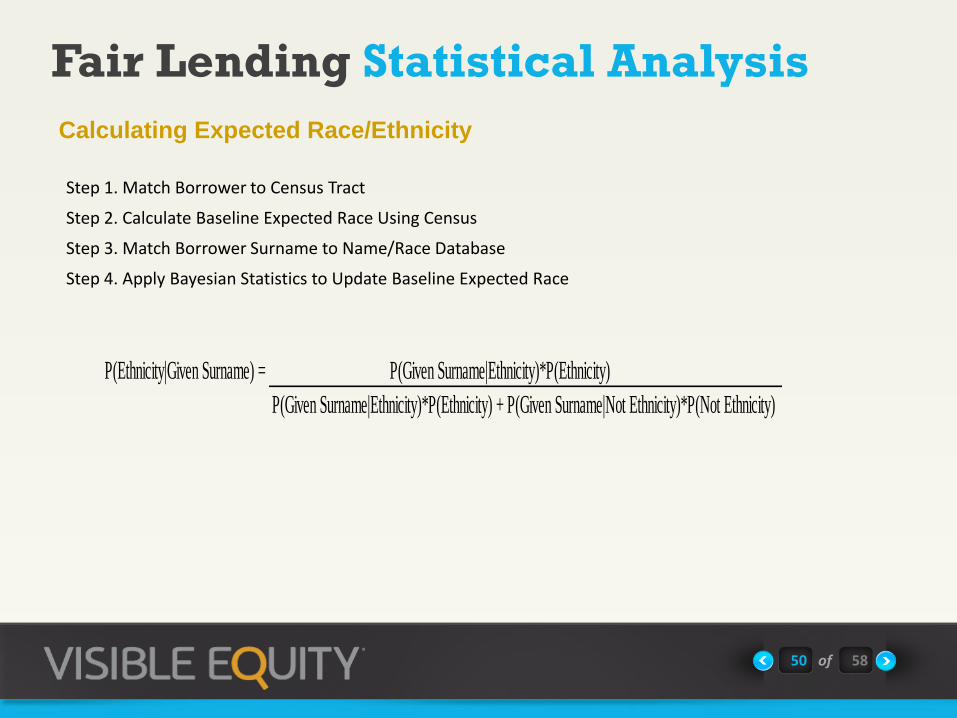
Calculating Expected Race/Ethnicity
Step 1. Match Borrower to Census Tract
Step 2. Calculate Baseline Expected Race Using Census
Step 3. Match Borrower Surname to Name/Race Database
Step 4. Apply Bayesian Statistics to Update Baseline Expected Race
P(Ethnicity|Given Surname) = P(Given Surname|Ethnicity)*P(Ethnicity)
P(Given Surname|Ethnicity)*P(Ethnicity) + P(Given Surname|Not Ethnicity)*P(Not Ethnicity)
Fair Lending Statistical Analysis
51 of 58
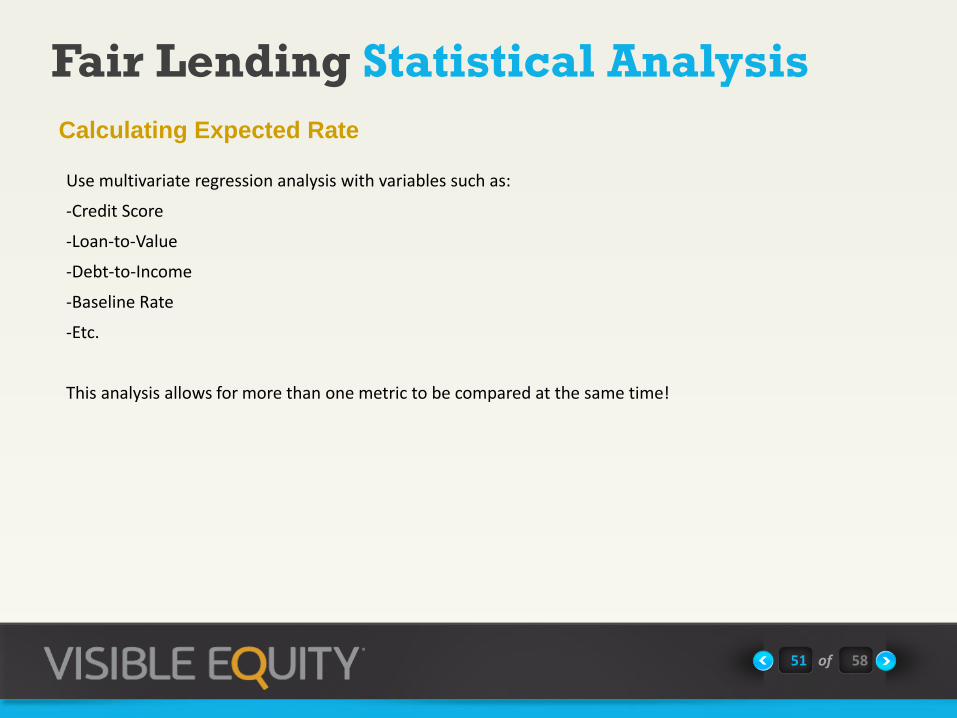
Calculating Expected Rate
Use multivariate regression analysis with variables such as:
-Credit Score
-Loan-to-Value
-Debt-to-Income
-Baseline Rate
-Etc.
This analysis allows for more than one metric to be compared at the same time!

Fair Lending Statistical Analysis
52 of 58
Comparative File Review
Use Only Marginal Transactions
Applicants that are neither clearly qualified nor clearly unqualified.
Determine Benchmark Applicant
The applicant with the least deficient reason for denial. In other words the most qualified of the denied applications for a given metric.
Compare marginal approvals with Benchmark.
If there are no approvals less qualified for a given metric then no disparate treatment exists. If there are approvals less qualified than the bench mark then potential disparate treatment exists.
Overlap Approval
An approved applicant that is no better qualified than the benchmark applicant. Note all overlap approvals and research further.
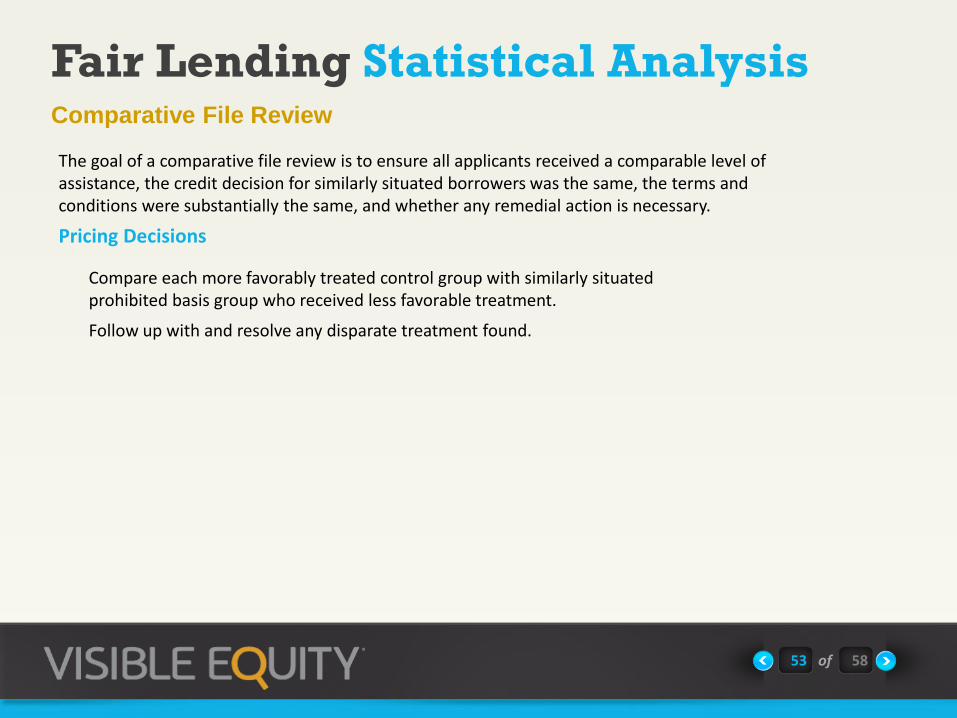
The goal of a comparative file review is to ensure all applicants received a comparable level of assistance, the credit decision for similarly situated borrowers was the same, the terms and conditions were substantially the same, and whether any remedial action is necessary.
Approve/Deny Decisions
Fair Lending Statistical Analysis
53 of 58
Comparative File Review
Compare each more favorably treated control group with similarly situated prohibited basis group who received less favorable treatment.
Follow up with and resolve any disparate treatment found.
The goal of a comparative file review is to ensure all applicants received a comparable level of assistance, the credit decision for similarly situated borrowers was the same, the terms and conditions were substantially the same, and whether any remedial action is necessary.
Pricing Decisions
Fair Lending Program
54 of 58
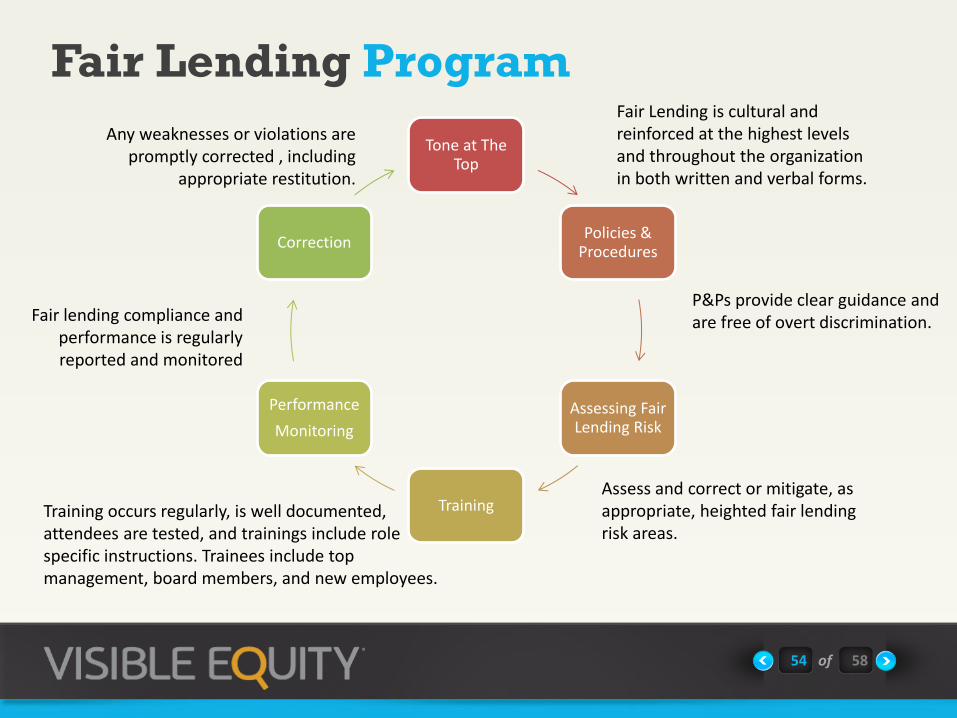
Tone at The Top
Policies & Procedures
Assessing Fair Lending Risk
Training
Performance
Monitoring
Correction
Fair Lending is cultural and reinforced at the highest levels and throughout the organization in both written and verbal forms.
P&Ps provide clear guidance and are free of overt discrimination.
Assess and correct or mitigate, as appropriate, heighted fair lending risk areas.
Training occurs regularly, is well documented, attendees are tested, and trainings include role specific instructions. Trainees include top management, board members, and new employees.
Any weaknesses or violations are promptly corrected , including
appropriate restitution.
Fair lending compliance and performance is regularly reported and monitored

Fair Lending Program
55 of 58
Financial Institutions make loans to any and all qualified borrowers using sound underwriting and pricing decisions applied consistency and equally to similarly situated borrowers without regard to any prohibited basis, such as race, gender, or age. “Fair Lending, then, is the natural state of bank (credit union) credit operations.” ABA Toolbox
Sources
56 of 58
-Visible Equity
-Comptroller’s Handbook, Fair lending, January 2010
-ABA Toolbox on Fair Lending
-Indirect Auto lending-Fair Lending Considerations, Webinar, August 6, 2013
-FDIC Presentation on Fair Lending
-NCUA, Office of Consumer Protection, Fair Lending Guide, March 2013

www.visibleequity.com
GET IN TOUCH
Address:
7070 S. Union Park Ave., Suite 260
Midvale, UT 84047
Phone:
+1 888 409 1560
Email:
facebook.com/visibleequity
twitter.com/visibleequity
57 of 58
https://www.linkedin.com/company/visible-equity
"Visible Equity makes consolidating our data and analyzing our concentration risk consistent and easy.“
Ray Wade American Airlines Credit Union
"Visible Equity realizes that all of us look at data in a different way, we all see things in a different perspective, and we're all looking at the data for different reasons. ”
Margaret Hunnicutt Landings Credit Union
“Using Visible Equity has allowed our credit union to focus on addressing potential problems rather than spending endless hours running reports and analyzing data. We continue to be impressed with the service we receive and with the functionality, accuracy, and delivery of the product. Visible Equity has been a great partner to work with for our credit union.”
Jeff Meyers Utah Community Credit Union

58 of 58