Embed Size (px)
Citation preview
Presale: Temasek Holdings Pte Ltd.Primary Credit Analyst:Greg Pau, Singapore (65) 6239-6303; [email protected]
Secondary Credit Analyst:Nancy Koh, Singapore (65) 6239-6392; [email protected]
Table Of Contents
Major Rating Factors
Rating Details
Rationale
Outlook
Ownership And Investment Strategy
Business Description
Business Profile Of Major Industrial Sectors
Strong Shareholder
Financial Profile
Peer Comparison
September 12, 2005
www.standardandpoors.com/ratingsdirect 1
Standard & Poor's. All rights reserved. No reprint or dissemination without S&P's permission. See Terms ofUse/Disclaimer on the last page.
462439 | 300571092
Presale: Temasek Holdings Pte Ltd.
ISSUER CREDIT RATINGS
Temasek Holdings Pte Ltd.
Corporate Credit Rating AAA/Stable/--
Singapore (Republic of)
Corporate Credit Rating AAA/Stable/A-1+
Business profile:
Well above average
Financial policy:
Very conservative
Debt maturities (at March 31, 2005):
Total consolidated debt stood at Singapore dollar (S$) 50.7 billion (US$30.2 billion) (refer to Table 1). At the holding company level(including debts of all 100%-owned investment vehicles), Temasek has S$5 billion debt, which is made up of exchangeable bonds andbank debt.
Bank lines/Liquid assets (at March 31, 2005):
Temasek has standby credit facilities of US$2.5 billion from a number of domestic and international banks in Singapore at the companylevel. It has substantial liquid assets, which include a mix of cash and bank deposits, government bonds, corporate bonds, and equities.Consolidated cash of S$24.4 billion and liquid investments of S$18.2 billion are more than sufficient to cover S$12.4 billion of totalconsolidated debt due within one year.
Collateralization (at March 31, 2005):
Of its S$51 billion consolidated debt, about S$11 billion (22%) are secured. These secured loans relate mainly to borrowings byTemasek-linked companies (TLCs) in the properties segment and other project financing. The bulk of Temasek's consolidated assets, withbook value of S$199 billion, remain unencumbered.
Recovery prospects:
High
Corporate credit rating history:
Oct. 12, 2004 AAA
Major Rating Factors
Strengths:
• Strong, and sometimes dominant, market positions in most business segments.
• High degree of investment diversity and liquidity.
• Exceptionally strong flexibility as a holding company.
• Well above average financial profile.
• Strong shareholder.
Standard & Poor’s RatingsDirect | September 12, 2005 2
Standard & Poor's. All rights reserved. No reprint or dissemination without S&P's permission. See Terms of Use/Disclaimer on the last page. 462439 | 300571092
Weaknesses:
• Higher operation risks in Temasek's increasing overseas investments.
Rating Details
On Sept. 12, 2005, Standard & Poor's Ratings Services assigned its 'AAA' issue rating to a proposed US$5 billion
guaranteed global medium term note (MTN) program to be issued by Temasek Financial (I) Ltd. and guaranteed by
Temasek Holdings Pte. Ltd. Under the program, Temasek may, from time to time, issue MTNs for tenors of up to
30 years. The proceeds will be used to refinance bank loans at the company level and to finance future acquisitions.
Although the bond will be structurally subordinated to the creditors at the subsidiary level, Standard & Poor's
believes that strong liquidity at the holding company level and the diversity of Temasek's investment portfolio
adequately mitigate the risk for the bondholders.
Rationale
The rating on Singapore-based Temasek Holdings reflects the following strengths:
• Strong market positions in key business segments. Most of the larger Temasek-linked companies (TLCs) have
very strong market positions. These entities account for about two-thirds of Temasek's investment portfolio value
and should continue to generate steady and sustainable cash flows for the group, despite intensifying competition
in key segments, such as telecommunications, banking, transportation, infrastructure, and engineering.
• High degree of investment diversity. Temasek's portfolio is highly diversified and, by value, is dominated by listed
subsidiaries and affiliates. The three largest assets in the portfolio make up 40% of total investment value. With
geographic concentration in Singapore, about 78% of Temasek's assets are located in countries rated 'AAA'.
Despite increasing investments in emerging Asia, these are consistent with the company's long-term target of
limiting investments in the relatively higher risk emerging Asia to one-third of total investment value. Standard &
Poor's expects Temasek to maintain this target, and hence the diversity of its portfolio.
• Exceptionally strong flexibility as a holding company. At the holding company level, Temasek maintains a very
conservative capital structure and strong liquidity. It currently has a low debt level. Despite a ceiling of 30% for
its total debt to equity in its financial policy, Temasek intends to maintain the ratio below 20% in the long term.
It also manages a pool of liquid securities. Temasek has substantial debt capacity and considerable ability to
access the capital markets when needed. Dividends received from its subsidiaries have been more than sufficient
to cover annual interest, operating expenses, and dividend payments to its shareholder. In addition, Temasek has
demonstrated its ability to sell part of its investments through share and asset disposals, placements, or
exchangeable bond issues. Since April 2004, it has raised about Singapore dollar (S$) 2.7 billion (US$1.6 billion)
through such measures. It does not guarantee the obligations of its operating subsidiaries and affiliates, and has
some insulation from the business risks of its investment portfolio. Standard & Poor's expects Temasek to
maintain strict financial discipline and significant liquidity on its balance sheet as it executes its growth strategy.
• Very strong group consolidated financial profile. Temasek has a very conservative capital structure, and enjoys
consolidated funds from operations (FFO) of about S$15 billion in fiscal 2004 (year ended March 31, 2005).
Group lease-adjusted FFO to net debt of 44%, and net debt to EBITDA of 2.5x at March 31, 2005, indicate its
financial strength. The EBITDA figure does not take into account dividends, interest, and investment income,
which aggregated to over S$4.4 billion in the year ended March 31, 2005.
www.standardandpoors.com/ratingsdirect 3
Standard & Poor's. All rights reserved. No reprint or dissemination without S&P's permission. See Terms of Use/Disclaimer on the last page. 462439 | 300571092
Presale: Temasek Holdings Pte Ltd.
• Strong shareholder. Temasek's shareholder, the Singapore government (AAA/Stable/A-1+), is financially strong.
Temasek is expected to operate independently on a commercial basis as an investment company and the
government does not guarantee Temasek's obligations. Nevertheless, the strength of the shareholder and the
constitutional arrangements that protect Temasek's reserves provide comfort.
Temasek's increasing exposure to emerging Asia has been accelerated by recently announced investments totaling
US$4.1 billion in Bank of China Ltd. (foreign currency BBB-/Positive/A-3) and China Construction Bank Corp.
(foreign currency BBB-/Positive/A-3). With these investments, the proportion of Temasek's investments in emerging
Asia is estimated at about 24%. Standard & Poor's recognizes that such investments could expose it to a number of
risks. These include higher country, legal, and regulatory risk, operation in unfamiliar markets, and exposure to
local management or partners in investments where Temasek does not have management control. Hence, the risks of
these new investments are expected to be higher than those of Temasek's existing investment portfolio. These risks
are partly mitigated by Temasek's focus in investing largely in operating and revenue generating assets, rather than
substantial greenfield projects. Despite the higher risk, Standard & Poor's believes that Temasek's business profile
should remain above average. This is provided Temasek maintains its policy of limiting its emerging market
exposures to one-third of its investment value, and that it maintains a highly diversified portfolio with key
investments in solid market positions and a conservative capital structure at the company level.
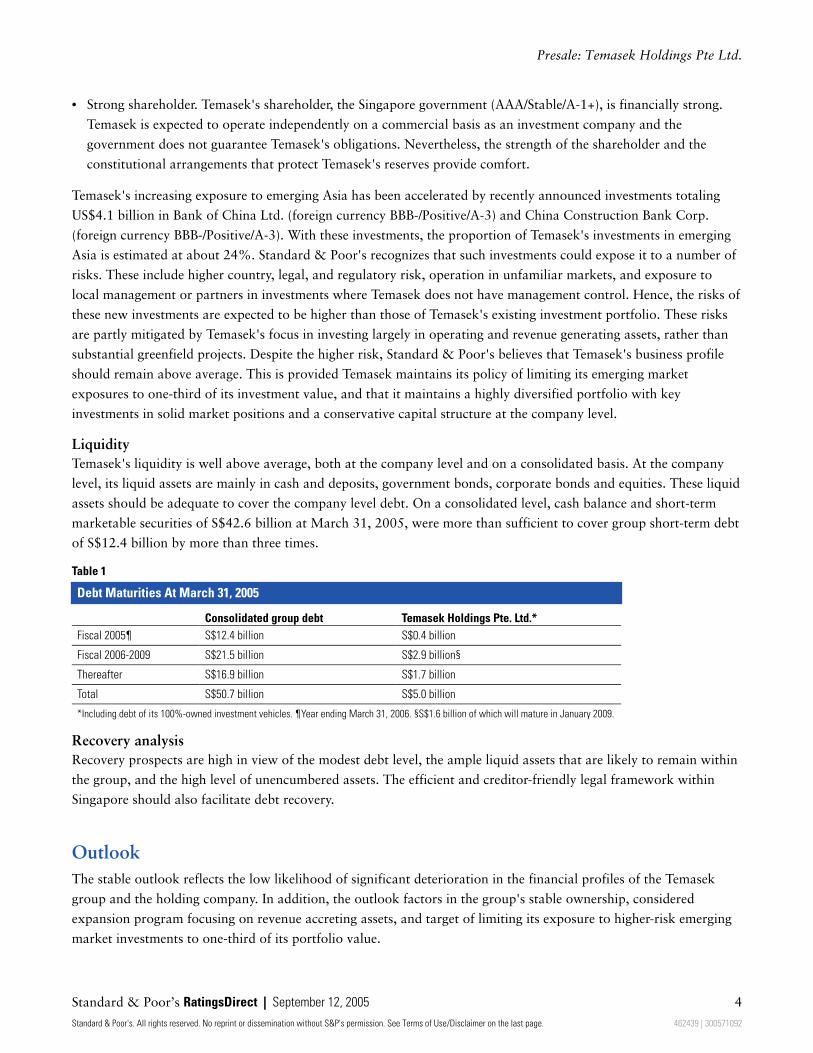
Liquidity
Temasek's liquidity is well above average, both at the company level and on a consolidated basis. At the company
level, its liquid assets are mainly in cash and deposits, government bonds, corporate bonds and equities. These liquid
assets should be adequate to cover the company level debt. On a consolidated level, cash balance and short-term
marketable securities of S$42.6 billion at March 31, 2005, were more than sufficient to cover group short-term debt
of S$12.4 billion by more than three times.
Table 1
Debt Maturities At March 31, 2005
Consolidated group debt Temasek Holdings Pte. Ltd.*
Fiscal 2005¶ S$12.4 billion S$0.4 billion
Fiscal 2006-2009 S$21.5 billion S$2.9 billion§
Thereafter S$16.9 billion S$1.7 billion
Total S$50.7 billion S$5.0 billion
*Including debt of its 100%-owned investment vehicles. ¶Year ending March 31, 2006. §S$1.6 billion of which will mature in January 2009.
Recovery analysis
Recovery prospects are high in view of the modest debt level, the ample liquid assets that are likely to remain within
the group, and the high level of unencumbered assets. The efficient and creditor-friendly legal framework within
Singapore should also facilitate debt recovery.
Outlook
The stable outlook reflects the low likelihood of significant deterioration in the financial profiles of the Temasek
group and the holding company. In addition, the outlook factors in the group's stable ownership, considered
expansion program focusing on revenue accreting assets, and target of limiting its exposure to higher-risk emerging
market investments to one-third of its portfolio value.
Standard & Poor’s RatingsDirect | September 12, 2005 4
Standard & Poor's. All rights reserved. No reprint or dissemination without S&P's permission. See Terms of Use/Disclaimer on the last page. 462439 | 300571092
Presale: Temasek Holdings Pte Ltd.
Ownership And Investment Strategy
Temasek was established in 1974 to assume ownership of a diversified portfolio of companies from the Singapore
government. It is 100% owned by the Minister for Finance (Inc). As one of the three Fifth-Schedule companies
under the Constitution of Singapore, the appointments of the CEO and the board of directors require the
concurrence of the country's president. Incorporated under the Companies Act, Temasek's stated mandate is to
enhance shareholder value as an investment holding company, and to operate purely as a commercial enterprise. The
mandate is broadly outlined in the Temasek Charter, which was formulated in 2002. Temasek seeks to ensure good
governance, performance, and competitiveness at each TLC through ensuring a high quality board of directors.
Temasek refrains from involvement in day-to-day decision making.
Temasek's performance has paralleled the country's economic development and performance. Since its inception,
Temasek's compounded total return was 18% a year, including dividends, increase in shareholder funds, or higher
market value for listed companies. This compares with the country's compounded GDP growth rate of 9% a year in
the same period. The higher return for Temasek largely reflects the strong domestic market positions of many TLCs.
Temasek has increased its overseas investments in recognition of the opportunities of emerging Asia, globalization
trends, and the liberalization of economies in Asia and other regions. The company has a long-term target of having
one-third of its investments by market value in Singapore, emerging Asia, and developed OECD countries. As at
March 31, 2005, however, the proportion was 49%, 19%, and 32%, respectively.
Although the company strives to build a diversified portfolio across industry segments and geographic regions, its
investment strategy focuses on the following:
• Emerging Asia to take advantage of its growth potential.
• Companies meeting the demand of the growing middle class, such as financial services and telecommunication
companies.
• Companies with identified comparative advantage and distinctive intellectual property, such as pharmaceutical
and bioscience sectors.
• Regional companies with the potential to grow beyond their existing markets.
Temasek identifies, evaluates, and decides independently via a thorough investment decision-making process. This
takes into account the fit of the potential investment to its existing portfolio, internal risk-adjusted return targets,
and entry and exit strategies. Although these new investments are made with a medium- to long-term horizon, their
performances are reviewed regularly.
In addition, Temasek has directly invested in equity stakes in promising regional enterprises and in emerging
knowledge-based industries. Most of these companies are relatively small and operate in higher risk industry
segments. The aggregate value of Temasek's investments in these promising regional enterprises was modest and
amounted to about 3% of its total investment value.
Temasek's increasing exposure to emerging Asia has been accelerated by recently announced investments totaling
US$4.1 billion in Bank of China and China Construction Bank. With these investments, the proportion of
Temasek's investments in emerging Asia is estimated at 24%. Standard & Poor's recognizes that such investments
could expose Temasek to a number of risks. These include higher country, legal, and regulatory risk, operation in
www.standardandpoors.com/ratingsdirect 5
Standard & Poor's. All rights reserved. No reprint or dissemination without S&P's permission. See Terms of Use/Disclaimer on the last page. 462439 | 300571092
Presale: Temasek Holdings Pte Ltd.
unfamiliar markets, and exposure to local management or partners in investments where Temasek does not have
management control. Hence, the risk levels of these new investments are expected to be higher than those of
Temasek's existing investment portfolio. These risks are partly mitigated by Temasek's focus in investing largely in
operating and revenue generating assets, rather than substantial greenfield projects. Despite the higher risk, Standard
& Poor's believes that Temasek's business profile should remain above average. This is provided Temasek maintains
its policy of limiting its emerging market exposures to one-third of its investment value, and that it maintains a
highly diversified portfolio with key investments in solid market positions and a conservative capital structure at the
company level.
Temasek has from time to time taken opportunities to unlock the value of its existing investments through partial
share disposal or issuance of exchangeable bonds. Given its substantial financial resources and staying power,
however, Temasek has much flexibility in deciding the timing of the divestments and waiting for the right value. As
some of the TLCs are managing resources critical to the smooth functioning and security of the Singapore economy,
Standard & Poor's believes that Temasek is likely to retain a majority shareholding in these strategically important
TLCs over the medium term. These TLCs include Singapore Power Ltd. (SingPower; AA/Stable/--), Singapore
Technologies Engineering Ltd. (ST Engineering), PSA Corp. Ltd. (AAA/Stable/--), Singapore Airlines Ltd. (SIA), and
SMRT Corp. Ltd. (AAA/Stable/--).
Business Description
Temasek has grown to hold a diversified investment portfolio made up of over 20 major TLCs, with an aggregate
investment value of S$103 billion, as measured by market value for listed companies and net asset value for unlisted
ones. The portfolio value could be higher as the asset values of the unlisted companies could exceed their book
values. Listed companies aggregate to about 86% of Temasek's investment portfolio, and about 78% of Temasek's
assets are located in countries rated 'AAA', mainly Singapore, Australia, and, to a lesser extent, Europe, and the U.S.
Despite an increasing focus on emerging markets in the region, management expects the percentage of assets in
'AAA'-rated countries to remain above 65% in the next 10 years.
Temasek's effective ownership levels in the major TLCs vary from 25% to 100%. Listed TLCs together account for
22% of the total market capitalization of the Singapore Exchange. Temasek does not guarantee borrowings by
TLCs, and it vigorously asserts that each TLC stands alone and does not enjoy any implicit or explicit credit support
from Temasek.
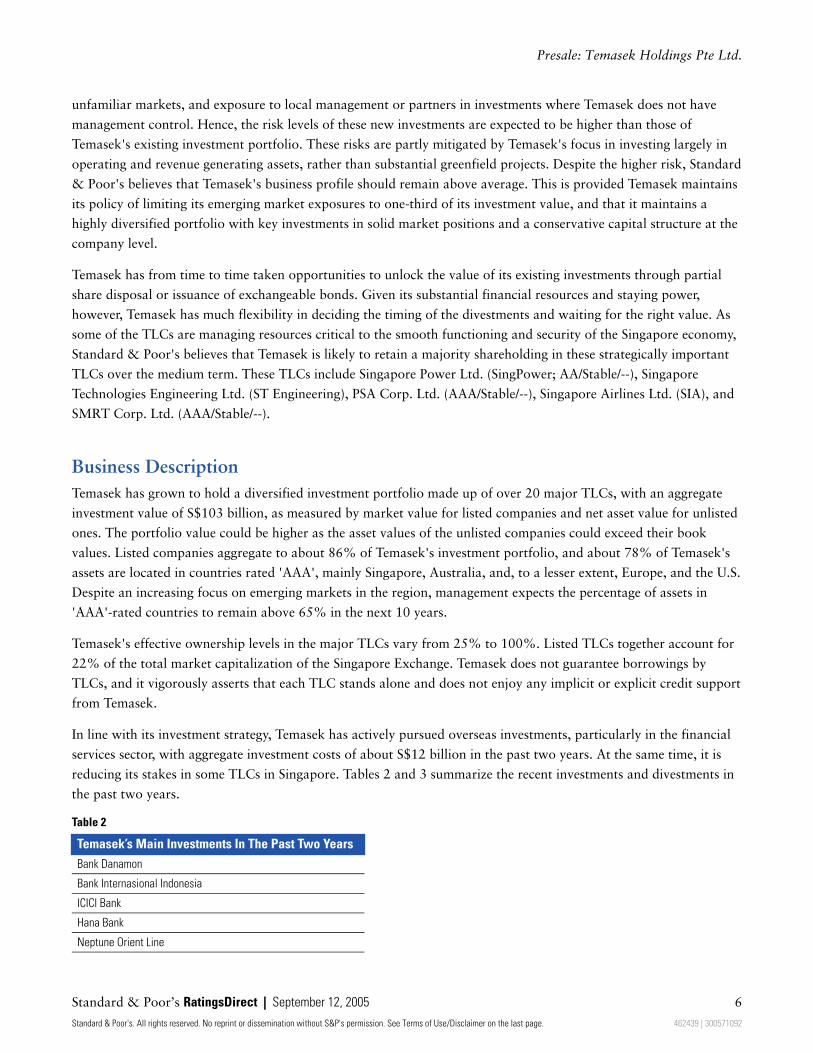
In line with its investment strategy, Temasek has actively pursued overseas investments, particularly in the financial
services sector, with aggregate investment costs of about S$12 billion in the past two years. At the same time, it is
reducing its stakes in some TLCs in Singapore. Tables 2 and 3 summarize the recent investments and divestments in
the past two years.
Table 2
Temasek’s Main Investments In The Past Two Years
Bank Danamon
Bank Internasional Indonesia
ICICI Bank
Hana Bank
Neptune Orient Line
Standard & Poor’s RatingsDirect | September 12, 2005 6
Standard & Poor's. All rights reserved. No reprint or dissemination without S&P's permission. See Terms of Use/Disclaimer on the last page. 462439 | 300571092
Presale: Temasek Holdings Pte Ltd.
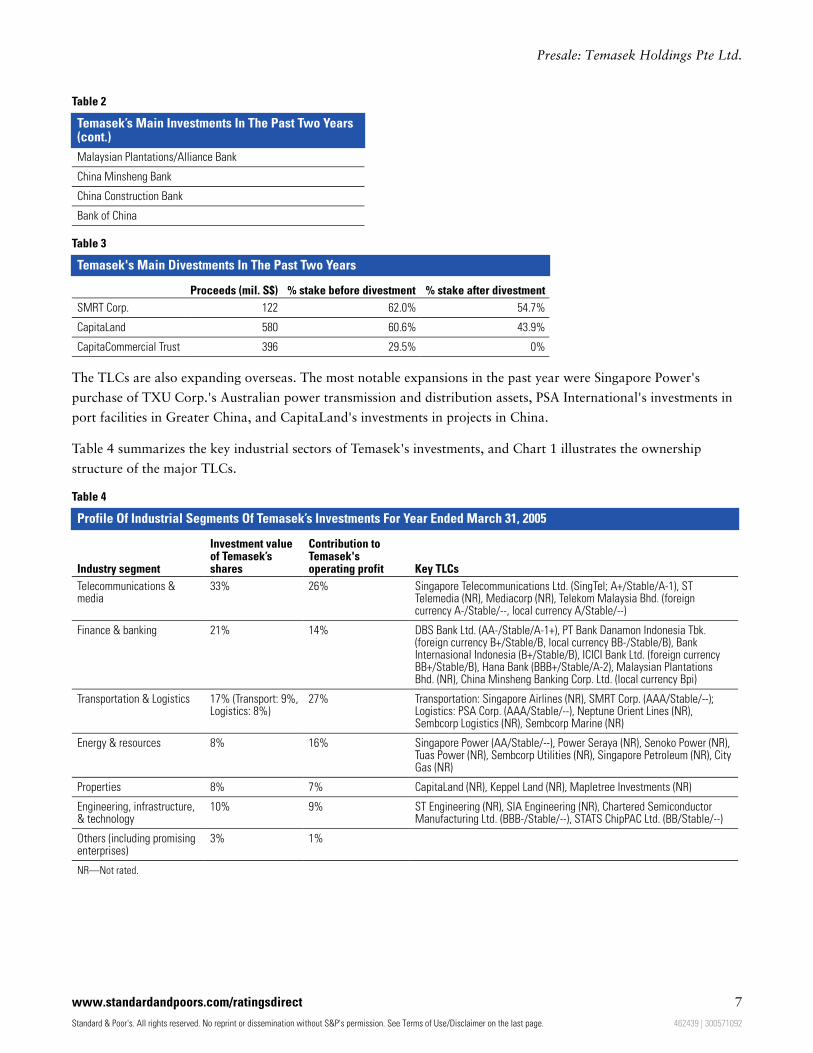
Table 2
Temasek’s Main Investments In The Past Two Years(cont.)
Malaysian Plantations/Alliance Bank
China Minsheng Bank
China Construction Bank
Bank of China
Table 3
Temasek's Main Divestments In The Past Two Years
Proceeds (mil. S$) % stake before divestment % stake after divestment
SMRT Corp. 122 62.0% 54.7%
CapitaLand 580 60.6% 43.9%
CapitaCommercial Trust 396 29.5% 0%
The TLCs are also expanding overseas. The most notable expansions in the past year were Singapore Power's
purchase of TXU Corp.'s Australian power transmission and distribution assets, PSA International's investments in
port facilities in Greater China, and CapitaLand's investments in projects in China.
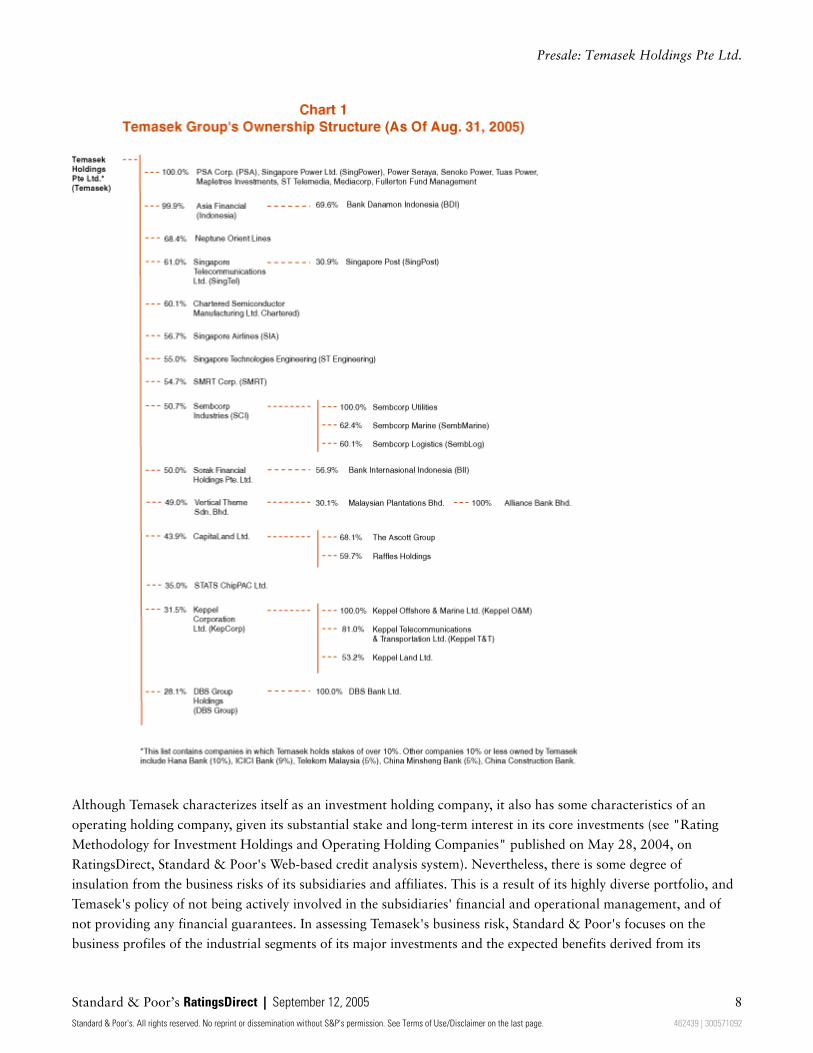
Table 4 summarizes the key industrial sectors of Temasek's investments, and Chart 1 illustrates the ownership
structure of the major TLCs.
Table 4
Profile Of Industrial Segments Of Temasek’s Investments For Year Ended March 31, 2005
Industry segment
Investment valueof Temasek’sshares
Contribution toTemasek'soperating profit Key TLCs
Telecommunications &media
33% 26% Singapore Telecommunications Ltd. (SingTel; A+/Stable/A-1), STTelemedia (NR), Mediacorp (NR), Telekom Malaysia Bhd. (foreigncurrency A-/Stable/--, local currency A/Stable/--)
Finance & banking 21% 14% DBS Bank Ltd. (AA-/Stable/A-1+), PT Bank Danamon Indonesia Tbk.(foreign currency B+/Stable/B, local currency BB-/Stable/B), BankInternasional Indonesia (B+/Stable/B), ICICI Bank Ltd. (foreign currencyBB+/Stable/B), Hana Bank (BBB+/Stable/A-2), Malaysian PlantationsBhd. (NR), China Minsheng Banking Corp. Ltd. (local currency Bpi)
Transportation & Logistics 17% (Transport: 9%,Logistics: 8%)
27% Transportation: Singapore Airlines (NR), SMRT Corp. (AAA/Stable/--);Logistics: PSA Corp. (AAA/Stable/--), Neptune Orient Lines (NR),Sembcorp Logistics (NR), Sembcorp Marine (NR)
Energy & resources 8% 16% Singapore Power (AA/Stable/--), Power Seraya (NR), Senoko Power (NR),Tuas Power (NR), Sembcorp Utilities (NR), Singapore Petroleum (NR), CityGas (NR)
Properties 8% 7% CapitaLand (NR), Keppel Land (NR), Mapletree Investments (NR)
Engineering, infrastructure,& technology
10% 9% ST Engineering (NR), SIA Engineering (NR), Chartered SemiconductorManufacturing Ltd. (BBB-/Stable/--), STATS ChipPAC Ltd. (BB/Stable/--)
Others (including promisingenterprises)
3% 1%
NR—Not rated.
www.standardandpoors.com/ratingsdirect 7
Standard & Poor's. All rights reserved. No reprint or dissemination without S&P's permission. See Terms of Use/Disclaimer on the last page. 462439 | 300571092
Presale: Temasek Holdings Pte Ltd.
Although Temasek characterizes itself as an investment holding company, it also has some characteristics of an
operating holding company, given its substantial stake and long-term interest in its core investments (see "Rating
Methodology for Investment Holdings and Operating Holding Companies" published on May 28, 2004, on
RatingsDirect, Standard & Poor's Web-based credit analysis system). Nevertheless, there is some degree of
insulation from the business risks of its subsidiaries and affiliates. This is a result of its highly diverse portfolio, and
Temasek's policy of not being actively involved in the subsidiaries' financial and operational management, and of
not providing any financial guarantees. In assessing Temasek's business risk, Standard & Poor's focuses on the
business profiles of the industrial segments of its major investments and the expected benefits derived from its
Standard & Poor’s RatingsDirect | September 12, 2005 8
Standard & Poor's. All rights reserved. No reprint or dissemination without S&P's permission. See Terms of Use/Disclaimer on the last page. 462439 | 300571092
Presale: Temasek Holdings Pte Ltd.
shareholder.
Business Profile Of Major Industrial Sectors
The overall business profile of Temasek's investments is above average. Temasek's TLCs enjoy strong market
positions and operate effectively in most of the major industrial segments. These include telecommunications and
media, banking, transportation and logistics, energy and resources, and engineering and infrastructure. These
segments with stronger business profiles form about two-thirds of Temasek's total investment value. TLCs in other
segments are exposed to more challenges and intense competition, although stronger market conditions and cost
rationalization efforts in the past year have helped improve performance. These segments include properties,
shipbuilding, electronics, and aerospace.
Telecommunications & media (33% of total investment value)
• Market position: Strong across markets.
• Geographic reach: Singapore, Australia, and ASEAN.
• Competition: Rational though intensifying.
• Operating efficiency: Strong.
The market position and operating efficiency of TLCs in this segment are generally strong to dominant. Key
companies are Singapore Telecommunications Ltd. (SingTel; A+/Stable/A-1) , Singapore Technologies Telemedia (ST
Telemedia), and Mediacorp Pte. Ltd. SingTel is the strongest and most significant company in this segment,
accounting for 26% of Temasek's total investment value as at March 31, 2005. It enjoys an effective monopoly in
direct exchange lines, 70% share in international long-distance calls, and 38% share of cellular services in the
relatively mature Singapore market. Its 100% subsidiary, SingTel Optus Pty Ltd. (A+/Stable/A-1), is the
second-largest telecom service provider in Australia, with improving market share and operating efficiency. In
addition, SingTel has invested in a network of associated telecom companies in South and Southeast Asia with
leading market positions in these fast-growing telecom (particularly mobile) markets. These associated companies
contributed about 30% of SingTel's EBIT in the year ended March 31, 2005.
ST Telemedia operates Starhub, the second-largest mobile service provider and the only cable TV operator in
Singapore. ST Telemedia also owns 42% of PT Indosat Tbk. (foreign currency BB-/Stable/--, local currency
BB/Stable/--), the second-largest telecom provider in Indonesia, and 61% of Global Crossing, an undersea cable
operator. These investments have relatively weaker market positions than those of SingTel, although they are still
efficiently operated. Mediacorp holds dominant market positions in free-to-air TV and radio and is relatively small.
During fiscal 2004, Temasek also acquired a 5% stake in Telekom Malaysia Bhd., a telecom operator in Malaysia.
Financial services (21% of total investment value)
• Market position: Strong in Singapore.
• Geographic reach: Singapore, Greater China, Indonesia, India, and Malaysia.
• Competition: Intense.
• Operating efficiency: Average.
DBS Bank, Temasek's main investment in this segment, is the largest and most geographically diversified among the
three Singaporean banks. Declining interest margin, intense competition, and limited growth potential in Singapore
prompted DBS to expand overseas, particularly in Hong Kong, where it has a significant presence. DBS maintains a
www.standardandpoors.com/ratingsdirect 9
Standard & Poor's. All rights reserved. No reprint or dissemination without S&P's permission. See Terms of Use/Disclaimer on the last page. 462439 | 300571092
Presale: Temasek Holdings Pte Ltd.
sound financial profile and the quality of its assets have been improving as a result of ongoing rehabilitative efforts
for NPLs amid more stable economic conditions in its major markets.
One of the main sectors targeted by Temasek is investment in regional banks, and over the past two years, it
acquired equity stakes in them (see Table 2). These banks have moderate to strong market position in their
respective markets, although the operating environment and competitive landscape in some of these countries, such
as Indonesia, India, and China, could be challenging. Temasek's approach has been to invest in banks with good
market niche or relative strong management, and to create value by imparting improved banking and risk
management practices.
At March 31, 2005, the aggregate market value of Temasek's investments in the listed banks has appreciated by
74% from its aggregate acquisition cost.
Temasek's investment in overseas banks is set to more than double with its commitment for a US$1 billion equity
investment in China Construction Bank in July 2005, and US$3.1 billion in Bank of China in September 2005.
Although these two banks have been plagued with significant impaired assets, inadequate capital base, and incidents
of management fraud, both have benefited from the Chinese government's recapitalization effort. The two banks
have also made efforts to improve management practices. Despite strong growth prospect in China, the operating
environment there remains challenging, and these investments inevitably increase the risk profile of Temasek's
overall investment portfolio in the banking sector.
Transportation (9% of total investment value)
• Market position: Strong in airlines, duopoly in commuter service.
• Geographic reach: Global.
• Competition: Intensifying.
• Operating efficiency: Average but improving cost structure and effectiveness.
SIA is Temasek's most important investment in this segment. The national flag carrier has a strong market position
and an internationally established brand name. The company showed a solid financial performance in the year
ended March 31, 2005, and it is in a net cash position, reflecting strong passenger travel demand and capacity
expansion. Although there is continued demand growth, particularly in routes to China and India, the main
challenges are high fuel prices and, to a lesser extent, price competition from budget carriers. Although its operating
margin is expected to narrow in the year ending March 31, 2006, SIA's established customer base and financial
strength should help sustain its market position, especially in the more lucrative business and long-haul market
segments.
SMRT Corp. (AAA/Stable/--) operates a large portion of Singapore's subway system, and a network of public buses
and taxi services. It forms part of the duopoly in the domestic commuter business. It has so far maintained a sound
financial profile. With limited ridership growth in subway and buses, revenue growth is expected to come from taxis
and rental income from increased retail shop space in its subway stations. Its network is considered a key
infrastructure of the country and has enjoyed substantial support from the government in its capital expenditure.
Logistics (8% of total investment value)
• Market position: Strong in ports and shipping and established niche in logistics service.
• Geographic reach: Global in port and shipping, Asia in logistics service.
• Competition: Moderate in ports and logistic services, and intense in shipping.
Standard & Poor’s RatingsDirect | September 12, 2005 10
Standard & Poor's. All rights reserved. No reprint or dissemination without S&P's permission. See Terms of Use/Disclaimer on the last page. 462439 | 300571092
Presale: Temasek Holdings Pte Ltd.
• Operating efficiency: Above average.
Temasek's investment in the sector increased to 8% of its total investment portfolio from 4% in the previous year,
largely reflecting its increased stake in Neptune Orient Lines (NOL) to 68%, from 29%, and PSA's acquisition of
stakes in HongKong International Terminals and COSCO-HIT Terminals. PSA is strengthening its market position
through its strategy to build a global network of efficient container terminals. Despite some deterioration in its
financial profile as PSA financed its purchases largely with debt, its financial measures remain relatively strong as it
continues to benefit from buoyant global trade.
NOL operates in a cyclical environment often affected by demand-supply mismatch. Recent increases in trade
volume and a shortage of ships helped to raise freight rates, although the strong freight rates are partly offset by
escalating fuel costs. So far, NOL has been able to pass on the increased fuel cost through higher freight rates.
However, earnings could fluctuate in the medium term when freight rates weaken as economies and trade begin to
be affected by sustained high fuel prices. Nevertheless, its efficient fleet, extensive network, and use of chartered
vessels for half of its capacity should provide some flexibility.
SembCorp Logistics (SembLog) is the leading supply chain management provider in Asia, focusing mainly on
Singapore, China, and India. In the past year, SembLog divested its 24% stake in Kuehne & Nagel to focus its
expansion in Asia, especially in commercial supply chain management.
Energy & resources (8% of total investment value)
• Market position: Effective monopoly and dominant.
• Geographic reach: Singapore and Australia.
• Competition: Minimal in Singapore and Australian transmission.
• Operating efficiency: Strong.
Temasek's investments in this segment effectively hold the monopoly in power and gas supply in Singapore. The
three power generators (Tuas Power, Power Seraya, and Senoko Power) supply about 90% of the country's power,
while SingPower holds the monopoly in transmission and distribution assets. SingPower has also expanded in
Australia with the recent acquisition of the Australian power assets from TXU Corp., which stretched SingPower's
financial profile. The subsequent sale of TXU Corp.'s Australian merchant energy assets to focus on its core
transmission and distribution businesses has reversed the deterioration to some extent. Substantial overcapacity in
Singapore's competitive wholesale power market also presents some risks.
Properties (8% of total investment value)
• Market position: Among the leaders in relatively weak market conditions.
• Geographic reach: Singapore, Australia, the U.K., Greater China, and Southeast Asia.
• Competition: Intense.
• Operating efficiency: Above average to average.
CapitaLand and Keppel Land are the key investments in this segment. The Singapore property market, with
persistent oversupply, has only recovered modestly, despite the government's relaxation on the use of Central
Provident Fund (pension savings fund) and bank financing for property purchases. Private residential property prices
in the second quarter in 2005 were about 36% below the peak in 1996. Prices of office and industrial segments also
suffered large declines of 55% and 50%, respectively, during the same period. Commercial retail space appears to be
the only more resilient sub-segment.
www.standardandpoors.com/ratingsdirect 11
Standard & Poor's. All rights reserved. No reprint or dissemination without S&P's permission. See Terms of Use/Disclaimer on the last page. 462439 | 300571092
Presale: Temasek Holdings Pte Ltd.
Facing limited profit potential in the Singapore market, both companies have ventured overseas. About 30%-40%
of these companies' total assets are outside Singapore. CapitaLand has taken a diversified approach for its overseas
investments, although it has recently increased its focus on China. It has a good mix of activities in residential,
commercial, hotels, and service apartments. At the same time, it focuses on developed markets like the U.K. and
Australia, and a small selection of cities in emerging markets, such as Beijing and Shanghai, to reduce its risks in
operating in unfamiliar and higher risk emerging markets. In contrast, Keppel Land has a greater focus on emerging
markets, and it is more adventurous in the selection of geographic locations.
To improve their capital structure, CapitaLand and, to a lesser extent, Keppel Land have embarked on programs to
lighten their assets through direct disposals. Standard & Poor's believes that this segment will remain a challenging
one over the medium term, as the domestic market remains weak, and effective risk management in overseas
ventures will be crucial to the success of these companies' activities abroad.
Engineering & infrastructure (8% of total investment value)
• Market position: Monopoly in defense, strong in aircraft maintenance.
• Geographic reach: Singapore and the U.S.
• Competition: Intense in aircraft maintenance.
• Operating efficiency: Above average.
Key TLCs operating in this segment are Singapore Technologies Engineering Co. Ltd. (ST Engineering) and SIA
Engineering. ST Engineering holds an effective monopoly as the sole national defense contractor, but it faces
stronger competition in the airframe maintenance and modification businesses. SIA Engineering focuses mainly on
aircraft maintenance services in Singapore's Changi Airport and it is able to capture a dominant share of flights
passing through the airport.
Technology (2% of total investment value)
• Market position: Laggard in foundry, average in testing and assembly.
• Geographic reach: Singapore (foundry); Singapore, U.S., China and South Korea and Taiwan (testing and
assembly).
• Competition: Intense.
• Operating efficiency: Average.
Electronics and technology are important industry segments, and they contribute about 40% of Singapore's total
industrial production and exports. The government intends to promote Singapore as a regional information
technology hub. Substantial support, in the form of capital injections and tax incentives, has been given to TLCs in
this segment. The main TLCs are Chartered Semiconductor Manufacturing Ltd. (BBB-/Stable/--) and STATS
ChipPAC (BB/Stable/--). Chartered lags behind its Taiwanese competitors both in terms of sales and technology,
although it has been able to reduce the technology gap over the past two years following its alliance with IBM and
Infineon. Its financial profile, however, remains weak. The market position of STATS improved after its merger with
ChipPAC in 2004. However, both STATS and Chartered remain vulnerable to the highly cyclical nature of the
semiconductor industry.
Promising enterprises (3% of total investment value)
Temasek's own investments in higher risk promising enterprises are mainly minority stakes, and these are not
expected to affect Temasek's financial profile significantly. Some of these companies, such as Hyflux Ltd. and Osim
International, have already shown some success and are publicly listed with strong performances.
Standard & Poor’s RatingsDirect | September 12, 2005 12
Standard & Poor's. All rights reserved. No reprint or dissemination without S&P's permission. See Terms of Use/Disclaimer on the last page. 462439 | 300571092
Presale: Temasek Holdings Pte Ltd.
Strong Shareholder
In assessing the credit benefit a company derives from its shareholder, Standard & Poor's assesses the financial
strength of the shareholder, and the financial and strategic significance of the company to the parent. Temasek's
shareholder, the Singapore government, has substantial financial resources and no external debt. With market value
of its portfolio at S$103 billion, Temasek is significant to the government. Temasek is expected to operate
independently on a commercial basis as an investment company, and the government does not guarantee its
obligations. Nevertheless, the strength of the shareholder and the constitutional arrangements that protect
Temasek's reserves provide comfort.
Financial Profile
Financial Policy: Very conservative
After having maintained a very conservative capital structure, with negligible debt at the company level, Temasek
has begun to increase its debt level gradually to finance its acquisitions. Temasek's policy is to maintain long-term
average total debt to equity (book value) of about 20%, with a maximum ceiling of 30%. It will also continue its
policy of holding a substantial pool of liquid assets (cash, deposits, and marketable securities). As such, its liquid
assets should remain above its debt level in the medium term. Although Temasek does not set any leverage targets
for its TLCs, it would exercise its influence as a shareholder if it feels that the capital structure of a subsidiary is
weakening shareholders' value.
Temasek has paid out part of its aggregate net income in the past three years as dividends to the Ministry of
Finance. Temasek's board determines its dividend every year, taking into consideration cash returns to the
shareholder and the company's investment needs.
Accounting
Being a private exempt company, Temasek was not required to release its financial statements to the public.
Financial and performance reports are submitted to its board of directors for approval. It also submits its financial
reports to its shareholder and to the Elected President. As a Fifth-Schedule company, Temasek's Chairman and CEO
are also required to certify to the Elected President on a yearly basis that Temasek has not drawn down on past
reserves.
Temasek's financial statements are prepared in accordance with Singapore Financial Reporting Standards. Despite
the complexity and diversity of the group companies, the main financial policies appear to be consistent with the
practices of companies in similar industries. The policies include those related to revenue recognition, inventory and
fixed asset valuation, basis of consolidation, and accounting for leases. Unfunded pension obligations are not a
material concern, as most of the group's staff is employed in Singapore, where a central provident fund system
requires specific monthly contributions by employers. In evaluating the financial profile of the consolidated group,
Standard & Poor's adjusts for the group's financial obligations under operating leases and includes the present value
of the leases as debts.
Profitability and cash flow
Profitability and cash flows at the company level are well above average, and cover its financial obligations
comfortably. Its revenue base has been very steady, and is enhanced by occasional special dividends from its TLCs.
www.standardandpoors.com/ratingsdirect 13
Standard & Poor's. All rights reserved. No reprint or dissemination without S&P's permission. See Terms of Use/Disclaimer on the last page. 462439 | 300571092
Presale: Temasek Holdings Pte Ltd.
Temasek derives its revenue mainly from dividend income from the TLCs, and investment and interest income from
its surplus funds. Dividend income from TLCs was quite steady in each of the past four years.
On a consolidated basis, Temasek's profitability and cash flow protection measures are above average. Despite the
difficult operating environment for many of its TLCs in fiscal 2002 and 2003, Temasek consistently maintained a
steady operating lease-adjusted (OLA) operating margin of 20%-25% over the past five years. As overall economic
conditions and operating environments for TLCs improved in the year ended March 31, 2005, its operating margin
improved to 24.5% from 22.7% in the previous year. Standard & Poor's expects the improvement in profitability to
moderate, as the continued revenue growth from Temasek's operations in the telecommunication, financial services,
transportation, and logistic sectors could be partly offset by rising fuel and raw material costs. The improvement in
profitability could end in the event that persistent high fuel prices lead to a slowing in regional economies.
Cash flow coverage measures are strong, with OLA FFO to total debt at about 26.6%, and FFO interest coverage of
6.5x at March 31, 2005, compared with 27.1% and 7.2x, respectively, in the previous year. Taking into
consideration the large cash balance of S$24.4 billion at March 31, 2005, OLA FFO to net debt was comfortable at
44%. Cash flow coverage measures are expected to weaken moderately, with the increased use of debt to fund
future capital expenditure and investments. Nevertheless, Standard & Poor's expects the measures to remain strong
in view of Temasek's prudent financial management, stringent investment decision process, and close performance
monitoring.
Liquidity and liability management
Temasek's liquidity is well above average, both at the company level and on a consolidated basis. At the company
level, its liquid assets are placed mainly in cash and deposits, government bonds, corporate bonds, and equities.
These liquid assets should be adequate to cover the company level debt. On a consolidated level, cash balance and
short-term marketable securities of S$42.6 billion at March 31, 2005, were more than sufficient to cover group
short-term debt of S$12.4 billion by more than three times.
Temasek maintains a comfortable debt maturity profile. At the company level, over half of its debt will mature after
December 2008. On a consolidated basis, apart from its short-term debts, those maturing in the next four years
aggregate to about S$21.5 billion (fiscal 2006-fiscal 2009). Although no further breakdown is available, the
management has indicated that the maturities of these debts are quite evenly spread out, and are distributed among
its subsidiaries. The debt maturing in the next five years should be adequately covered by available liquid assets, and
by the group's steady funds from operations of S$10 billion-S$15 billion a year.
Capital structure and financial flexibility
Temasek recorded S$5.0 billion of debt at March 31, 2005, largely reflecting exchangeable bonds issued as a means
to monetize its investments in some TLCs. The consolidated capital structure is also strong. At March 31, 2005,
consolidated OLA total debt to capitalization was 37.9%, while total debt to EBITDA was 4.2x. After deducting
cash and equivalents, the net ratios were much lower at 27% and 2.5x, respectively. Despite the expected increase in
debt, the prudent gearing ceiling should ensure that Temasek's capital structure remains conservative. The debt to
EBITDA ratio does not take into account dividends, investment, and interest income, which amounted to over S$4.4
billion in fiscal 2004.
Temasek's financial flexibility is outstanding. At the company level, its low debt level and ample liquidity indicate
substantial debt capacity and the ability to access the capital market when needed. Additional sources of funds could
be derived from its ability to sell part of its investments. Since April 2004, the company raised S$2.7 billion through
Standard & Poor’s RatingsDirect | September 12, 2005 14
Standard & Poor's. All rights reserved. No reprint or dissemination without S&P's permission. See Terms of Use/Disclaimer on the last page. 462439 | 300571092
Presale: Temasek Holdings Pte Ltd.
share disposals and exchangeable bond issues. Many of its TLCs have investment-grade ratings, and have regularly
accessed the capital and equity markets for funding at very competitive pricing. Moreover, the banking sector will
likely remain willing lenders to both Temasek and the major TLCs.
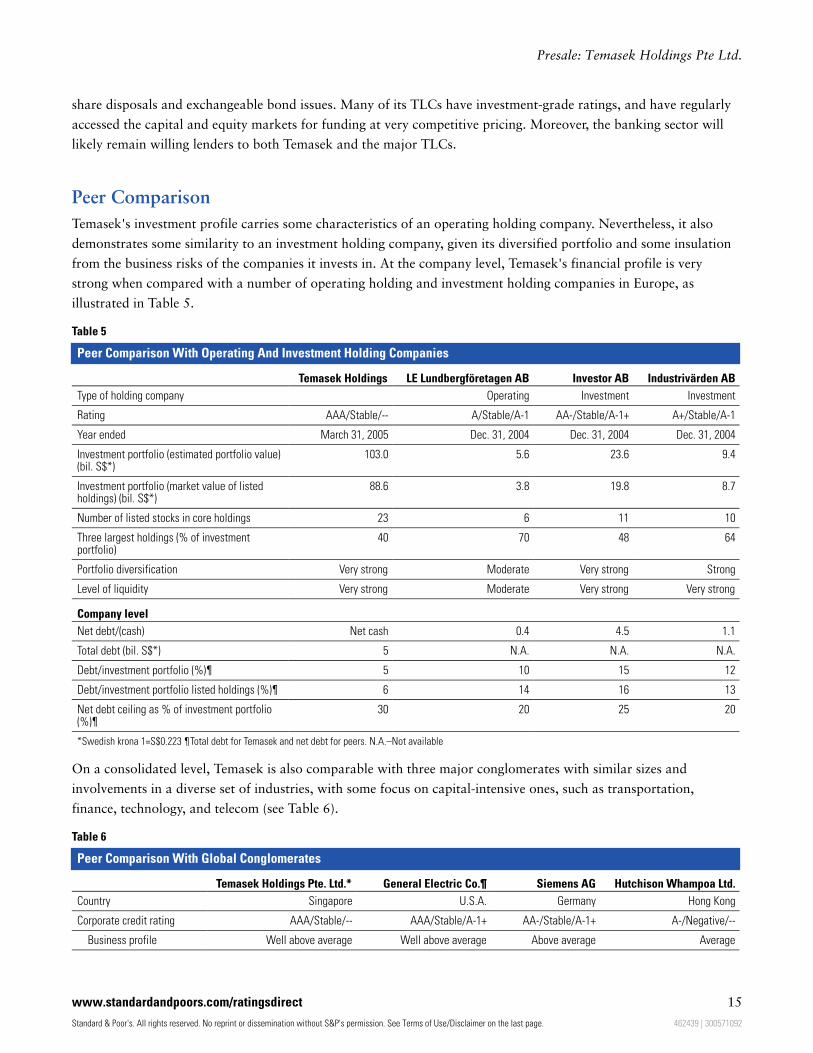
Peer Comparison
Temasek's investment profile carries some characteristics of an operating holding company. Nevertheless, it also
demonstrates some similarity to an investment holding company, given its diversified portfolio and some insulation
from the business risks of the companies it invests in. At the company level, Temasek's financial profile is very
strong when compared with a number of operating holding and investment holding companies in Europe, as
illustrated in Table 5.
Table 5
Peer Comparison With Operating And Investment Holding Companies
Temasek Holdings LE Lundbergföretagen AB Investor AB Industrivärden AB
Type of holding company Operating Investment Investment
Rating AAA/Stable/-- A/Stable/A-1 AA-/Stable/A-1+ A+/Stable/A-1
Year ended March 31, 2005 Dec. 31, 2004 Dec. 31, 2004 Dec. 31, 2004
Investment portfolio (estimated portfolio value)(bil. S$*)
103.0 5.6 23.6 9.4
Investment portfolio (market value of listedholdings) (bil. S$*)
88.6 3.8 19.8 8.7
Number of listed stocks in core holdings 23 6 11 10
Three largest holdings (% of investmentportfolio)
40 70 48 64
Portfolio diversification Very strong Moderate Very strong Strong
Level of liquidity Very strong Moderate Very strong Very strong
Company level
Net debt/(cash) Net cash 0.4 4.5 1.1
Total debt (bil. S$*) 5 N.A. N.A. N.A.
Debt/investment portfolio (%)¶ 5 10 15 12
Debt/investment portfolio listed holdings (%)¶ 6 14 16 13
Net debt ceiling as % of investment portfolio(%)¶
30 20 25 20
*Swedish krona 1=S$0.223 ¶Total debt for Temasek and net debt for peers. N.A.–Not available
On a consolidated level, Temasek is also comparable with three major conglomerates with similar sizes and
involvements in a diverse set of industries, with some focus on capital-intensive ones, such as transportation,
finance, technology, and telecom (see Table 6).
Table 6
Peer Comparison With Global Conglomerates
Temasek Holdings Pte. Ltd.* General Electric Co.¶ Siemens AG Hutchison Whampoa Ltd.
Country Singapore U.S.A. Germany Hong Kong
Corporate credit rating AAA/Stable/-- AAA/Stable/A-1+ AA-/Stable/A-1+ A-/Negative/--
Business profile Well above average Well above average Above average Average
www.standardandpoors.com/ratingsdirect 15
Standard & Poor's. All rights reserved. No reprint or dissemination without S&P's permission. See Terms of Use/Disclaimer on the last page. 462439 | 300571092
Presale: Temasek Holdings Pte Ltd.
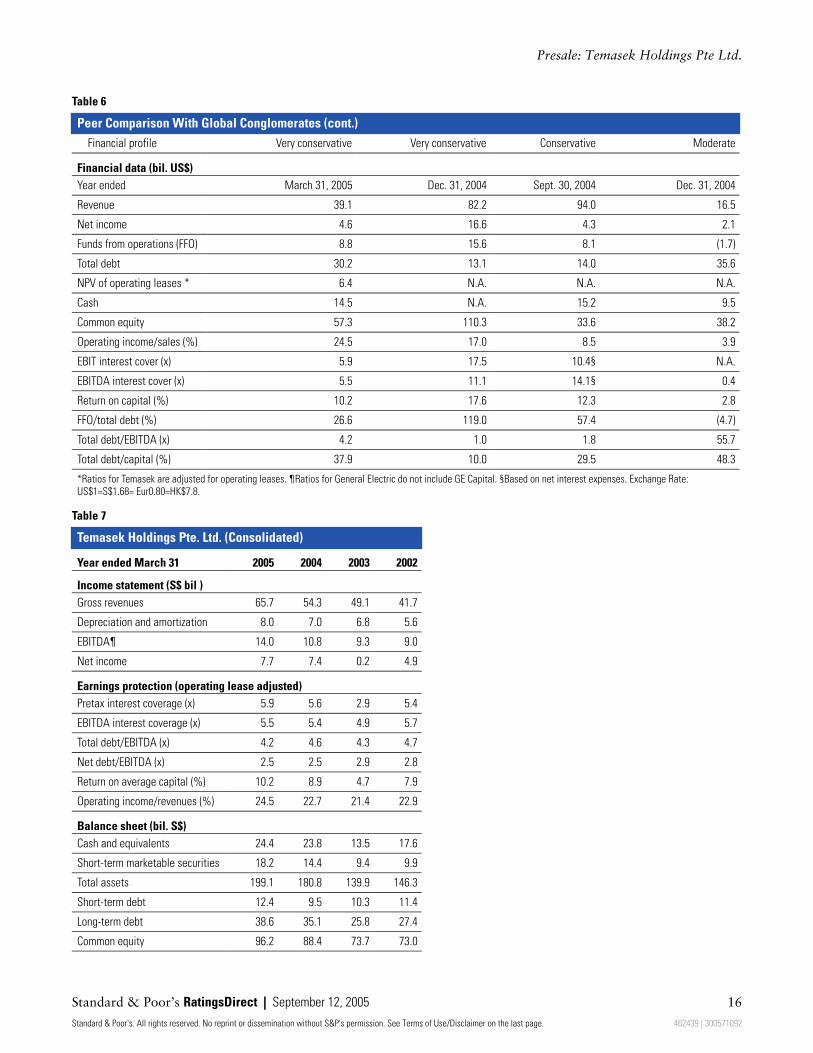
Table 6
Peer Comparison With Global Conglomerates (cont.)
Financial profile Very conservative Very conservative Conservative Moderate
Financial data (bil. US$)
Year ended March 31, 2005 Dec. 31, 2004 Sept. 30, 2004 Dec. 31, 2004
Revenue 39.1 82.2 94.0 16.5
Net income 4.6 16.6 4.3 2.1
Funds from operations (FFO) 8.8 15.6 8.1 (1.7)
Total debt 30.2 13.1 14.0 35.6
NPV of operating leases * 6.4 N.A. N.A. N.A.
Cash 14.5 N.A. 15.2 9.5
Common equity 57.3 110.3 33.6 38.2
Operating income/sales (%) 24.5 17.0 8.5 3.9
EBIT interest cover (x) 5.9 17.5 10.4§ N.A.
EBITDA interest cover (x) 5.5 11.1 14.1§ 0.4
Return on capital (%) 10.2 17.6 12.3 2.8
FFO/total debt (%) 26.6 119.0 57.4 (4.7)
Total debt/EBITDA (x) 4.2 1.0 1.8 55.7
Total debt/capital (%) 37.9 10.0 29.5 48.3
*Ratios for Temasek are adjusted for operating leases. ¶Ratios for General Electric do not include GE Capital. §Based on net interest expenses. Exchange Rate:
US$1=S$1.68= Eur0.80=HK$7.8.
Table 7
Temasek Holdings Pte. Ltd. (Consolidated)
Year ended March 31 2005 2004 2003 2002
Income statement (S$ bil )
Gross revenues 65.7 54.3 49.1 41.7
Depreciation and amortization 8.0 7.0 6.8 5.6
EBITDA¶ 14.0 10.8 9.3 9.0
Net income 7.7 7.4 0.2 4.9
Earnings protection (operating lease adjusted)
Pretax interest coverage (x) 5.9 5.6 2.9 5.4
EBITDA interest coverage (x) 5.5 5.4 4.9 5.7
Total debt/EBITDA (x) 4.2 4.6 4.3 4.7
Net debt/EBITDA (x) 2.5 2.5 2.9 2.8
Return on average capital (%) 10.2 8.9 4.7 7.9
Operating income/revenues (%) 24.5 22.7 21.4 22.9
Balance sheet (bil. S$)
Cash and equivalents 24.4 23.8 13.5 17.6
Short-term marketable securities 18.2 14.4 9.4 9.9
Total assets 199.1 180.8 139.9 146.3
Short-term debt 12.4 9.5 10.3 11.4
Long-term debt 38.6 35.1 25.8 27.4
Common equity 96.2 88.4 73.7 73.0
Standard & Poor’s RatingsDirect | September 12, 2005 16
Standard & Poor's. All rights reserved. No reprint or dissemination without S&P's permission. See Terms of Use/Disclaimer on the last page. 462439 | 300571092
Presale: Temasek Holdings Pte Ltd.
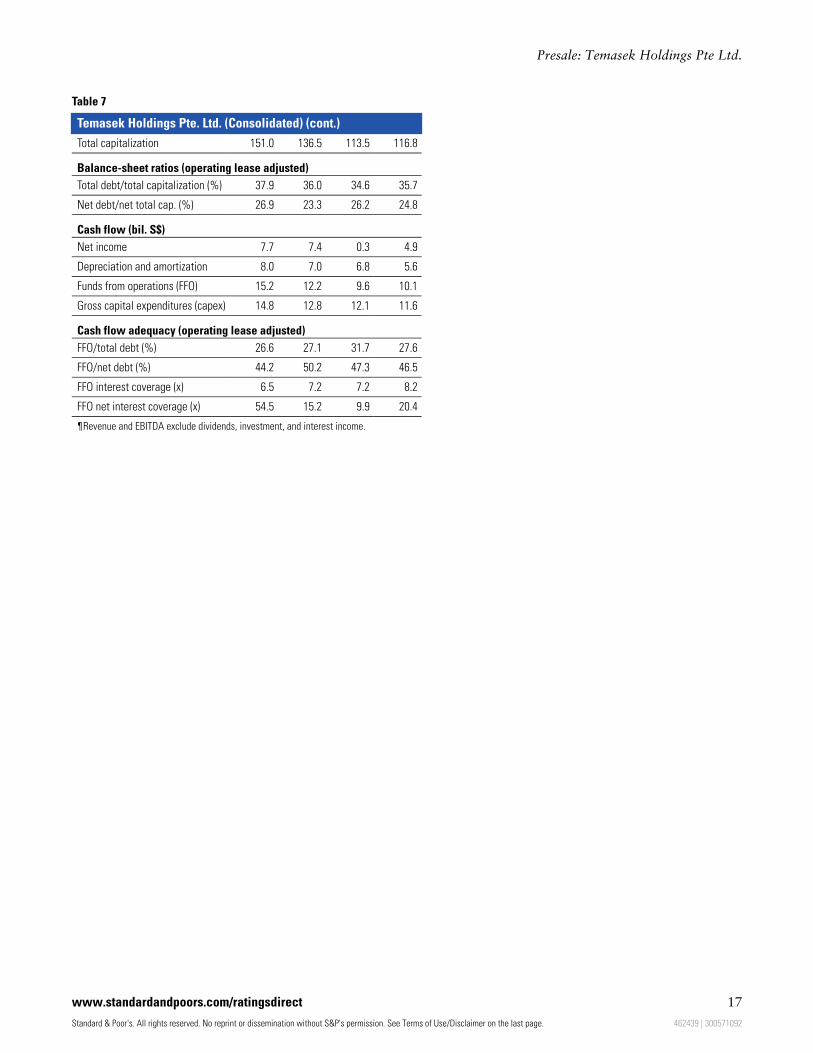
Table 7
Temasek Holdings Pte. Ltd. (Consolidated) (cont.)
Total capitalization 151.0 136.5 113.5 116.8
Balance-sheet ratios (operating lease adjusted)
Total debt/total capitalization (%) 37.9 36.0 34.6 35.7
Net debt/net total cap. (%) 26.9 23.3 26.2 24.8
Cash flow (bil. S$)
Net income 7.7 7.4 0.3 4.9
Depreciation and amortization 8.0 7.0 6.8 5.6
Funds from operations (FFO) 15.2 12.2 9.6 10.1
Gross capital expenditures (capex) 14.8 12.8 12.1 11.6
Cash flow adequacy (operating lease adjusted)
FFO/total debt (%) 26.6 27.1 31.7 27.6
FFO/net debt (%) 44.2 50.2 47.3 46.5
FFO interest coverage (x) 6.5 7.2 7.2 8.2
FFO net interest coverage (x) 54.5 15.2 9.9 20.4
¶Revenue and EBITDA exclude dividends, investment, and interest income.
www.standardandpoors.com/ratingsdirect 17
Standard & Poor's. All rights reserved. No reprint or dissemination without S&P's permission. See Terms of Use/Disclaimer on the last page. 462439 | 300571092
Presale: Temasek Holdings Pte Ltd.
Copyright © 1994-2009 Standard & Poors, a division of The McGraw-Hill Companies. All Rights Reserved.
Any Passwords/user IDs issued by S&P to users are single user-dedicated and may ONLY be used by the individual to whom they have been assigned. No sharing ofpasswords/user IDs and no simultaneous access via the same password/user ID is permitted. To reprint, translate, or use the data or information other than as providedherein, contact Client Services, 55 Water Street, New York, NY 10041; (1)212.438.7280 or by e-mail to: [email protected].
Ratings Services receives compensation for its ratings. Such compensation is normally paid either by the issuers of such securities or third parties participating in marketingthe securities. While Standard & Poor's reserves the right to disseminate the rating, it receives no payment for doing so, except for subscriptions to its publications.Additional information about our ratings fees is available at www.standardandpoors.com/usratingsfees.
Analytic services provided by Standard & Poor's Ratings Services (Ratings Services) are the result of separate activities designed to preserve the independence and objectivityof ratings opinions. The credit ratings and observations contained herein are solely statements of opinion and not statements of fact or recommendations to purchase, hold, orsell any securities or make any other investment decisions. Accordingly, any user of the information contained herein should not rely on any credit rating or other opinioncontained herein in making any investment decision. Ratings are based on information received by Ratings Services. Other divisions of Standard & Poor's may haveinformation that is not available to Ratings Services. Standard & Poor's has established policies and procedures to maintain the confidentiality of non-public informationreceived during the ratings process.
Copyright © 2009, Standard & Poors, a division of The McGraw-Hill Companies, Inc. (S&P). S&P and/or its third party licensors have exclusive proprietary rights in the data orinformation provided herein. This data/information may only be used internally for business purposes and shall not be used for any unlawful or unauthorized purposes.Dissemination, distribution or reproduction of this data/information in any form is strictly prohibited except with the prior written permission of S&P. Because of thepossibility of human or mechanical error by S&P, its affiliates or its third party licensors, S&P, its affiliates and its third party licensors do not guarantee the accuracy,adequacy, completeness or availability of any information and is not responsible for any errors or omissions or for the results obtained from the use of such information. S&PGIVES NO EXPRESS OR IMPLIED WARRANTIES, INCLUDING, BUT NOT LIMITED TO, ANY WARRANTIES OF MERCHANTABILITY OR FITNESS FOR A PARTICULAR PURPOSEOR USE. In no event shall S&P, its affiliates and its third party licensors be liable for any direct, indirect, special or consequential damages in connection with subscribers orothers use of the data/information contained herein. Access to the data or information contained herein is subject to termination in the event any agreement with a third-party of information or software is terminated.
Standard & Poor’s RatingsDirect | September 12, 2005 18
462439 | 300571092