Embed Size (px)
Citation preview
SME Annual MeetingFeb. 22-Feb. 25, 2009, Denver, CO
1 Copyright © 2009 by SME
Preprint 09-018
THE EFFECT OF WEATHERING ON PARTICLE SHAPE OF QUESTA MINE MATERIAL
S. Nunoo, New Mexico Inst. Of Mining and Tech., Socorro, NMV. T. McLemore, New Mexico Bureau of Geology and Mineral Resources, Socorro, NM
A. Fakhimi, New Mexico Inst. Of Mining and Tech., Socorro, NMG. Ayakwah, New Mexico Inst. Of Mining and Tech., Socorro, NM
ABSTRACT
The shape of particles has a significant effect on the shearstrength and deformational characteristics of granular materials.Weathering can change the grain shapes. For example, moreweathered sands tend to be rounder regardless of particle size.Particle shape analysis was performed on samples collected from theQuesta mine rock piles, a debris flow and the pit alteration scar. Inorder to increase the validity of the particle shape analysis, 4 personsincluding 2 geologists and 2 mining engineers were involved indescribing the particle shapes. The results of this analysis indicate thatrock fragments in the collected samples are mainly subangular,subdiscoidal and subprismoidal. The sphericity and angularity of therock fragments of the older analogs are similar to those of the rockpiles. This suggests that short-term weathering (<100 years) has notnoticeably changed the particle shapes at the test locations. Rock pilesmade of more angular particles are more stable compared to rock pileswith rounded particles.
INTRODUCTION
Research studies have shown that the shape of particles cansignificantly modify the shear strength (i.e. friction angle) anddeformational characteristics of granular materials. Das (1983)reported that friction angle for medium dense sandy gravel andmedium dense sand have values ranging from 34º to 48º and 32º to38º, respectively, due to difference in particle shape. Morris (1959)studied the effects of particle shape on the strength of aggregatematerial and concluded that “perfectly spherical particles give theweakest aggregate, whereas chunky aggregates offer increase instrength up to a point where the very roughness imposes limitingconditions of density (or void ratio), where after additional irregularity ofshape limits the obtainable density and the strength falls off.”. Cho etal. (2006) concludes that the decrease in particle sphericity and/orroundness leads to increase in the constant volume critical statefriction angle. Critical state friction angle is the minimum (i.e. safest)friction angle.
The shape of particles reflects the material composition, therelease of the grains from the matrix, the formation history of theparticles, transportation of the particles, depositional environments ofthe material, and mechanical and chemical processes acting on theparticles, including weathering (Cho et al., 2006). Weathering is the setof physical and chemical changes, up to and including disintegration ofrock by physical, chemical, and/or biological processes occurring at ornear the earth’s surface (e.g., in the vadose zone within approximately300 ft of ground surface at temperatures less than or equal toapproximately 70°C) that result in reductions of grain size, changes incohesion or cementation, and change in mineralogical composition(modified from Neuendorf, et al., 2005). Weathering can change theparticle shape. For example, more weathered sands tend to berounder regardless of particle size (Cho et al., 2006), mostly due tomechanical abrasion during transport. Particle shape of sediments andsedimentary rocks is described by the following three parameters: formor sphericity, roundness/angularity and smoothness/roughness(Krumbein, 1941; Barrett, 1980; Powers, 1982; Dodds, 2003; Oakey et
al., 2005). Sphericity (described as spherical, needle-like, tabular, andflat) refers to the similarity of a particle to a sphere with equal volume.Roundness/angularity describes the degree of abrasion of a particle asshown by the sharpness of its edges and corners. It is expressed byWadell (1932) as the ratio of the average radius of curvature of theseveral edges or corners of the particle to the radius of curvature of themaximum inscribed sphere or to one-half the nominal diameter of theparticle. Smoothness/roughness refers to the texture of the surface ofthe particle.
The purpose of this paper is to present results from a study to (1)determine the particle shape of some of the Questa mine rock pile andanalog materials and (2) investigate the effect of weathering on theshape of the particles. Analog materials are from sites in the vicinity ofthe Questa mine that are similar in composition and weatheringprocess as the rock piles, but are older than the rock piles. Processesoperating in the natural analogs share many similarities to those in therock pile, although certain aspects of the physical and chemical systemare different (Graf, 2008; Ludington et al., 2004). The alteration scar(sample QPS-SAN-0001) and debris flow (sample MIN-SAN-0001) areconsidered natural analogs for future weathering of the rock pilesbecause they have undergone hydrothermal alteration, weathering,and erosion since they were formed and could represent the futureweathering of the rock piles. The pit alteration scar is younger than0.24 ± 0.12 Ma (40Ar/39Ar age of jarosite, Virgil Lueth, writtencommunication, November 2008) and the debris flow is younger than4220 + 40 years (14C age of wood from the debris flow, Virgil Lueth,written communication, November 2008).
LOCATION AND SITE DESCRIPTION
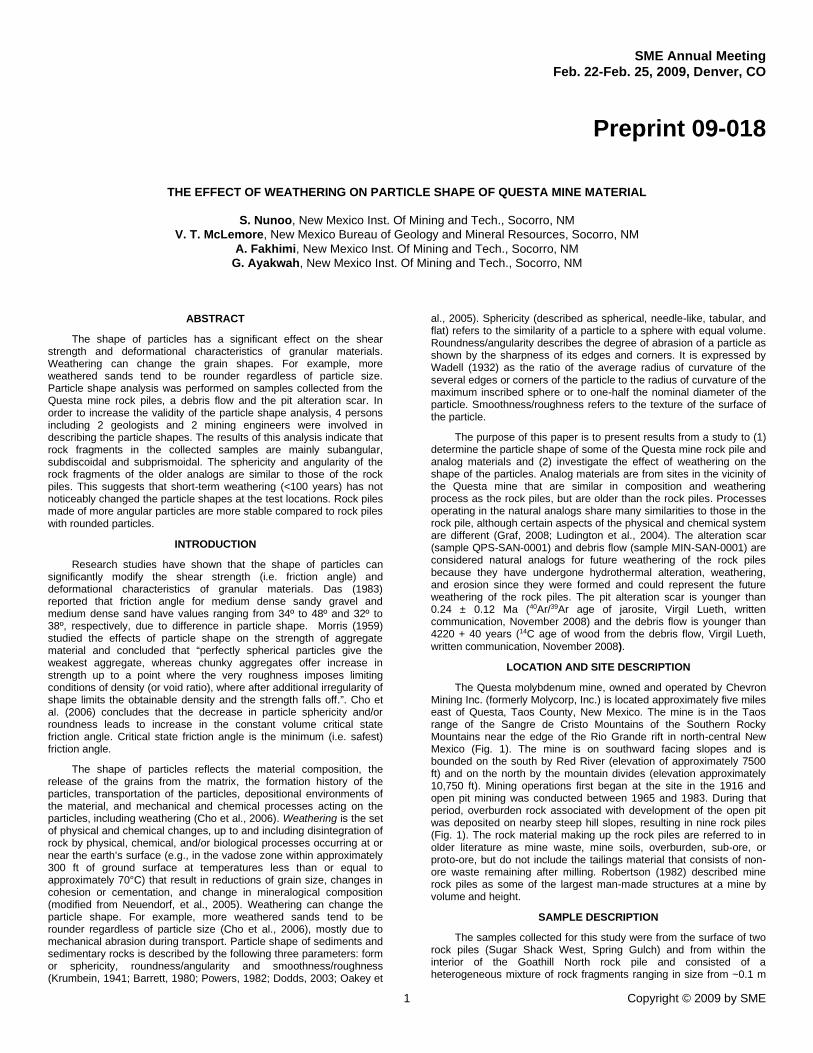
The Questa molybdenum mine, owned and operated by ChevronMining Inc. (formerly Molycorp, Inc.) is located approximately five mileseast of Questa, Taos County, New Mexico. The mine is in the Taosrange of the Sangre de Cristo Mountains of the Southern RockyMountains near the edge of the Rio Grande rift in north-central NewMexico (Fig. 1). The mine is on southward facing slopes and isbounded on the south by Red River (elevation of approximately 7500ft) and on the north by the mountain divides (elevation approximately10,750 ft). Mining operations first began at the site in the 1916 andopen pit mining was conducted between 1965 and 1983. During thatperiod, overburden rock associated with development of the open pitwas deposited on nearby steep hill slopes, resulting in nine rock piles(Fig. 1). The rock material making up the rock piles are referred to inolder literature as mine waste, mine soils, overburden, sub-ore, orproto-ore, but do not include the tailings material that consists of non-ore waste remaining after milling. Robertson (1982) described minerock piles as some of the largest man-made structures at a mine byvolume and height.
SAMPLE DESCRIPTION
The samples collected for this study were from the surface of tworock piles (Sugar Shack West, Spring Gulch) and from within theinterior of the Goathill North rock pile and consisted of aheterogeneous mixture of rock fragments ranging in size from ~0.1 m
SME Annual MeetingFeb. 22-Feb. 25, 2009, Denver, CO
2 Copyright © 2009 by SME
to <1 mm in diameter in a finer-grained matrix. The talus/scree depositfrom the alteration scar is a rock fall or landslide material that formedwhen the natural slope of the scar slid, possibly as a result of heavyrainfall. The Goathill debris flow is a heterogeneous mixture ofsediment that was deposited by a slurry of water and sediment duringflood erosion of the alteration scars (Ludington et al., 2004). Most rockfragments within the sample exhibit varying degrees of hydrothermalalteration (Appendix 1) and have been exposed to weathering sincethe construction of the rock pile (approximately 25-40 years).Petrographic descriptions and the mineralogy are summarized inAppendix 1. Samples for the particle shape analysis were sieved fromthe original samples and were >2 mm (no. 10 sieve) in size. Samplesfor point load and slake durability testing were 4-10 cm in size.
Figure 1. Questa rock piles and other mine features.
BACKGROUND
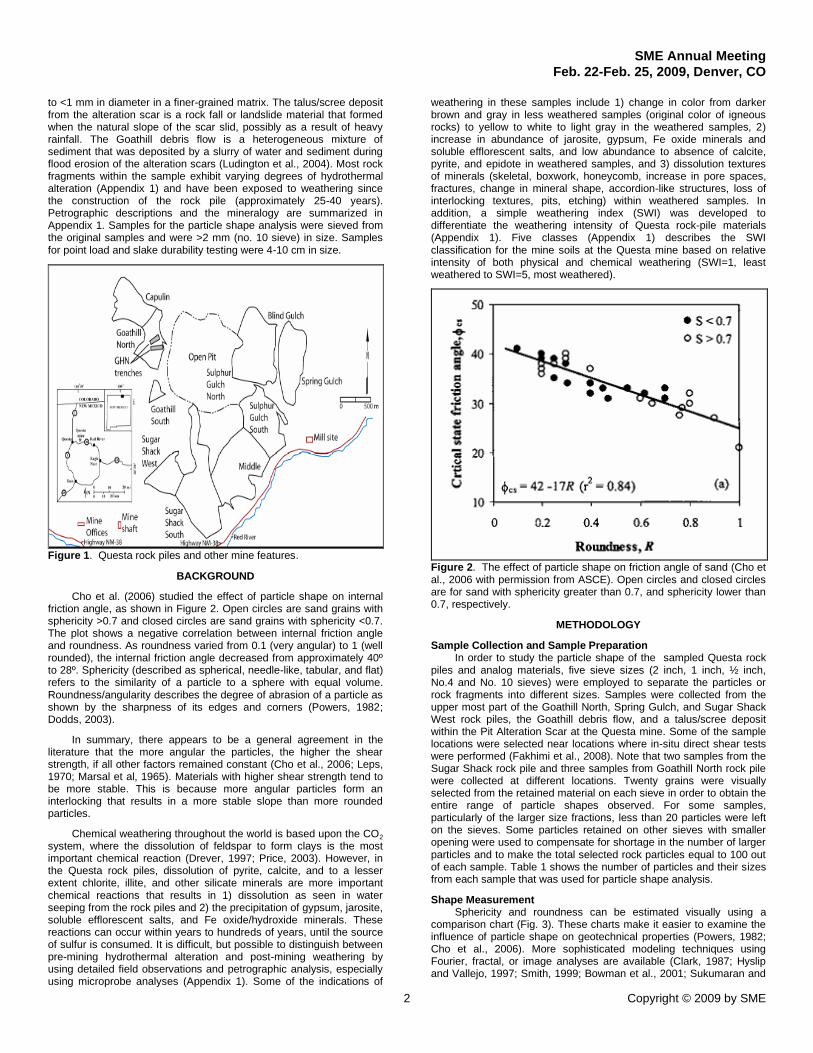
Cho et al. (2006) studied the effect of particle shape on internalfriction angle, as shown in Figure 2. Open circles are sand grains withsphericity >0.7 and closed circles are sand grains with sphericity <0.7.The plot shows a negative correlation between internal friction angleand roundness. As roundness varied from 0.1 (very angular) to 1 (wellrounded), the internal friction angle decreased from approximately 40ºto 28º. Sphericity (described as spherical, needle-like, tabular, and flat)refers to the similarity of a particle to a sphere with equal volume.Roundness/angularity describes the degree of abrasion of a particle asshown by the sharpness of its edges and corners (Powers, 1982;Dodds, 2003).
In summary, there appears to be a general agreement in theliterature that the more angular the particles, the higher the shearstrength, if all other factors remained constant (Cho et al., 2006; Leps,1970; Marsal et al, 1965). Materials with higher shear strength tend tobe more stable. This is because more angular particles form aninterlocking that results in a more stable slope than more roundedparticles.
Chemical weathering throughout the world is based upon the CO2
system, where the dissolution of feldspar to form clays is the mostimportant chemical reaction (Drever, 1997; Price, 2003). However, inthe Questa rock piles, dissolution of pyrite, calcite, and to a lesserextent chlorite, illite, and other silicate minerals are more importantchemical reactions that results in 1) dissolution as seen in waterseeping from the rock piles and 2) the precipitation of gypsum, jarosite,soluble efflorescent salts, and Fe oxide/hydroxide minerals. Thesereactions can occur within years to hundreds of years, until the sourceof sulfur is consumed. It is difficult, but possible to distinguish betweenpre-mining hydrothermal alteration and post-mining weathering byusing detailed field observations and petrographic analysis, especiallyusing microprobe analyses (Appendix 1). Some of the indications of
weathering in these samples include 1) change in color from darkerbrown and gray in less weathered samples (original color of igneousrocks) to yellow to white to light gray in the weathered samples, 2)increase in abundance of jarosite, gypsum, Fe oxide minerals andsoluble efflorescent salts, and low abundance to absence of calcite,pyrite, and epidote in weathered samples, and 3) dissolution texturesof minerals (skeletal, boxwork, honeycomb, increase in pore spaces,fractures, change in mineral shape, accordion-like structures, loss ofinterlocking textures, pits, etching) within weathered samples. Inaddition, a simple weathering index (SWI) was developed todifferentiate the weathering intensity of Questa rock-pile materials(Appendix 1). Five classes (Appendix 1) describes the SWIclassification for the mine soils at the Questa mine based on relativeintensity of both physical and chemical weathering (SWI=1, leastweathered to SWI=5, most weathered).
Figure 2. The effect of particle shape on friction angle of sand (Cho etal., 2006 with permission from ASCE). Open circles and closed circlesare for sand with sphericity greater than 0.7, and sphericity lower than0.7, respectively.
METHODOLOGY
Sample Collection and Sample PreparationIn order to study the particle shape of the sampled Questa rock
piles and analog materials, five sieve sizes (2 inch, 1 inch, ½ inch,No.4 and No. 10 sieves) were employed to separate the particles orrock fragments into different sizes. Samples were collected from theupper most part of the Goathill North, Spring Gulch, and Sugar ShackWest rock piles, the Goathill debris flow, and a talus/scree depositwithin the Pit Alteration Scar at the Questa mine. Some of the samplelocations were selected near locations where in-situ direct shear testswere performed (Fakhimi et al., 2008). Note that two samples from theSugar Shack rock pile and three samples from Goathill North rock pilewere collected at different locations. Twenty grains were visuallyselected from the retained material on each sieve in order to obtain theentire range of particle shapes observed. For some samples,particularly of the larger size fractions, less than 20 particles were lefton the sieves. Some particles retained on other sieves with smalleropening were used to compensate for shortage in the number of largerparticles and to make the total selected rock particles equal to 100 outof each sample. Table 1 shows the number of particles and their sizesfrom each sample that was used for particle shape analysis.
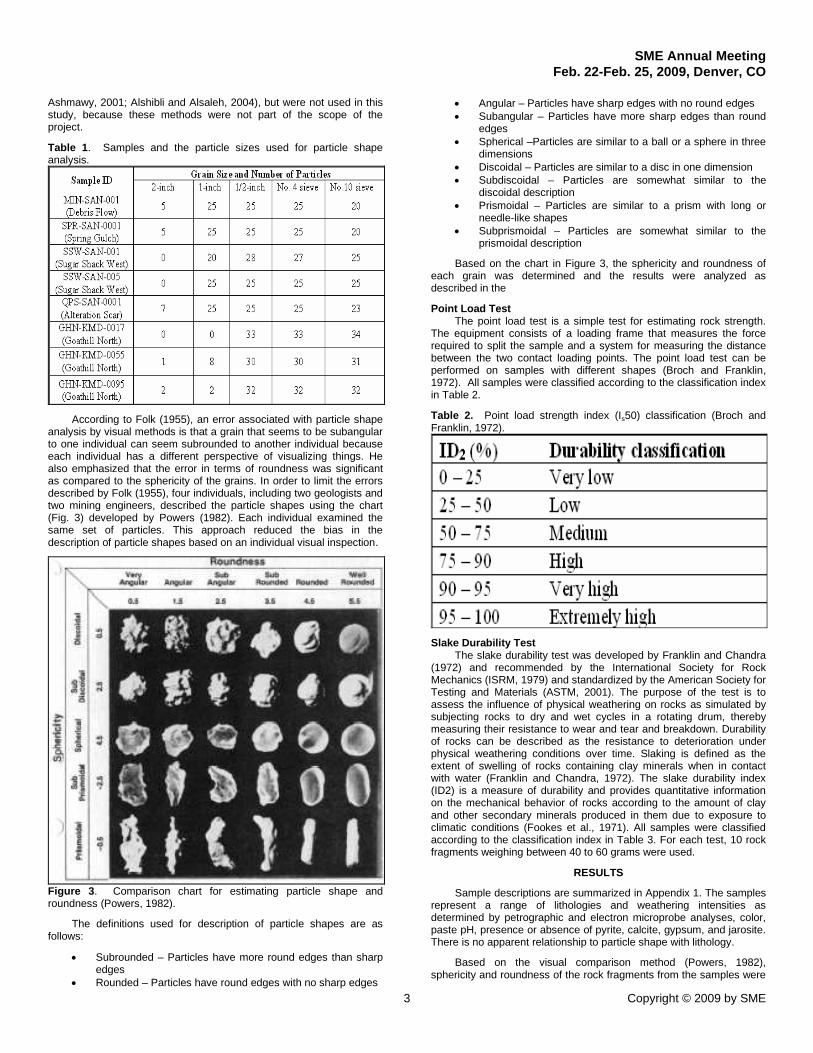
Shape MeasurementSphericity and roundness can be estimated visually using a
comparison chart (Fig. 3). These charts make it easier to examine theinfluence of particle shape on geotechnical properties (Powers, 1982;Cho et al., 2006). More sophisticated modeling techniques usingFourier, fractal, or image analyses are available (Clark, 1987; Hyslipand Vallejo, 1997; Smith, 1999; Bowman et al., 2001; Sukumaran and
SME Annual MeetingFeb. 22-Feb. 25, 2009, Denver, CO
3 Copyright © 2009 by SME
Ashmawy, 2001; Alshibli and Alsaleh, 2004), but were not used in thisstudy, because these methods were not part of the scope of theproject.
Table 1. Samples and the particle sizes used for particle shapeanalysis.
According to Folk (1955), an error associated with particle shapeanalysis by visual methods is that a grain that seems to be subangularto one individual can seem subrounded to another individual becauseeach individual has a different perspective of visualizing things. Healso emphasized that the error in terms of roundness was significantas compared to the sphericity of the grains. In order to limit the errorsdescribed by Folk (1955), four individuals, including two geologists andtwo mining engineers, described the particle shapes using the chart(Fig. 3) developed by Powers (1982). Each individual examined thesame set of particles. This approach reduced the bias in thedescription of particle shapes based on an individual visual inspection.
Figure 3. Comparison chart for estimating particle shape androundness (Powers, 1982).
The definitions used for description of particle shapes are asfollows:
Subrounded – Particles have more round edges than sharpedges
Rounded – Particles have round edges with no sharp edges
Angular – Particles have sharp edges with no round edges Subangular – Particles have more sharp edges than round
edges Spherical –Particles are similar to a ball or a sphere in three
dimensions Discoidal – Particles are similar to a disc in one dimension Subdiscoidal – Particles are somewhat similar to the
discoidal description Prismoidal – Particles are similar to a prism with long or
needle-like shapes Subprismoidal – Particles are somewhat similar to the
prismoidal description
Based on the chart in Figure 3, the sphericity and roundness ofeach grain was determined and the results were analyzed asdescribed in the
Point Load TestThe point load test is a simple test for estimating rock strength.
The equipment consists of a loading frame that measures the forcerequired to split the sample and a system for measuring the distancebetween the two contact loading points. The point load test can beperformed on samples with different shapes (Broch and Franklin,1972). All samples were classified according to the classification indexin Table 2.
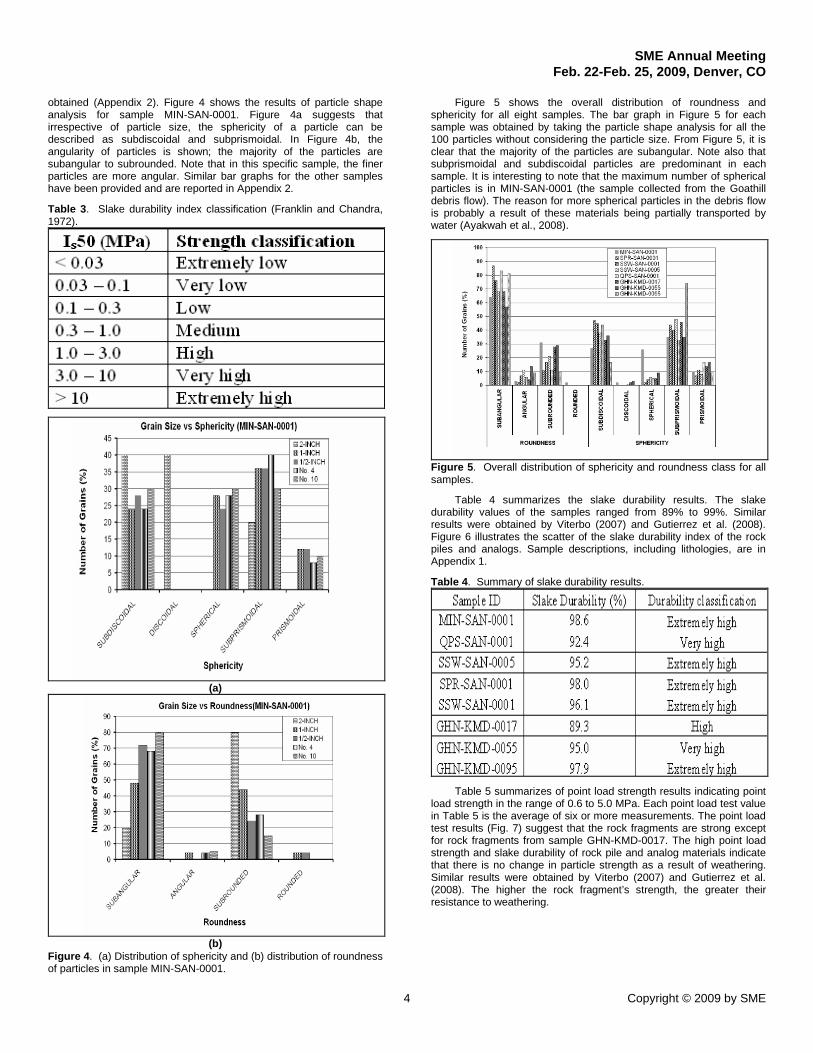
Table 2. Point load strength index (Is50) classification (Broch andFranklin, 1972).
Slake Durability TestThe slake durability test was developed by Franklin and Chandra
(1972) and recommended by the International Society for RockMechanics (ISRM, 1979) and standardized by the American Society forTesting and Materials (ASTM, 2001). The purpose of the test is toassess the influence of physical weathering on rocks as simulated bysubjecting rocks to dry and wet cycles in a rotating drum, therebymeasuring their resistance to wear and tear and breakdown. Durabilityof rocks can be described as the resistance to deterioration underphysical weathering conditions over time. Slaking is defined as theextent of swelling of rocks containing clay minerals when in contactwith water (Franklin and Chandra, 1972). The slake durability index(ID2) is a measure of durability and provides quantitative informationon the mechanical behavior of rocks according to the amount of clayand other secondary minerals produced in them due to exposure toclimatic conditions (Fookes et al., 1971). All samples were classifiedaccording to the classification index in Table 3. For each test, 10 rockfragments weighing between 40 to 60 grams were used.
RESULTS
Sample descriptions are summarized in Appendix 1. The samplesrepresent a range of lithologies and weathering intensities asdetermined by petrographic and electron microprobe analyses, color,paste pH, presence or absence of pyrite, calcite, gypsum, and jarosite.There is no apparent relationship to particle shape with lithology.
Based on the visual comparison method (Powers, 1982),sphericity and roundness of the rock fragments from the samples were
SME Annual MeetingFeb. 22-Feb. 25, 2009, Denver, CO
4 Copyright © 2009 by SME
obtained (Appendix 2). Figure 4 shows the results of particle shapeanalysis for sample MIN-SAN-0001. Figure 4a suggests thatirrespective of particle size, the sphericity of a particle can bedescribed as subdiscoidal and subprismoidal. In Figure 4b, theangularity of particles is shown; the majority of the particles aresubangular to subrounded. Note that in this specific sample, the finerparticles are more angular. Similar bar graphs for the other sampleshave been provided and are reported in Appendix 2.
Table 3. Slake durability index classification (Franklin and Chandra,1972).
(a)
(b)Figure 4. (a) Distribution of sphericity and (b) distribution of roundnessof particles in sample MIN-SAN-0001.
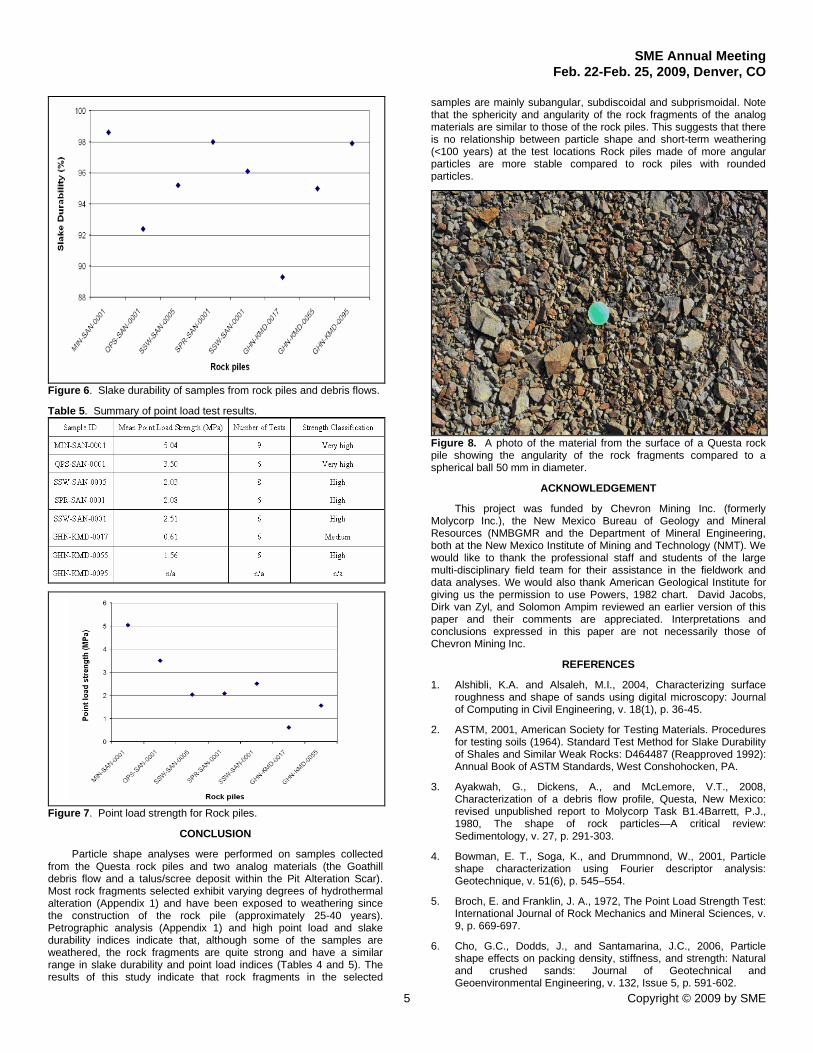
Figure 5 shows the overall distribution of roundness andsphericity for all eight samples. The bar graph in Figure 5 for eachsample was obtained by taking the particle shape analysis for all the100 particles without considering the particle size. From Figure 5, it isclear that the majority of the particles are subangular. Note also thatsubprismoidal and subdiscoidal particles are predominant in eachsample. It is interesting to note that the maximum number of sphericalparticles is in MIN-SAN-0001 (the sample collected from the Goathilldebris flow). The reason for more spherical particles in the debris flowis probably a result of these materials being partially transported bywater (Ayakwah et al., 2008).
Figure 5. Overall distribution of sphericity and roundness class for allsamples.
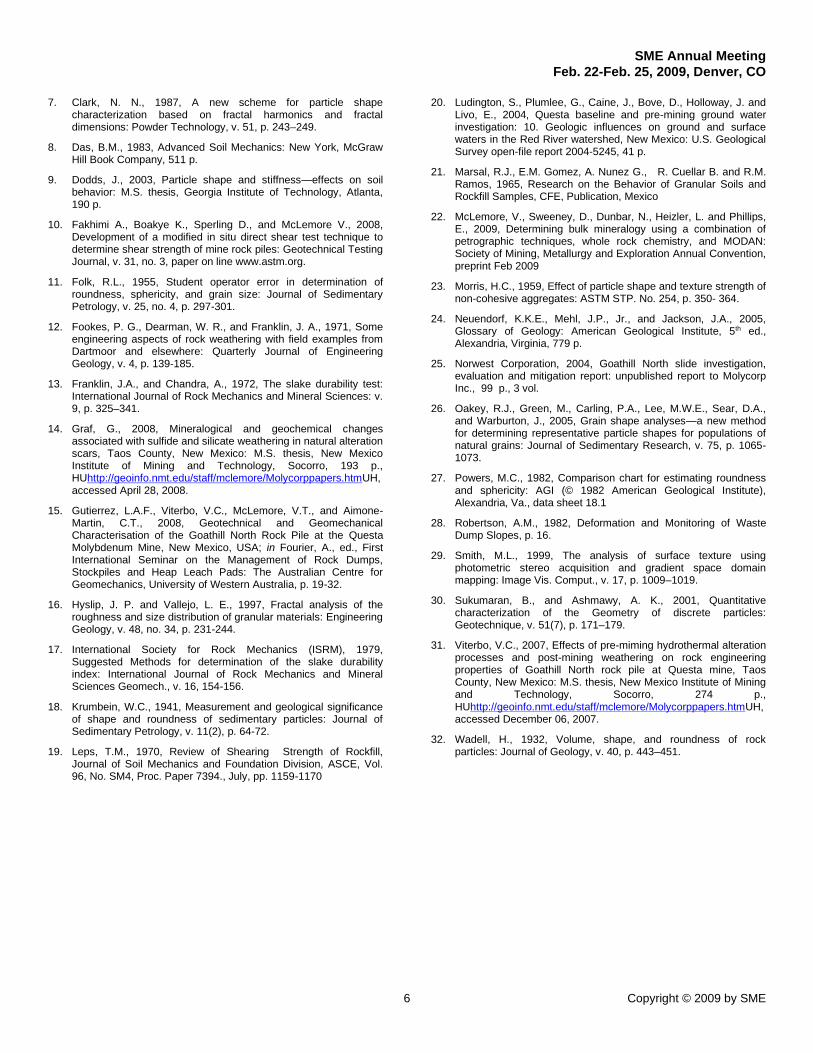
Table 4 summarizes the slake durability results. The slakedurability values of the samples ranged from 89% to 99%. Similarresults were obtained by Viterbo (2007) and Gutierrez et al. (2008).Figure 6 illustrates the scatter of the slake durability index of the rockpiles and analogs. Sample descriptions, including lithologies, are inAppendix 1.
Table 4. Summary of slake durability results.
Table 5 summarizes of point load strength results indicating pointload strength in the range of 0.6 to 5.0 MPa. Each point load test valuein Table 5 is the average of six or more measurements. The point loadtest results (Fig. 7) suggest that the rock fragments are strong exceptfor rock fragments from sample GHN-KMD-0017. The high point loadstrength and slake durability of rock pile and analog materials indicatethat there is no change in particle strength as a result of weathering.Similar results were obtained by Viterbo (2007) and Gutierrez et al.(2008). The higher the rock fragment’s strength, the greater theirresistance to weathering.
SME Annual MeetingFeb. 22-Feb. 25, 2009, Denver, CO
5 Copyright © 2009 by SME
Figure 6. Slake durability of samples from rock piles and debris flows.
Table 5. Summary of point load test results.
Figure 7. Point load strength for Rock piles.
CONCLUSION
Particle shape analyses were performed on samples collectedfrom the Questa rock piles and two analog materials (the Goathilldebris flow and a talus/scree deposit within the Pit Alteration Scar).Most rock fragments selected exhibit varying degrees of hydrothermalalteration (Appendix 1) and have been exposed to weathering sincethe construction of the rock pile (approximately 25-40 years).Petrographic analysis (Appendix 1) and high point load and slakedurability indices indicate that, although some of the samples areweathered, the rock fragments are quite strong and have a similarrange in slake durability and point load indices (Tables 4 and 5). Theresults of this study indicate that rock fragments in the selected
samples are mainly subangular, subdiscoidal and subprismoidal. Notethat the sphericity and angularity of the rock fragments of the analogmaterials are similar to those of the rock piles. This suggests that thereis no relationship between particle shape and short-term weathering(<100 years) at the test locations Rock piles made of more angularparticles are more stable compared to rock piles with roundedparticles.
Figure 8. A photo of the material from the surface of a Questa rockpile showing the angularity of the rock fragments compared to aspherical ball 50 mm in diameter.
ACKNOWLEDGEMENT
This project was funded by Chevron Mining Inc. (formerlyMolycorp Inc.), the New Mexico Bureau of Geology and MineralResources (NMBGMR and the Department of Mineral Engineering,both at the New Mexico Institute of Mining and Technology (NMT). Wewould like to thank the professional staff and students of the largemulti-disciplinary field team for their assistance in the fieldwork anddata analyses. We would also thank American Geological Institute forgiving us the permission to use Powers, 1982 chart. David Jacobs,Dirk van Zyl, and Solomon Ampim reviewed an earlier version of thispaper and their comments are appreciated. Interpretations andconclusions expressed in this paper are not necessarily those ofChevron Mining Inc.
REFERENCES
1. Alshibli, K.A. and Alsaleh, M.I., 2004, Characterizing surfaceroughness and shape of sands using digital microscopy: Journalof Computing in Civil Engineering, v. 18(1), p. 36-45.
2. ASTM, 2001, American Society for Testing Materials. Proceduresfor testing soils (1964). Standard Test Method for Slake Durabilityof Shales and Similar Weak Rocks: D464487 (Reapproved 1992):Annual Book of ASTM Standards, West Conshohocken, PA.
3. Ayakwah, G., Dickens, A., and McLemore, V.T., 2008,Characterization of a debris flow profile, Questa, New Mexico:revised unpublished report to Molycorp Task B1.4Barrett, P.J.,1980, The shape of rock particles—A critical review:Sedimentology, v. 27, p. 291-303.
4. Bowman, E. T., Soga, K., and Drummnond, W., 2001, Particleshape characterization using Fourier descriptor analysis:Geotechnique, v. 51(6), p. 545–554.
5. Broch, E. and Franklin, J. A., 1972, The Point Load Strength Test:International Journal of Rock Mechanics and Mineral Sciences, v.9, p. 669-697.
6. Cho, G.C., Dodds, J., and Santamarina, J.C., 2006, Particleshape effects on packing density, stiffness, and strength: Naturaland crushed sands: Journal of Geotechnical andGeoenvironmental Engineering, v. 132, Issue 5, p. 591-602.
SME Annual MeetingFeb. 22-Feb. 25, 2009, Denver, CO
6 Copyright © 2009 by SME
7. Clark, N. N., 1987, A new scheme for particle shapecharacterization based on fractal harmonics and fractaldimensions: Powder Technology, v. 51, p. 243–249.
8. Das, B.M., 1983, Advanced Soil Mechanics: New York, McGrawHill Book Company, 511 p.
9. Dodds, J., 2003, Particle shape and stiffness—effects on soilbehavior: M.S. thesis, Georgia Institute of Technology, Atlanta,190 p.
10. Fakhimi A., Boakye K., Sperling D., and McLemore V., 2008,Development of a modified in situ direct shear test technique todetermine shear strength of mine rock piles: Geotechnical TestingJournal, v. 31, no. 3, paper on line www.astm.org.
11. Folk, R.L., 1955, Student operator error in determination ofroundness, sphericity, and grain size: Journal of SedimentaryPetrology, v. 25, no. 4, p. 297-301.
12. Fookes, P. G., Dearman, W. R., and Franklin, J. A., 1971, Someengineering aspects of rock weathering with field examples fromDartmoor and elsewhere: Quarterly Journal of EngineeringGeology, v. 4, p. 139-185.
13. Franklin, J.A., and Chandra, A., 1972, The slake durability test:International Journal of Rock Mechanics and Mineral Sciences: v.9, p. 325–341.
14. Graf, G., 2008, Mineralogical and geochemical changesassociated with sulfide and silicate weathering in natural alterationscars, Taos County, New Mexico: M.S. thesis, New MexicoInstitute of Mining and Technology, Socorro, 193 p.,HUhttp://geoinfo.nmt.edu/staff/mclemore/Molycorppapers.htmUH,accessed April 28, 2008.
15. Gutierrez, L.A.F., Viterbo, V.C., McLemore, V.T., and Aimone-Martin, C.T., 2008, Geotechnical and GeomechanicalCharacterisation of the Goathill North Rock Pile at the QuestaMolybdenum Mine, New Mexico, USA; in Fourier, A., ed., FirstInternational Seminar on the Management of Rock Dumps,Stockpiles and Heap Leach Pads: The Australian Centre forGeomechanics, University of Western Australia, p. 19-32.
16. Hyslip, J. P. and Vallejo, L. E., 1997, Fractal analysis of theroughness and size distribution of granular materials: EngineeringGeology, v. 48, no. 34, p. 231-244.
17. International Society for Rock Mechanics (ISRM), 1979,Suggested Methods for determination of the slake durabilityindex: International Journal of Rock Mechanics and MineralSciences Geomech., v. 16, 154-156.
18. Krumbein, W.C., 1941, Measurement and geological significanceof shape and roundness of sedimentary particles: Journal ofSedimentary Petrology, v. 11(2), p. 64-72.
19. Leps, T.M., 1970, Review of Shearing Strength of Rockfill,Journal of Soil Mechanics and Foundation Division, ASCE, Vol.96, No. SM4, Proc. Paper 7394., July, pp. 1159-1170
20. Ludington, S., Plumlee, G., Caine, J., Bove, D., Holloway, J. andLivo, E., 2004, Questa baseline and pre-mining ground waterinvestigation: 10. Geologic influences on ground and surfacewaters in the Red River watershed, New Mexico: U.S. GeologicalSurvey open-file report 2004-5245, 41 p.
21. Marsal, R.J., E.M. Gomez, A. Nunez G., R. Cuellar B. and R.M.Ramos, 1965, Research on the Behavior of Granular Soils andRockfill Samples, CFE, Publication, Mexico
22. McLemore, V., Sweeney, D., Dunbar, N., Heizler, L. and Phillips,E., 2009, Determining bulk mineralogy using a combination ofpetrographic techniques, whole rock chemistry, and MODAN:Society of Mining, Metallurgy and Exploration Annual Convention,preprint Feb 2009
23. Morris, H.C., 1959, Effect of particle shape and texture strength ofnon-cohesive aggregates: ASTM STP. No. 254, p. 350- 364.
24. Neuendorf, K.K.E., Mehl, J.P., Jr., and Jackson, J.A., 2005,Glossary of Geology: American Geological Institute, 5th ed.,Alexandria, Virginia, 779 p.
25. Norwest Corporation, 2004, Goathill North slide investigation,evaluation and mitigation report: unpublished report to MolycorpInc., 99 p., 3 vol.
26. Oakey, R.J., Green, M., Carling, P.A., Lee, M.W.E., Sear, D.A.,and Warburton, J., 2005, Grain shape analyses—a new methodfor determining representative particle shapes for populations ofnatural grains: Journal of Sedimentary Research, v. 75, p. 1065-1073.
27. Powers, M.C., 1982, Comparison chart for estimating roundnessand sphericity: AGI (© 1982 American Geological Institute),Alexandria, Va., data sheet 18.1
28. Robertson, A.M., 1982, Deformation and Monitoring of WasteDump Slopes, p. 16.
29. Smith, M.L., 1999, The analysis of surface texture usingphotometric stereo acquisition and gradient space domainmapping: Image Vis. Comput., v. 17, p. 1009–1019.
30. Sukumaran, B., and Ashmawy, A. K., 2001, Quantitativecharacterization of the Geometry of discrete particles:Geotechnique, v. 51(7), p. 171–179.
31. Viterbo, V.C., 2007, Effects of pre-miming hydrothermal alterationprocesses and post-mining weathering on rock engineeringproperties of Goathill North rock pile at Questa mine, TaosCounty, New Mexico: M.S. thesis, New Mexico Institute of Miningand Technology, Socorro, 274 p.,HUhttp://geoinfo.nmt.edu/staff/mclemore/Molycorppapers.htmUH,accessed December 06, 2007.
32. Wadell, H., 1932, Volume, shape, and roundness of rockparticles: Journal of Geology, v. 40, p. 443–451.
SME Annual MeetingFeb. 22-Feb. 25, 2009, Denver, CO
7 Copyright © 2009 by SME
APPENDIX 1
Brief descriptions of the samples, including indications ofweathering are below. The lithology, hydrothermal alteration, andmineralogy are in Table 1-2. Explanation of the SWI (SimpleWeathering Index) is in Table 1-3. Samples for the slake durability andpoint load measurements tested rock fragments of the predominantlithology (MIN-SAN-0001-intrusive, SPR-SAN-0001-andesite, SSW-SAN-0001-andesite, SSW-SAN-0005-andesite, QPS-SAN-0001-andesite, GHN-KMD-00017-andesite, GHN-KMD-0055-andesite, GHN-KMD-0095-rhyolite).
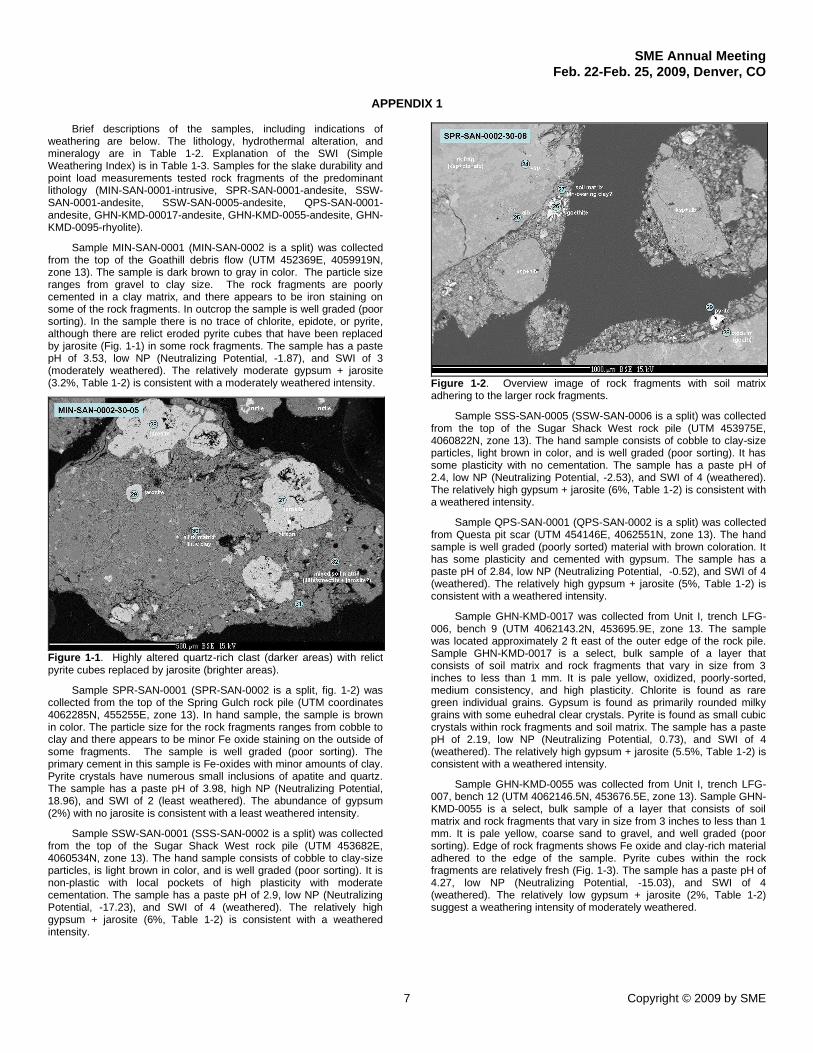
Sample MIN-SAN-0001 (MIN-SAN-0002 is a split) was collectedfrom the top of the Goathill debris flow (UTM 452369E, 4059919N,zone 13). The sample is dark brown to gray in color. The particle sizeranges from gravel to clay size. The rock fragments are poorlycemented in a clay matrix, and there appears to be iron staining onsome of the rock fragments. In outcrop the sample is well graded (poorsorting). In the sample there is no trace of chlorite, epidote, or pyrite,although there are relict eroded pyrite cubes that have been replacedby jarosite (Fig. 1-1) in some rock fragments. The sample has a pastepH of 3.53, low NP (Neutralizing Potential, -1.87), and SWI of 3(moderately weathered). The relatively moderate gypsum + jarosite(3.2%, Table 1-2) is consistent with a moderately weathered intensity.
Figure 1-1. Highly altered quartz-rich clast (darker areas) with relictpyrite cubes replaced by jarosite (brighter areas).
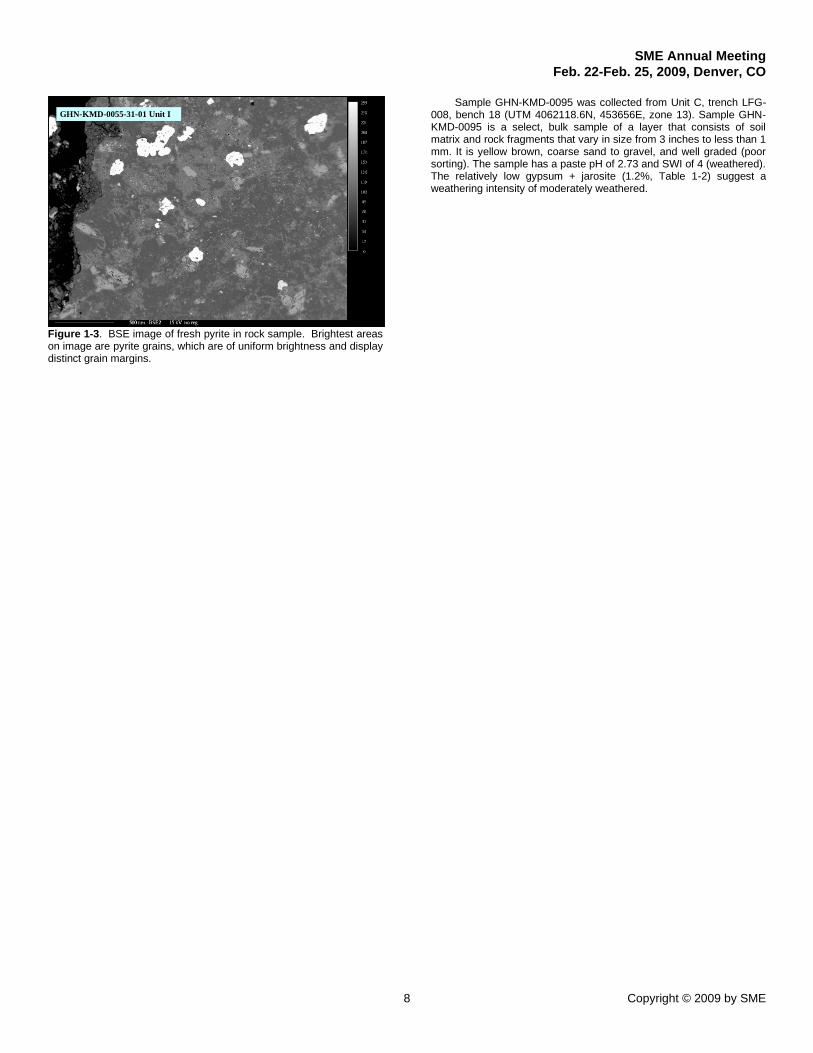
Sample SPR-SAN-0001 (SPR-SAN-0002 is a split, fig. 1-2) wascollected from the top of the Spring Gulch rock pile (UTM coordinates4062285N, 455255E, zone 13). In hand sample, the sample is brownin color. The particle size for the rock fragments ranges from cobble toclay and there appears to be minor Fe oxide staining on the outside ofsome fragments. The sample is well graded (poor sorting). Theprimary cement in this sample is Fe-oxides with minor amounts of clay.Pyrite crystals have numerous small inclusions of apatite and quartz.The sample has a paste pH of 3.98, high NP (Neutralizing Potential,18.96), and SWI of 2 (least weathered). The abundance of gypsum(2%) with no jarosite is consistent with a least weathered intensity.
Sample SSW-SAN-0001 (SSS-SAN-0002 is a split) was collectedfrom the top of the Sugar Shack West rock pile (UTM 453682E,4060534N, zone 13). The hand sample consists of cobble to clay-sizeparticles, is light brown in color, and is well graded (poor sorting). It isnon-plastic with local pockets of high plasticity with moderatecementation. The sample has a paste pH of 2.9, low NP (NeutralizingPotential, -17.23), and SWI of 4 (weathered). The relatively highgypsum + jarosite (6%, Table 1-2) is consistent with a weatheredintensity.
Figure 1-2. Overview image of rock fragments with soil matrixadhering to the larger rock fragments.
Sample SSS-SAN-0005 (SSW-SAN-0006 is a split) was collectedfrom the top of the Sugar Shack West rock pile (UTM 453975E,4060822N, zone 13). The hand sample consists of cobble to clay-sizeparticles, light brown in color, and is well graded (poor sorting). It hassome plasticity with no cementation. The sample has a paste pH of2.4, low NP (Neutralizing Potential, -2.53), and SWI of 4 (weathered).The relatively high gypsum + jarosite (6%, Table 1-2) is consistent witha weathered intensity.
Sample QPS-SAN-0001 (QPS-SAN-0002 is a split) was collectedfrom Questa pit scar (UTM 454146E, 4062551N, zone 13). The handsample is well graded (poorly sorted) material with brown coloration. Ithas some plasticity and cemented with gypsum. The sample has apaste pH of 2.84, low NP (Neutralizing Potential, -0.52), and SWI of 4(weathered). The relatively high gypsum + jarosite (5%, Table 1-2) isconsistent with a weathered intensity.
Sample GHN-KMD-0017 was collected from Unit I, trench LFG-006, bench 9 (UTM 4062143.2N, 453695.9E, zone 13. The samplewas located approximately 2 ft east of the outer edge of the rock pile.Sample GHN-KMD-0017 is a select, bulk sample of a layer thatconsists of soil matrix and rock fragments that vary in size from 3inches to less than 1 mm. It is pale yellow, oxidized, poorly-sorted,medium consistency, and high plasticity. Chlorite is found as raregreen individual grains. Gypsum is found as primarily rounded milkygrains with some euhedral clear crystals. Pyrite is found as small cubiccrystals within rock fragments and soil matrix. The sample has a pastepH of 2.19, low NP (Neutralizing Potential, 0.73), and SWI of 4(weathered). The relatively high gypsum + jarosite (5.5%, Table 1-2) isconsistent with a weathered intensity.
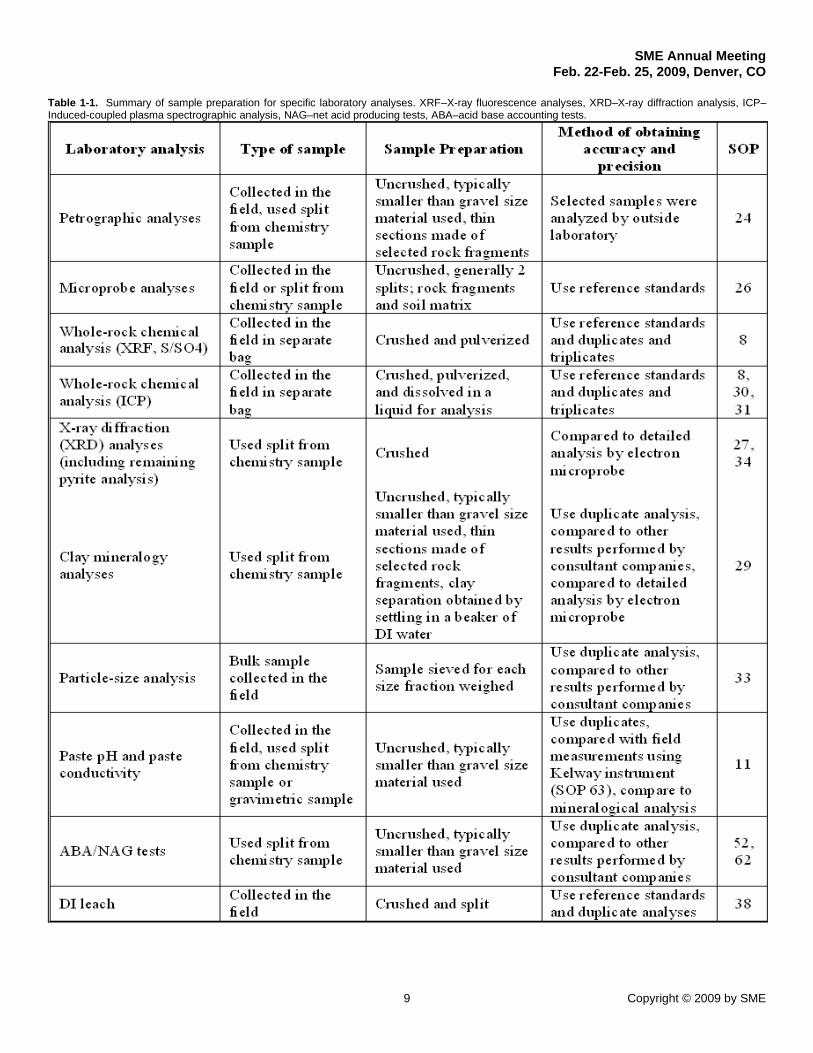
Sample GHN-KMD-0055 was collected from Unit I, trench LFG-007, bench 12 (UTM 4062146.5N, 453676.5E, zone 13). Sample GHN-KMD-0055 is a select, bulk sample of a layer that consists of soilmatrix and rock fragments that vary in size from 3 inches to less than 1mm. It is pale yellow, coarse sand to gravel, and well graded (poorsorting). Edge of rock fragments shows Fe oxide and clay-rich materialadhered to the edge of the sample. Pyrite cubes within the rockfragments are relatively fresh (Fig. 1-3). The sample has a paste pH of4.27, low NP (Neutralizing Potential, -15.03), and SWI of 4(weathered). The relatively low gypsum + jarosite (2%, Table 1-2)suggest a weathering intensity of moderately weathered.
SME Annual MeetingFeb. 22-Feb. 25, 2009, Denver, CO
8 Copyright © 2009 by SME
Figure 1-3. BSE image of fresh pyrite in rock sample. Brightest areason image are pyrite grains, which are of uniform brightness and displaydistinct grain margins.
Sample GHN-KMD-0095 was collected from Unit C, trench LFG-008, bench 18 (UTM 4062118.6N, 453656E, zone 13). Sample GHN-KMD-0095 is a select, bulk sample of a layer that consists of soilmatrix and rock fragments that vary in size from 3 inches to less than 1mm. It is yellow brown, coarse sand to gravel, and well graded (poorsorting). The sample has a paste pH of 2.73 and SWI of 4 (weathered).The relatively low gypsum + jarosite (1.2%, Table 1-2) suggest aweathering intensity of moderately weathered.
GHN-KMD-0055-31-01 Unit I
SME Annual MeetingFeb. 22-Feb. 25, 2009, Denver, CO
9 Copyright © 2009 by SME
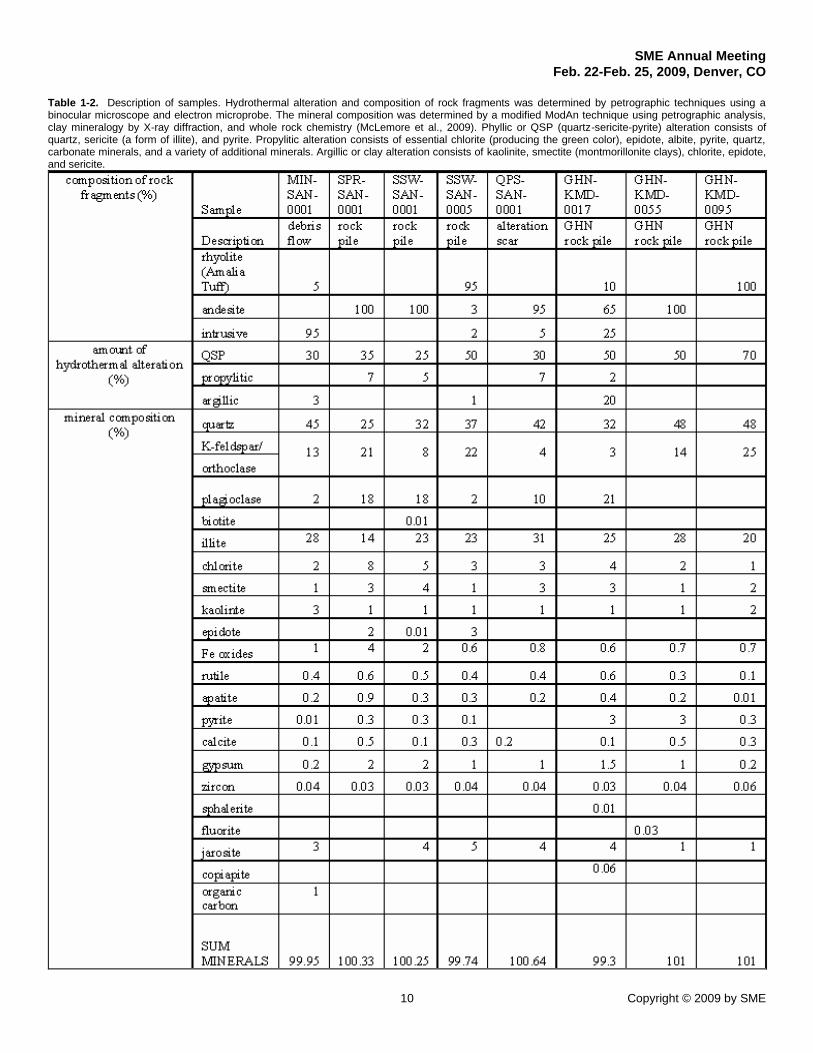
Table 1-1. Summary of sample preparation for specific laboratory analyses. XRF–X-ray fluorescence analyses, XRD–X-ray diffraction analysis, ICP–Induced-coupled plasma spectrographic analysis, NAG–net acid producing tests, ABA–acid base accounting tests.
SME Annual MeetingFeb. 22-Feb. 25, 2009, Denver, CO
10 Copyright © 2009 by SME
Table 1-2. Description of samples. Hydrothermal alteration and composition of rock fragments was determined by petrographic techniques using abinocular microscope and electron microprobe. The mineral composition was determined by a modified ModAn technique using petrographic analysis,clay mineralogy by X-ray diffraction, and whole rock chemistry (McLemore et al., 2009). Phyllic or QSP (quartz-sericite-pyrite) alteration consists ofquartz, sericite (a form of illite), and pyrite. Propylitic alteration consists of essential chlorite (producing the green color), epidote, albite, pyrite, quartz,carbonate minerals, and a variety of additional minerals. Argillic or clay alteration consists of kaolinite, smectite (montmorillonite clays), chlorite, epidote,and sericite.
SME Annual MeetingFeb. 22-Feb. 25, 2009, Denver, CO
11 Copyright © 2009 by SME
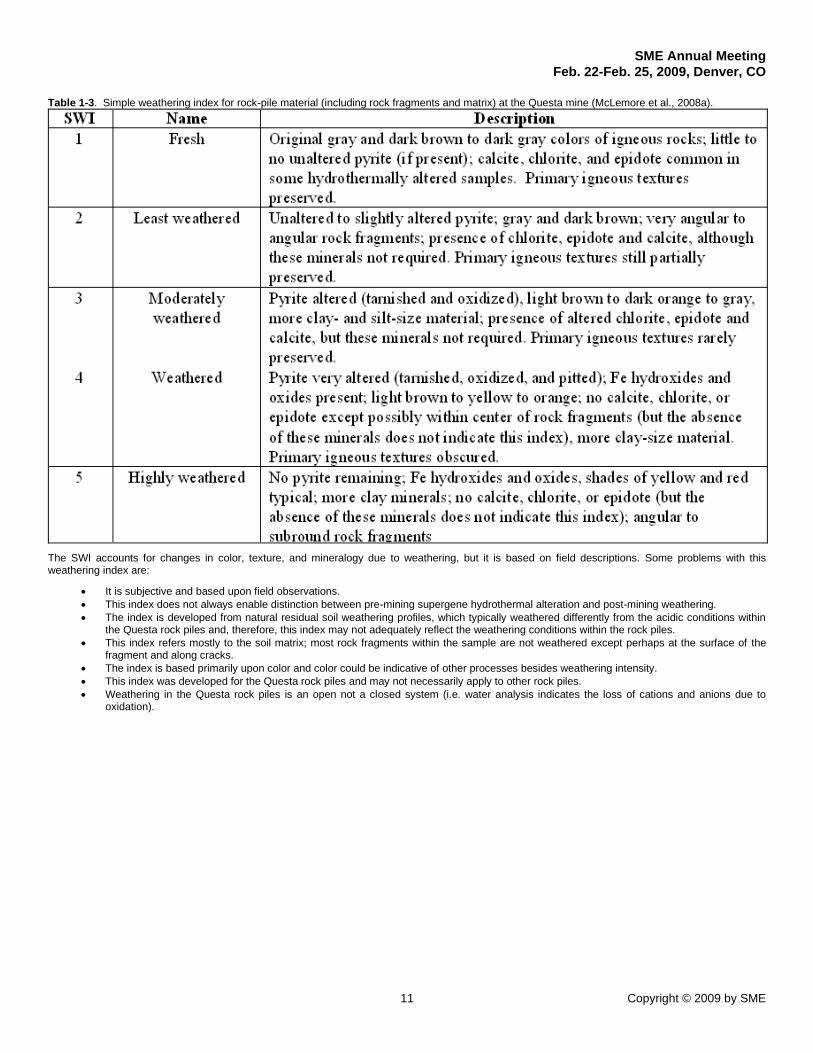
Table 1-3. Simple weathering index for rock-pile material (including rock fragments and matrix) at the Questa mine (McLemore et al., 2008a).
The SWI accounts for changes in color, texture, and mineralogy due to weathering, but it is based on field descriptions. Some problems with thisweathering index are:
It is subjective and based upon field observations. This index does not always enable distinction between pre-mining supergene hydrothermal alteration and post-mining weathering. The index is developed from natural residual soil weathering profiles, which typically weathered differently from the acidic conditions within
the Questa rock piles and, therefore, this index may not adequately reflect the weathering conditions within the rock piles. This index refers mostly to the soil matrix; most rock fragments within the sample are not weathered except perhaps at the surface of the
fragment and along cracks. The index is based primarily upon color and color could be indicative of other processes besides weathering intensity. This index was developed for the Questa rock piles and may not necessarily apply to other rock piles. Weathering in the Questa rock piles is an open not a closed system (i.e. water analysis indicates the loss of cations and anions due to
oxidation).
SME Annual MeetingFeb. 22-Feb. 25, 2009, Denver, CO
12 Copyright © 2009 by SME
APPENDIX 2
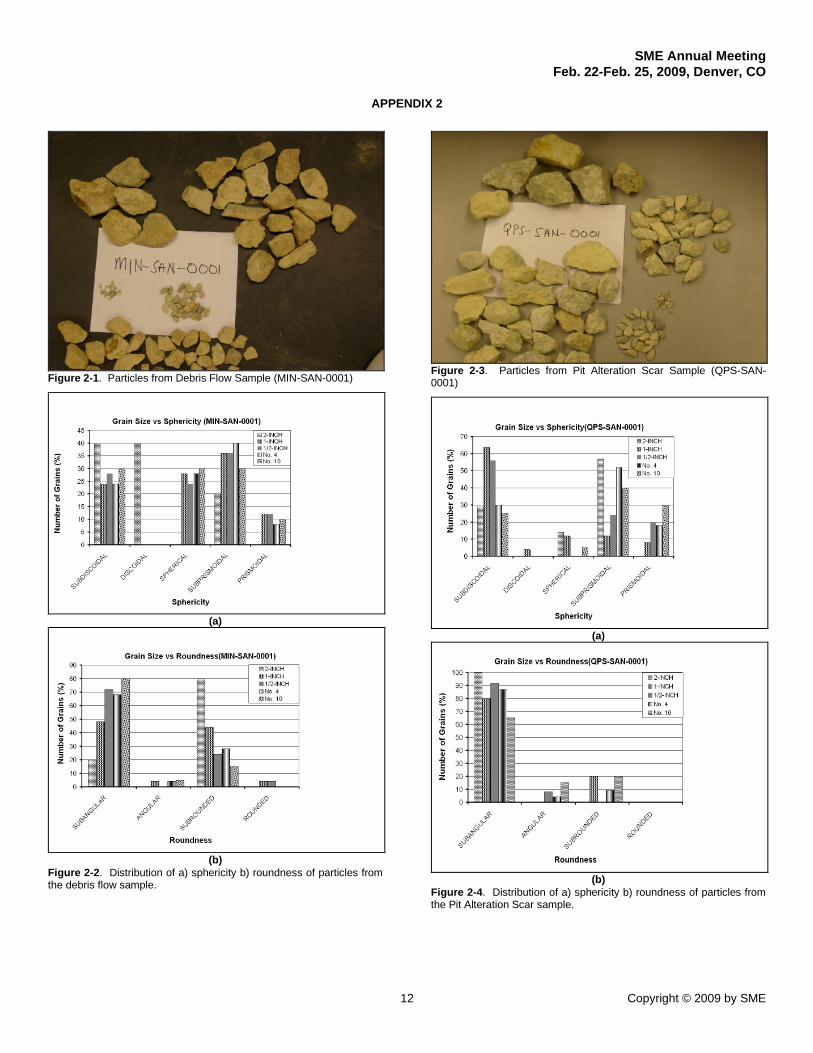
Figure 2-1. Particles from Debris Flow Sample (MIN-SAN-0001)
(a)
(b)Figure 2-2. Distribution of a) sphericity b) roundness of particles fromthe debris flow sample.
Figure 2-3. Particles from Pit Alteration Scar Sample (QPS-SAN-0001)
(a)
(b)Figure 2-4. Distribution of a) sphericity b) roundness of particles fromthe Pit Alteration Scar sample.
SME Annual MeetingFeb. 22-Feb. 25, 2009, Denver, CO
13 Copyright © 2009 by SME
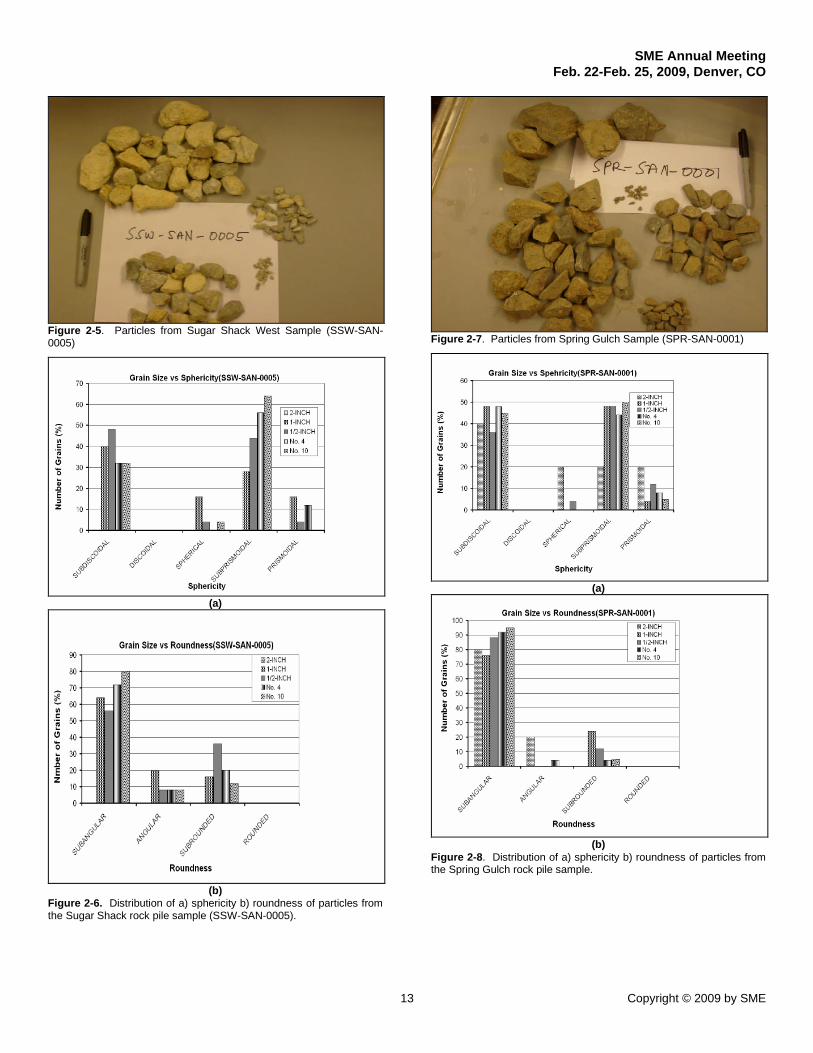
Figure 2-5. Particles from Sugar Shack West Sample (SSW-SAN-0005)
(a)
(b)Figure 2-6. Distribution of a) sphericity b) roundness of particles fromthe Sugar Shack rock pile sample (SSW-SAN-0005).
Figure 2-7. Particles from Spring Gulch Sample (SPR-SAN-0001)
(a)
(b)Figure 2-8. Distribution of a) sphericity b) roundness of particles fromthe Spring Gulch rock pile sample.
SME Annual MeetingFeb. 22-Feb. 25, 2009, Denver, CO
14 Copyright © 2009 by SME
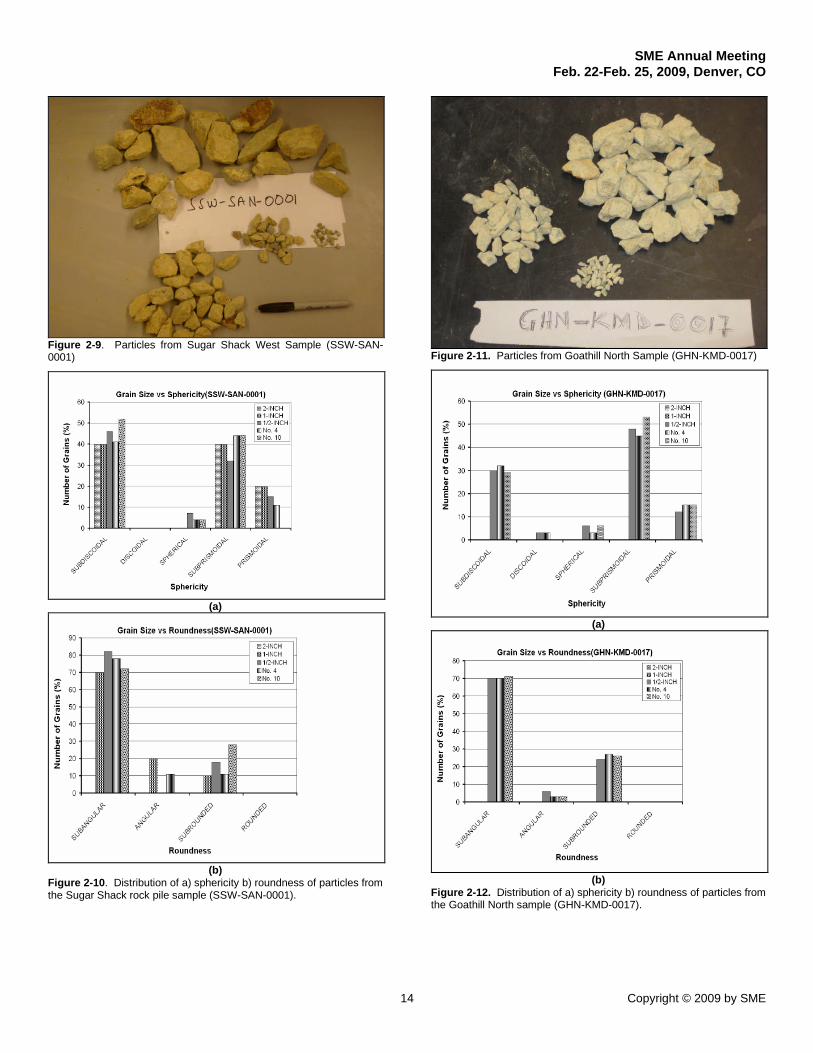
Figure 2-9. Particles from Sugar Shack West Sample (SSW-SAN-0001)
(a)
(b)Figure 2-10. Distribution of a) sphericity b) roundness of particles fromthe Sugar Shack rock pile sample (SSW-SAN-0001).
Figure 2-11. Particles from Goathill North Sample (GHN-KMD-0017)
(a)
(b)Figure 2-12. Distribution of a) sphericity b) roundness of particles fromthe Goathill North sample (GHN-KMD-0017).
SME Annual MeetingFeb. 22-Feb. 25, 2009, Denver, CO
15 Copyright © 2009 by SME
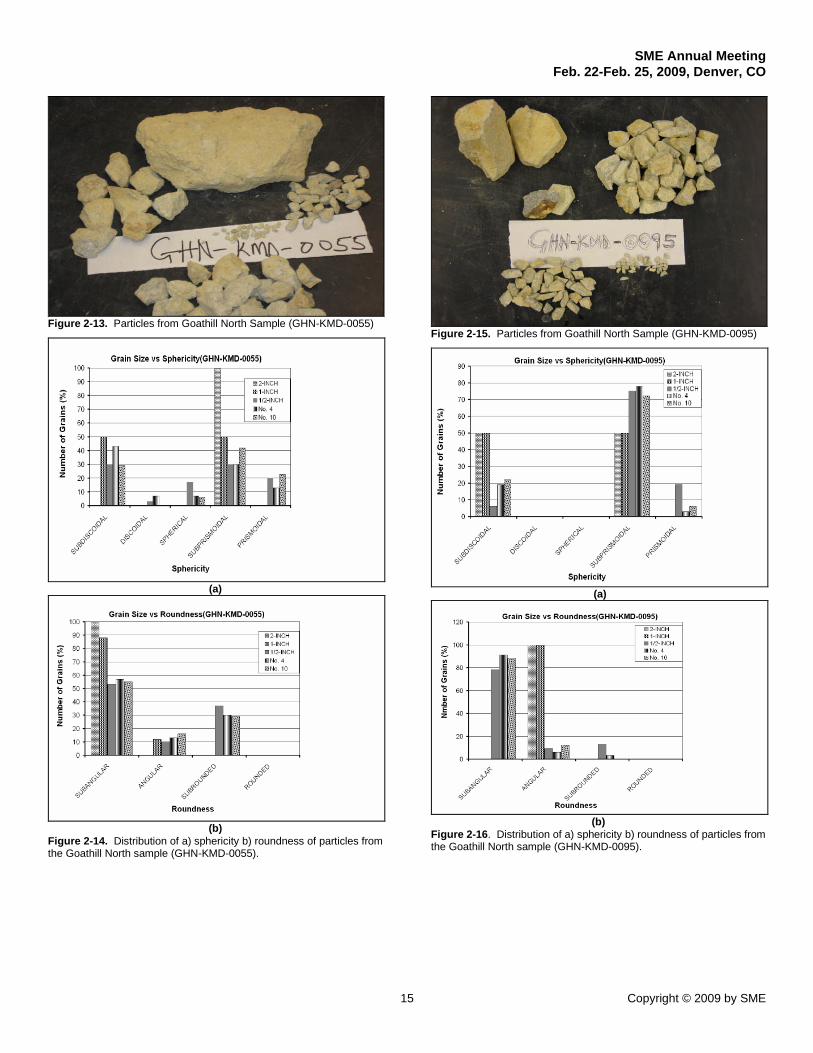
Figure 2-13. Particles from Goathill North Sample (GHN-KMD-0055)
(a)
(b)Figure 2-14. Distribution of a) sphericity b) roundness of particles fromthe Goathill North sample (GHN-KMD-0055).
Figure 2-15. Particles from Goathill North Sample (GHN-KMD-0095)
(a)
(b)Figure 2-16. Distribution of a) sphericity b) roundness of particles fromthe Goathill North sample (GHN-KMD-0095).