Embed Size (px)
Citation preview
www.steadman-group.com
1
Market Research Division
Media Monitoring Division
Management Training Division
Prepared forPrepared forPrepared for
A quality assured firmwww.steadman-group.com
April 2006April 2006April 2006
www.steadman-group.com
2
Table of ContentsTable of ContentsTable of ContentsTable of ContentsTable of ContentsTable of ContentsTable of ContentsTable of ContentsTable of ContentsTable of ContentsTable of ContentsTable of Contents
Executive summary 3
Study background 6
Study objectives 7
Study design and methodology 8
Data capture and analysis 9
Sample distribution 10
Sample demographics
Survey findings 15
> Needs assessments 17
> Benefits of the lighting initiative 19
> Perceptions towards the lighting initiative 31
> Consumer Brand awareness & usage 35
> Bank usage 45
> Economic optimism and
perceptions towards the rich 49
Survey conclusions 55
References 56
Slide Number
11
www.steadman-group.com
3
Executive SummaryExecutive SummaryExecutive SummaryExecutive SummaryExecutive SummaryExecutive SummaryExecutive SummaryExecutive SummaryExecutive SummaryExecutive SummaryExecutive SummaryExecutive Summary
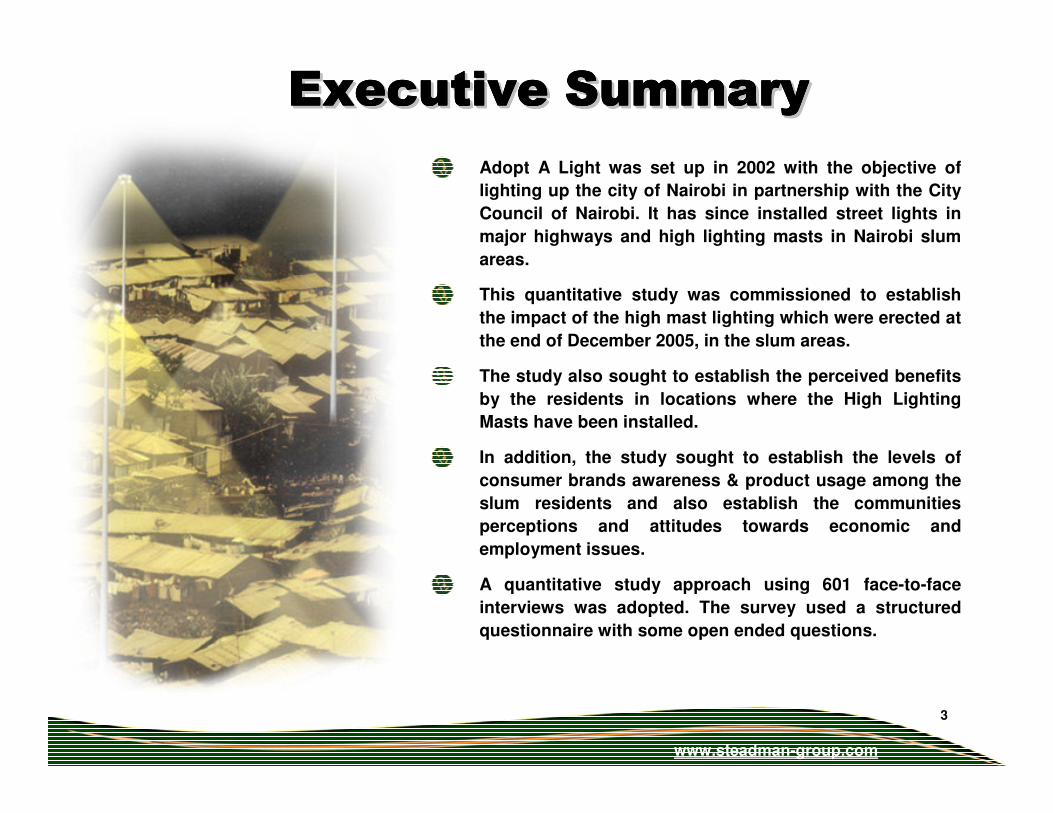
Adopt A Light was set up in 2002 with the objective of
lighting up the city of Nairobi in partnership with the City
Council of Nairobi. It has since installed street lights in
major highways and high lighting masts in Nairobi slum
areas.
This quantitative study was commissioned to establish
the impact of the high mast lighting which were erected at
the end of December 2005, in the slum areas.
The study also sought to establish the perceived benefits
by the residents in locations where the High Lighting
Masts have been installed.
In addition, the study sought to establish the levels of
consumer brands awareness & product usage among the
slum residents and also establish the communities
perceptions and attitudes towards economic and
employment issues.
A quantitative study approach using 601 face-to-face
interviews was adopted. The survey used a structured
questionnaire with some open ended questions.
www.steadman-group.com
4
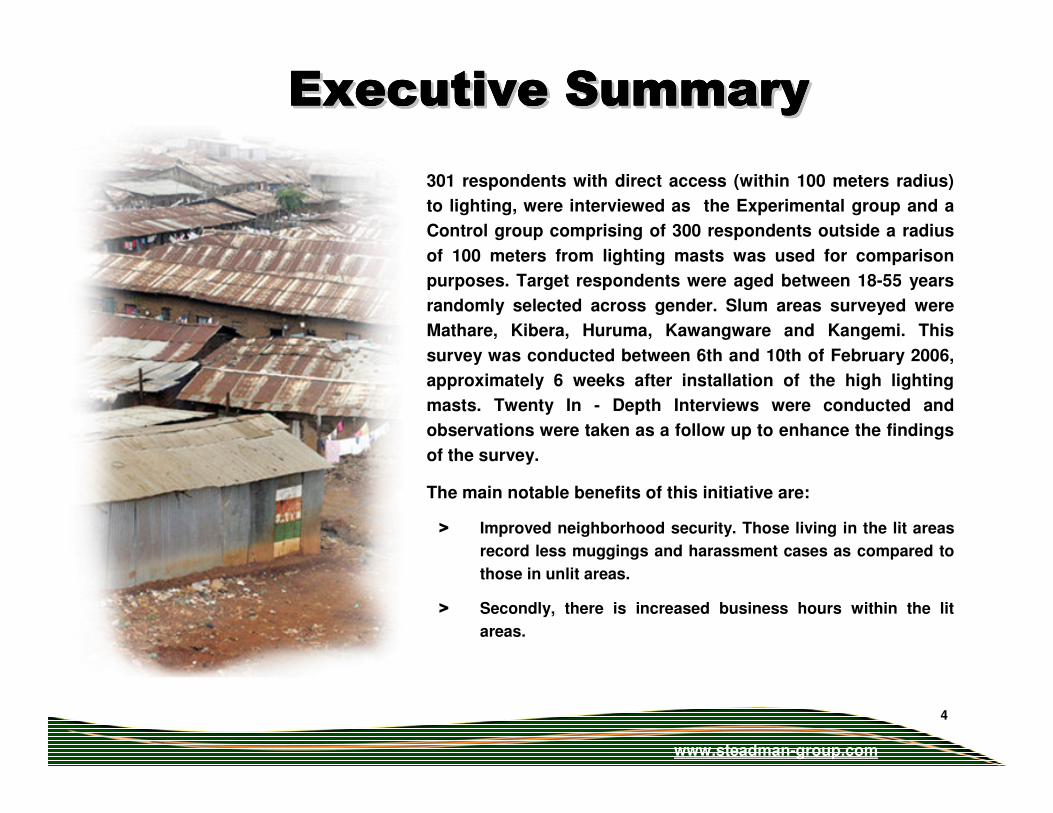
301 respondents with direct access (within 100 meters radius)
to lighting, were interviewed as the Experimental group and a
Control group comprising of 300 respondents outside a radius
of 100 meters from lighting masts was used for comparison
purposes. Target respondents were aged between 18-55 years
randomly selected across gender. Slum areas surveyed were
Mathare, Kibera, Huruma, Kawangware and Kangemi. This
survey was conducted between 6th and 10th of February 2006,
approximately 6 weeks after installation of the high lighting
masts. Twenty In - Depth Interviews were conducted and
observations were taken as a follow up to enhance the findings
of the survey.
The main notable benefits of this initiative are:
> Improved neighborhood security. Those living in the lit areas
record less muggings and harassment cases as compared to
those in unlit areas.
> Secondly, there is increased business hours within the lit
areas.
Executive SummaryExecutive SummaryExecutive SummaryExecutive SummaryExecutive SummaryExecutive SummaryExecutive SummaryExecutive SummaryExecutive SummaryExecutive SummaryExecutive SummaryExecutive Summary
www.steadman-group.com
5
Though minimal, there is a notable spill over effect on the neighboring unlit areas, mainly
due to longer business hours.
Generally, all those interviewed (both in lit and unlit areas) perceive improvement on
security as the main benefit that will accrue from this lighting initiative.
Awareness and usage of five categories of consumer brands, were tested. The findings
show that the slum dwellers are highly brand conscious with brands such as Kasuku
cooking oil, Omo washing detergent, Colgate tooth paste, Jamaa bar soap and Geisha
bathing Soap rating high on awareness and usage.
On bank usage, 35% of the respondents are saving money for purposes of emergencies
such as burials and medical expenses and for unforeseen household needs. Of those, 31%
hide their savings at home while around 51% are using banking institutions. Post bank is
being used by a majority of the slum dwellers who claim to use banking institutions for
saving.
35% of those interviewed believe that the government is behind the lighting initiative, while
almost a similar number(30%) correctly record that Adopt A light is behind the initiative.
Executive SummaryExecutive SummaryExecutive SummaryExecutive SummaryExecutive SummaryExecutive SummaryExecutive SummaryExecutive SummaryExecutive SummaryExecutive SummaryExecutive SummaryExecutive Summary
www.steadman-group.com
6
Adopt A Light was set up in 2002 with the objective of
lighting up the city of Nairobi in partnership with the City
Council of Nairobi.
The first phase of the Lighting Initiative, is to light up major
highways and roads such as Uhuru highway, Waiyaki Way,
Limuru Road, Mombasa Road.
The second phase is to install high lighting masts in the
slum areas of Nairobi. In this regard, high lighting masts
were erected at the end of December 2005 in some selected
slum areas.
To evaluate the impact of the high mast lighting initiative,
Adopt A Light commissioned The Steadman Group to
conduct an impact assessment survey whose objectives
are outlined below:
Study BackgroundStudy BackgroundStudy BackgroundStudy BackgroundStudy BackgroundStudy BackgroundStudy BackgroundStudy Background
www.steadman-group.com
7
To establish the perceived benefits by the residents in
locations where the high lighting masts have been installed
To establish the impact of the project on the lives of the
residents in the slum areas
To determine the attitudes and perceptions towards this
initiative among the residents.
To establish the awareness & usage levels of various
consumer brands among the residents in the slums
To establish the communities perceptions and attitudes
towards economic and employment opportunities.
To establish awareness and perceptions towards the
organisations behind the high lighting mast initiative.
Study ObjectivesStudy ObjectivesStudy ObjectivesStudy ObjectivesStudy ObjectivesStudy ObjectivesStudy ObjectivesStudy ObjectivesStudy ObjectivesStudy ObjectivesStudy ObjectivesStudy Objectives
www.steadman-group.com
8
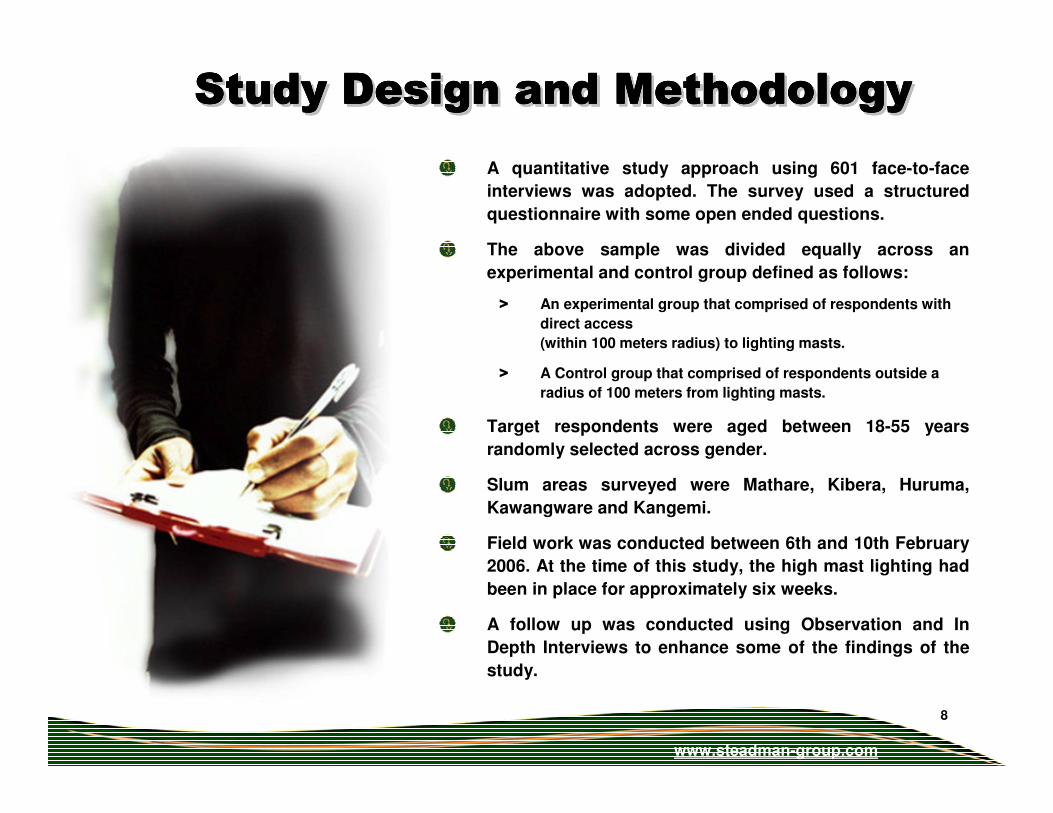
A quantitative study approach using 601 face-to-face
interviews was adopted. The survey used a structured
questionnaire with some open ended questions.
The above sample was divided equally across an
experimental and control group defined as follows:
> An experimental group that comprised of respondents with
direct access
(within 100 meters radius) to lighting masts.
> A Control group that comprised of respondents outside a
radius of 100 meters from lighting masts.
Target respondents were aged between 18-55 years
randomly selected across gender.
Slum areas surveyed were Mathare, Kibera, Huruma,
Kawangware and Kangemi.
Field work was conducted between 6th and 10th February
2006. At the time of this study, the high mast lighting had
been in place for approximately six weeks.
A follow up was conducted using Observation and In
Depth Interviews to enhance some of the findings of the
study.
Study Design and MethodologyStudy Design and MethodologyStudy Design and MethodologyStudy Design and MethodologyStudy Design and MethodologyStudy Design and MethodologyStudy Design and MethodologyStudy Design and Methodology
www.steadman-group.com
9
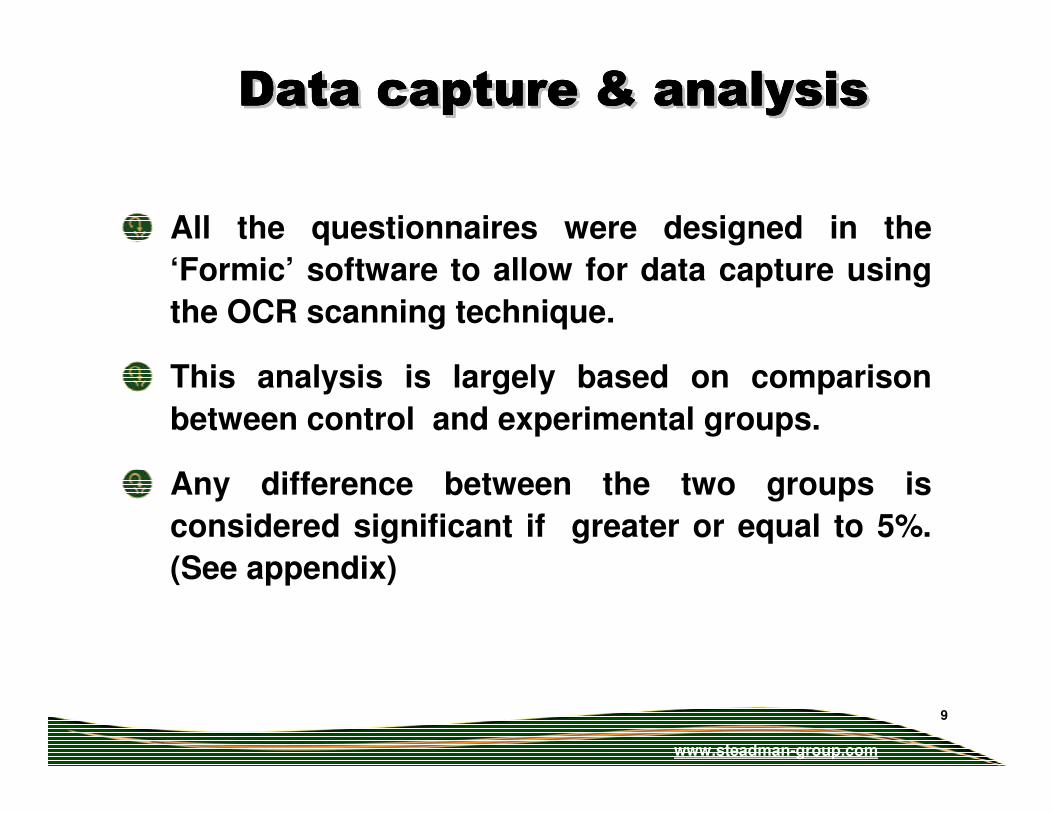
All the questionnaires were designed in the
‘Formic’ software to allow for data capture using
the OCR scanning technique.
This analysis is largely based on comparison
between control and experimental groups.
Any difference between the two groups is
considered significant if greater or equal to 5%.
(See appendix)
Data capture & analysisData capture & analysisData capture & analysisData capture & analysisData capture & analysisData capture & analysisData capture & analysisData capture & analysis
www.steadman-group.com
10
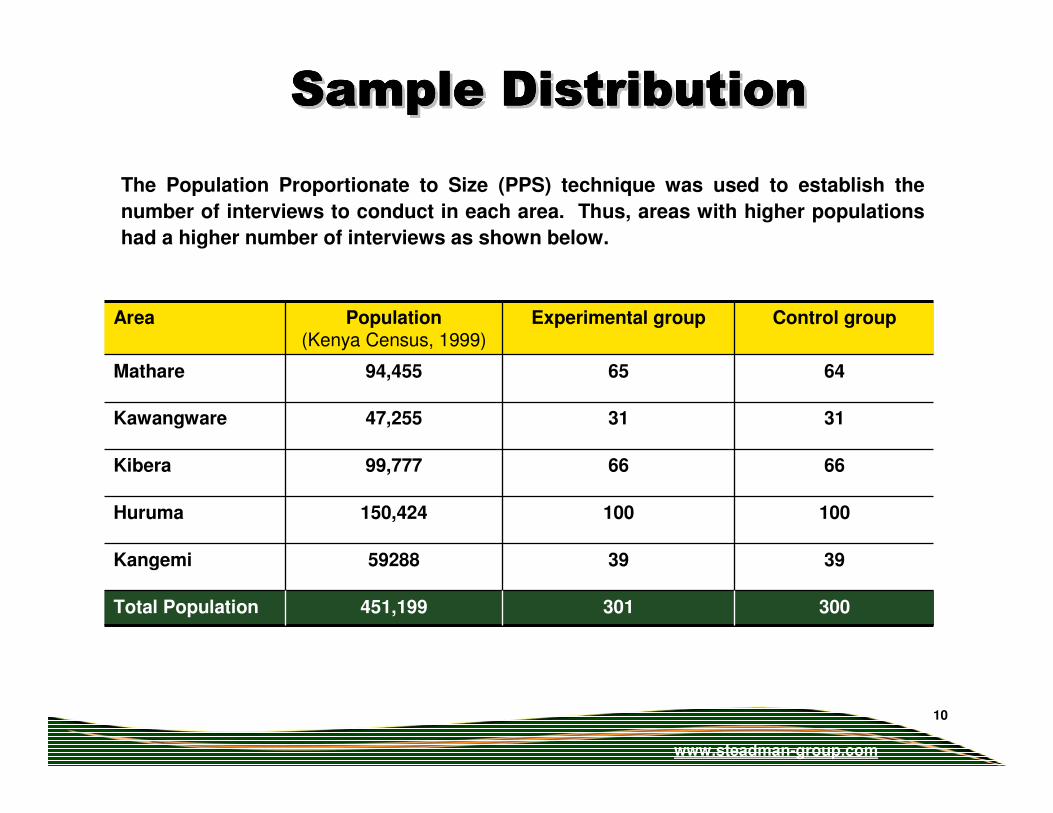
300301451,199Total Population
393959288Kangemi
100100150,424Huruma
666699,777Kibera
313147,255Kawangware
646594,455Mathare
Control groupExperimental groupPopulation(Kenya Census, 1999)
Area
The Population Proportionate to Size (PPS) technique was used to establish the
number of interviews to conduct in each area. Thus, areas with higher populations
had a higher number of interviews as shown below.
Sample DistributionSample DistributionSample DistributionSample DistributionSample DistributionSample DistributionSample DistributionSample Distribution
www.steadman-group.com
11
Sample Sample Sample Sample
DemographicsDemographicsDemographicsDemographics
Sample Sample Sample Sample
DemographicsDemographicsDemographicsDemographics
www.steadman-group.com
12
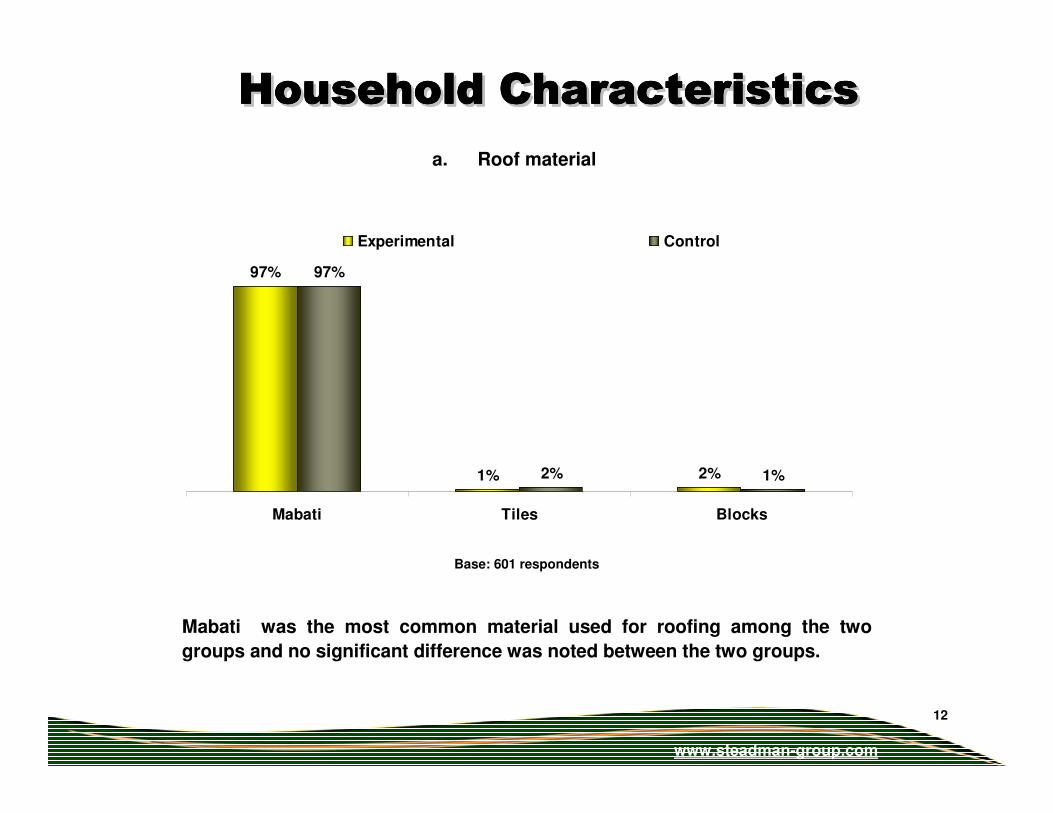
Mabati was the most common material used for roofing among the two
groups and no significant difference was noted between the two groups.
Household CharacteristicsHousehold CharacteristicsHousehold CharacteristicsHousehold CharacteristicsHousehold CharacteristicsHousehold CharacteristicsHousehold CharacteristicsHousehold Characteristics
Base: 601 respondents
a. Roof material
97%
2%
97%
1%1% 2%
Mabati Tiles Blocks
Experimental Control
www.steadman-group.com
13
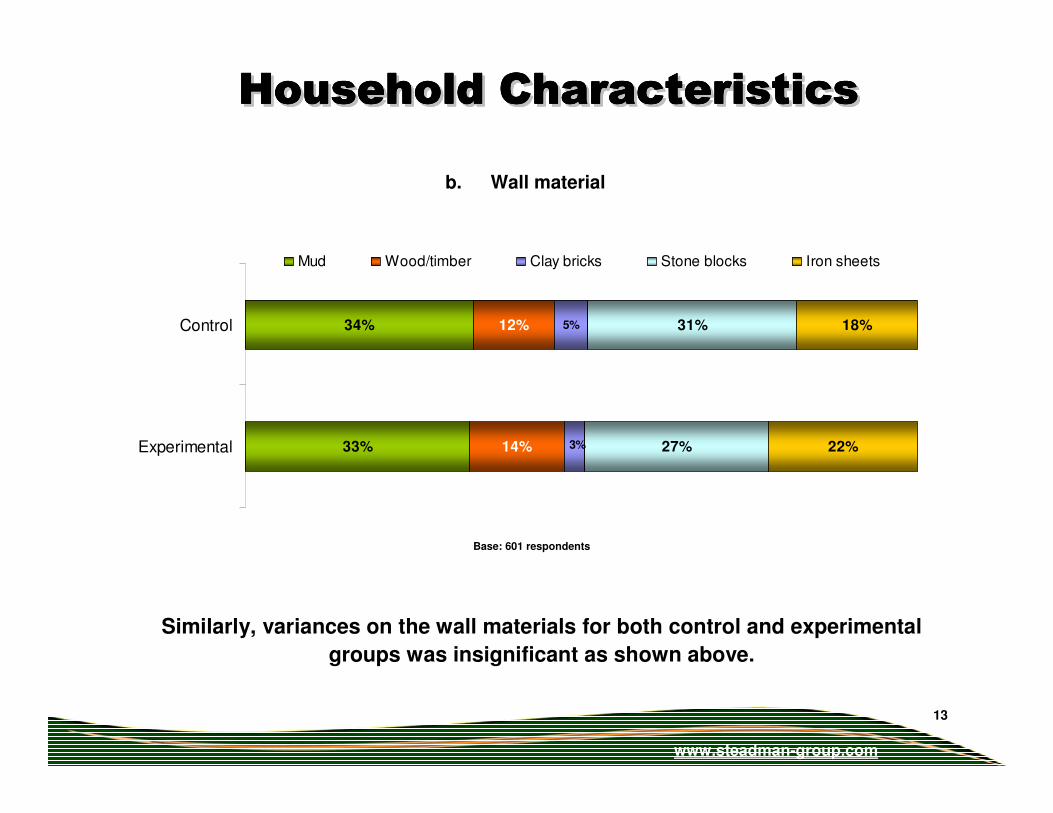
Similarly, variances on the wall materials for both control and experimental
groups was insignificant as shown above.
33%
34%
14%
12% 5%
27%
31%
22%
18%
3%Experimental
Control
Mud Wood/timber Clay bricks Stone blocks Iron sheets
b. Wall material
Base: 601 respondents
Household CharacteristicsHousehold CharacteristicsHousehold CharacteristicsHousehold CharacteristicsHousehold CharacteristicsHousehold CharacteristicsHousehold CharacteristicsHousehold Characteristics
www.steadman-group.com
14
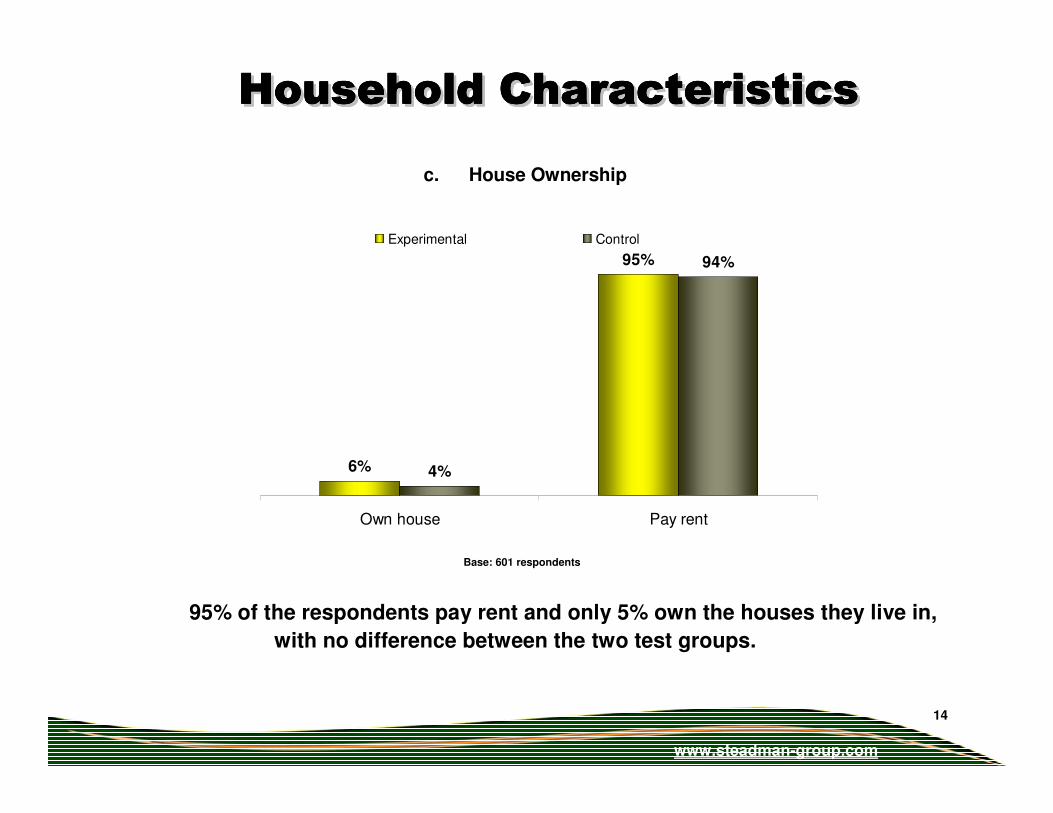
95% of the respondents pay rent and only 5% own the houses they live in,
with no difference between the two test groups.
Base: 601 respondents
6%
95%
4%
94%
Own house Pay rent
Experimental Control
c. House Ownership
Household CharacteristicsHousehold CharacteristicsHousehold CharacteristicsHousehold CharacteristicsHousehold CharacteristicsHousehold CharacteristicsHousehold CharacteristicsHousehold Characteristics
www.steadman-group.com
15
Survey FindingsSurvey FindingsSurvey FindingsSurvey FindingsSurvey FindingsSurvey FindingsSurvey FindingsSurvey Findings
www.steadman-group.com
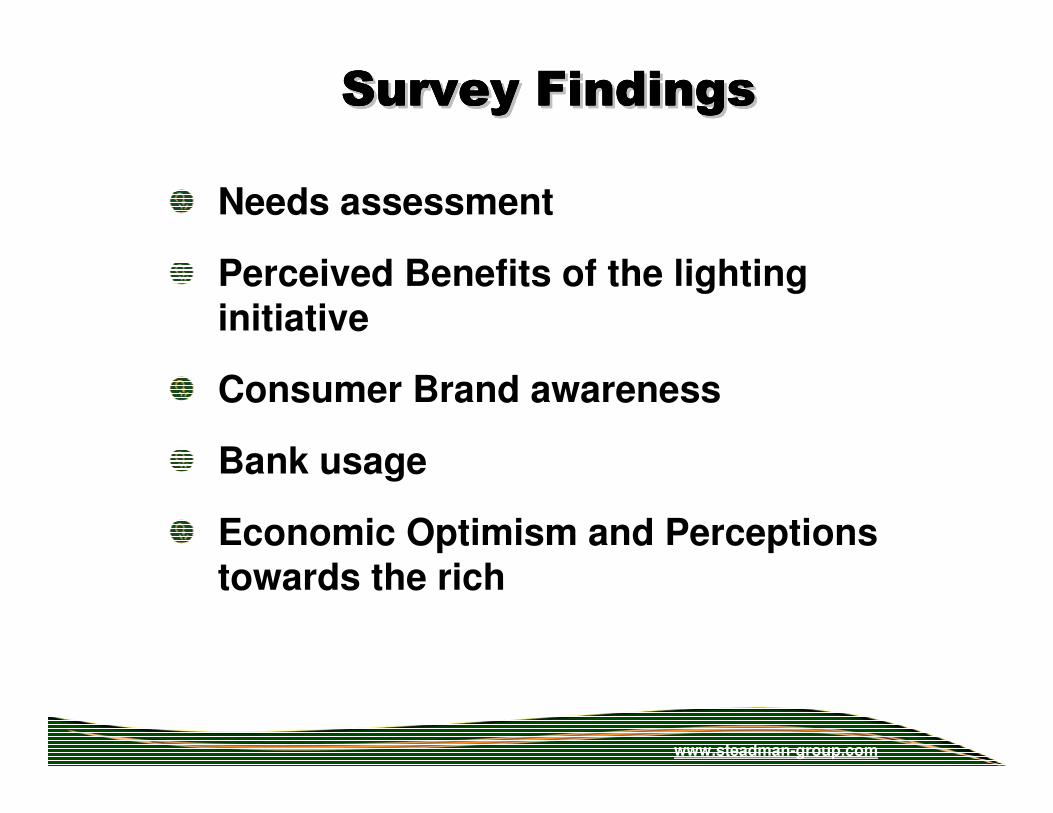
Survey FindingsSurvey FindingsSurvey FindingsSurvey FindingsSurvey FindingsSurvey FindingsSurvey FindingsSurvey Findings
Needs assessment
Perceived Benefits of the lighting initiative
Consumer Brand awareness
Bank usage
Economic Optimism and Perceptions towards the rich
www.steadman-group.com
17
1.1.1.1.Needs Needs Needs Needs
AssessmentAssessmentAssessmentAssessment
1.1.1.1.Needs Needs Needs Needs
AssessmentAssessmentAssessmentAssessment
www.steadman-group.com
18
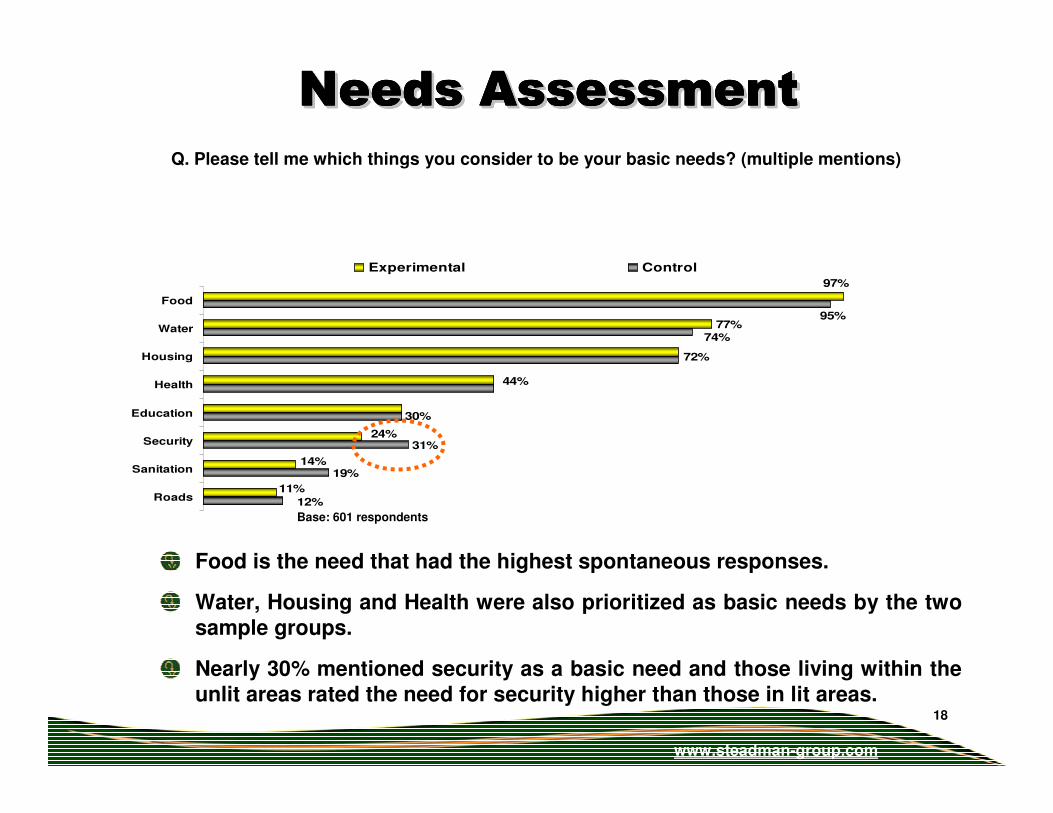
Q. Please tell me which things you consider to be your basic needs? (multiple mentions)
77%
31%
19%14%
24%
72%
44%
30%
97%
11%
12%
74%
95%
Food
Water
Housing
Health
Education
Security
Sanitation
Roads
Experimental Control
Food is the need that had the highest spontaneous responses.
Water, Housing and Health were also prioritized as basic needs by the two sample groups.
Nearly 30% mentioned security as a basic need and those living within the unlit areas rated the need for security higher than those in lit areas.
Base: 601 respondents
Needs AssessmentNeeds AssessmentNeeds AssessmentNeeds AssessmentNeeds AssessmentNeeds AssessmentNeeds AssessmentNeeds AssessmentNeeds AssessmentNeeds AssessmentNeeds AssessmentNeeds Assessment
www.steadman-group.com
19
2.2.2.2.Benefits of the Benefits of the Benefits of the Benefits of the
Lighting Lighting Lighting Lighting
InitiativeInitiativeInitiativeInitiative
2.2.2.2.Benefits of the Benefits of the Benefits of the Benefits of the
Lighting Lighting Lighting Lighting
InitiativeInitiativeInitiativeInitiative
www.steadman-group.com
20
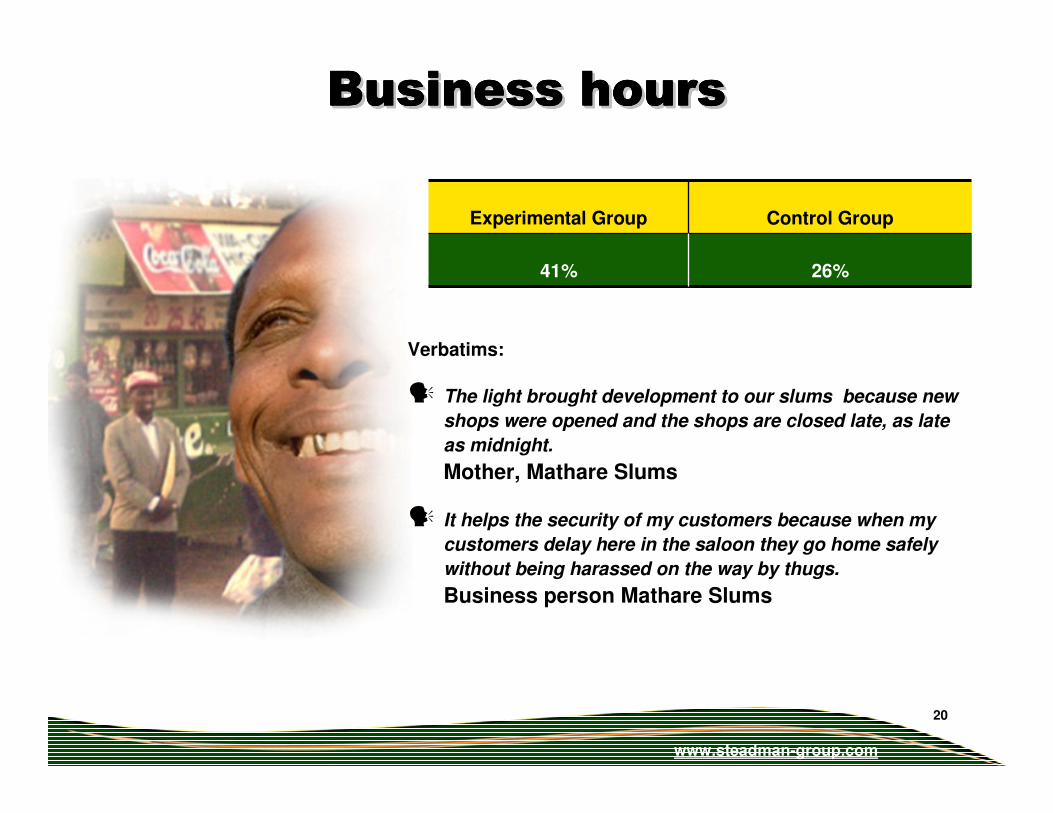
26%41%
Control GroupExperimental Group
Verbatims:
� The light brought development to our slums because new
shops were opened and the shops are closed late, as late
as midnight.
Mother, Mathare Slums
� It helps the security of my customers because when my
customers delay here in the saloon they go home safely
without being harassed on the way by thugs.
Business person Mathare Slums
Business hoursBusiness hoursBusiness hoursBusiness hoursBusiness hoursBusiness hoursBusiness hoursBusiness hoursBusiness hoursBusiness hoursBusiness hoursBusiness hours
www.steadman-group.com
21
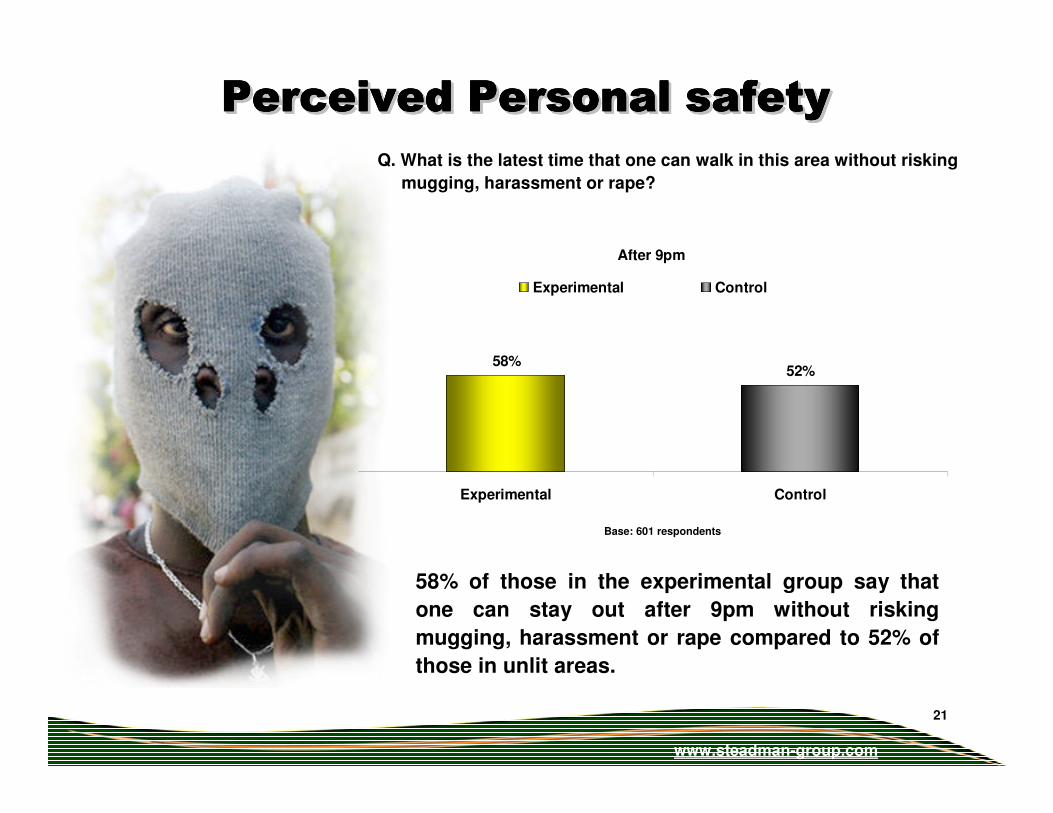
Q. What is the latest time that one can walk in this area without risking
mugging, harassment or rape?
Base: 601 respondents
After 9pm
58%52%
Experimental Control
Experimental Control
Perceived Personal safetyPerceived Personal safetyPerceived Personal safetyPerceived Personal safetyPerceived Personal safetyPerceived Personal safetyPerceived Personal safetyPerceived Personal safetyPerceived Personal safetyPerceived Personal safetyPerceived Personal safetyPerceived Personal safety
58% of those in the experimental group say that
one can stay out after 9pm without risking
mugging, harassment or rape compared to 52% of
those in unlit areas.
www.steadman-group.com
22
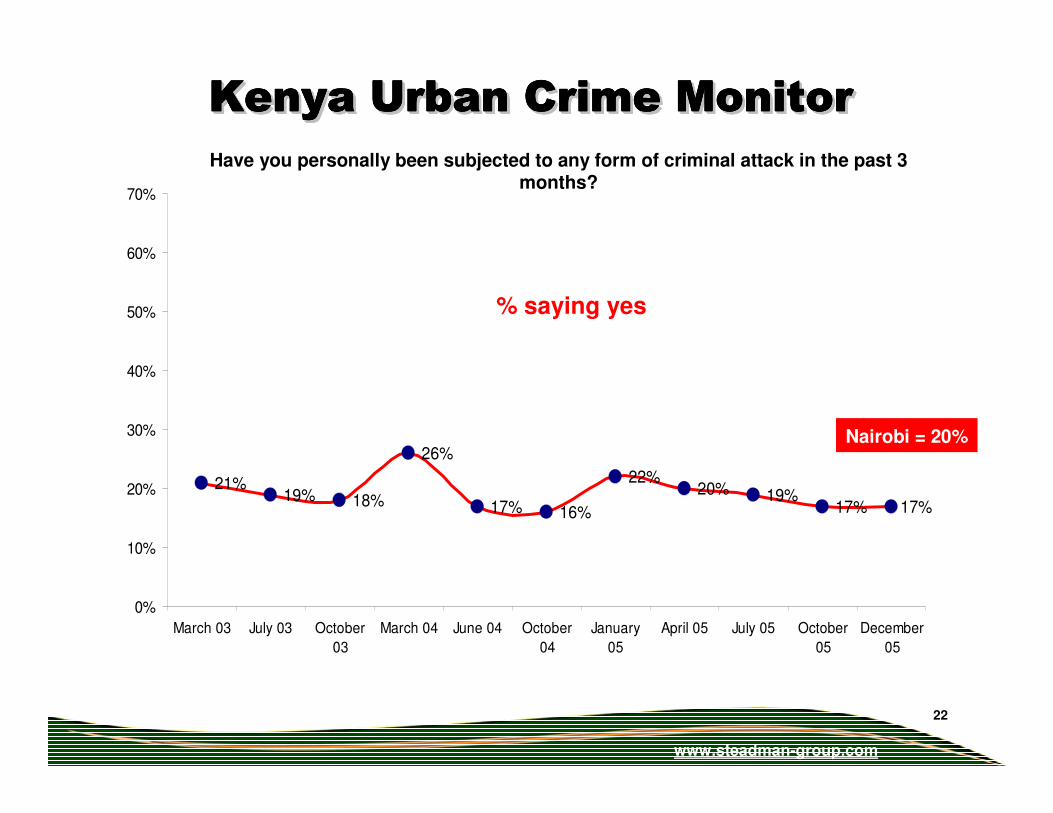
Have you personally been subjected to any form of criminal attack in the past 3 months?
% saying yes
21%19% 18%
26%
17% 16%
22%20% 19%
17% 17%
0%
10%
20%
30%
40%
50%
60%
70%
March 03 July 03 October
03
March 04 June 04 October
04
January
05
April 05 July 05 October
05
December
05
Nairobi = 20%
Kenya Urban Crime MonitorKenya Urban Crime MonitorKenya Urban Crime MonitorKenya Urban Crime MonitorKenya Urban Crime MonitorKenya Urban Crime MonitorKenya Urban Crime MonitorKenya Urban Crime MonitorKenya Urban Crime MonitorKenya Urban Crime MonitorKenya Urban Crime MonitorKenya Urban Crime Monitor
www.steadman-group.com
23
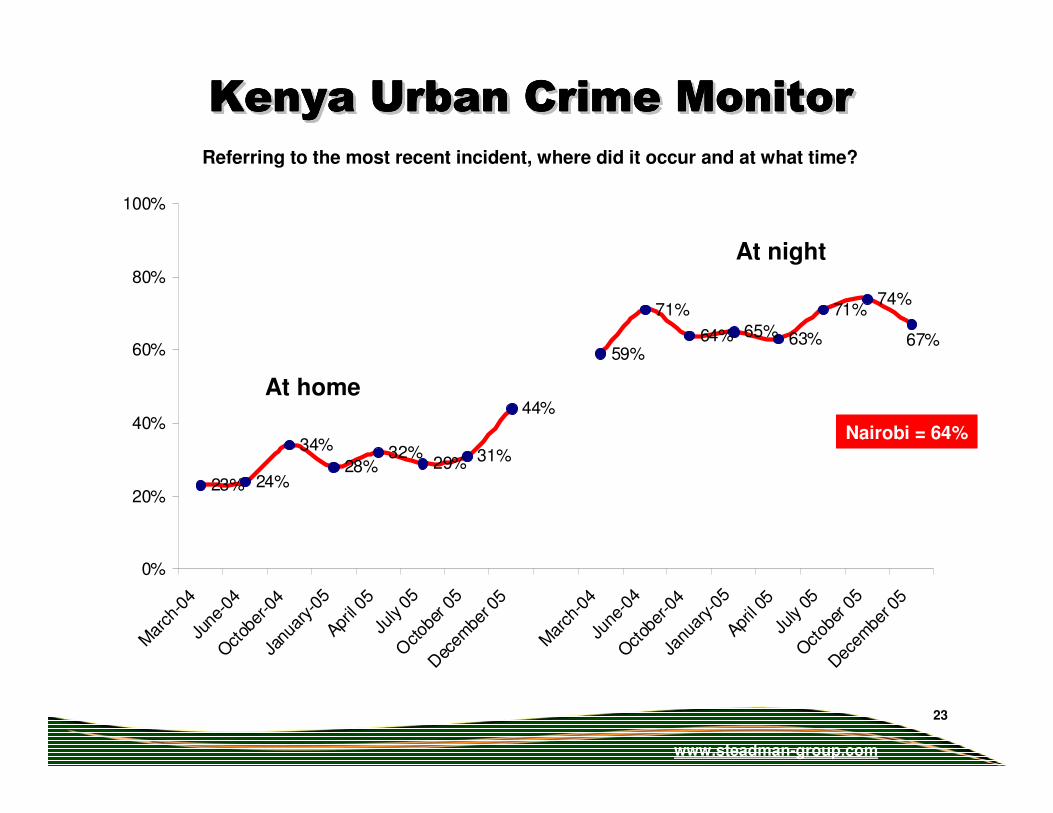
23% 24%
34%
28%32%
29% 31%
44%
59%
71%
64% 65% 63%
71%74%
67%
0%
20%
40%
60%
80%
100%
Mar
ch-0
4Ju
ne-0
4O
ctob
er-0
4Ja
nuar
y-05
April
05Ju
ly 0
5O
ctob
er 0
5
Dec
embe
r 05
Mar
ch-0
4Ju
ne-0
4O
ctob
er-0
4Ja
nuar
y-05
April
05Ju
ly 0
5O
ctob
er 0
5
Dec
embe
r 05
Referring to the most recent incident, where did it occur and at what time?
At home
At night
Nairobi = 64%
Kenya Urban Crime MonitorKenya Urban Crime MonitorKenya Urban Crime MonitorKenya Urban Crime MonitorKenya Urban Crime MonitorKenya Urban Crime MonitorKenya Urban Crime MonitorKenya Urban Crime MonitorKenya Urban Crime MonitorKenya Urban Crime MonitorKenya Urban Crime MonitorKenya Urban Crime Monitor
www.steadman-group.com
24
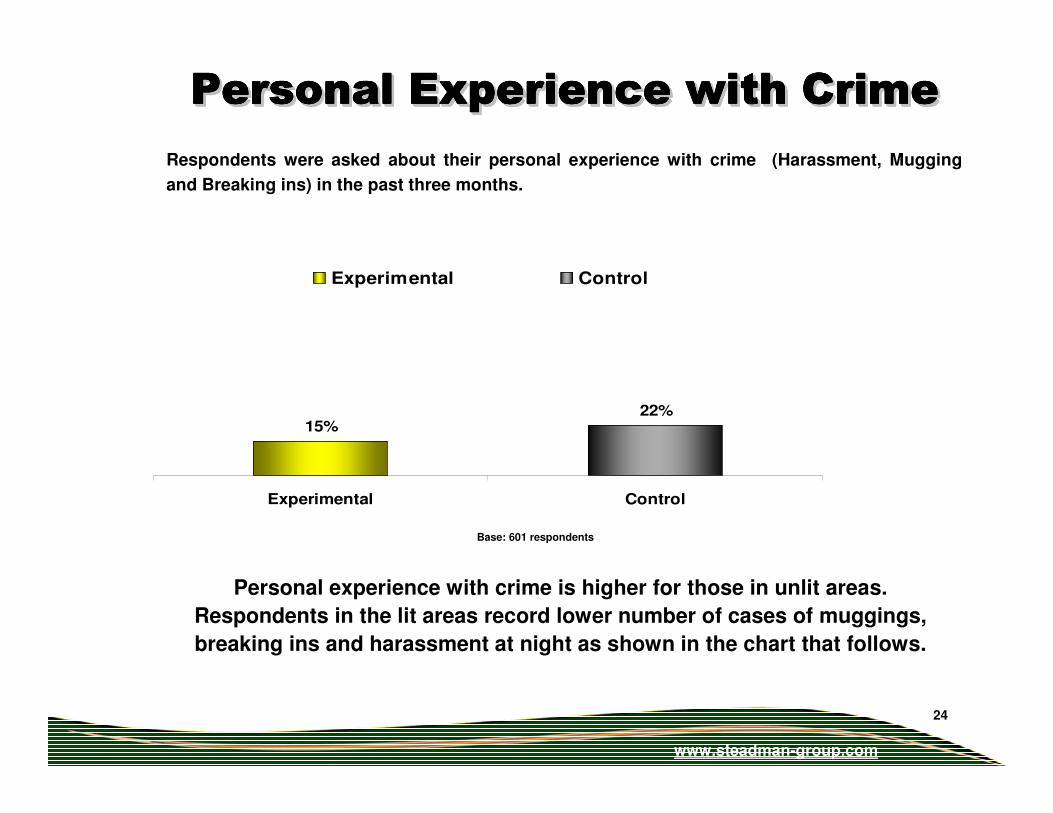
Respondents were asked about their personal experience with crime (Harassment, Mugging
and Breaking ins) in the past three months.
Base: 601 respondents
15%22%
Experimental Control
Experimental Control
Personal experience with crime is higher for those in unlit areas.
Respondents in the lit areas record lower number of cases of muggings,
breaking ins and harassment at night as shown in the chart that follows.
Personal Experience with CrimePersonal Experience with CrimePersonal Experience with CrimePersonal Experience with CrimePersonal Experience with CrimePersonal Experience with CrimePersonal Experience with CrimePersonal Experience with CrimePersonal Experience with CrimePersonal Experience with CrimePersonal Experience with CrimePersonal Experience with Crime
www.steadman-group.com
25
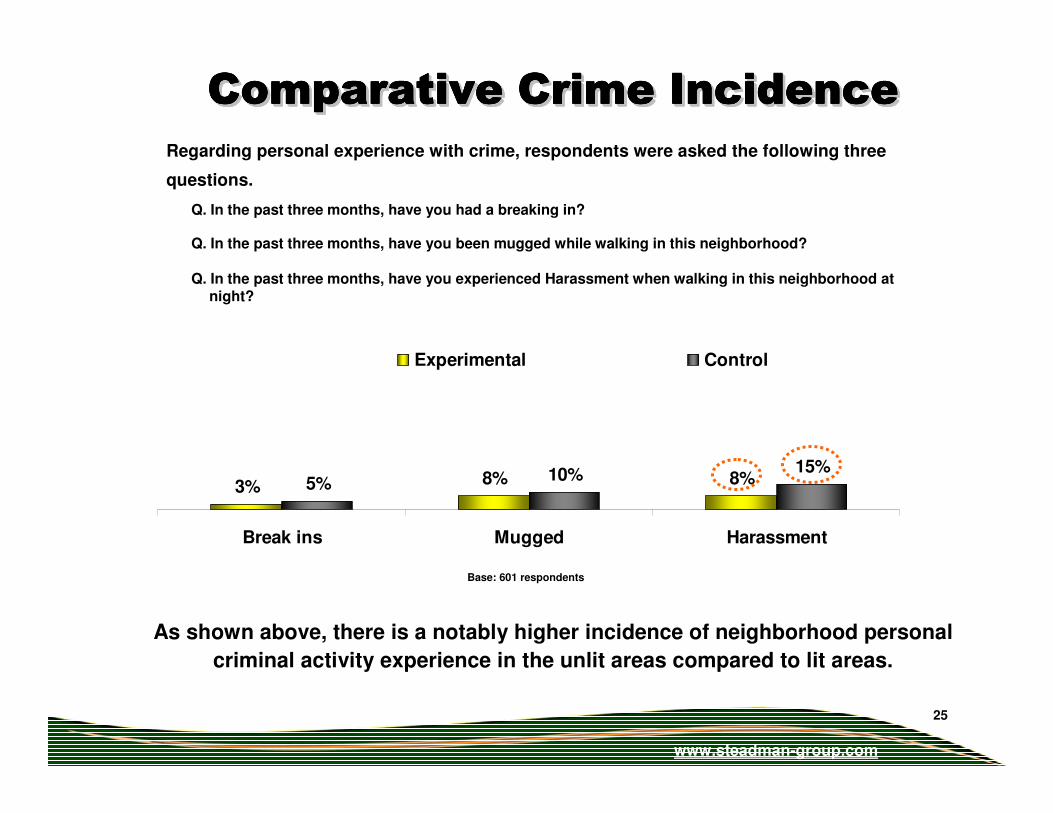
Q. In the past three months, have you experienced Harassment when walking in this neighborhood at night?
Q. In the past three months, have you had a breaking in?
Q. In the past three months, have you been mugged while walking in this neighborhood?
3% 8% 8%5%10% 15%
Break ins Mugged Harassment
Experimental Control
Base: 601 respondents
As shown above, there is a notably higher incidence of neighborhood personal
criminal activity experience in the unlit areas compared to lit areas.
Regarding personal experience with crime, respondents were asked the following three
questions.
Comparative Crime IncidenceComparative Crime IncidenceComparative Crime IncidenceComparative Crime IncidenceComparative Crime IncidenceComparative Crime IncidenceComparative Crime IncidenceComparative Crime IncidenceComparative Crime IncidenceComparative Crime IncidenceComparative Crime IncidenceComparative Crime Incidence
www.steadman-group.com
26
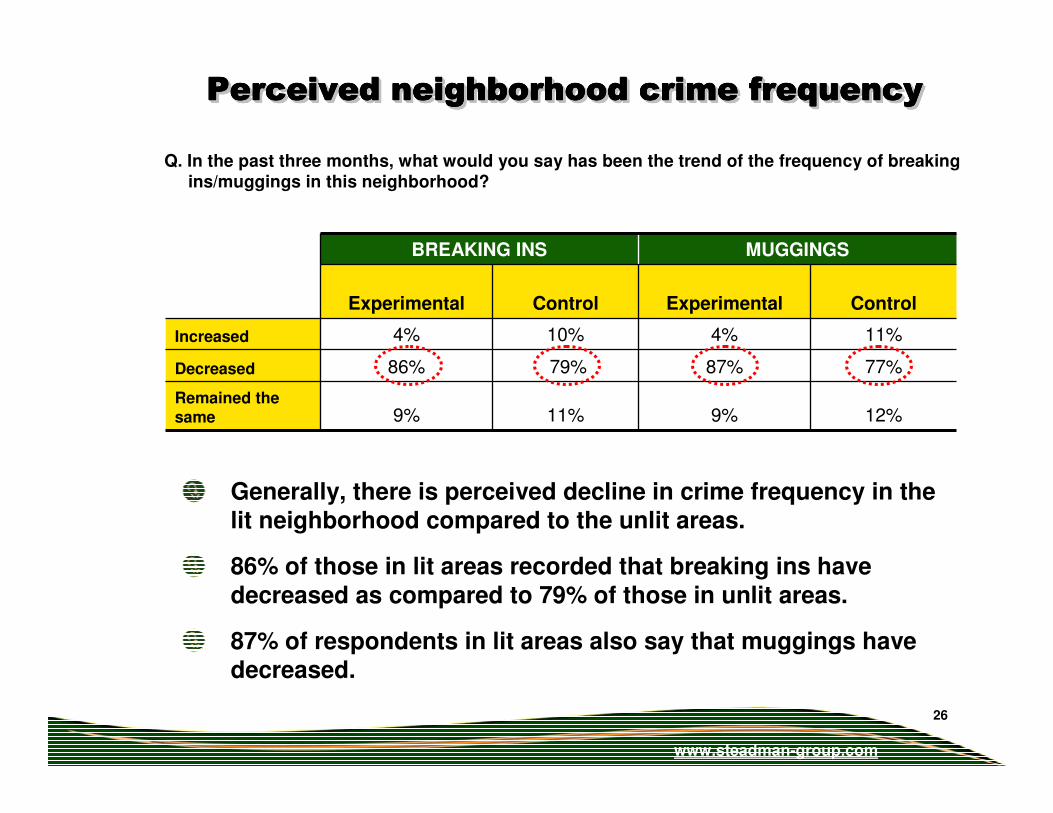
12%9%11%9%Remained the same
77%87%79%86%Decreased
11%4%10%4%Increased
ControlExperimentalControlExperimental
MUGGINGSBREAKING INS
Generally, there is perceived decline in crime frequency in the lit neighborhood compared to the unlit areas.
86% of those in lit areas recorded that breaking ins have
decreased as compared to 79% of those in unlit areas.
87% of respondents in lit areas also say that muggings have decreased.
Q. In the past three months, what would you say has been the trend of the frequency of breaking ins/muggings in this neighborhood?
Perceived neighborhood crime frequencyPerceived neighborhood crime frequencyPerceived neighborhood crime frequencyPerceived neighborhood crime frequencyPerceived neighborhood crime frequencyPerceived neighborhood crime frequencyPerceived neighborhood crime frequencyPerceived neighborhood crime frequencyPerceived neighborhood crime frequencyPerceived neighborhood crime frequencyPerceived neighborhood crime frequencyPerceived neighborhood crime frequency
www.steadman-group.com
27
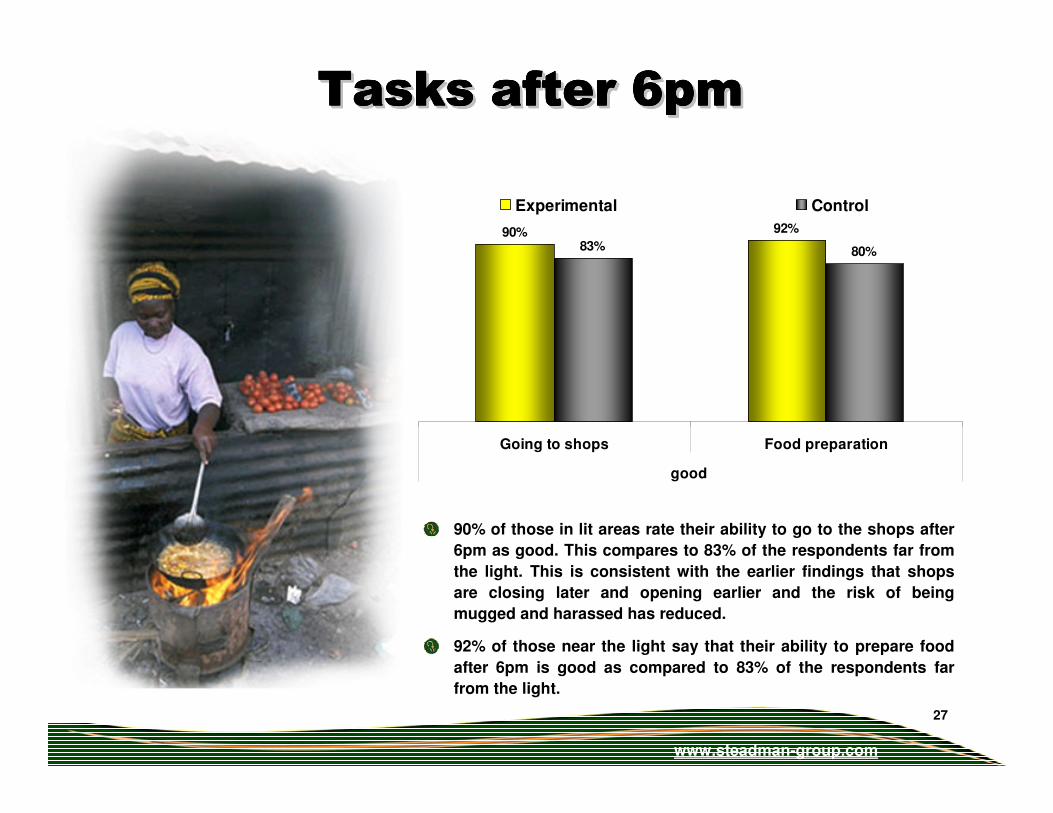
90% 92%
83% 80%
Going to shops Food preparation
good
Experimental Control
Tasks after 6pmTasks after 6pmTasks after 6pmTasks after 6pmTasks after 6pmTasks after 6pmTasks after 6pmTasks after 6pmTasks after 6pmTasks after 6pmTasks after 6pmTasks after 6pm
90% of those in lit areas rate their ability to go to the shops after
6pm as good. This compares to 83% of the respondents far from
the light. This is consistent with the earlier findings that shops
are closing later and opening earlier and the risk of being
mugged and harassed has reduced.
92% of those near the light say that their ability to prepare food
after 6pm is good as compared to 83% of the respondents far
from the light.
www.steadman-group.com
28
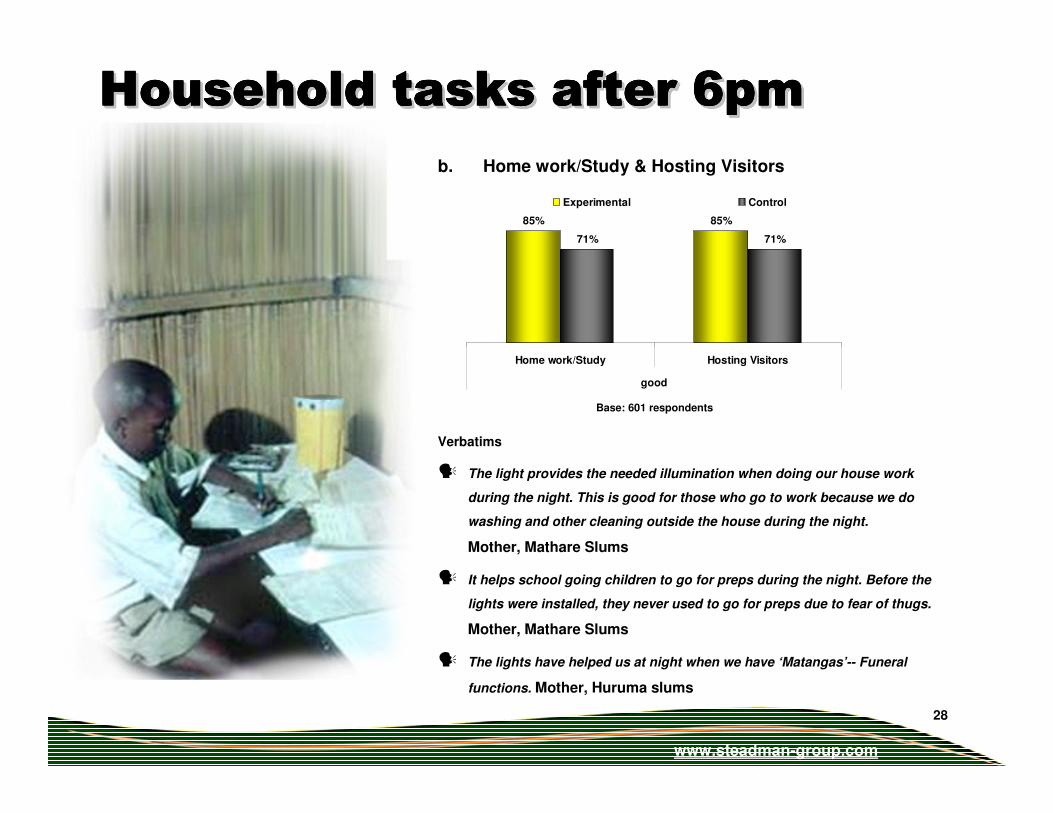
b. Home work/Study & Hosting Visitors
Verbatims
� The light provides the needed illumination when doing our house work
during the night. This is good for those who go to work because we do
washing and other cleaning outside the house during the night.
Mother, Mathare Slums
� It helps school going children to go for preps during the night. Before the
lights were installed, they never used to go for preps due to fear of thugs.
Mother, Mathare Slums
� The lights have helped us at night when we have ‘Matangas’-- Funeral
functions. Mother, Huruma slums
Base: 601 respondents
85% 85%
71% 71%
Home work/Study Hosting Visitors
good
Experimental Control
Household tasks after 6pmHousehold tasks after 6pmHousehold tasks after 6pmHousehold tasks after 6pmHousehold tasks after 6pmHousehold tasks after 6pmHousehold tasks after 6pmHousehold tasks after 6pmHousehold tasks after 6pmHousehold tasks after 6pmHousehold tasks after 6pmHousehold tasks after 6pm
www.steadman-group.com
29
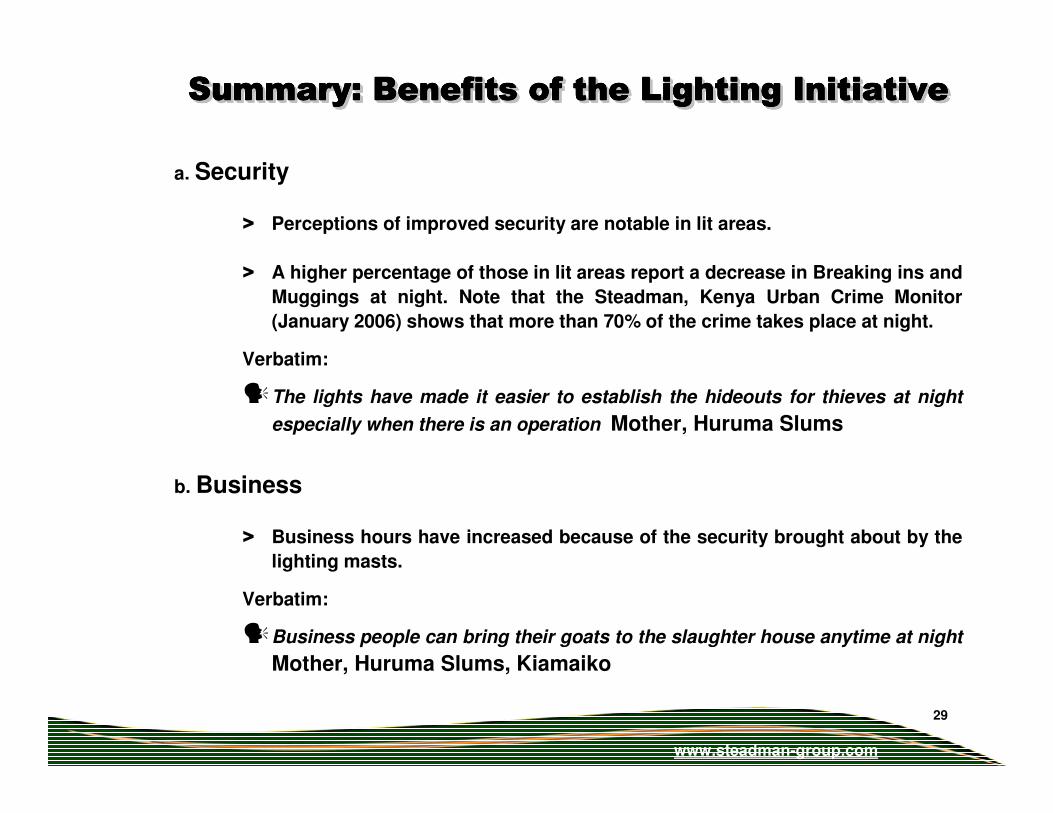
a. Security
> Perceptions of improved security are notable in lit areas.
> A higher percentage of those in lit areas report a decrease in Breaking ins and
Muggings at night. Note that the Steadman, Kenya Urban Crime Monitor
(January 2006) shows that more than 70% of the crime takes place at night.
Verbatim:
�The lights have made it easier to establish the hideouts for thieves at night
especially when there is an operation Mother, Huruma Slums
b. Business
> Business hours have increased because of the security brought about by the
lighting masts.
Verbatim:
�Business people can bring their goats to the slaughter house anytime at night
Mother, Huruma Slums, Kiamaiko
Summary: Benefits of the Lighting InitiativeSummary: Benefits of the Lighting InitiativeSummary: Benefits of the Lighting InitiativeSummary: Benefits of the Lighting InitiativeSummary: Benefits of the Lighting InitiativeSummary: Benefits of the Lighting InitiativeSummary: Benefits of the Lighting InitiativeSummary: Benefits of the Lighting InitiativeSummary: Benefits of the Lighting InitiativeSummary: Benefits of the Lighting InitiativeSummary: Benefits of the Lighting InitiativeSummary: Benefits of the Lighting Initiative
www.steadman-group.com
30
� In Before the lights were installed, many customers used to fall into the
sewers but now they can see clearly.
Business person, Huruma Slums
� The lights make our environment clean. This is because, before the lights
were put up, people used to excrete (Urinate & defecate) near the houses.
This has reduced because of the light, people fear being seen.
Business Person, Mathare Slums
� The lights make our area more developed because its only in our area
where shops open up to midnight as compared to ‘Riftvalley’ and St
Josephs.
Mother, Gichagi Village-- Kangemi slum
� The mast acts as a landmark since it easy to give directions of where one
is.
Mother- Huruma slums
� our area there is no proper sewerage and alongside the road is muddy.
VerbatimsVerbatimsVerbatimsVerbatimsVerbatimsVerbatimsVerbatimsVerbatimsVerbatimsVerbatimsVerbatimsVerbatims
www.steadman-group.com
31
3.3.3.3.Perceptions Perceptions Perceptions Perceptions
towards the towards the towards the towards the
lighting lighting lighting lighting
initiativeinitiativeinitiativeinitiative
3.3.3.3.Perceptions Perceptions Perceptions Perceptions
towards the towards the towards the towards the
lighting lighting lighting lighting
initiativeinitiativeinitiativeinitiative
www.steadman-group.com
32
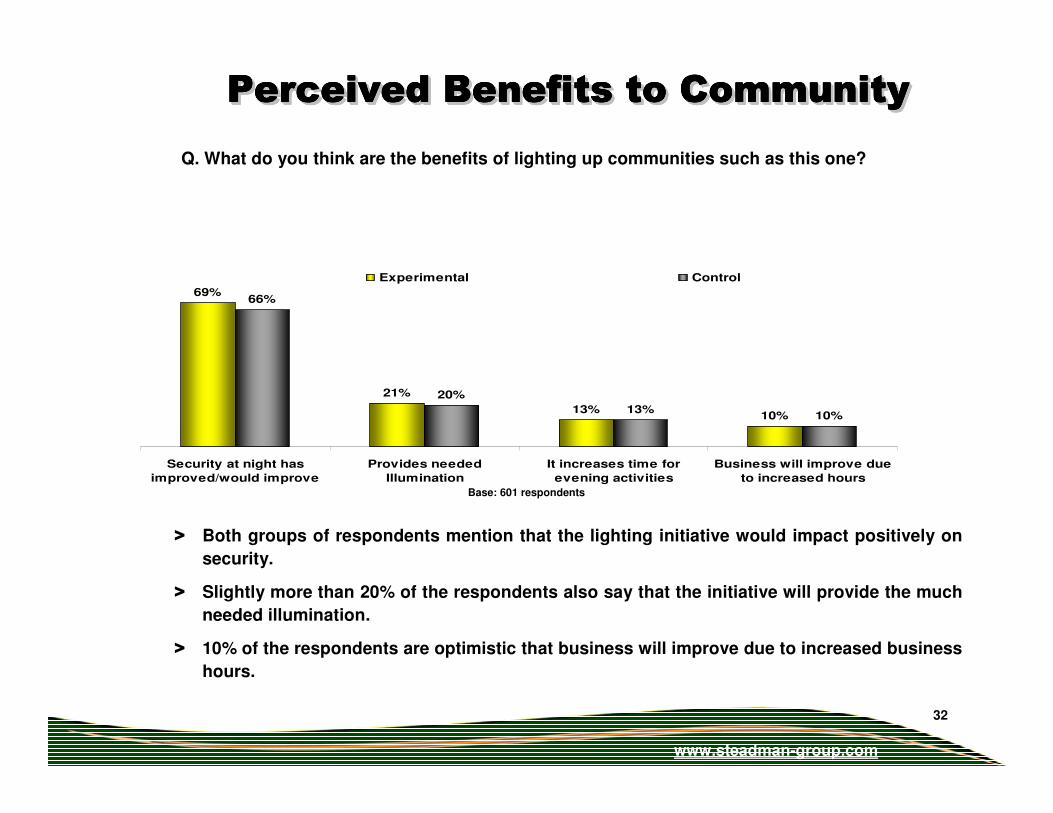
Q. What do you think are the benefits of lighting up communities such as this one?
69%
21%
13%10%
66%
20%
13%10%
Security at night has
improved/would improve
Provides needed
Illumination
It increases time for
evening activities
Business will improve due
to increased hours
Experimental Control
> Both groups of respondents mention that the lighting initiative would impact positively on
security.
> Slightly more than 20% of the respondents also say that the initiative will provide the much
needed illumination.
> 10% of the respondents are optimistic that business will improve due to increased business
hours.
Base: 601 respondents
Perceived Benefits to CommunityPerceived Benefits to CommunityPerceived Benefits to CommunityPerceived Benefits to CommunityPerceived Benefits to CommunityPerceived Benefits to CommunityPerceived Benefits to CommunityPerceived Benefits to CommunityPerceived Benefits to CommunityPerceived Benefits to CommunityPerceived Benefits to CommunityPerceived Benefits to Community
www.steadman-group.com
33
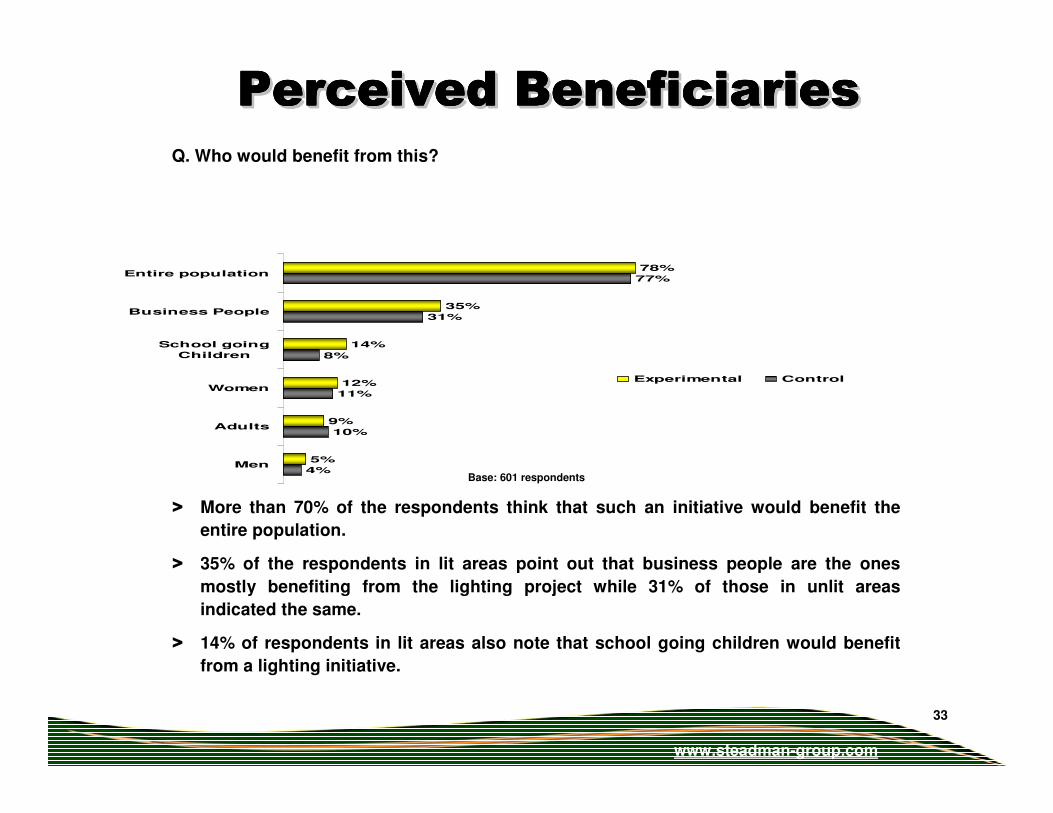
Q. Who would benefit from this?
78%
35%
14%
12%
9%
5%
77%
31%
8%
11%
10%
4%
Entire population
Business People
School going
Children
Women
Adults
Men
Experimental Control
> More than 70% of the respondents think that such an initiative would benefit the
entire population.
> 35% of the respondents in lit areas point out that business people are the ones
mostly benefiting from the lighting project while 31% of those in unlit areas
indicated the same.
> 14% of respondents in lit areas also note that school going children would benefit
from a lighting initiative.
Base: 601 respondents
Perceived BeneficiariesPerceived BeneficiariesPerceived BeneficiariesPerceived BeneficiariesPerceived BeneficiariesPerceived BeneficiariesPerceived BeneficiariesPerceived BeneficiariesPerceived BeneficiariesPerceived BeneficiariesPerceived BeneficiariesPerceived Beneficiaries
www.steadman-group.com
34
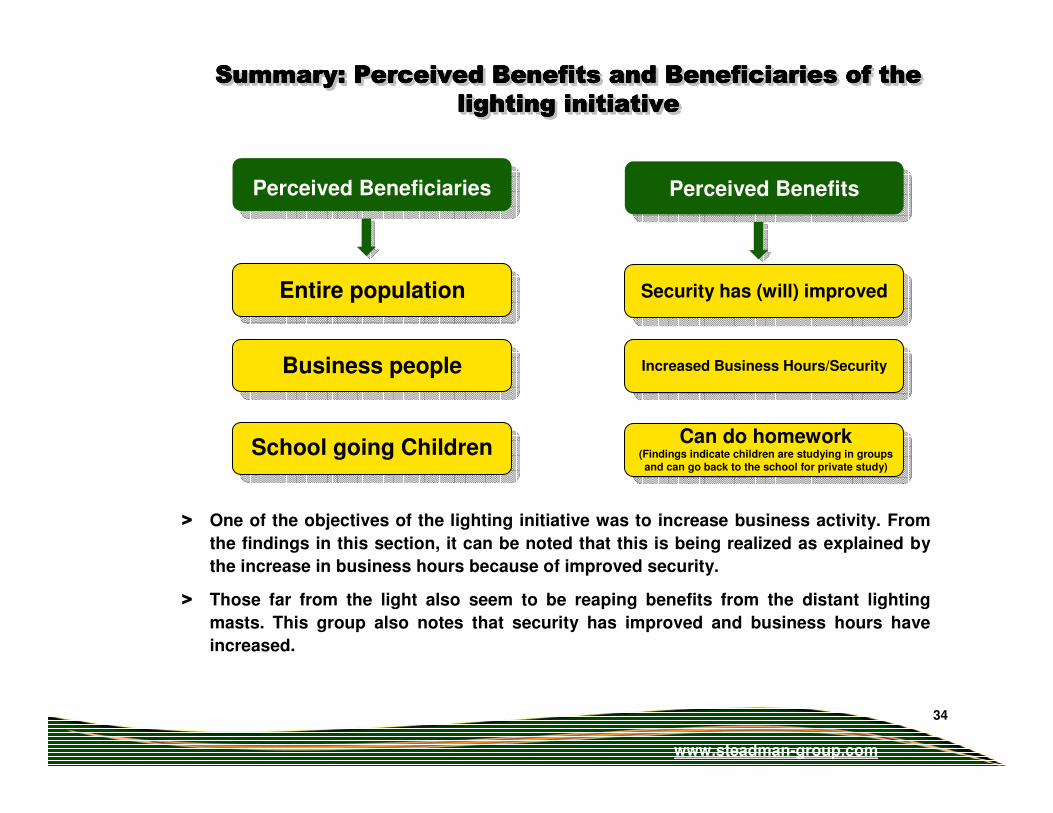
Business people
School going Children
Increased Business Hours/Security
Can do homework (Findings indicate children are studying in groups
and can go back to the school for private study)
> One of the objectives of the lighting initiative was to increase business activity. From
the findings in this section, it can be noted that this is being realized as explained by
the increase in business hours because of improved security.
> Those far from the light also seem to be reaping benefits from the distant lighting
masts. This group also notes that security has improved and business hours have
increased.
Perceived Beneficiaries
Summary: Perceived Benefits and Beneficiaries of the Summary: Perceived Benefits and Beneficiaries of the Summary: Perceived Benefits and Beneficiaries of the Summary: Perceived Benefits and Beneficiaries of the
lighting initiativelighting initiativelighting initiativelighting initiative
Summary: Perceived Benefits and Beneficiaries of the Summary: Perceived Benefits and Beneficiaries of the Summary: Perceived Benefits and Beneficiaries of the Summary: Perceived Benefits and Beneficiaries of the Summary: Perceived Benefits and Beneficiaries of the Summary: Perceived Benefits and Beneficiaries of the Summary: Perceived Benefits and Beneficiaries of the Summary: Perceived Benefits and Beneficiaries of the
lighting initiativelighting initiativelighting initiativelighting initiativelighting initiativelighting initiativelighting initiativelighting initiative
Entire population
Perceived Benefits
Security has (will) improved
www.steadman-group.com
35
4.4.4.4.Consumer Brand Consumer Brand Consumer Brand Consumer Brand
Awareness & Awareness & Awareness & Awareness &
UsageUsageUsageUsage
4.4.4.4.Consumer Brand Consumer Brand Consumer Brand Consumer Brand
Awareness & Awareness & Awareness & Awareness &
UsageUsageUsageUsage
www.steadman-group.com
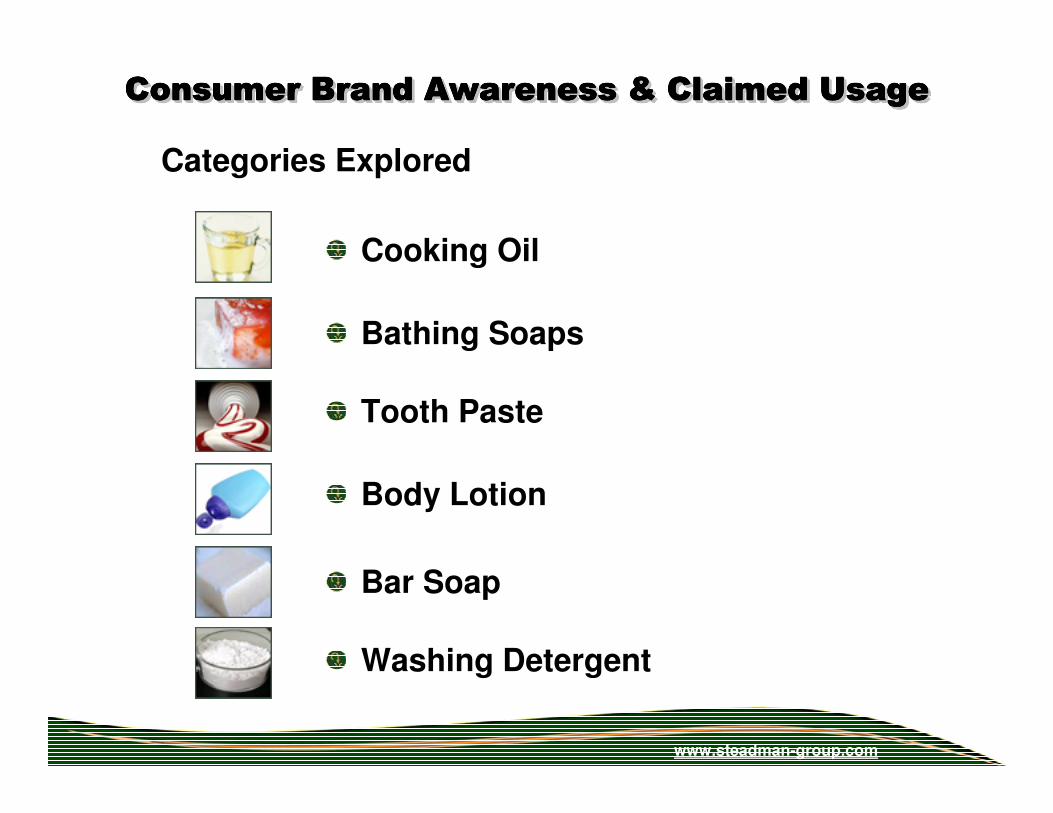
Categories Explored
Bar Soap
Bathing Soaps
Body Lotion
Cooking Oil
Tooth Paste
Washing Detergent
Consumer Brand Awareness & Claimed UsageConsumer Brand Awareness & Claimed UsageConsumer Brand Awareness & Claimed UsageConsumer Brand Awareness & Claimed UsageConsumer Brand Awareness & Claimed UsageConsumer Brand Awareness & Claimed UsageConsumer Brand Awareness & Claimed UsageConsumer Brand Awareness & Claimed UsageConsumer Brand Awareness & Claimed UsageConsumer Brand Awareness & Claimed UsageConsumer Brand Awareness & Claimed UsageConsumer Brand Awareness & Claimed Usage
www.steadman-group.com
37
This section aimed at establishing the awareness & product usage levels of different product categories among the target slum residents.
Adopt A light sought to determine the
product usage of slum dwellers that would be used to establish brand consciousness for strategic marketing.
Consumer Brand Awareness & Claimed UsageConsumer Brand Awareness & Claimed UsageConsumer Brand Awareness & Claimed UsageConsumer Brand Awareness & Claimed UsageConsumer Brand Awareness & Claimed UsageConsumer Brand Awareness & Claimed UsageConsumer Brand Awareness & Claimed UsageConsumer Brand Awareness & Claimed UsageConsumer Brand Awareness & Claimed UsageConsumer Brand Awareness & Claimed UsageConsumer Brand Awareness & Claimed UsageConsumer Brand Awareness & Claimed Usage
www.steadman-group.com
38
93% 92%
44%
38%
31% 30%25%
19%
8% 6%3% 1%
5%2%2%2%
37%
23%
4%9%
Kasuku Kimbo Chipsy Cow
boy
Joma Chipo Tilly Mallo Elianto Golden
fry
Awareness Claimed Usage
Brand Awareness & Claimed UsageBrand Awareness & Claimed UsageBrand Awareness & Claimed UsageBrand Awareness & Claimed UsageBrand Awareness & Claimed UsageBrand Awareness & Claimed UsageBrand Awareness & Claimed UsageBrand Awareness & Claimed UsageBrand Awareness & Claimed UsageBrand Awareness & Claimed UsageBrand Awareness & Claimed UsageBrand Awareness & Claimed Usage
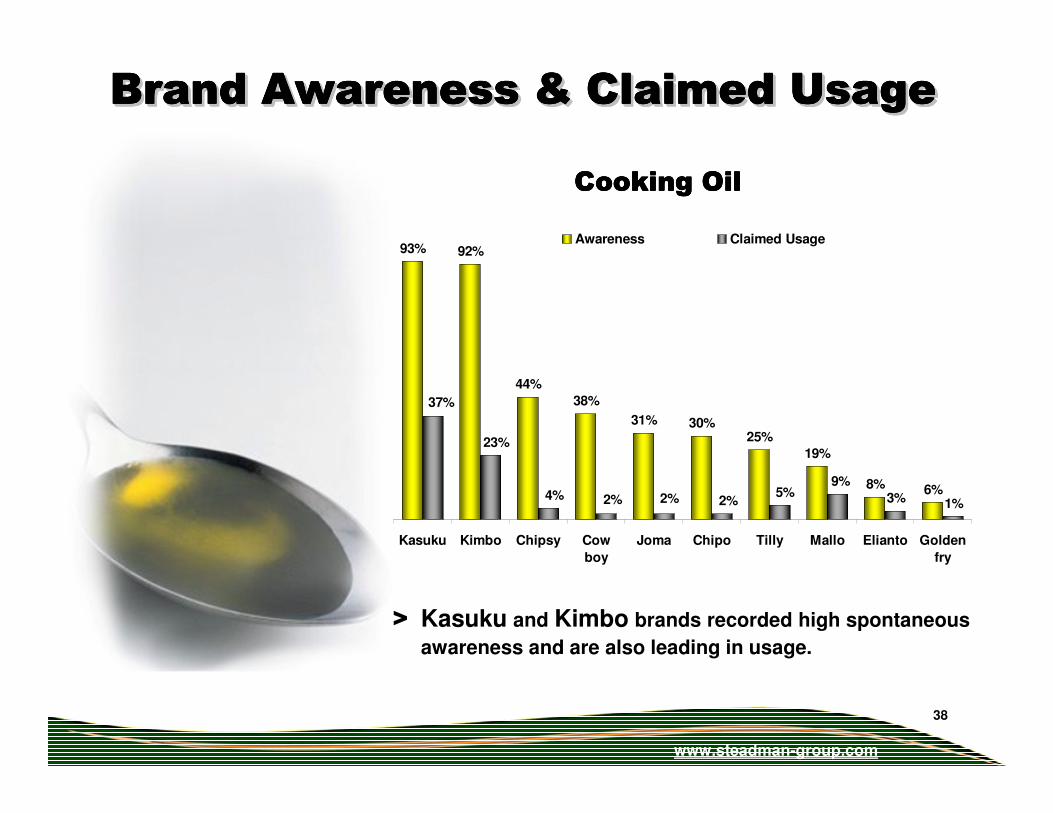
Cooking OilCooking OilCooking OilCooking Oil
> Kasuku and Kimbo brands recorded high spontaneous
awareness and are also leading in usage.
www.steadman-group.com
39
75%
66%
56%
39% 38% 38% 36%
12% 11% 11% 9% 8% 6%3%2%2%
9%
3%3%3%4%
10%13%
28%
Gei
sha
Cus
sons
IL
Ush
indi
Sun
light
Life b
ouy
Rex
ona
Lux
Jam
aa
Muar
ubaini
Det
tol
Pro
tex
Panga
Awareness Claimed Usage
Brand Awareness & Claimed UsageBrand Awareness & Claimed UsageBrand Awareness & Claimed UsageBrand Awareness & Claimed UsageBrand Awareness & Claimed UsageBrand Awareness & Claimed UsageBrand Awareness & Claimed UsageBrand Awareness & Claimed UsageBrand Awareness & Claimed UsageBrand Awareness & Claimed UsageBrand Awareness & Claimed UsageBrand Awareness & Claimed Usage
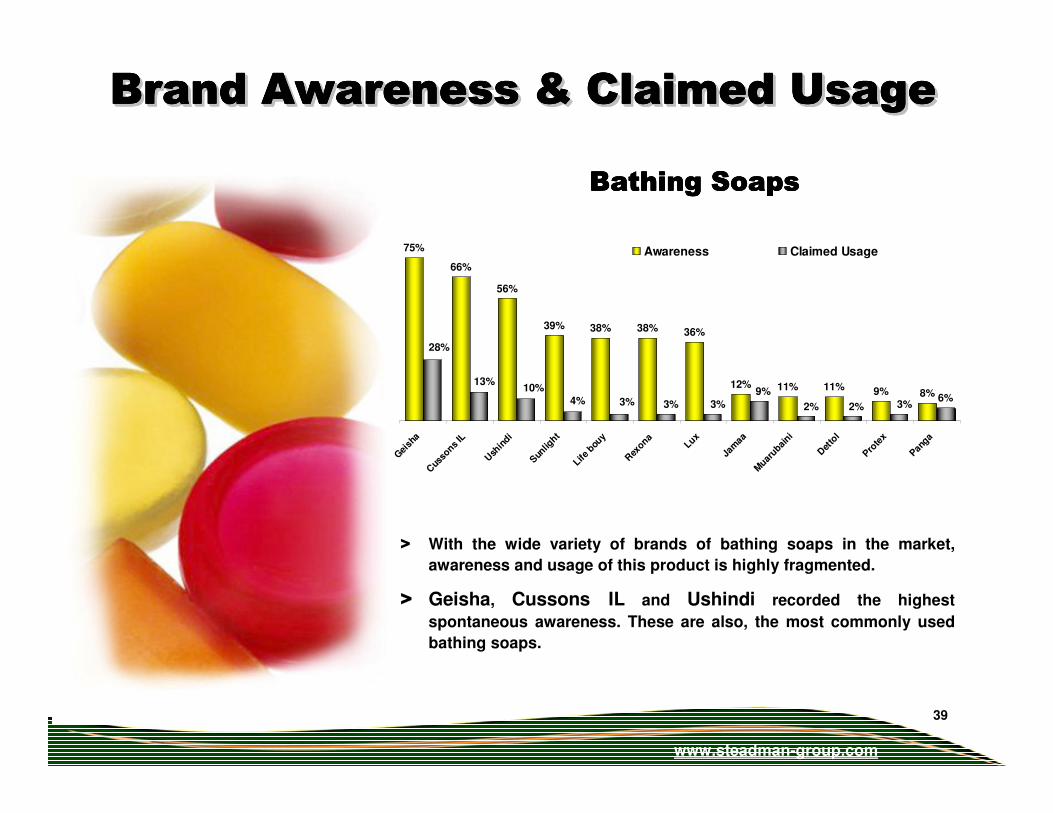
Bathing SoapsBathing SoapsBathing SoapsBathing Soaps
> With the wide variety of brands of bathing soaps in the market,
awareness and usage of this product is highly fragmented.
> Geisha, Cussons IL and Ushindi recorded the highest
spontaneous awareness. These are also, the most commonly used
bathing soaps.
www.steadman-group.com
40
96%
83%77%
22%
46%
22% 21%
4%
Colgate Close up Aquafresh White dent
Awareness Claimed Usage
Brand Awareness & Claimed UsageBrand Awareness & Claimed UsageBrand Awareness & Claimed UsageBrand Awareness & Claimed UsageBrand Awareness & Claimed UsageBrand Awareness & Claimed UsageBrand Awareness & Claimed UsageBrand Awareness & Claimed UsageBrand Awareness & Claimed UsageBrand Awareness & Claimed UsageBrand Awareness & Claimed UsageBrand Awareness & Claimed Usage
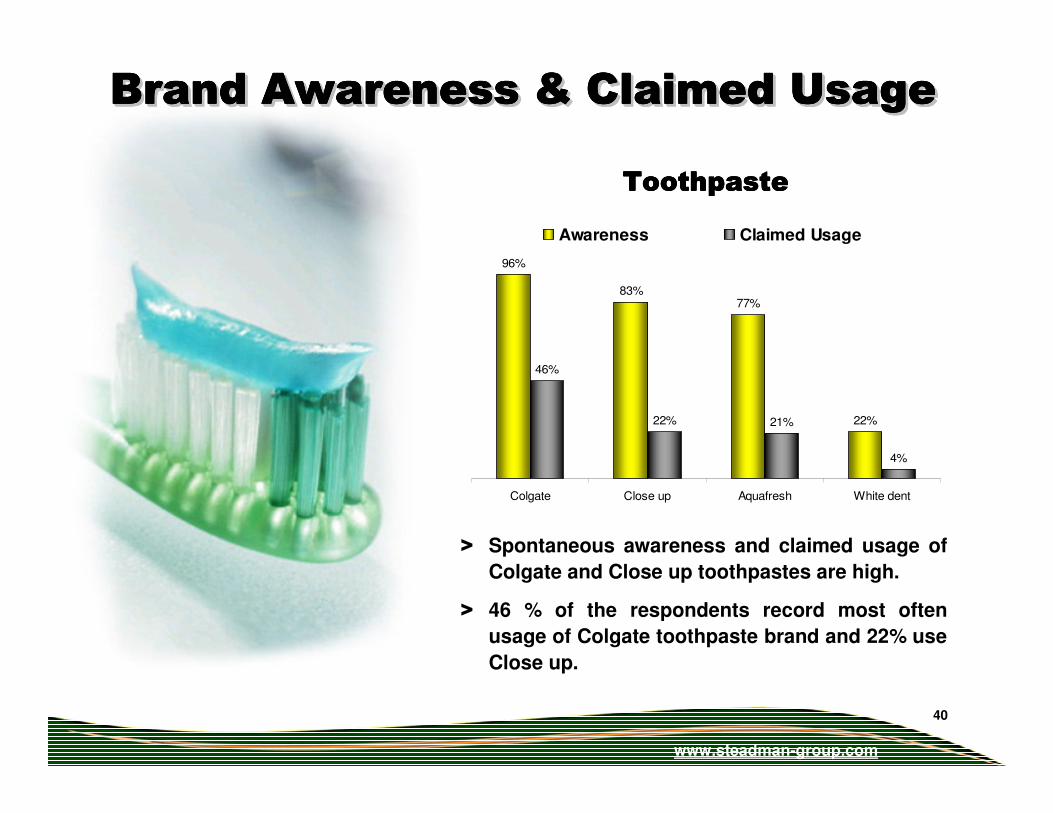
ToothpasteToothpasteToothpasteToothpaste
> Spontaneous awareness and claimed usage of
Colgate and Close up toothpastes are high.
> 46 % of the respondents record most often
usage of Colgate toothpaste brand and 22% use
Close up.
www.steadman-group.com
41
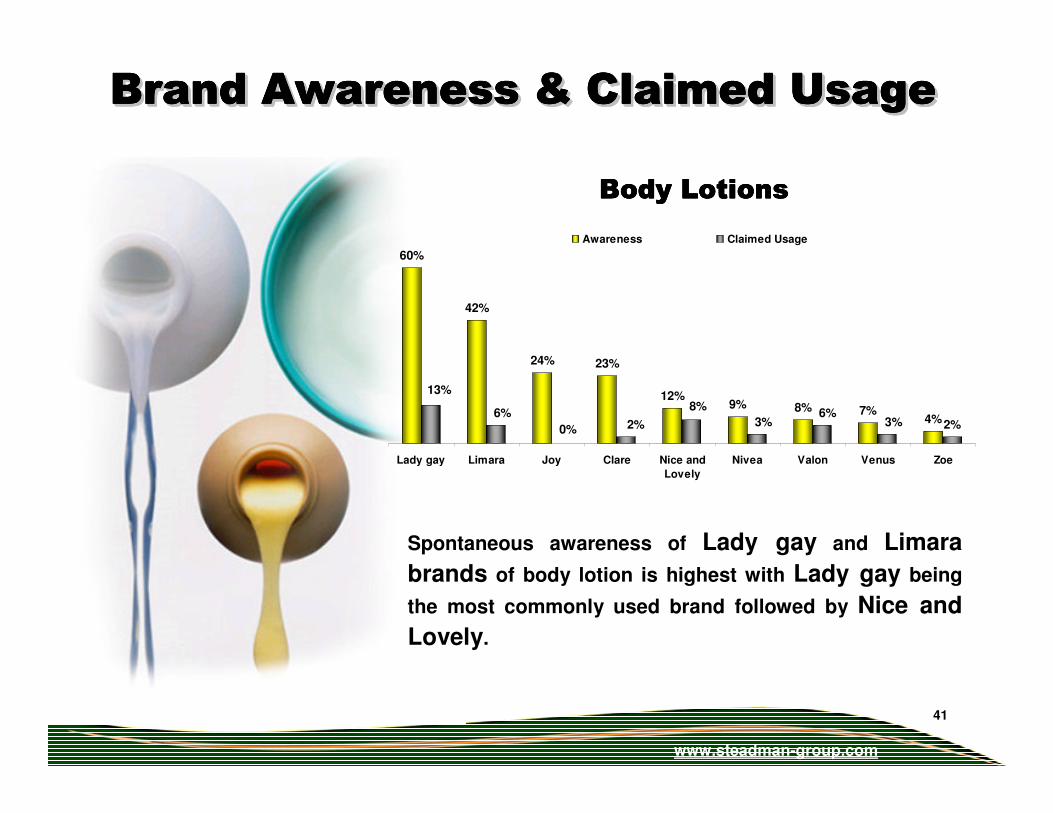
60%
42%
24% 23%
12%9% 8% 7%
4%2%3%6%
3%
8%
2%0%
6%
13%
Lady gay Limara Joy Clare Nice and
Lovely
Nivea Valon Venus Zoe
Awareness Claimed Usage
Brand Awareness & Claimed UsageBrand Awareness & Claimed UsageBrand Awareness & Claimed UsageBrand Awareness & Claimed UsageBrand Awareness & Claimed UsageBrand Awareness & Claimed UsageBrand Awareness & Claimed UsageBrand Awareness & Claimed UsageBrand Awareness & Claimed UsageBrand Awareness & Claimed UsageBrand Awareness & Claimed UsageBrand Awareness & Claimed Usage
Body LotionsBody LotionsBody LotionsBody Lotions
Spontaneous awareness of Lady gay and Limara
brands of body lotion is highest with Lady gay being
the most commonly used brand followed by Nice and
Lovely.
www.steadman-group.com
42
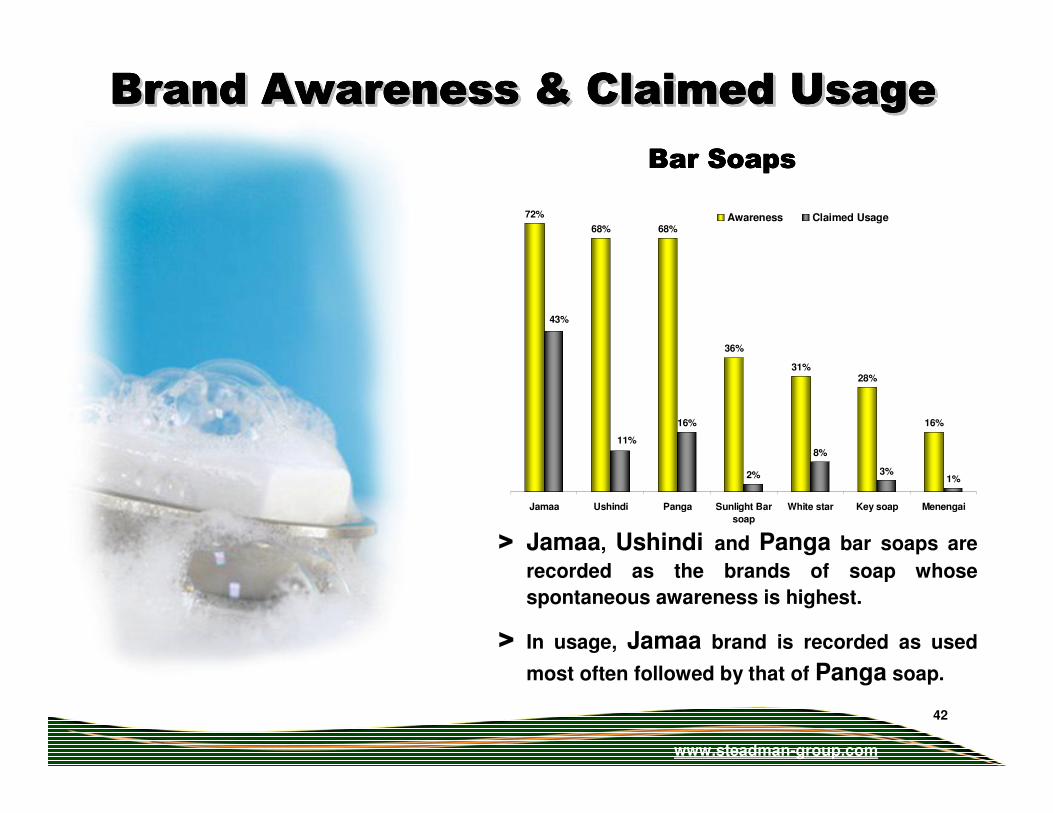
72%
68% 68%
36%
31%28%
16%16%
2%
8%
3%1%
11%
43%
Jamaa Ushindi Panga Sunlight Bar
soap
White star Key soap Menengai
Awareness Claimed Usage
Brand Awareness & Claimed UsageBrand Awareness & Claimed UsageBrand Awareness & Claimed UsageBrand Awareness & Claimed UsageBrand Awareness & Claimed UsageBrand Awareness & Claimed UsageBrand Awareness & Claimed UsageBrand Awareness & Claimed UsageBrand Awareness & Claimed UsageBrand Awareness & Claimed UsageBrand Awareness & Claimed UsageBrand Awareness & Claimed Usage
Bar SoapsBar SoapsBar SoapsBar Soaps
> Jamaa, Ushindi and Panga bar soaps are
recorded as the brands of soap whose
spontaneous awareness is highest.
> In usage, Jamaa brand is recorded as used
most often followed by that of Panga soap.
www.steadman-group.com
43
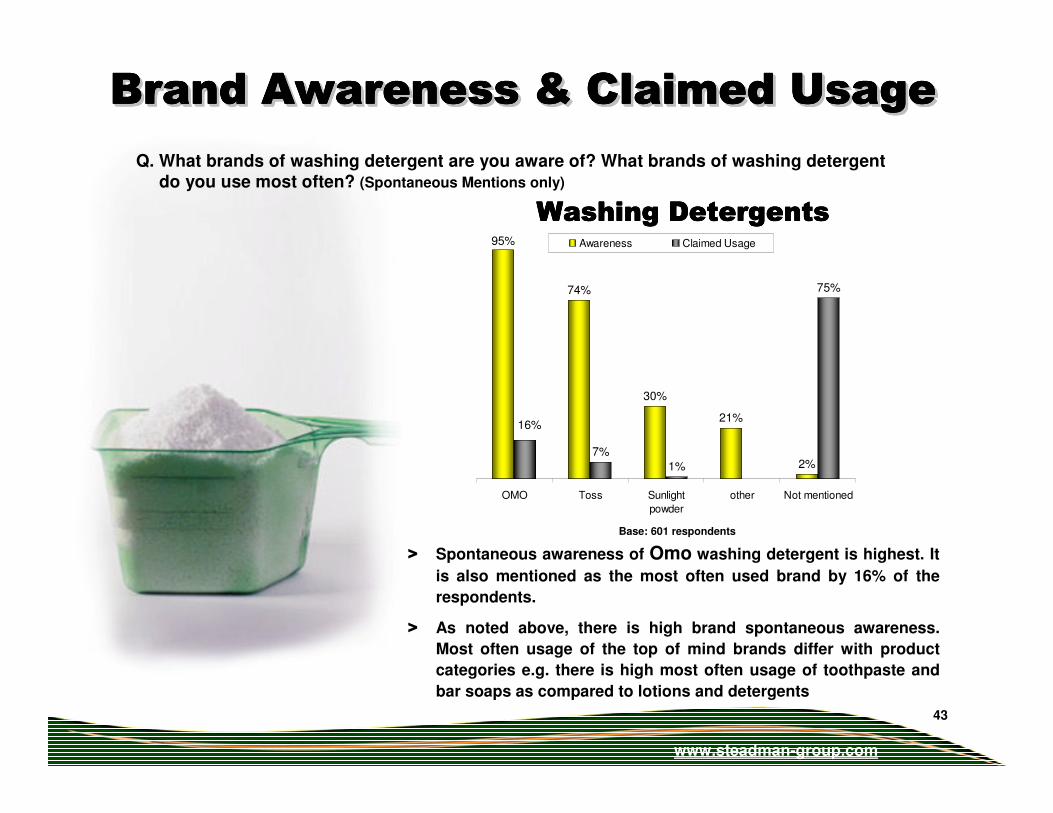
Base: 601 respondents
Q. What brands of washing detergent are you aware of? What brands of washing detergent do you use most often? (Spontaneous Mentions only)
74%
30%
21%
2%7%
1%
75%
95%
16%
OMO Toss Sunlight
powder
other Not mentioned
Awareness Claimed Usage
Brand Awareness & Claimed UsageBrand Awareness & Claimed UsageBrand Awareness & Claimed UsageBrand Awareness & Claimed UsageBrand Awareness & Claimed UsageBrand Awareness & Claimed UsageBrand Awareness & Claimed UsageBrand Awareness & Claimed UsageBrand Awareness & Claimed UsageBrand Awareness & Claimed UsageBrand Awareness & Claimed UsageBrand Awareness & Claimed Usage
Washing DetergentsWashing DetergentsWashing DetergentsWashing Detergents
> Spontaneous awareness of Omo washing detergent is highest. It
is also mentioned as the most often used brand by 16% of the
respondents.
> As noted above, there is high brand spontaneous awareness.
Most often usage of the top of mind brands differ with product
categories e.g. there is high most often usage of toothpaste and
bar soaps as compared to lotions and detergents
www.steadman-group.com
44
As noted above, there is high brand spontaneous awareness.
Most often usage of the top of mind brands differs with product categories e.g. there is high most often usage of toothpaste and bar soaps as compared to lotions and detergents.
Spontaneous awareness and claimed usage of the
following products is high:> Cooking Oil -- Kasuku and Kimbo
> Bathing soap -- Geisha Cussons Imperial Leather
> Toothpaste -- Colgate and Close up
> Body Lotion -- Lady Gay and Limara
> Bar soaps -- Jamaa and Ushindi
Summary: Consumer Brand AwarenessSummary: Consumer Brand AwarenessSummary: Consumer Brand AwarenessSummary: Consumer Brand AwarenessSummary: Consumer Brand AwarenessSummary: Consumer Brand AwarenessSummary: Consumer Brand AwarenessSummary: Consumer Brand AwarenessSummary: Consumer Brand AwarenessSummary: Consumer Brand AwarenessSummary: Consumer Brand AwarenessSummary: Consumer Brand Awareness
www.steadman-group.com
45
5.5.5.5.Bank UsageBank UsageBank UsageBank Usage5.5.5.5.Bank UsageBank UsageBank UsageBank Usage
www.steadman-group.com
46
Yes
35%
No
65%
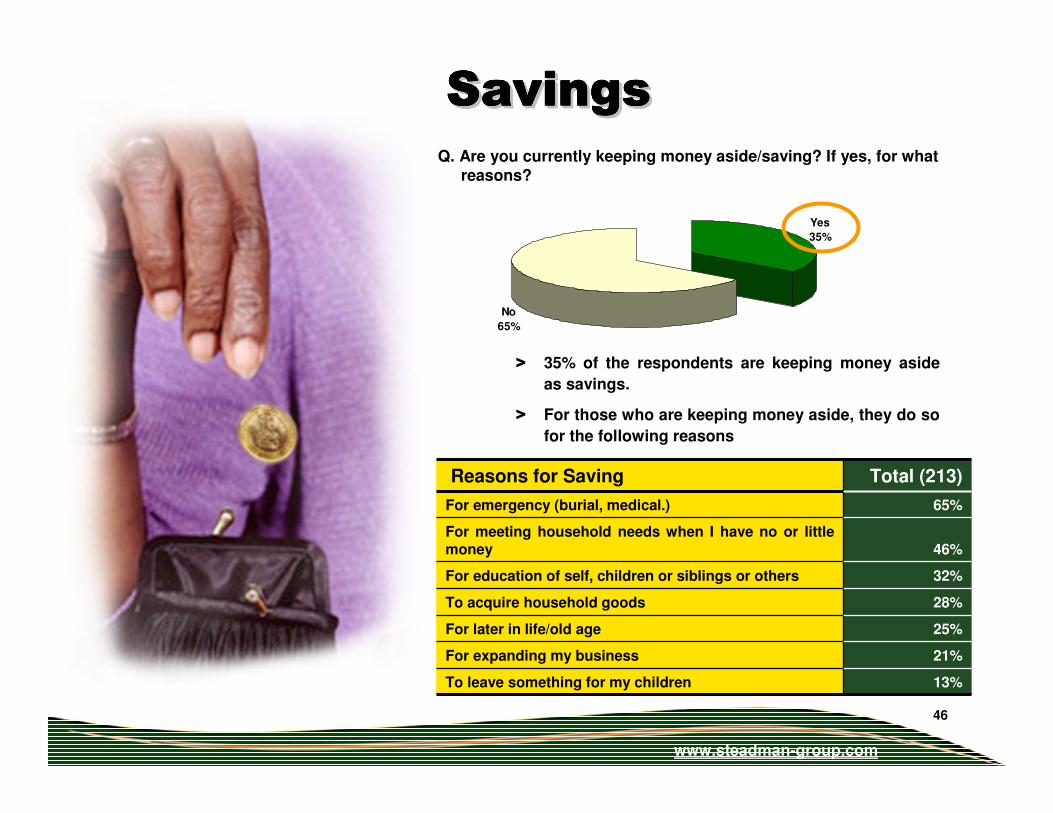
Q. Are you currently keeping money aside/saving? If yes, for what reasons?
> 35% of the respondents are keeping money aside
as savings.
> For those who are keeping money aside, they do so
for the following reasons
13%To leave something for my children
21%For expanding my business
25%For later in life/old age
28%To acquire household goods
32%For education of self, children or siblings or others
46%
For meeting household needs when I have no or little
money
65%For emergency (burial, medical.)
Total (213)Reasons for Saving
SavingsSavingsSavingsSavingsSavingsSavingsSavingsSavingsSavingsSavingsSavingsSavings
www.steadman-group.com
47
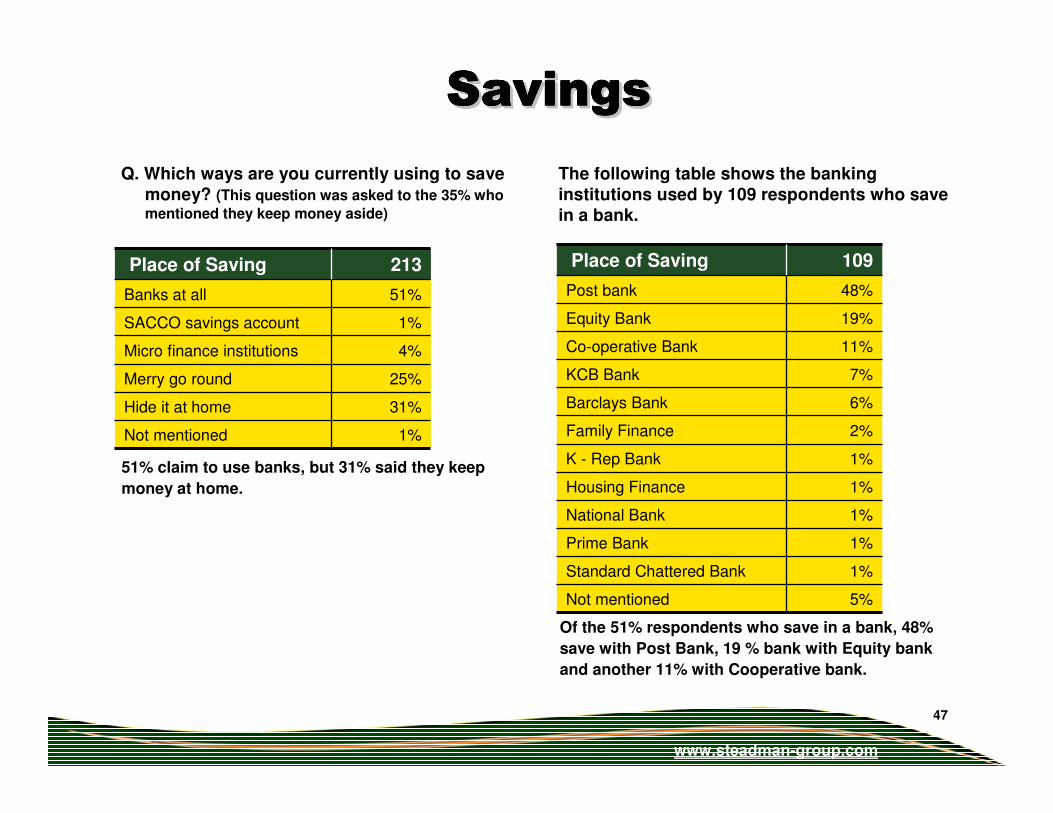
1%
31%
25%
4%
1%
51%
213
Not mentioned
Hide it at home
Merry go round
Micro finance institutions
SACCO savings account
Banks at all
Place of Saving
Q. Which ways are you currently using to save money? (This question was asked to the 35% who
mentioned they keep money aside)
51% claim to use banks, but 31% said they keep
money at home.
5%
1%
1%
1%
1%
1%
2%
6%
7%
11%
19%
48%
109
Not mentioned
Standard Chattered Bank
Prime Bank
National Bank
Housing Finance
K - Rep Bank
Family Finance
Barclays Bank
KCB Bank
Co-operative Bank
Equity Bank
Post bank
Place of Saving
The following table shows the banking institutions used by 109 respondents who save in a bank.
SavingsSavingsSavingsSavingsSavingsSavingsSavingsSavingsSavingsSavingsSavingsSavings
Of the 51% respondents who save in a bank, 48%
save with Post Bank, 19 % bank with Equity bank
and another 11% with Cooperative bank.
www.steadman-group.com
48
35% of the respondents are saving for purposes of emergencies such as burials and medical expenses and for household needs.
Of these respondents, 31% keep savings at home but nearly half claim to use banking institutions to save their money.
Summary: Bank UsageSummary: Bank UsageSummary: Bank UsageSummary: Bank UsageSummary: Bank UsageSummary: Bank UsageSummary: Bank UsageSummary: Bank UsageSummary: Bank UsageSummary: Bank UsageSummary: Bank UsageSummary: Bank Usage
www.steadman-group.com
49
6.6.6.6. Economic optimism Economic optimism Economic optimism Economic optimism
and Perceptions and Perceptions and Perceptions and Perceptions
towards the richtowards the richtowards the richtowards the rich
6.6.6.6. Economic optimism Economic optimism Economic optimism Economic optimism
and Perceptions and Perceptions and Perceptions and Perceptions
towards the richtowards the richtowards the richtowards the rich
www.steadman-group.com
50
Better
28%
Worse
49%
Same
15%
Don't
Know
8%
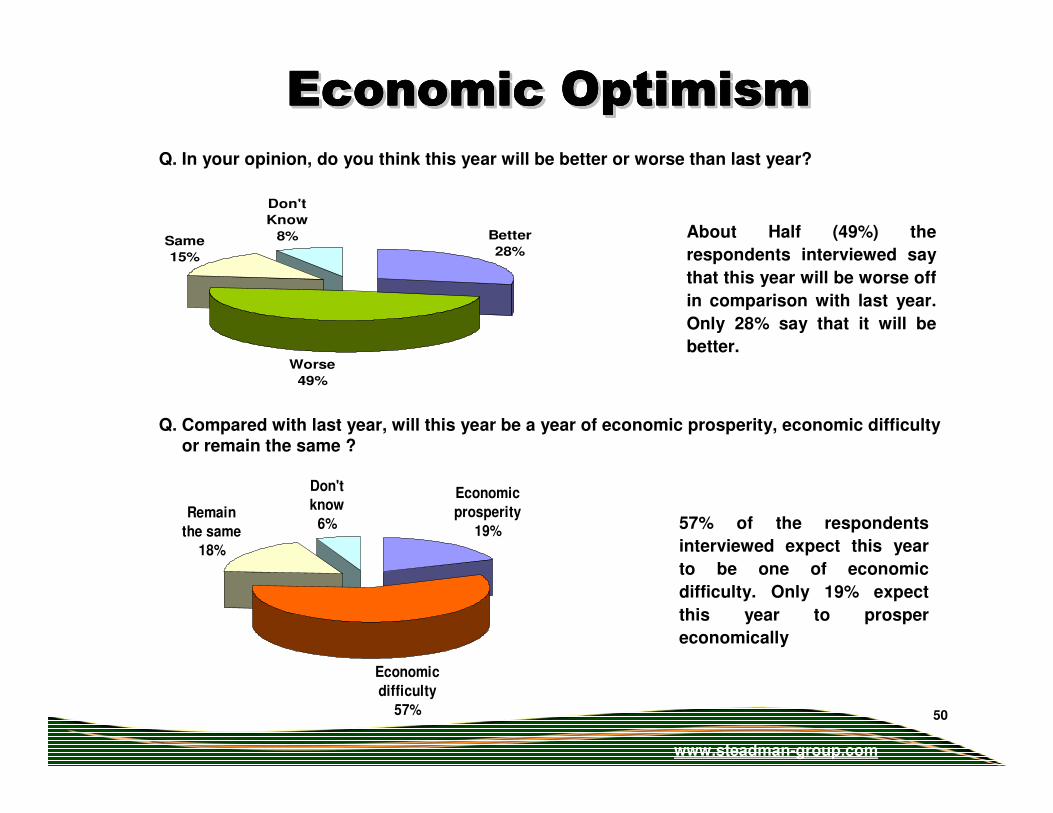
Q. In your opinion, do you think this year will be better or worse than last year?
Q. Compared with last year, will this year be a year of economic prosperity, economic difficulty or remain the same ?
Economic
prosperity
19%
Economic
difficulty
57%
Remain
the same
18%
Don't
know
6%
Economic OptimismEconomic OptimismEconomic OptimismEconomic OptimismEconomic OptimismEconomic OptimismEconomic OptimismEconomic OptimismEconomic OptimismEconomic OptimismEconomic OptimismEconomic Optimism
About Half (49%) the
respondents interviewed say
that this year will be worse off
in comparison with last year.
Only 28% say that it will be
better.
57% of the respondents
interviewed expect this year
to be one of economic
difficulty. Only 19% expect
this year to prosper
economically
www.steadman-group.com
51
Increase
71%
Decrease
15%
Remain the
same
10%
Don't know
4%
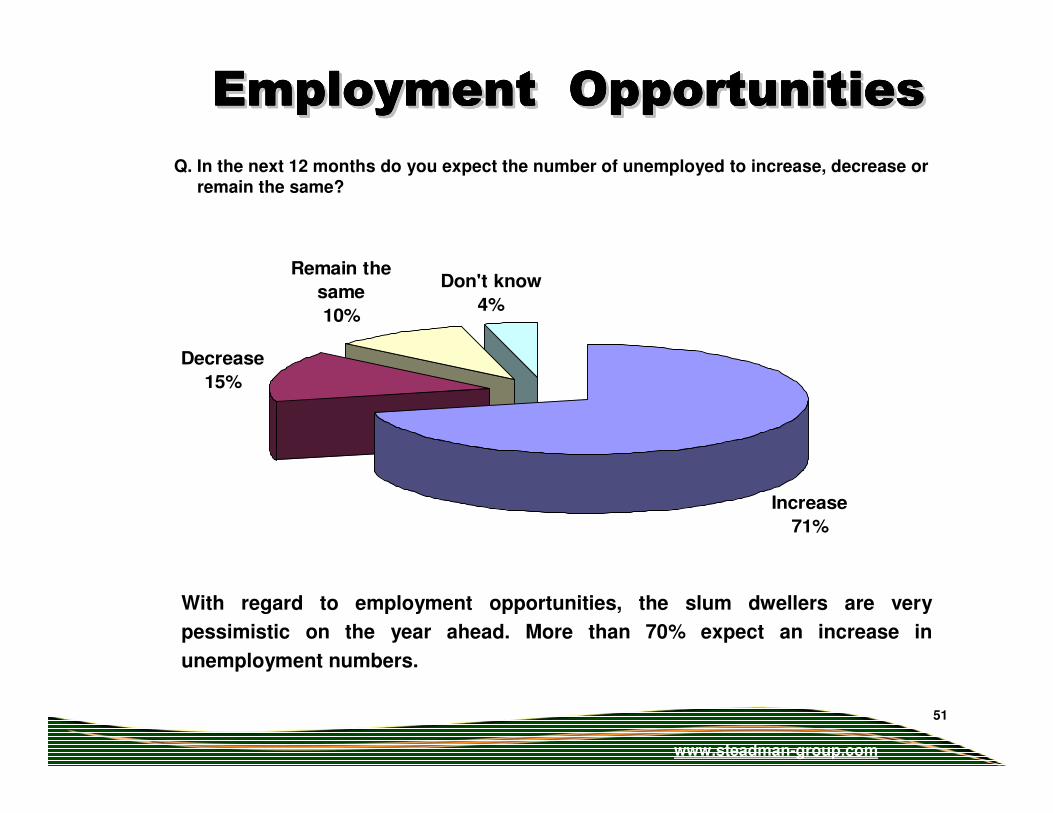
Q. In the next 12 months do you expect the number of unemployed to increase, decrease or remain the same?
Employment OpportunitiesEmployment OpportunitiesEmployment OpportunitiesEmployment OpportunitiesEmployment OpportunitiesEmployment OpportunitiesEmployment OpportunitiesEmployment OpportunitiesEmployment OpportunitiesEmployment OpportunitiesEmployment OpportunitiesEmployment Opportunities
With regard to employment opportunities, the slum dwellers are very
pessimistic on the year ahead. More than 70% expect an increase in
unemployment numbers.
www.steadman-group.com
52
94%
91%
90%
90%
45%
48%
89%
55%
51%
11%
9%
6%
10%
9%
Rich people use poor people to advance
themselves
Rich people in Nairobi are least concerned about
people living in poor areas
Through hard work I can be able to achieve
financial success
Rich people will only help poor people when they
are campaigning for a political position
People in poor areas can also be leaders
Rich people help poor people to be noticed
Wealthy people got their wealth through hard
work
Agree Disagree
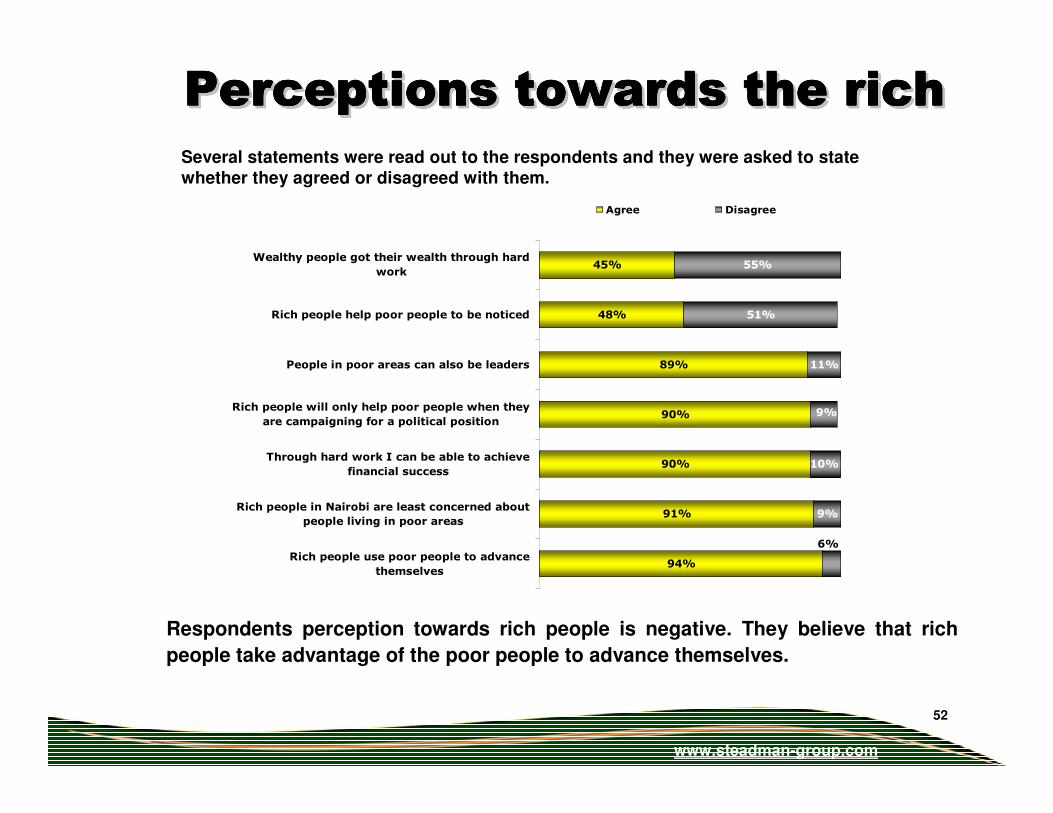
Several statements were read out to the respondents and they were asked to state whether they agreed or disagreed with them.
Respondents perception towards rich people is negative. They believe that rich
people take advantage of the poor people to advance themselves.
Perceptions towards the rich Perceptions towards the rich Perceptions towards the rich Perceptions towards the rich Perceptions towards the rich Perceptions towards the rich Perceptions towards the rich Perceptions towards the rich Perceptions towards the rich Perceptions towards the rich Perceptions towards the rich Perceptions towards the rich
www.steadman-group.com
53
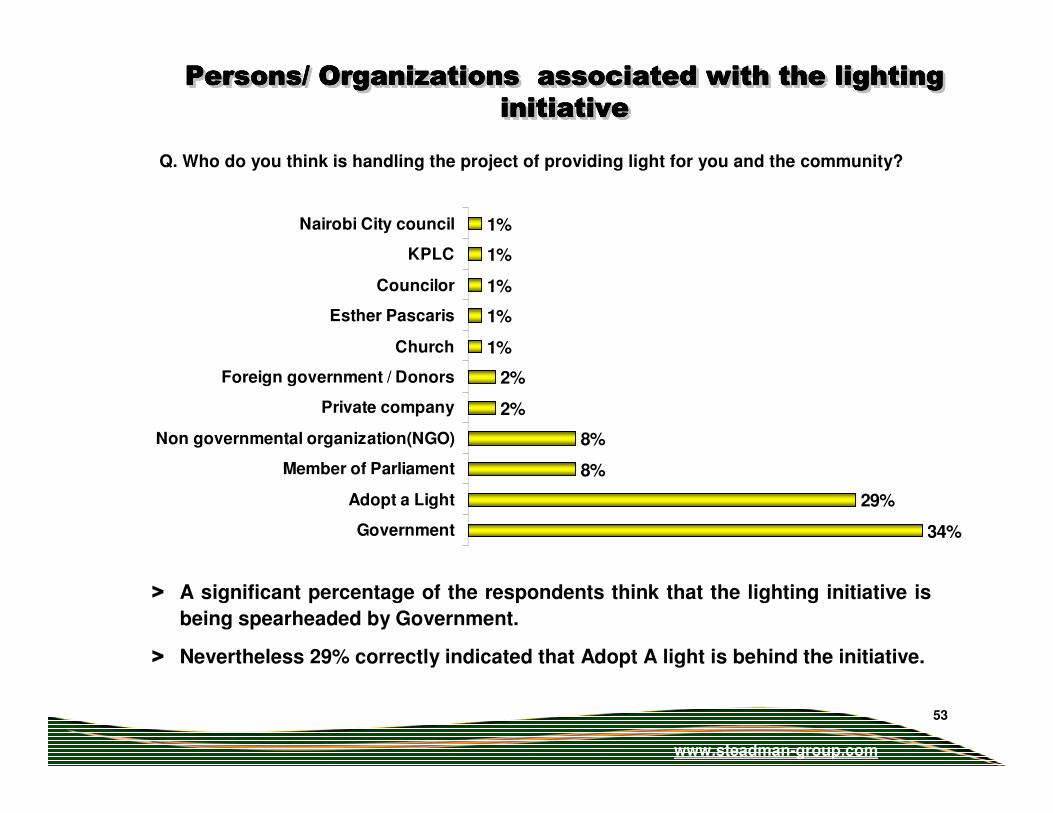
> A significant percentage of the respondents think that the lighting initiative is
being spearheaded by Government.
> Nevertheless 29% correctly indicated that Adopt A light is behind the initiative.
Q. Who do you think is handling the project of providing light for you and the community?
34%
29%
8%
8%
2%
2%
1%
1%
1%
1%
1%
Government
Adopt a Light
Member of Parliament
Non governmental organization(NGO)
Private company
Foreign government / Donors
Church
Esther Pascaris
Councilor
KPLC
Nairobi City council
Persons/ Organizations associated with the lighting Persons/ Organizations associated with the lighting Persons/ Organizations associated with the lighting Persons/ Organizations associated with the lighting
initiative initiative initiative initiative
Persons/ Organizations associated with the lighting Persons/ Organizations associated with the lighting Persons/ Organizations associated with the lighting Persons/ Organizations associated with the lighting Persons/ Organizations associated with the lighting Persons/ Organizations associated with the lighting Persons/ Organizations associated with the lighting Persons/ Organizations associated with the lighting
initiative initiative initiative initiative initiative initiative initiative initiative
www.steadman-group.com
54
A majority of the respondents are pessimistic about the economic and employment conditions this year.
Nevertheless, the respondents believe in hard work to achieve financial successes.
Respondents perception towards rich people is however negative. They believe that rich people take advantage of the poor people to advance themselves.
The lighting initiative is believed to be a government project by a majority. However, Adopt A light is also well known.
Summary: Economic & Employment AssessmentSummary: Economic & Employment AssessmentSummary: Economic & Employment AssessmentSummary: Economic & Employment AssessmentSummary: Economic & Employment AssessmentSummary: Economic & Employment AssessmentSummary: Economic & Employment AssessmentSummary: Economic & Employment AssessmentSummary: Economic & Employment AssessmentSummary: Economic & Employment AssessmentSummary: Economic & Employment AssessmentSummary: Economic & Employment Assessment
www.steadman-group.com
55
Nearly 30% mentioned security as a basic need and those living within the
unlit areas rated the need for security higher than those in lit areas.
There is notable higher incidence of neighborhood personal criminal
activity experience in the unlit areas compared to lit areas.
Both groups of respondents mention that the lighting initiative would
impact positively on security.
41% of those in lit areas said that shops are now opening earlier in the
morning and closing late while only 26% said so for those in unlit areas. Of
those who said that business hours had changed, 20% directly attributed
the change to the high mast lighting.
There is household disposable income in these areas for the purchase of
household commodities and brands.
Brand awareness is high for the product groups measured. Claimed usage
is also significant.
A majority of the respondents are pessimistic about the economic and
employment conditions this year.
ConclusionsConclusionsConclusionsConclusionsConclusionsConclusionsConclusionsConclusionsConclusionsConclusionsConclusionsConclusions
www.steadman-group.com
56
African Population and Health Research Center (APHRC)
(2002). Population and Health Dynamics in Nairobi's
Informal Settlements. Nairobi: African and population and
Health Research Center.
The Steadman Group (2006), Kenya Urban Crime Monitor.
Nairobi: The Steadman Group
ReferencesReferencesReferencesReferencesReferencesReferencesReferencesReferencesReferencesReferencesReferencesReferences
www.steadman-group.com
57
Thank YouThank YouThank YouThank YouThank YouThank YouThank YouThank You
www.steadman-group.com