Embed Size (px)
Citation preview
(iv 7
FOREST VALUATION THEORIES AND APPUCATIONS
LECTURE NOTES, STUDY OBJECTIVES AND EXERCISES
prepared for
M.Sc. Forestry Classes
PAKISTAN FOREST INSTITUTE
Peshawar
by
Charles W. McKetta, Ph.D. Forest Economist
December 1992

PAKISTAN FOREST INSTITUTE LECTURES:
FOREST VALUATION THEORIES AND APPLICATIONS
by Charles W. McKetta, Ph.D. Forest Economist
Winrock International
Instructor's Preamble:
in consultationthis forest valuation lecture module
I wrote M. Zarif to complement his existing syllabus
with Professor Raja which already contained the mechanics
of residual value appraisal
of project analysis. In mymathematicsand the cost-benefit
lectures I presume that all PFI students have taken basic economics
with the graphicaland are conversantin the M.Sc.-I semester analysis of competitive markets and the production
theory of the
The following relies heavily on that basic understanding.
firm.
This short segment is only a portion of the natural resource
valuation preparation for a Pakistani natural resource management
as trusteesinto a responsibilityThey graduateprofessional. Valuationassets.resource managing extremely valuable natural
skills will be essential to them in resource appraisal, but more
importantly, valuation theory forms the basis for all the primary
financial and economic criteria for natural resource allocation,
exploitation, investment and conservation decisions.
My lecture series and the preparation of these lecture notes
and outlines was supported by the Forestry Planning and Development
Agency for Internationalby the United States
Project, funded Anyto Winrock International.a contractDevelopment through errors or omissions are my own.
PAKISTAN FOREST INSTITUTE LECTURES:
FOREST VALUATION THEORIES AND APPLICATIONS
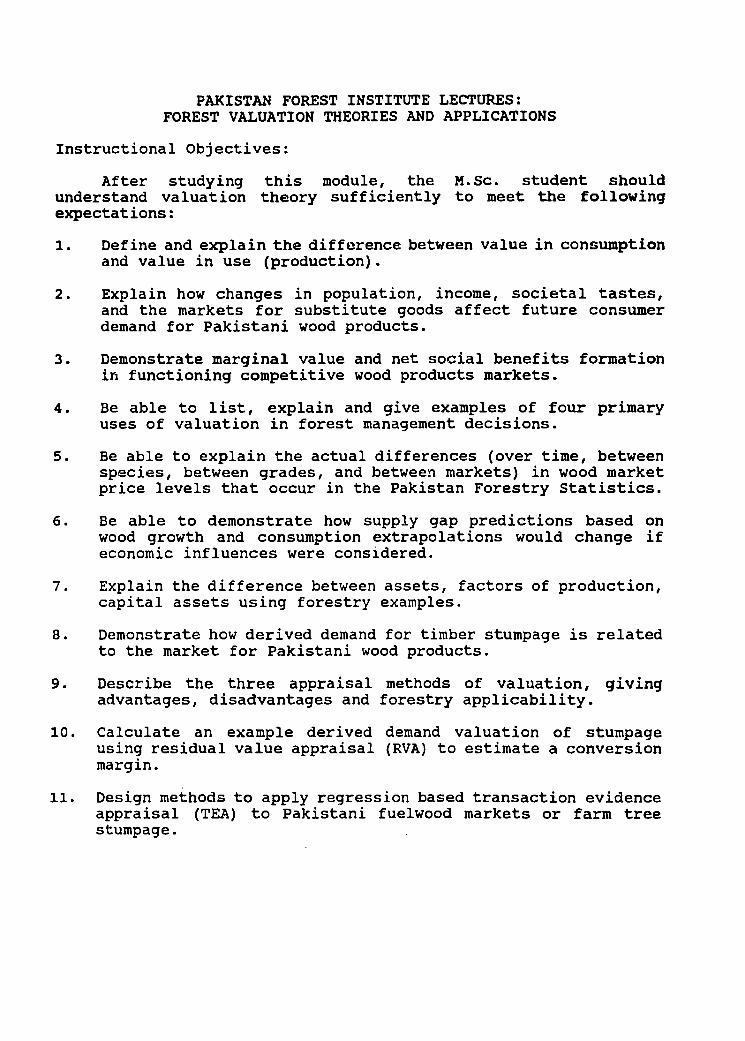
Instructional Objectives:
After studying this module, the M.Sc. student should understand valuation theory sufficiently to meet the following expectations:
1. Define and explain the difference between value in consumption and value in use (production).
2. Explain how changes in population, income, societal tastes, and the markets f or substitute goods affect future consumer demand for Pakistani wood products.
3. Demonstrate marginal value and net social benefits formation in functioning competitive wood products markets.
4. Be able to list, explain and give examples of four primary uses of valuation in forest management decisions.
5. Be able to explain the actual differences (over time, between species, between grades, and between markets) in wood market price levels that occur in the Pakistan Forestry Statistics.
6. Be able to demonstrate how supply gap predictions based on wood growth and consumption extrapolations would change if economic influences were considered.
7. Explain the difference between assets, factors of production, capital assets using forestry examples.
8. Demonstrate how derived demand for timber stumpage is related to the market for Pakistani wood products.
9. Describe the three appraisal methods of valuation, giving advantages, disadvantages and forestry applicability.
10. Calculate an example derived demand valuation of stumpage using residual value appraisal (RVA) to estimate a conversion margin.
11. Design methods to apply regression based transaction evidence appraisal (TEA) to Pakistani fuelwood markets or farm tree stumpage.
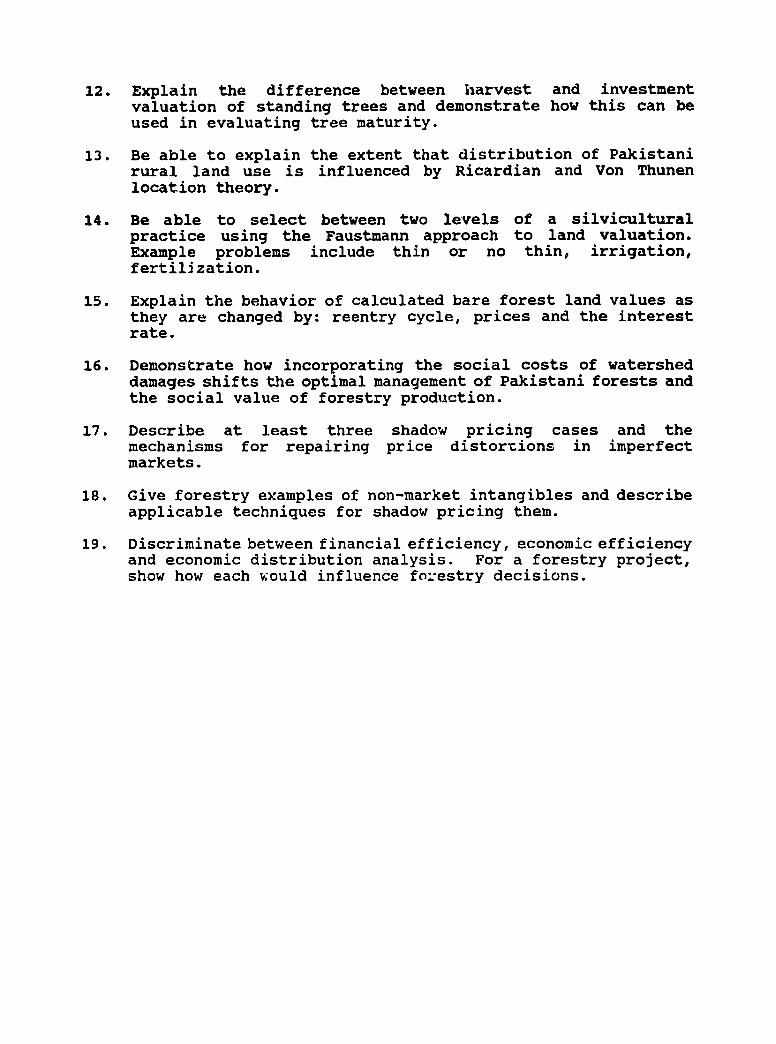
12. Explain the difference between harvest and investment valuation of standing trees and demonstrate how this can be used in evaluating tree maturity.
13. Be able to explain the extent that distribution of Pakistani rural land use is influenced by Ricardian and Von Thunen location theory.
14. Be able to select between two levels of a silvicultural practice using the Faustmann approach to land valuation. Example problems include thin or no thin, irrigation, fertilization.
15. Explain the behavior of calculated bare forest land values as they are changed by: reentry cycle, prices and the interest rate.
16. Demonstrate how incorporating the social costs of watershed damages shifts the optimal management of Pakistani forests and the social value of forestry production.
17. Describe at least three shadow pricing cases and the mechanisms for repairing price distortions in imperfect markets.
18. Give forestry examples of non-market intangibles and describe applicable techniques for shadow pricing them.
19. Discriminate between financial efficiency, economic efficiency and economic distribution analysis. For a forestry project, show how each would influence fozestry decisions.
PAKISTAN FOREST INSTITUTE LECTURES: FOREST VALUATION THEORIES AND APPLICATIONS
Valuation Defined:
Valuation is the identification and quantification of cash or intangible costs and benefits, and includes imputed value estimations of any asset or action generatinj these costs and benefits.
Forest valuation is an imperfect art. Natural resources are extremely variable factors and assets. In addition, humans view these resources uniquely, forming and communicating their values differently. Many natural resources conflicts arise from differences in how (and how much) people value the same actions, actions or implications.
Rationalization of Consumption Value:
In economics, the basic unit of analysis is the individual. Individuals value different assets and services by a perception of the relative capacities each has to satisfy personal needs. Assertions about economic behavior similar to the following are used to rationalize value behaviors, personal rankings of goods and personal maximization of utility. The common starting set includes:
1. All people seek multiple goods, 2. They have initial endowments (at least human capital), 3. They are willing to trade some of one good for more
satisfaction from another, and 4. Satisfaction from the last unit consumed depends on the number
already consumed in a given period of time.
A simplifying assumption says that this value can be reflected in quantities of a common currency. In reality, Rupees don't mean the same to all Pakistanis and money could never accurately measure all human values, but this assumption greatly simplifies examples for basic instruction. Eventually, to resolve the essential noncomparability of money values, we assume that the individuals themselves know the translation between Rupees and utility.
An Individual Basis For Value in Consumption:
We do not examine why individuals hold different values. Given that they do, we presume that their behavior reflects these values. People reveal their preferences by their choices and their own rates of trade-off are measurable. A primary representation and quantification of those trade-offs is found in demand curves.
2
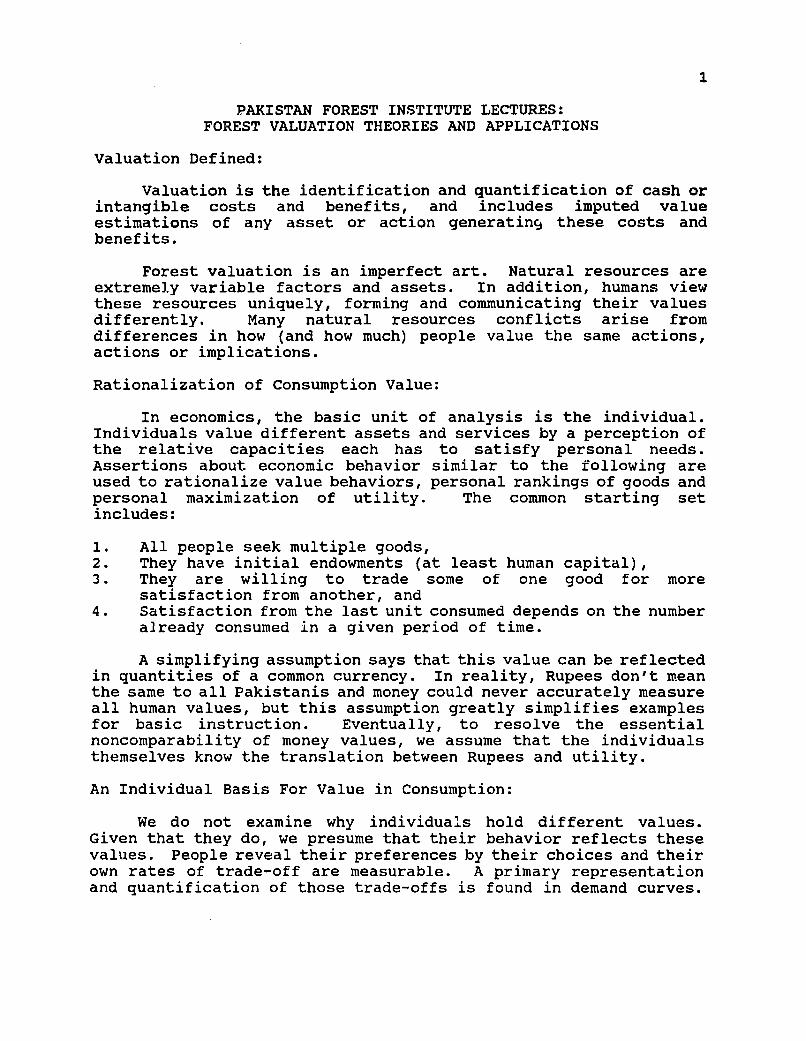
For each person and each good there is a functional relationship between how much they consume within a specified length of time and what they would sacrifice to consume it . Money valued demand curves can be measured experimentally. Holding all other factors constant, the first law of demand states that the relationship between the incremental (marginal) value forgone and increasing quantity consumed will be always be negative as shown in the figure below.
FIGURE 1: INDIVIDUAL FUELWOOD DEMAND
Pricei
ItIiueld*od
LI-
Analysts must distinguish between a consumer's total value of demanded goods and their marginal value, the value associated with the last unit of good consumed. A person's total valuation of fuelwood is what he would have been willing to pay for each maund added together, the area under the demand curve from the first highly valued maund down to the last unit consumed. By the negative shape of demand this total value is usually greater than his actual cash expenditure. His marginal valuation is what he actually pays for the last unit consumed.
The difference between total and marginal values is echoed in market demand. In a fuelwood market there are many different kinds of simultaneous consumer behavior relative to market price (marginal value). Some think that wood producers are undervaluing fuelwood, marginal consumers have personal values just equal to market values, while some think fuelwood is over-priced and do not buy.
For a particular species such as eucalyptus, fuelwood preferences can be extremely variable. One person may be think that the smoke smells good and prefer burning it to dung or straw. He might be willing to pay more than the market price to have it. Another may think that it makes the food taste funny and would pay not to be forced to use it, probably while petitioning the parliament to eradicate the poisonous species.
- -----
3
Aggregate Fuelwood Demand:
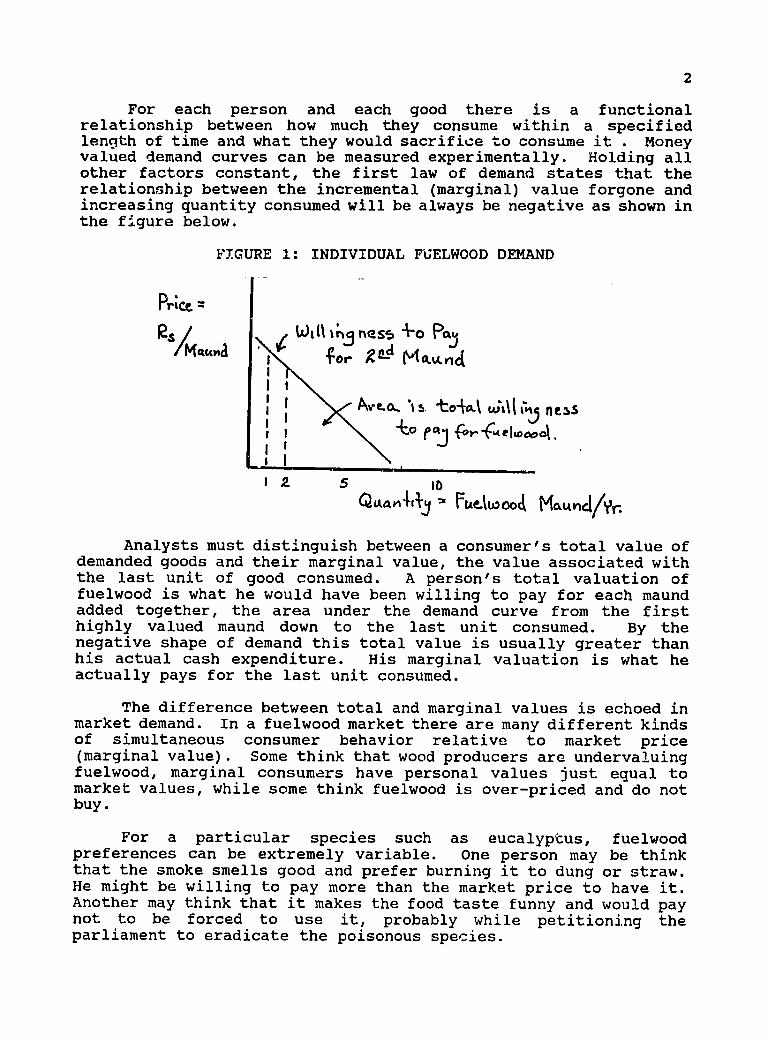
Individual demand curves aggregate into market demand for goods. In the figure below, the quantity of fuelwood demanded by two individuals is totaled horizontally at each price. This assumes that individual number one's consumption is separate from individual number two's.
FIGURE 2: AGGREGATION TO MARKET DEMAND
fp.
In the case of intangible goods where consumption of the same good can occur simultaneously (e.g. two TV receivers can receive the same satellite broadcast), aggregation is the vertical sum of willingness to pay at any specific quantity level.
If we superimposed fuelwood supply over this curve we would discover what market (marginal) price the last consumed maund/year will sell for in the fuelwood transactions. In reality, we analyze in reverse. Once we are assured that a market is functioning, we work backward from prices and quantity consumed under different conditions to measure the responses. In Pakistan, this can be difficult. There should be an empirically measurable market (aggregate) demand relationship for eucalyptus or any other speciesof Pakistani fuelwood, although there is little published work on its economic dimensions. The price of kikar in Peshawar is often known (e.g. Rs.48/maund in 1990), but transaction magnitude is unmeasured, so must be deduced.
As in the individual demand functions, for any examplequantity level, the corresponding point along the market demand function is the marginal value for that level of consumption. The marginal value is an edge value concept relating only to the last value per unit at that quantity level.
4
There are times when gross social benefit is important in natural resource value analysis. Corollary to individual total values, gross social benefit is the total area under a demand curve up to some level of output.
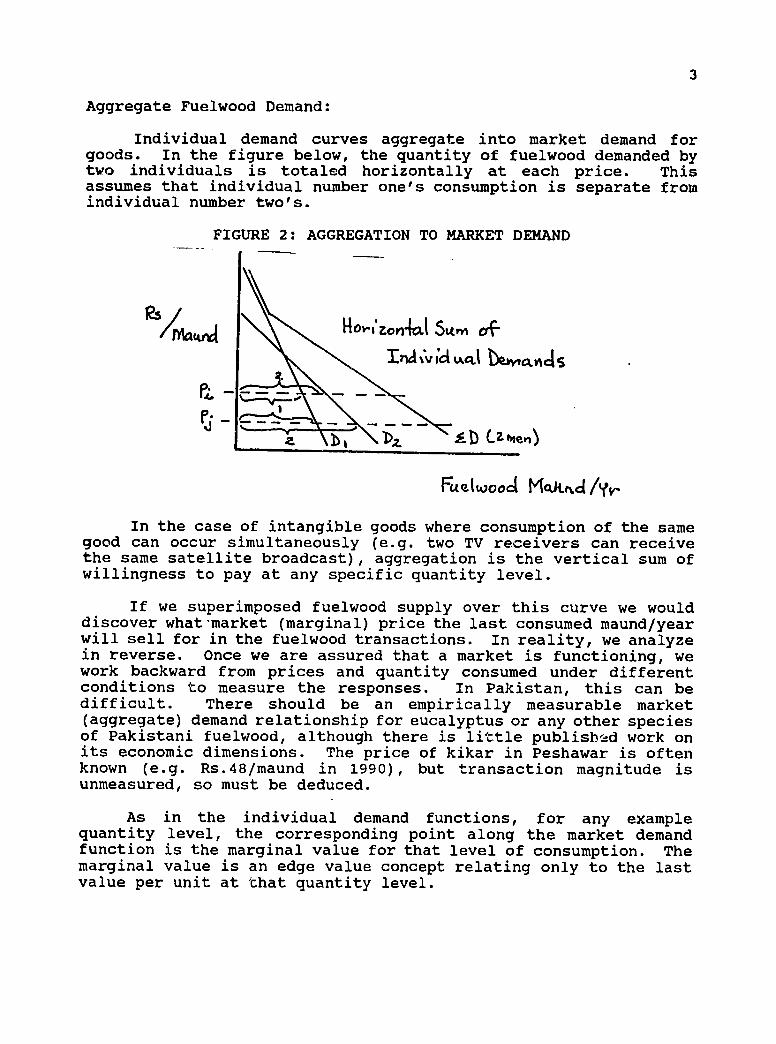
The magnitude and shape of an aggregate demand function is influenced by many factors. For final wood products these include population, income, prices and technology in substitutes and complements, changes in life style and personal tastes. If any of these factors change, the market demand for fuelwood shifts. Continuing the fuelwood market example:
Pakistani fuelwood demand shifts positively from:
population increases (eg. Afghani refugee influx) increases in prices of substitutes (eg. kerosine) decreases in prices of complements (eg. stoves)
Fuelwood demand shifts negatively from:
increases in per capita income (inferior good) living style changes (eg. urbanization) taste changes (caused by education or development)decreases in prices of substitutes (eg. electricity)
FIGURE 3: FUELWOOD MARKET DEMAND SHIFTERS
FtLoooct Mai4 /V,
The extent of changes in fuelwood consumption can be predictedfrom the elasticities of demand. Knowledge of changes can be veryuseful in planning production or in valuation of resources and products in the future for investment analyses. Elasticities are empirical estimates of demand responsiveness to parametric change.They are a ratio of percent change in quantity demanded to a percent change in a parameter. I was unable to find publishedelasticity studies for Pakistan wood products or resources,

5
probably because transaction quantities are not normally measured. My own work (McKetta 1990) indicates that the population effect is positive, but could be much lower than the 1.0 typically assumed byforesters. The qualitative influence of income, substitution and urbanization parameters appear to follow the expectations above.
Responses take time. In the short run, consumption behavior is usually not very price responsive (price inelastic) as there are few substitutes and adjustment costs are high. Long run consumption behavior is usually more elastic and fuelwood consumers respond to rising relative prices by consuming less wood, consumingit more efficiently, or shifting to a substitute energy source.
Reasons for Natural Resource Valuation:
There are several reasons to value natural resources; to ask for a specific time period, "What is (or will be) the resource price or shadow value?" As managers of productive resources, we are primarily interested in valuation as it affects productiondecisions.
In the example of valuing a raw material such as logs and stumpage, the most common reason is to establish a minimum bid for sales as insurance against buyer collusion in bidding. There is a corollary budgetary reason because foresters need to project sales revenues for organizational planning.
To the forester himself, perhaps the most important reasons for valuation relate to management decisions. Valuation is necessary for decisions of timing sales, or the sale redesign to enhance value. In renewable resources, the difference between current resource value and expected future value is a primedeterminant of harvest maturity decisions. Forest treatment decisions about silvicultural practices are really evaluations of long-term investments in a capital asset and valuation mechanisms are used to select optimal management regimes.
Product valuation is the starting point for land valuation which forms the primary criterion for long-run strategic forest planning and determines changing pattern of land use in developingsocieties. Valuation is becoming increasingly important in the process of incorporating non-commodities in forestry decisions. A minor reason for valuation may be as a basis for taxes and subsidies.
Valuation theory lies behind the mathematical techniques of financial project analysis that you have already been learning.Cost-benefit analysis criteria attempt to identify the relative efficiency of resource allocation options by estimating the changein wealth caused by a project. In financial project analysis, this is a process of comparing discounted costs and revenues of cash flows caused by the owner's decision to use some natural resource

6
in a particular manner. Later, this manual introduces you to a complementary valuation application in economic welfare analysisthat is rapidly becoming more important. An economic (societal) resource decision evaluates non-market social costs and benefits caused by a project as well in project evaluation regardless of who pays them or gains them. The analysis may imply different actions being optimal than would a private financial decision.
You must know costs and revenues before they can be discounted in either technique. You must also understand the underlyingtheory to correctly choose which values are relevant. This forest valuation module is an overview of how the tangible and intangiblevalues from natural resource production are identified and judged. The actual applied mechanics of value estimation are taught elsewhere in this course.
Once the relevant net cash or net social benefits are identified, this module describes how they are incorporated with the same type of cost-benefit mathematics to value the productive assets themselves.
Throughout this module, concentrate on the two primary reasons for valuation that will be most important to you. First, valuation in a decisi.n to buy or sell some natural resource commodity or productive asset answers one of two questions:
l.a) How much can I afford to pay for this asset and break even? or stated in reverse,
l.b) How much must I be offered before the sales income is more than the value derived from retaining the asset?
For private resource owners this is a common decision, but for most public resource managers this can be a rare question.Management foresters usually perform forest valuation analyses for the second, more common reason. Valuation is a basis for makingdecisioins about the use of an asset that you already own or manage.Since natural resource asset values are strongly influenced by how we manipulate and utilize them, the relevant question to guide management actions is:
2. What manipulations can I do today and in the future to make the asset worth more to me, the owner, or society-i.e. increase asset value and owner wealth.
Under question two, asset valuation becomes the primary guide to selection of management alternatives. Making the assets you own worth more increases your wealth and presumably makes you better off.
7
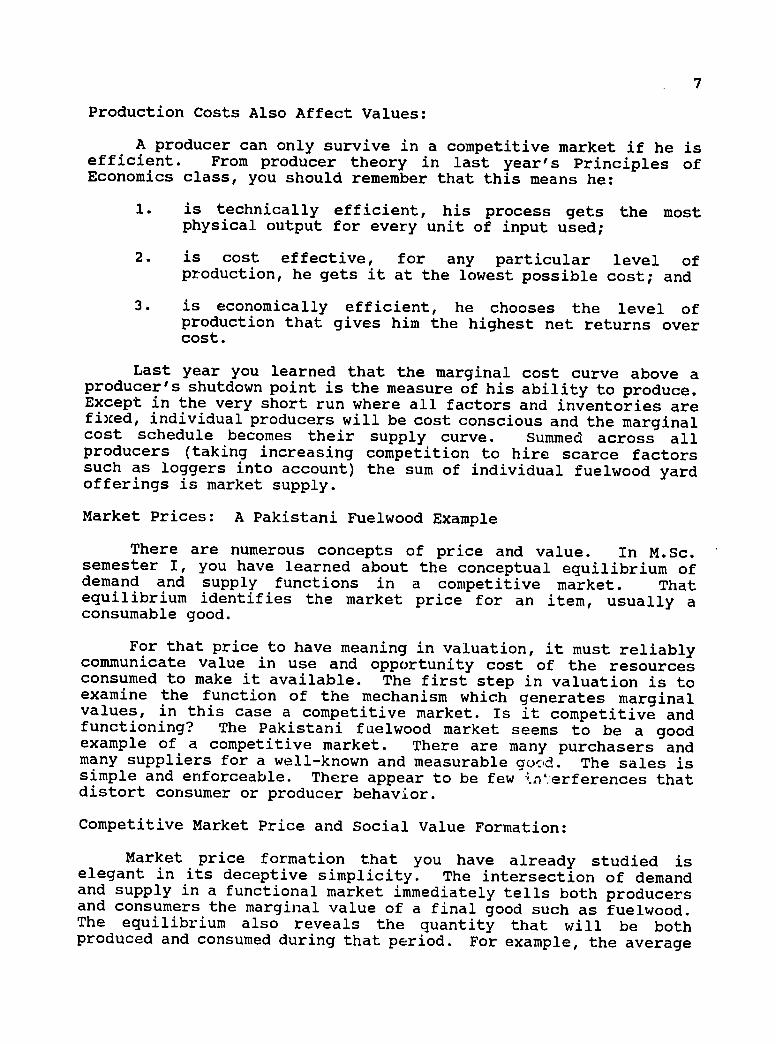
Production Costs Also Affect Values:
A producer can only survive in a competitive market if he is efficient. From producer theory in last year's Principles of Economics class, you should remember that this means he:
1. is technically efficient, his process gets the most physical output for every unit of input used;
2. is cost effective, for any particular level of production, he gets it at the lowest possible cost; and
3. is economically efficient, he chooses the level of production that gives him the highest net returns over cost.
Last year you learned that the marginal cost curve above a producer's shutdown point is the measure of his ability to produce.Except in the very short run where all factors and inventories are fixed, individual producers will be cost conscious and the marginalcost schedule becomes their supply curve. Summed across all producers (taking increasing competition to hire scarce factors such as loggers into account) the sum of individual fuelwood yardofferings is market supply.
Market Prices: A Pakistani Fuelwood Example
There are numerous concepts of price and value. In M.Sc. semester I, you have learned about the conceptual equilibrium of demand and supply functions in a competitive market. That equilibrium identifies the market price for an item, usually a consumable good.
For that price to have meaning in valuation, it must reliablycommunicate value in use and opportunity cost of the resources consumed to make it available. The first step in valuation is to examine the function of the mechanism which generates marginalvalues, in this case a competitive market. Is it competitive and functioning? The Pakistani fuelwood market seems to be a goodexample of a competitive market. There are many purchasers and many suppliers for a well-known and measurable gocd. The sales is simple and enforceable. There appear to be few i.nerferences that distort consumer or producer behavior.
Competitive Market Price and Social Value Formation:
Market price formation that you have already studied is elegant in its deceptive simplicity. The intersection of demand and supply in a functional market immediately tells both producersand consumers the marginal value of a final good such as fuelwood. The equilibrium also reveals the quantity that will be both produced and consumed during that period. For example, the average

8
price of kikar fuelwood in Peshawar was Rs.48/maund in 1990 (PFI1992). The quantity consumed is unmeasured for Pakistani markets,but may be in the vicinity of 22 million m3 (Siddiqui 1990). The market equilibrium may look like figure 4 below.
The equilibrium also generates a net social value of fuelwood for a single period of consumption. This is measured as a total rather than a marginal concept: gross social value less gross costs of production. For the equilibrium represented in the curves below, net social value consists of all the value below the demand function and above the supply function (because the integral of the marginal cost curve is the total resources expended to producefuelwood.) Discounted multi-period net social values can then be aggregated into a net social benefit (NSB) valuation.
FIGURE 4: FUELWOOD MARKET EQUILIBRIUM
Iocoat
Price06o~rdcc-,v
C(Qrs ,
Net social value is conceptually important because it corresponds to other common economic measures. The producer'ssurplus (area above supply, but below market price) is related tovalue added estimates used in macro-economic evaluations, and the whole net social value is comparable to values used in the valuation of non-market goods. Project comparisons using marginalprice for a forest commodity and total value for a forest amenitywould obviously bias production and conservation decisions, so total and marginal concepts of value must be consistent.
Market Clearing and Dysfunction:
Markets always clear at some marginal value unless they areconstrained. However, in fuelwood analysis for developingcountries it is popular for foresters to speak of fuelwood supply gaps. A statement is made that demand is larger than supply.Typically, exponential population growth is hypothesized to cause similarly increased wood consumption because a constant per capita
9
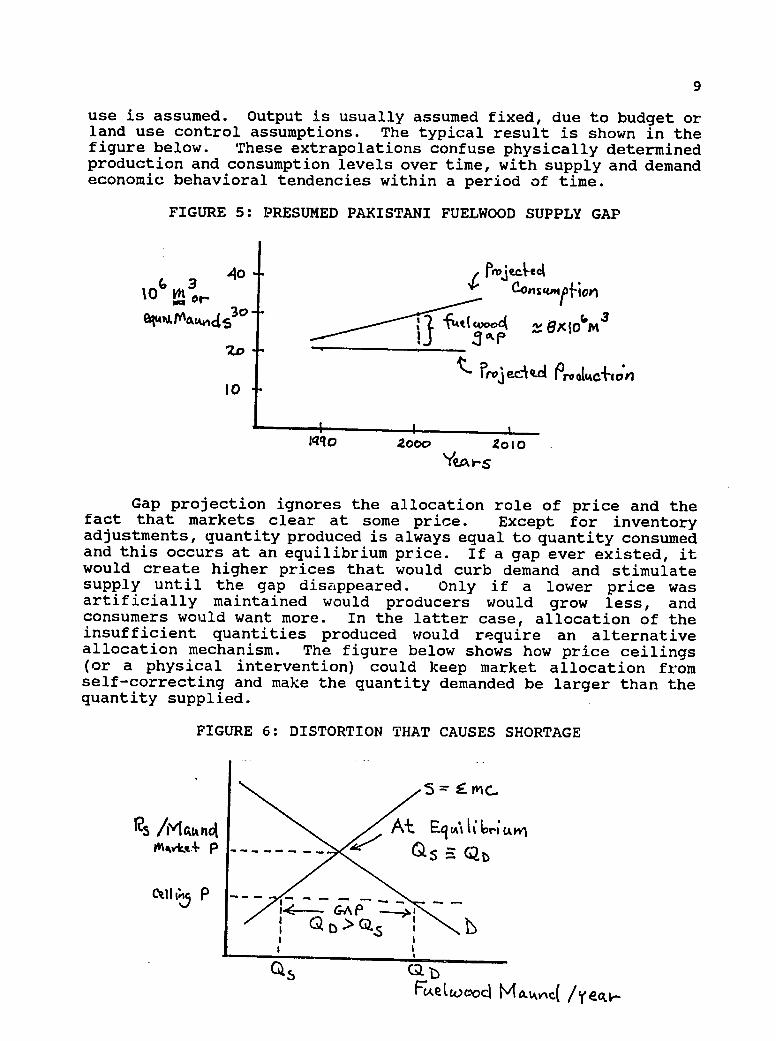
use is assumed. Output is usually assumed fixed, due to budget or land use control assumptions. The typical result is shown in the figure below. These extrapolations confuse physically determined production and consumption levels over time, with supply and demand economic behavioral tendencies within a period of time.
FIGURE 5: PRESUMED PAKISTANI FUELWOOD SUPPLY GAP
a '40 reec
10 Vh 3 Cs f~v
I0 ~ ~ ~ ~ r ecaqA roLcIl
lqq0 2000 2oiO
YIEAV-S
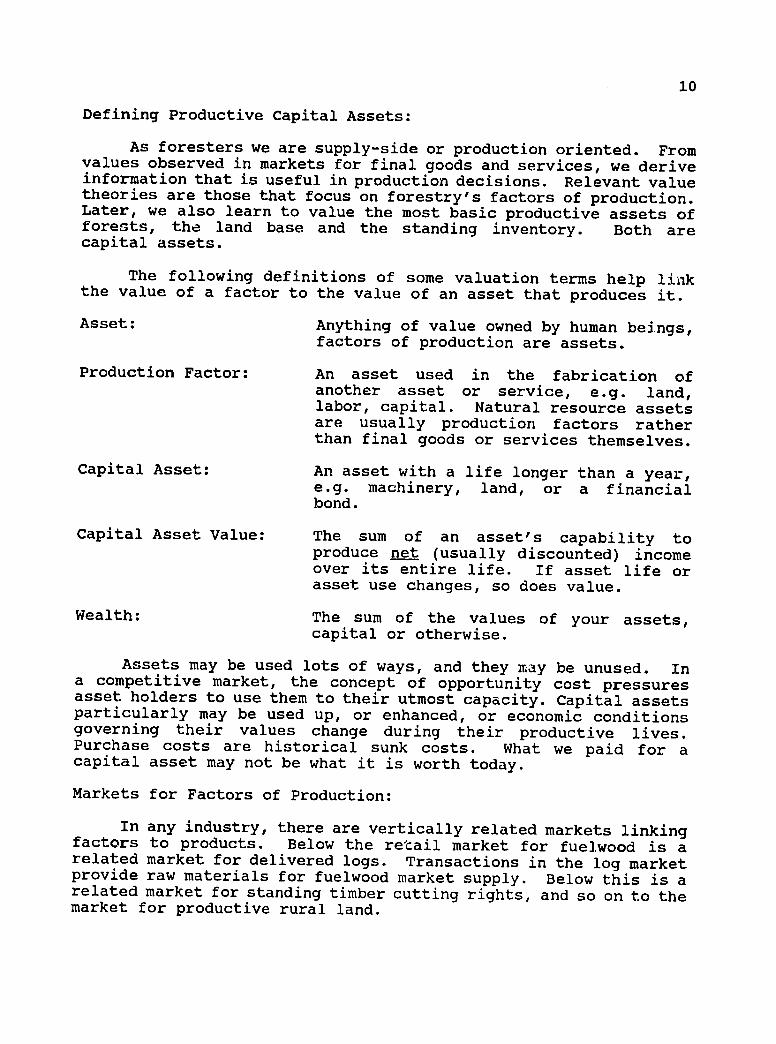
Gap projection ignores the allocation role of price and thefact that markets clear at some price. Except for inventoryadjustments, quantity produced is always equal to quantity consumed and this occurs at an equilibrium price. If a gap ever existed, it would create higher prices that would curb demand and stimulate supply until the gap disappeared. Only if a lower price was artificially maintained would producers would grow andless, consumers would want more. In the latter case, allocation of the insufficient quantities produced would require an alternative allocation mechanism. The figure below shows how price ceilings(or a physical intervention) could keep market allocation from self-correcting and make the quantity demanded be larger than the quantity supplied.
FIGURE 6: DISTORTION THAT CAUSES SHORTAGE
5~ mc.
il'vk.P ------ -_ _~Q
eXC&AP I081 )> Z.' | /
10
Defining Productive Capital Assets:
As foresters we are supply-side or production oriented. From values observed in markets for final goods and services, we derive information that is useful in production decisions. Relevant value theories are those that focus on forestry's factors of production.Later, we also learn to value the most basic productive assets of forests, the land base and the standing inventory. Both are capital assets.
The following definitions of some valuation terms help link the value of a factor to the value of an asset that produces it.
Asset: Anything of value owned by human beings, factors of production are assets.
Production Factor: An asset used in the offabrication another asset or service, e.g. land, labor, capital. Natural resource assets are usually production factors rather than final goods or services themselves.
Capital Asset: An asset with a life longer than a year, e.g. machinery, land, or a financial bond.
Capital Asset Value: The sum of an asset's capability to produce net (usually discounted) income over its entire life. If asset life or asset use changes, so does value.
Wealth: The sum of the values of your assets, capital or otherwise.
Assets may be used lots of ways, and they may be unused. In a competitive market, the concept of opportunity cost pressuresasset holders to use them to their utmost capacity. Capital assets particularly may be used up, or enhanced, or economic conditions governing their values change during their productive lives. Purchase costs are historical sunk costs. What we paid for a capital asset may not be what it is worth today.
Markets for Factors of Production:
In any industry, there are vertically related markets linkingfactors to products. Below the retail market for fuelwood is a related market for delivered logs. Transactions in the log market provide raw materials for fuelwood market supply. Below this is a related market for standing timber cutting rights, and so on to the market for productive rural land.
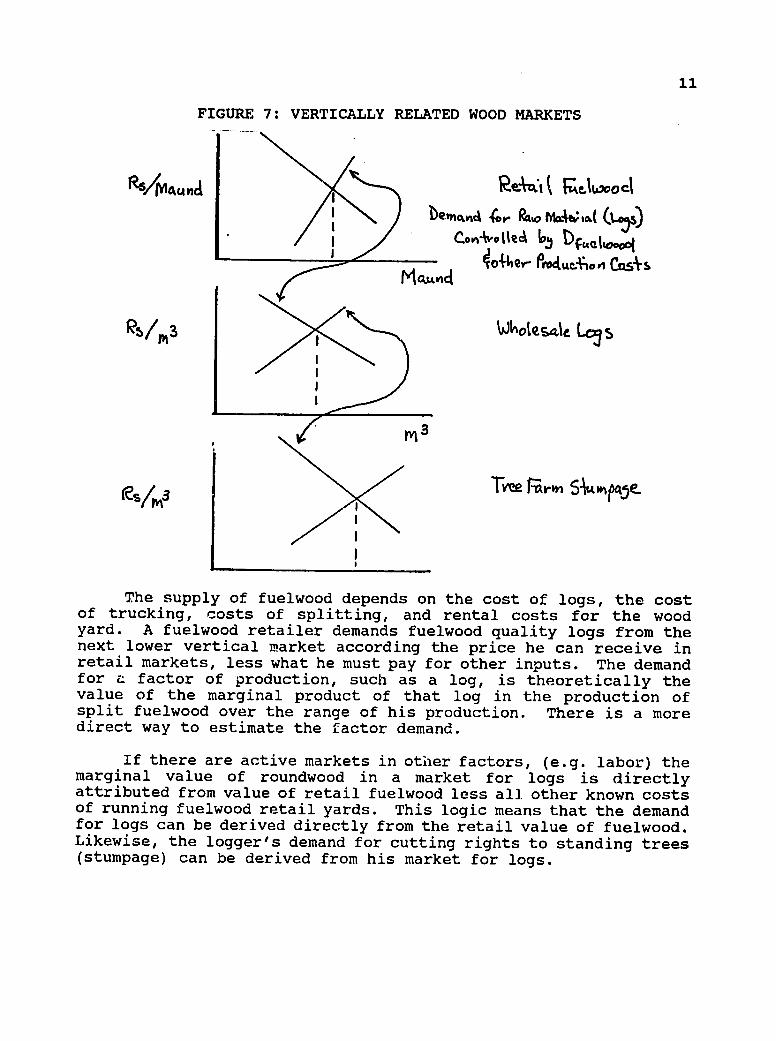
FIGURE 7: VERTICALLY RELATED WOOD MARKETS
/Ma..d~6 ' Uf "Qwo..
11 00, M
TMNAM - tmqjereSI3
The supply of fuelwood depends on the cost of logs, the cost of trucking, costs of splitting, and rental costs for the wood yard. A fuelwood retailer demands fuelwood quality logs from the next lower vertical market according the price he can receive in retail markets, less what he must pay for other inputs. The demand for a factor of production, such as a log, is theoretically the value of the marginal product of that log in the production of split fuelwood over the range of his production. There is a more direct way to estimate the factor demand.
If there are active markets in other factors, (e.g. labor) the marginal value of roundwood in a market for logs is directlyattributed from value of retail fuelwood less all other known costs of running fuelwood retail yards. This logic means that the demand for logs can be derived directly from the retail value of fuelwood. Likewise, the logger's demand for cutting rights to standing trees (stumpage) can be derived from his market for logs.

12
Derived Demand for Forest Factors of Production:
In production valuation, we calculate a derived value--derived from consumption value. From this can be estimated a demand schedule of derived values at different levels of production.Derived demand comes from a "value in use" theory. In the fuelwood example, what is the fuelwood plantation itself worth if it produces consumable fuelwood? It is easy to see that at a particular level of supply, the value of fuelwood growth potential is worth fuelwood exchange value less the cost margin of harvesting and distributing fuelwood. At a larger supply level, the fuelwood value drops (demand is negative), the margin changes, and the value of fuelwood plantations would drop too.
There is also a bottom up, accumulated cost of production theory which is a corollary of Marx's "labor" theory of value. This theory is typically used in the communist block and capitalist analysts reject the logic. Necessity of production is determined centrally and wood value is considered the sum of the labor costs of production. Capital costs are ignored. Where any cost is added to price, there is no automatic efficiency incentive in production so prices are relatively high. Also a labor value based system attributes no value to natural resources in place. With no attributed value, resource enhancement, protection or conservation incentives do not exist. This can lead to resource dissipation and subsequent supply declines.
To calculate the derived demand (represented in the diagram below), we first find some standard x-axis unit of measure that technically relates quantity measures of trees to measures of logs and of retail fuelwood and which recognize variable recovery factors in conversion. In this graphical example we also assume the simplest supply conditions--that log supply is fixed.
FIGURE 8: DERIVED DEMAND FOR STUMPAGE
ke
iPi IIMFt
13
The derived demand in this case is the primary demand minus the conversion margin at each level of output. The stumpage value is the retail fuelwood market price at the market-clearing supply volume minus the conversion margin at that point. Note that the aggregate conversion margin may be different at each market level of output and is certainly different for each individual producer. In valuation procedures, we apply this concept directly. If no market data exists for one of the levels, stumpage or retail, knowledge of the conversion margin can be used to estimate the value of wood at the other. Normally, retail price is known, and factor value is deduced. However, where retail markets are distorted, the reverse calculation is possible.
Each factor will have a unique derived demands, some will be complicated by the fact that the same shisham tree could contribute products into the fuelwood, construction and furniture wood markets. These unique derived demands for logs behave like the demand for other raw materials. At a higher cost for labor or transport because of adverse location or operability, the conversion margin increases and the imputed value for those logs is lower.
At the market level, if the costs of producing logs rises, fewer logs will be purchased. Although there are few physical substitutes for logs in lumber production, the recovery rate from logs is extremely variable and more sophisticated machinery and trained manpower are employed to get more value yield from fewer logs.
Valuing Productive Factors and Capital Assets:
Productive assets are extremely variable and are traded in all sorts of markets and command distribution systems. There are three approaches typically used to appraise assets: cost, market and income valuation. In theory, each method should assign an identical value to the same asset as any of the others. In reality, particularly for natural resources, some of the techniquesbecome inoperable, or may assign significantly different values because their procedural assumptions do not conform with actual conditions.
1. COST APPROACH
Also known as the "engineering cost" approach, this techniqueis the estimation of a finished product value by the aggregation of the types of average costs involved in production. For a machine tool, a manufacturing margin from zero up to the derived demand is being calculated. This assumes that the product is well-defined, standardized and in new condition. Further, we assume that all costed components are purchased in perfectly competitive markets so that average costs are also marginal costs. The cost value of a new car is the sum of its part and assembly costs plus a profit
14
margin. Market conditions can temporarily make a cost value different from a marginal transaction value, for example car model that proves unpopular.
An inverse form of this approach is the estimation of the conversion margin from the competitive market for a product and most of the factors to impute a value to one of the factors. In forestry this technique is called Residual Value Appraisal (RVA).It is a common technique for estimating log values from competitivelumber values, or stumpage values from competitive log markets.
2. MARKET APPROACH
Also called the "comparable sales" approach, this technique assumes that the asset, factor or service is well defined, widelytraded and that any variation in values is structurally explainable from observable differences in either market or factor. The value of an untraded object is inferred from the value of the similar traded ones.
Because commodities and markets are variable, statistical estimation techniques called Transactions Evidence Appraisal (TEA) are normally employed. These can be as simple as estimated means and variances. In variable goods, for valuable goods, or in complex markets, multiple regression analysis is used.
Market approaches work well in log markets and some stumpagemarkets where trade is not constrained and the number of transactions is significant. In some markets it is necessary to combine RVA and TEA approaches.
3. INCOME APPROACH
Possession of a capital asset implies complete possession of rights to its net productive services for its entire productivelife. The income approach recognizes that the winning marginal asset buyer for such a productive asset will bid up to the entire net financial productive capacity of the asset in order to captureit. In that case, the sum of net cash flows (of course adjustedfor time of occurrence) over the life of the asset plus salvagevalue would be the marginal value of the asset itself in the market.
Asset value = - all operating & capital costs + value of all output produced + salvage value (if depreciating asset)
This is the most widely used appraisal technique in forestryproject analysis, management decisions, and land use decisions.
15
Estimating Value of Logs and Stumpage:
Logs and stumpage are both different stages of the same raw material. They are both traded in a wide variety of market structures. To understand valuation techniques, it is helpful to separate three categories of parameters that affect log or stumpagevalue: product market parameters, conversion margin parameters, and parameters associated with the site. In addition, there are management variables controllable by the forester that affect value.
In the following general equations assume that logs are the final product. In the first equation are some of the many sources of log market variability.
Log value/m3 = f (species, grade, diameter, length, form, milling technology, product market conditions, number of bidders, uncut volume already sold)
These logs come from trees that might be harvested from a variety of sites, and tree value is affected by these additional parameters which are mostly conversion margin costs.
Stumpage value/m3 = g (log parameters plus: haul distance, road quality, stand density, stand uniformity, logging method, operating constraints, slope, aspect, time of year, log scale used, type of marking, size of the sale unit, etc.)
Land value is affected by the preceding sets of parametersplus factors unique to that parcel affecting either its operability or its productivity.
Land value/kanal = h (stumpage parameters plus: size of parcel, access, distance from market, climatic and edaphic conditions, site productivity, legal operability constraints, etc)
Wood Valuation Method #1: Transaction Evidence Appraisal (TEA):
TEA is widely replacing RVA approaches where sufficient data sets exist. It is inexpensive to establish and recalibrate TEA equations. In a single formula, the entire conversion margin behavior is considered simultaneously and log and stumpage factor values are estimated directly. In addition, the analysis by either multiple regression or weighted averages provides sufficient

16
statistics to calculate confidence intervals so that the quality of valuation estimates are readily assessable.
A difference in any of the parameters and variables above can affect unit value. However, some of the parameters can represent many of the sources of value variability at the same time and the task is to represent conversion margin variability in as simple a single estimation step as possible. For example, in uniform stands mean DBH tree diameter is an indicator of relative felling, buckingand yarding costs. These costs per m3 fall as DBH rises. DBH also captures some value indicators as grade and size are both positively DBH related.
If a few proxy variables capture the bulk of the value variability, the equations which estimate the conversion margin can be quite abbreviated. Where they are functional in western US stumpage markets, TEA equations have few variables. One study (Ehrenreich and McKetta 1991) of local state sales used multipleregression analysis to estimate the b coefficients in the following structural form with R2 in excess of 0.8.
Stumpage $/MBF = + b0 (a constant) + b, (species wtd product value index) + b2 (predicted number of bidders) + b3 (mean stand DBH) - b4 (hauling time to market) - b5 (uncut volume under contract) - b6 (% cable yarded)
Variations of the resultant equation are used directly to estimate values for subsequent stumpage value analyses for what ever purpose, sale or management planning. New sales data is constantly added to the data set so recalibrated equations capturechanges in product market or conversion market behaviors.
Similar analyses would be fruitful in Pakistan's governmentlog markets; retail fuelwood, construction wood, furniture wood and sport wood markets; and in farm woodlot stumpage sales. Where data bases were insufficient for regression analysis, a weighted averages TEA could be estimated.
Where markets are functional, market approaches such as TEA are appropriate. Where markets are too small to provide sufficient data or they are constrained, the inverse cost approach (RVA) is employed. Because public forest logging is contracted by GOP, RVA would probably be the most relevant valuation method for Pakistani public stumpage.
17
Wood Valuation Method #2: Residual Value Appraisal (RVA)
RVA examines the same sources of conversion margin costs as listed under TEA, but examines each category separately and the margin is constructed additively. RVA mechanics are covered in other modules of this course.
RVA assumes that cost categories are complete, can be accurately estimated, and are additive. No man knows costs better than the man who bears them, so RVA is a common and useful technique for valuation estimation within individual wood using firms.
For timber sellers, knowledge of the cost structures of the marginal wood operators is limited. TEA is usually a more practical technique, but where TEA is unusable, RVA can be used. However, from this perspective RVA is at best a vague approximationof log or stumpage value. Drawbacks of RVA include: a costly and tedious data collection procedure, an assumption that AC = MC which overstates the conversion margin, and the statistical fact that for every mean cost that is subtracted from mean product value, the variances of the distributions are multiplied. In some exactingprocedures, e.g. the US Forest Service RVA subtracts over sixtyestimated mean costs from mean product values to estimate stumpagevalues, the interaction between numerous cost distributions caused the confidence interval about the stumpage value estimate to be immense. For this reason, RVA variance is rarely calculated, and estimated mean values often have to be adjusted ad hoc byexperienced appraisers. The US Forest Service RVA system is in the process of being replaced by a TEA approach.
Harvest Valuation of Standing Trees:
Standing tree or stumpage value is also derived, but it changes over time because tree age and size affect both a trees' value in use and its costs of conversion. Over the life of a tree,its value can be extremely variable. Initially, stumpage value is negative because harvest costs are high for handling many small pieces to collect a M3, and the final product value of those small pieces is low. Stumpage value then grows rapidly because harvesting costs/m 3 drop with size while product value recoveryrises with size. At large sizes, both the size relationshipsbecome less influential. The rate of stumpage value growthdeclines until very old trees actually decay and lose volume.
Investment Valuation of Standing Trees:
In stumpage valuation by both TEA and RVA, an important'assumption is that the trees to be valued are financially mature. Trees that are younger or older than this age have two sources of value. They have a value to be left growing that will be different

18
from immediate harvest value. This difference between cost and income valuation of an immature tree is a good indication of how comparative valuation can be used for forestry decision making.
A forester has the option for a young tree of harvesting it today and receiving current harvest value now or saving the tree to accumulate growth and harvesting it in the future. In the delayedharvest decision, a standing tree that is young has a reinvestment value that exceeds the immediate harvest value.
For example, a 5-year old shisham tree may have Rs. 50 of fuelwood stumpage value. If we wait 25 years, the 30 year old tree could have Rs. 2000 (net of inflation) of combined furniture wooa and fuelwood value. Using a simplistic version of income valuation (assuming 10% real discount rate), the investment value of the five-year-old shisham tree is:
Tree valuea= 5 Rs. 2000 = Rs. 185 (1.10)15
If this is true, farmers would never grow shisham trees for just 5 year old fuelwood, and any RVA approach would seriouslyundervalue the immature trees. The reverse occurs for very old trees, the rate of value growth is less than the capital holding cost so immediate harvest value almost always exceeds reinvestment value. This is evident in the following graph which comparesinvestment and harvest sources of value.
FIGURE 9: TREE HARVEST AND INVESTMENT VALUES
W10z 51CL+1O
0 20 3o0o. 40
PRvxc, 4r btire."RA) In the old tree variation, TEA or RVA of harvestable stumpage
overvalues the investment value of standing inventory. If that excess inventory value is deducted from total forest value, a nonsensical negative bare land value is implied. Faustmann's
19
(1849) reaction to this logical error caused him to develop the income approach to forest land valuation that is currently in use throughout the world's market economies.
Faustmann also identified a flaw in the simplistic harvest optimization rule that you should cut when the rate of value growthis equal to the opportunity cost of capital. In high growth rate species, where wood values are high, or the cost of capital is high, an analyst must also consider the cost of delaying the next crop by allowing the current one to come to its own full financial maturity. This effect is captured when the asset valued is the land itself and the contribution of multiple cycles to land value is estimated.
Potential Income Valuation of Land:
Land is a capital asset, the most basic factor of productionin natural resource management. It has an infinite productive life if professionals are practicing sustainable land management. Land takes its value from what it produces just as any capital factor. Its value is the sum of net gains from its product over time.
Land is a complex resource, with many alternative uses,producing products for many different markets. In the initial exploration of the sources of land value and value variability, a short temporary set of simplifying assumptions for example land valuation calculations helps clarify them. Assume:
1. no transactions costs, 2. no risk or uncertainty, and 3. production occurs in a single time period.
Eventually all these assumptions are relaxed, but the last assumption is extremely limiting as land sustainably produces output over an infinite number of time periods. From previousstudies about the time value of money, we know that cash flows in different time periods usually have to be converted to a common point of refcrence, often discounted into present net value (PNV).Until those calculations become relevant, we temporarily make the following limiting assumptions about the time value of money.Assume:
1. no interest rate, 2. no inflation, and 3. no change in real prices.
Concept of Ricardian Rent:
In Ricardian rent estimation, we assume that all surplus net revenue can be attributed to unique qualities of the fixed factor of production that causes it. That surplus revenue is called rent. In true rents, they are a value that would not change allocation of
20
the fixed factor. In forestry production, this fixed factor is usually land. For stumpage arid log appraisal, the same logicapplies. As forestry factor rents are actually variable and their allocation is affected by changes in rent, these values are more correctly labeled quasi-rents.
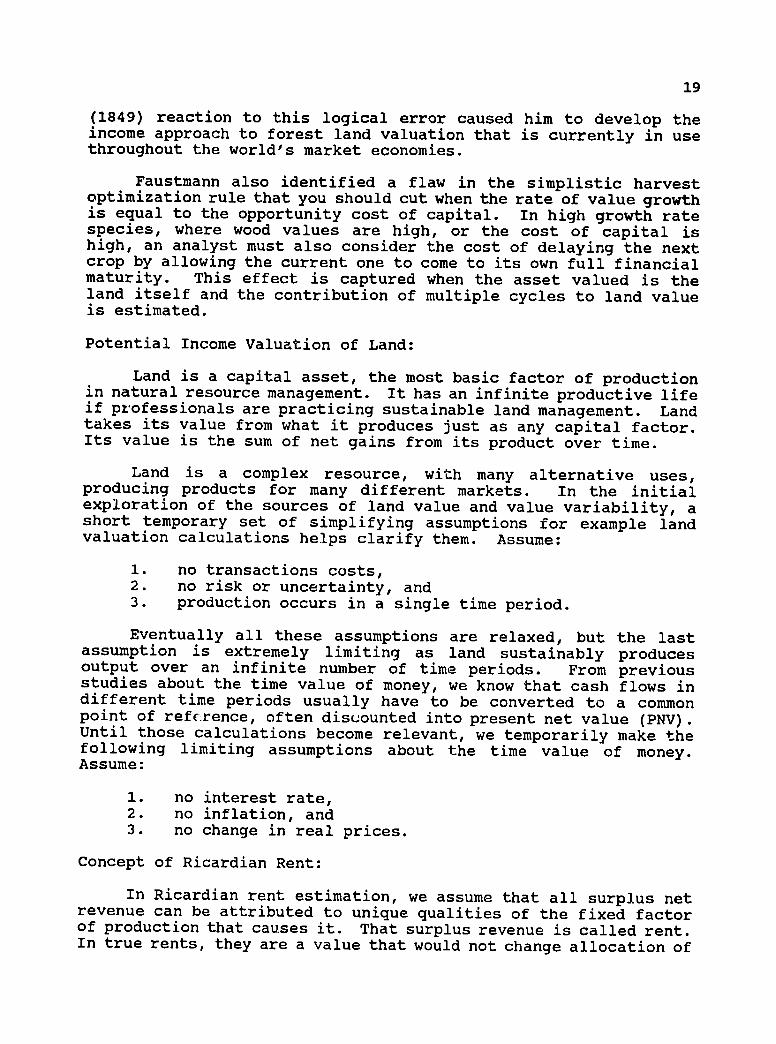
The magnitude of rent is the total revenue from productionminus the total costs of all other factors employed at an optimallevel of production. In the perfectly competitive model of identical producers, rent solves at zero, where MC=MR=ATC because we assume a new producer will freely enter with identical resources until the increased supply effect lowers price and dissipates rent. In the real forestry world of extreme differing quality factors, rent is a measure of those differences in quality.
FIGURE 10: FORMATION OF RICARDIAN RENT
RSo ' AW, 10M
c.ost AvP5e
Estimates of Ricardian Rent:
If we assume efficiency and optimality in productiondecisions, the rental value of land can be calculated directlyusing the income approach.
Land Value/kanal - management costs + net harvest benefits
In the market of different bidders making these calculations,the most enterprising operator pays the most and gains the land. Or he may be the one who retains the land and makes it that desirable. Over-bidders or submarginal managers dissipate their initial capital in over-payment and are quickly eliminated from the system unless artificially sustained.
21
Productivity Effect on Land Values:
Ricardo said that land varied by quality, and that lowerquality land required more effort (cost) to wring crops out of it.While there are biological roots to quality and value differences,the primary economic measure of land potential is the value productivity of land. This is reflected in calculated potential rents.
Poor Land Value - high management costs - high fertilizer costs + low net harvest benefits
Good Land Value = - low management costs - low fertilizer costs + net large harvest benefits
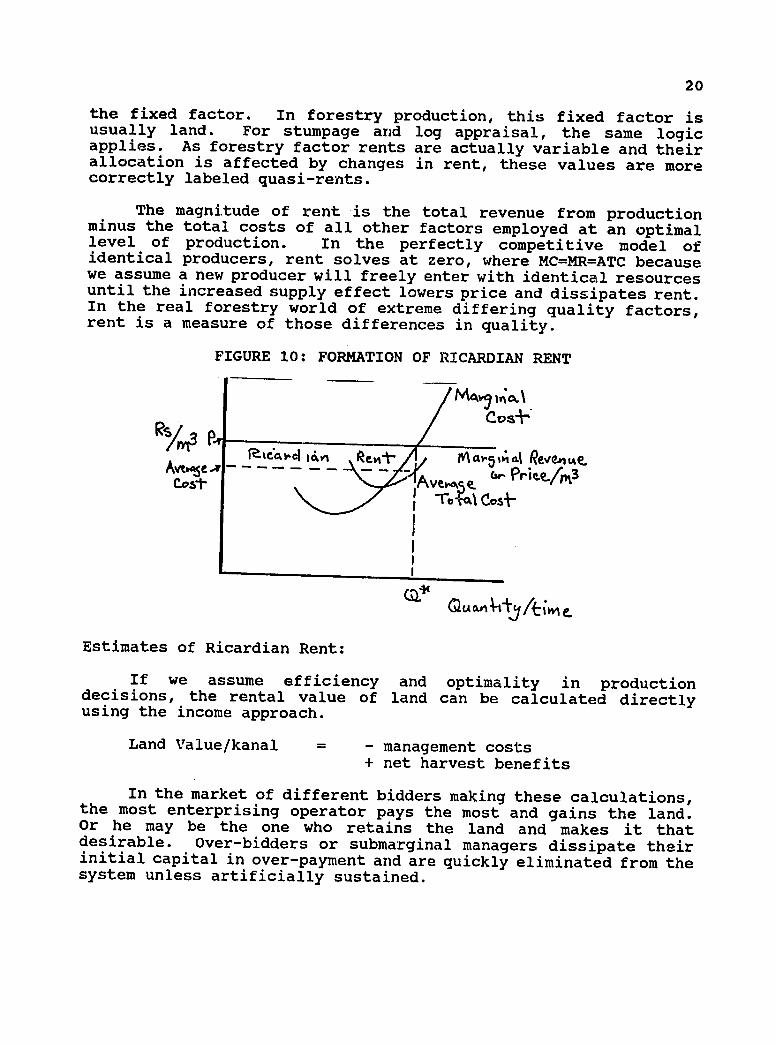
The lands can be categorized into land qualities by their costs of producing the same crop. At a given crop market pricethat affects all producers equally, good lands are those with highrents--high returns over costs of production. Poor lands, those with high costs of production, may not be brought into service until crop prices are high. There will of course be a highcorrelation with site productivity, and we will see that managers can affect rents. This shows up graphically in the following figure.
FIGURE 11: RICARDIAN RENT BY LAND QUALITY
I II
Erood, Lctyl( Poor- L~oyAc 5,mcty. rc Lavir4 Cy ~~k)( iv frddin (Casir6 >C"w vake)
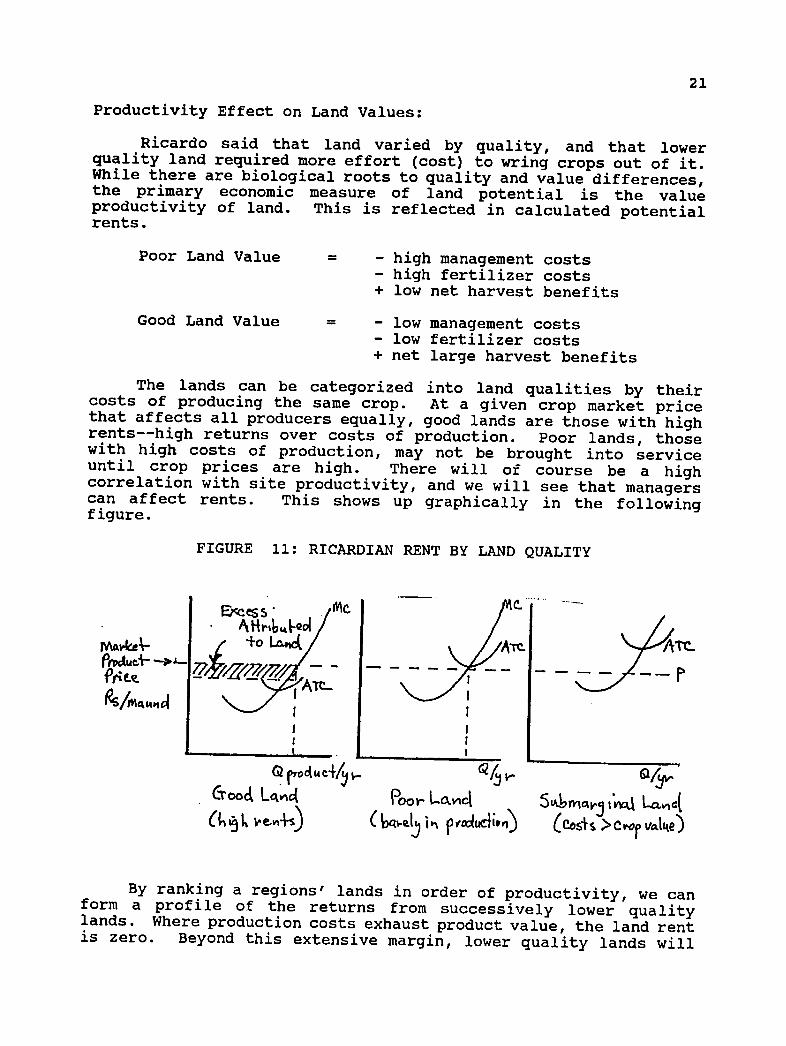
By ranking a regions' lands in order of productivity, we canform a profile of the returns from successively lower qualitylands. Where production costs exhaust product value, the land rentis zero. Beyond this extensive margin, lower quality lands will
22
not be employed in this use. The rent frontier (intensive margin)will shift with changes in cost (cost up, rent down), product price(price up, rent up), and technology or operating constraints.
FIGURE 12: RENT PROY'ILE BY PRODUCTIVITY
•a~ I
Rev+4 Pent' ofu~~i
Ii
Management Effects cn Land Values:
Decision 1: Land Use Allocation:
For any single kanal there is usually a different calculated land value for each potential use. For example, examine the following use comparison between grain and fuelwood a goodon productivity kanal.
Land Value (fuelwood) = - low coppice regeneration costs - low management costs - moderate capital costs + moderate cyclic harvest benefits
Land Value (grain) = - high cultivation costs - high fertilizer costs - low capital costs + large annual harvest benefits
This is a systematic relationship. Ricardo hypothesized that rent differences control land use allocations in competitivesocieties in accordance with land's variable productivity. In the following diagram are rents for three productive land uses: grain,fuelwood and pasture. Although good lands should produce highrents for all three different product uses, the highest rent prevails. A wealth maximizing farm owner will use it in this case for cultivation.

23
There are transfer margins of use where alternative use rent profiles cross. Beyond the transfer margin a different use generates higher rents. For only one use to prevail saturates its market, driving product values down. Further, this would depleteother product markets, in turn raising alternative use rent profiles. The position of these relative margins fluctuates with changes in costs and prices in the different markets. For example,if fuelwood prices rose, the forest use profile would rise and we would expect to see both poor crop land and good grazing lands shift into fuelwood plantations.
FIGURE 13: RENT-INDUCED LAND USE ALLOCATION
oteoProfilesWuea
IFot-es+ W~e-.e Ue
&ooo oo for
1:,,1cLAS b3 Qua['~
Decision 2: Choice of Management Regime Within Land Use:
Within a use allocation, the above profiles presumed that management would already be optimal. This assumes a omniscient manager who makes instant responses to changes in perfecttechnological information. Finding optimal management is often difficult. Often it is a trial and error exploration through a maze of poor technical information, widely variable managementskills, and uncertain options for fluctuating markets. Valuation is a useful tool for discovering preferable forest managementregimes in this environment.
A forester controls many variables through management. These could include: species mix, seedling genetic quality, competition for light and water, nutrient balance, stocking, tree quality, soil condition, protection from fire and pathogens, harvest age and manyother site factors. In the example calculations below, only the species decision (and implicitly a different tree life cycle) is evaluated.

24
Land Value (poplar) = - low coppice regeneration costs - low management costs - moderate capital costs + moderate net cyclic harvests Rs.
Land Value (shisham)= - high planting costs - low management costs - large capital costs + very large infrequent harvest Rs.
Location Effect on Calculated Land Value:
Von Thunen (1826) theorized that if all lands are of equalproductivity, land values would vary by their distances from the market for the final products. The farther away a kanal is, the more effort (movement cost) it takes to tend, harvest and transportthe crop. In some societies, this shifts the order of land use depending on the bulk of products, the transportation technologies,and the frequency of management visits to the site.
FIGURE 14: RENT VARIABILITY (AND USE) BY LOCATION
(As.. er(Ast-
M . ii,,.__,
1<A0 -61aket-
In reality, land value on any one kanal is a complexassociation of all these quality, allocation, management and locational factors. The analysis is further complicated because the costs and returns affected by these factors do not occur in a single period, but over time. The most difficult part of this process is the predictive valuation of factors and products. For forestry, this requires two prediction dimensions: prediction of future biological product and economic forecasting of future market conditions. Both projections are usually of low statisti.cal reliability. Forecasting and sensitivity analysis procedures are beyond this module. However, the time adjustment process for both costs and benefits is mathematically straight-forward.
25
Income Valuation For Inter-temporal Production:
When the single period assumption is relaxed, as it must be to evaluate long-run forestry inter-temporal production, expected cash flows must be adjusted for their position in time. Typically this is a process of calculating the present value equivalent of each expected flow and summing to a present net value (PNV) expressed in values of the analysis reference year (usually today).
You have already learned the interest rate mathematics necessary to discount cash flows from differing points in time. Other important valuation considerations such as the difference between real and nominal values, how real values change over time (fluctuation, cycle and trends), and how widely felt expectationsof value change can in turn cause market conditions that dampenchange are covered in other modules.
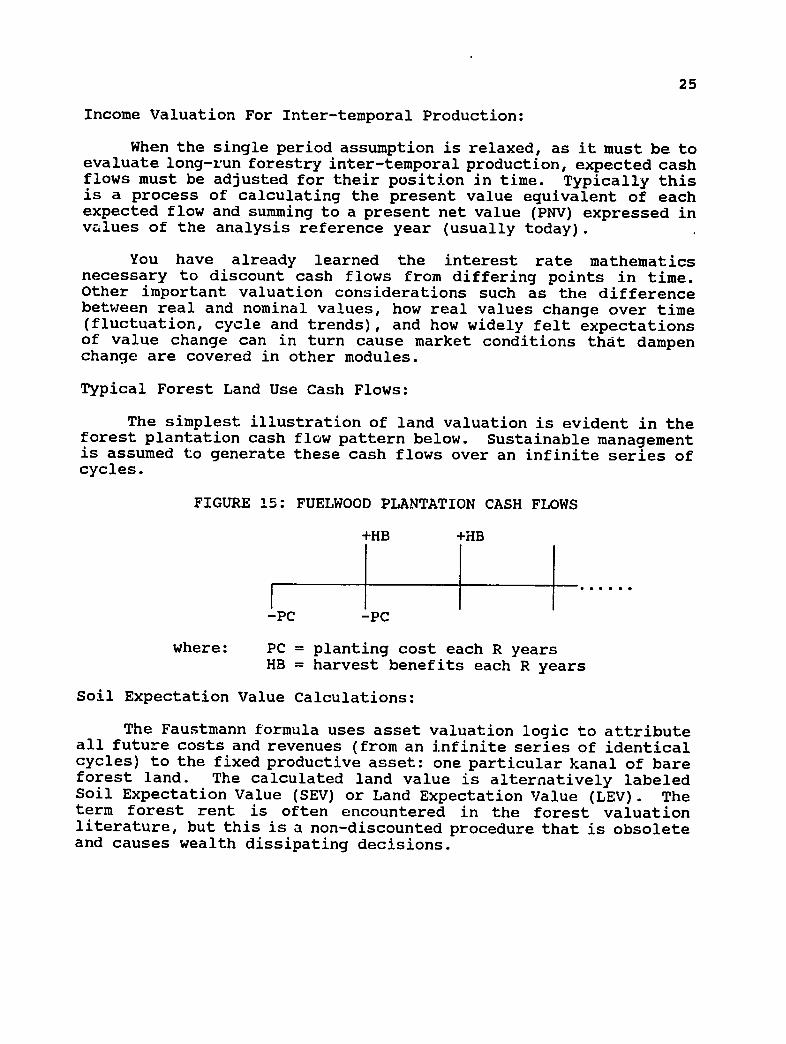
Typical Forest Land Use Cash Flows:
The simplest illustration of land valuation is evident in the forest plantation cash flow pattern below. Sustainable managementis assumed to generate these cash flows over an infinite series of cycles.
FIGURE 15: FUELWOOD PLANTATION CASH FLOWS
+HB +HB
-PC -PC
where: PC = planting cost each R years
HB = harvest benefits each R years
Soil Expectation Value Calculations:
The Faustmann formula uses asset valuation logic to attribute all future costs and revenues (from an infinite series of identical cycles) to the fixed productive asset: one particular kanal of bare forest land. The calculated land value is alternatively labeled Soil Expectation Value (SEV) or Land Expectation Value (LEV). The term forest rent is often encountered in the forest valuation literature, but this is a non-discounted procedure that is obsolete and causes wealth dissipating decisions.

26
SEV = - PC (1+i)R + HB (1+i)R - 1
where: i = interest or discount rate
R = R-year reentry cycle
Caveat on Valuing Forest Land Assets:
The forest land that we will value is rarely vacant as the SEV formula assumes by definition. Near term cash flows may not be generated by bare land alone, they may come from alreadyestablished inventory. This is particularly the case where SEV mathematics is applied to selection silviculture. In addition,there may be costs of converting existing vegetative cover from one status to another. Therefore, an estimated asset value'Rs./kanal from planned future harvest benefits is probably the value of a mixed forest asset, rather than of bare land alone. An estimated NPV for the case in the figure below includes both the value of a bare kanal of land (SEV) plus the investment value of an initial distribution of growing stock.
FIGURE 16: NATIVE FOREST CASH FLOWS
+RB +HB
-PC
where: PC = planting cost each R years RB = residual stand benefits in N years
followed by: HB = cyclic harvest benefits each R years
One of the most common errors in using valuation to guide management decisions is to compare unlike asset values. For example, discounted returns from an established stand can not be compared directly to those from a new plantation alternative. In a variation of the second valuation question: Where do I put myforest investment budget to get the highest change in wealth?, the asset valuation bases must be identical or standardized before correct comparisons can be made. One may not compare unlike asset values directly for management decision purposes. Techniques such as incremental analysis can be used to allow comparability.
27
Which Calculated Land Value is Market Land Value?
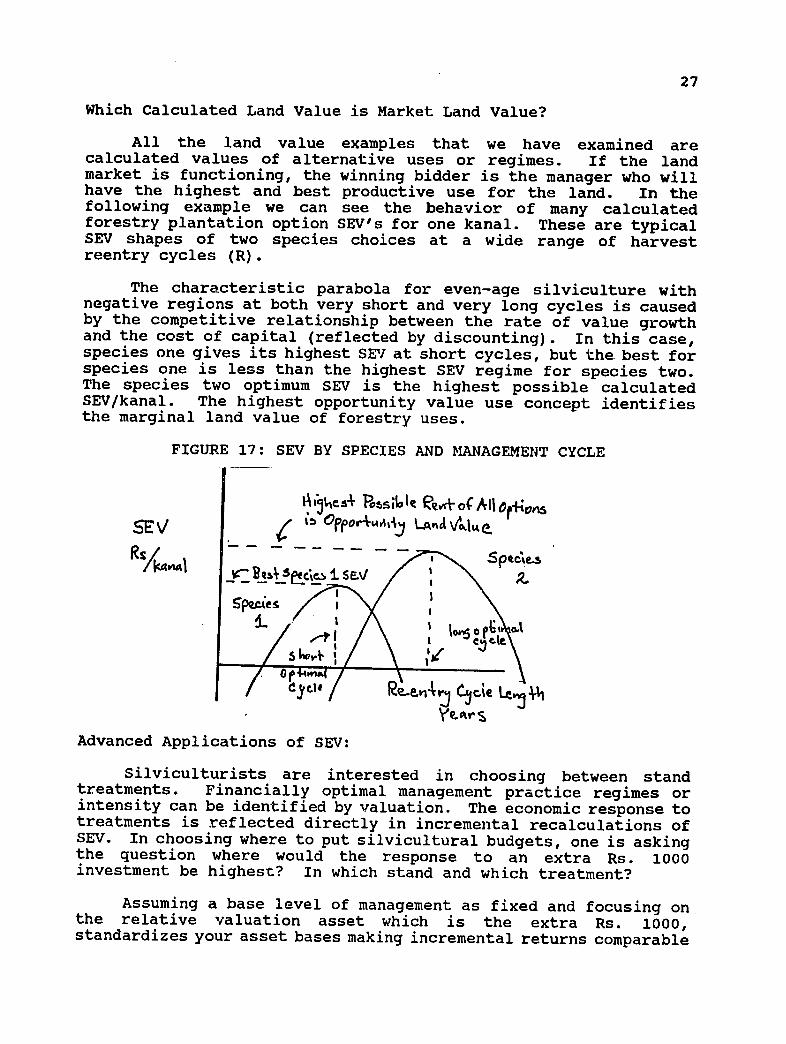
All the land value examples that we have examined are calculated values of alternative uses or regimes. If the land market is functioning, the winning bidder is the manager who will have the highest and best productive use for the land. In the following example we can see the behavior of many calculated forestry plantation option SEV's for one kanal. These are typicalSEV shapes of two species choices at a wide range of harvest reentry cycles (R).
The characteristic parabola for even-age silviculture with negative regions at both very short and very long cycles is caused by the competitive relationship between the rate of value growthand the cost of capital (reflected by discounting). In this case,species one gives its highest SEV at short cycles, but the best for species one is less than the highest SEV regime for species two. The species two optimum SEV is the highest possible calculated SEV/kanal. The highest opportunity value use concept identifies the marginal land value of forestry uses.
FIGURE 17: SEV BY SPECIES AND MANAGEMENT CYCLE
Ib.s- pstle eliveof All014n
Opporwiiij LAAV0 jtE ,tz
Ree!v %Cre Le, %1
Advanced Applications of SEV:
Silviculturists are interested in choosing between stand treatments. Financially optimal management practice regimes or intensity can be identified by valuation. The economic response to treatments is reflected directly in incremental recalculations of SEV. In choosing where to put silvicultural budgets, one is askingthe question where would the response to an extra Rs. 1000 investment be highest? In which stand and which treatment?
Assuming a base level of management as fixed and focusing on the relative valuation asset which is the extra Rs. 1000, standardizes your asset bases making incremental returns comparable
28
(assuming the feasibility of the base asset is not compromised). A budget allocation to silviculture can then be distributed bycomparing the incremental rates of return to Rs. 1000 extra investment in various different treatments performed on entirely different stands.
The implications of risk and uncertainty in both the assumed financial and- biological expectations of SEV analysis cause significant changes in optimal forest investment behavior. For an estimated future cash flow, the analyst can also estimate a distribution or a range of probabilities, these can be used to adjust expectations to a probable (or expected) amount and a certainty equivalent for that amount. Often the simplest solution is sensitivity analysis, to recalculate the SEV's of options using high range and low range expectations. SEV's will certainlychange, but if the optimal choice does not change, the managementdecision is insensitive to the variability.
There are analyses for forest investments as nonrenewable resources, and for when current management affects future productivity. One of the more useful analyses is residual stand valuation where the valuation of mixed land and stand assets allows foresters to simultaneously evaluate treatments to existing timber stands interactively with replacement stand decisions. Usually the evaluation of optimal harvest timing for the existing stand and optimal intensity of cutting it can be solved simultaneously.
Joint production valuations are extremely useful for designingproduction regimes for products that may be simultaneously produced in variable proportions from a single land base.
A forester soon discovers that a ste nd analytical focus is insufficient. In a forest, the sum of independent stand optima rarely equals the forest optimum because of interactions in management, biology and, markets. Modern forest managementdecisions will compromise individual stand optima to achieve greater returns to interactive decisions at the whole forest level. The models for this analysis typically use an aggregate valuation criterion. The methodology of even the most sophisticated models is merely a mathematically expansion of the same valuation logic presented here. Beyond forest decisions, strategic policy changeeffects for a sector or a nation can be evaluated with the same valuation mechanics and only slightly different criteria.
These subjects are all covered in advanced valuation courses.
Land Use Allocation versus Land Use Planning:
Any society uses some combination of private decisions and societal control to determine the pattern of land use. Below are the two extremes.
29
1. Land Use Allocation-- All private decisions of how to use individual parcels based independently on the relative financial land values.
2. Land Use Planning-- A government centrally specifies restricted land use options based on alternative criteria.
There are times when the private market land use or location decision is not socially optimal or even socially acceptable. For example, a pig farm would probably not be permissible in Peshawar neighborhoods even if it was profitable. The fact that most societies rely on a mix of land use allocation and control recognizes that markets do not always perfectly reflect all social values.
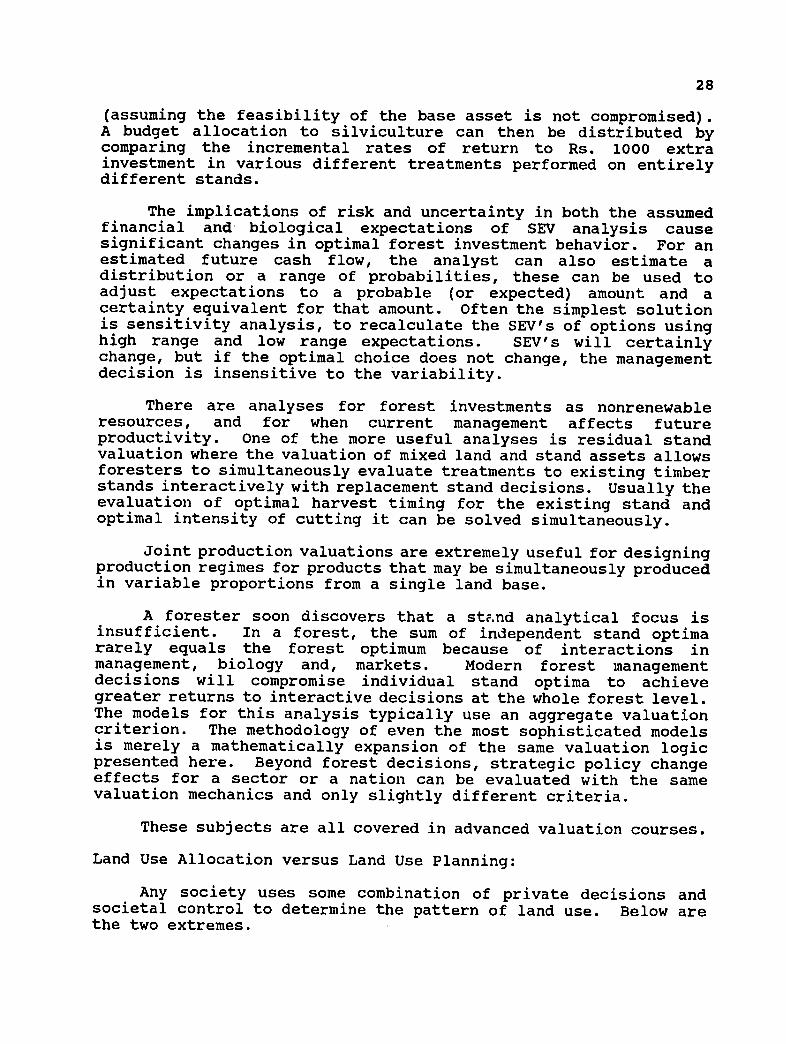
Zoning is a common governmental process that limits land use allocation options. Although not heavily practiced in Pakistani towns (e.g. zoning could prohibit factories from locating between houses), it is commonplace in public forests. There are clear legal boundaries between forest use and non-forest. There are dedicated special purpose forests for wildlife protection or watersheds. In this zoning, a biological criterion often supplants a financial or economic one.
FIGURE 18: LAND USE ALLOCATION UNDER ZONING
I< #eCneiirsAo(tceic '"' z Econo , &
Valuation and Shadow Pricing in Imperfect Markets:
We have talked about valuation in the simpler perfect market cases. The zoning example suggests that some resource markets ignore or distort value factors. Where cash markets do not exist for intangibles, or social benefits and costs are known to occur, unknown values must be imputed or distorted values must be
30
adjusted. Some markets are either biased or nonfunctional for private decisions about commodities, or may be nonexistent for intangibles. When markets structurally malfunction, the apparentmarket price is biased and does not reflect marginal value. In barter markets, transaction values exist, but are not clearlyobservable, and must be calculated from other known values.
What is a Shadow Price?
Shadow price is an imputed value rather than the observed market price we normally collect as valuation data. A shadow price is calculated to represent the true opportunity cost of producing or consuming a commodity--usually in marginal terms. There are a large number of shadow price estimation techniques and the appropriate mechanism depends on how the market has failed and what you are trying to represent.
Biased Values from Imperfect Competition:
Monopoly (single seller) or monopsony (single buyer) markets are distorted and market prices are controlled by one-sided buy or sell decisions. In many natural resource commodities, public sector monopolies are intentional. In Pakistan, the GOP owns virtually all of the native forests. Except for imports and illegal logging, their harvest rate decisions control certain wood markets.
The overall problems with monopolists are a loss of net social welfare due to output restrictions and loss of production efficiency due to a protected status. Our primary interest is in valuation of resources. In public forest monopolies, that can go two ways, either of which distorts marginal value to society. For forests output control is usually by setting annual allowable cut (AAC) levels unrelated to the economic capacity of the forest.
1. Governments can overinvest in forest management or underinvest in retained inventory so that AAC exceeds socially optimal production. Market price will be biased downward.
2. Or governments may fail to invest in regeneration or overprotect existing inventories. Reduced AAC biases market prices upward.
A supplementary difficulty with uneconomic AAC's is that policy-induced changes often occur suddenly, and in a fashion unrelated to economic conditions, causing excessive sectoral adjustment costs. Panic restructuring causes temporary price fluctuations that do not reflect societal wood values either.
31
Natural Monopolies: A Special Case
In some natural resources there are increasing returns to scale which cause average costs to be higher than marginal costs. This implies operational losses for the monopolist producer at the size of operation appropriate for society. Marginal costs are the normal operating :efficiency reference point, but here the profitmaximization catechism breaks down. Average cost pricing can minimize losses. Subsidy is also used in Ramsey pricing schemes. The resource value is not equal to the price charged.
Underemployed Resources:
Normally, we consider production resources to be fullyemployed, so that new projects must lure the factor at the factor's full value of marginal product. There are societies, and Pakistan may be one, where structural underemployment exists in labor. In excess supply markets, the marginal price we pay for labor at the margin approaches zero.
Normally in economic efficiency analysis, employment is considered a cost of production and number of jobs created is an irrelevant factor. Labor is considered a cost of production at the opportunity wage rate even if these rates are very low. However, in the special case of underemployment, societal welfare implies zero social cost of employment if no other employment is possible at any wage. Although labor excess lowers market marginal price to zero, social benefit occurs from new employment opportunity. Taxes and new salaries become transfer payments. This is an unusual case.
Non-marginal Price Changes:
Market values are marginal values and they are onlyrepresentative of values within a narrow range of existing market conditions. Frequently, sweeping public policy is super-marginal. That is, the size of the market perturbation pushes equilibriumoutside of a normal range. For example, if GOP banned all loggingin old growth forests, for a long time the effect on timber supplywould not be accurately reflected in log markets. The supermarginal shift itself changes the structure of the sector, the product market and the character of marginal price. Some of the redistribution effects are counter-intuitive as well, particularlyin stumpage markets where demand can be very inelastic.
Taxes, Subsidies and Price Controls:
These market interventions almost all distort market behavior and apparent marginal values. In many cases, that is the intent, when they are designed as market correction mechanisms. To the extent that the interventions are small and long-standing,resultant market equilibrium values are directly used for valuation
32
anyway, as they will be more accurate estimates of value than anyartificially estimated proxy. Large or new interventions are exceptions.
Taxes are often treated as extractions from a particular sector, however, the incidence of taxes can be surprising. For example, a tax levied on loggers of public forests could actuallybe paid by lower bids for public forest timber. The new bids would represent the new marginal value of the wood after taxes.
The GATT international trade talks have demonstrated that agricultural subsidies cause world wide implications and can lower agricultural production incentives in developing nations.
Controlled prices are rarely the relevant value to use in public project analysis. With knowledge of the appropriate demand and supply elasticies they can be adjusted appropriately. Ceiling prices must be adjusted up, price floors adjusted down to represent marginal values.
Where Cash Markets Don't Exist--Barter Economies:
Relevant value in a barter economy is a matter of comparison.Own family farm labor frequently falls into this category. We assume that the farmer has an opportunity value of the labor he uses on his farm. Instead of zero, we impute a value equivalent to what he could earn elsewhere. With goods such as fuelwood, the value is often presumed to be the cost of an alternative form of energy with the same BTU yield.
Where Market Prices Don't Exist: Externalities
Externalities are effects that are unintended as a result of consumer and producer market action. These are often called thirdparty effects. Externalities can be positive or negative with technical effects on other peoples decisions.
Positive technical--- indivisible goods or intangibles such as public benefits of education and amenity value of a scenic vista of the Himalayas.
Negative technical-- social costs that affect others e.g. wood smoke and dust pollution in Peshawar.
Notice something odd about these problems--they all involve violation of market assumptions--usually common property or lack of property rights. The estimation of social optimum often involves a process called internalization.
33
Where s*.reams are polluted, they are often overvalued for garbage disposal by a few polluters, but the value of clean water to the public is undervalued. Internalization asks: "How would the decision change if the same individual held both the right to pollute and the rights to clean water?" If polluters faced the costs of their own garbage, we can presume that the marginal value would shift toward cleaner water, but not to completely pure water because the dumping use value still remains. This process is badly complicated by measurement problems.
Biased Values From Ignored Non-market Social Costs or Benefits:
An economic analysis is more inclusive than the financial analyses that we have seen so far as examples. There are effects of fuelwood production and consumption that are not considered bythe individuals growing it or burning it, yet clearly do affect the well-being of the society. For example, social benefits of fuelwood use could be increased retained soil fertility because wood users do not use dung and straw for energy. An example social cost could be increased erosion from fuelwood gathering and or smoky air pollution causing lung diseases.
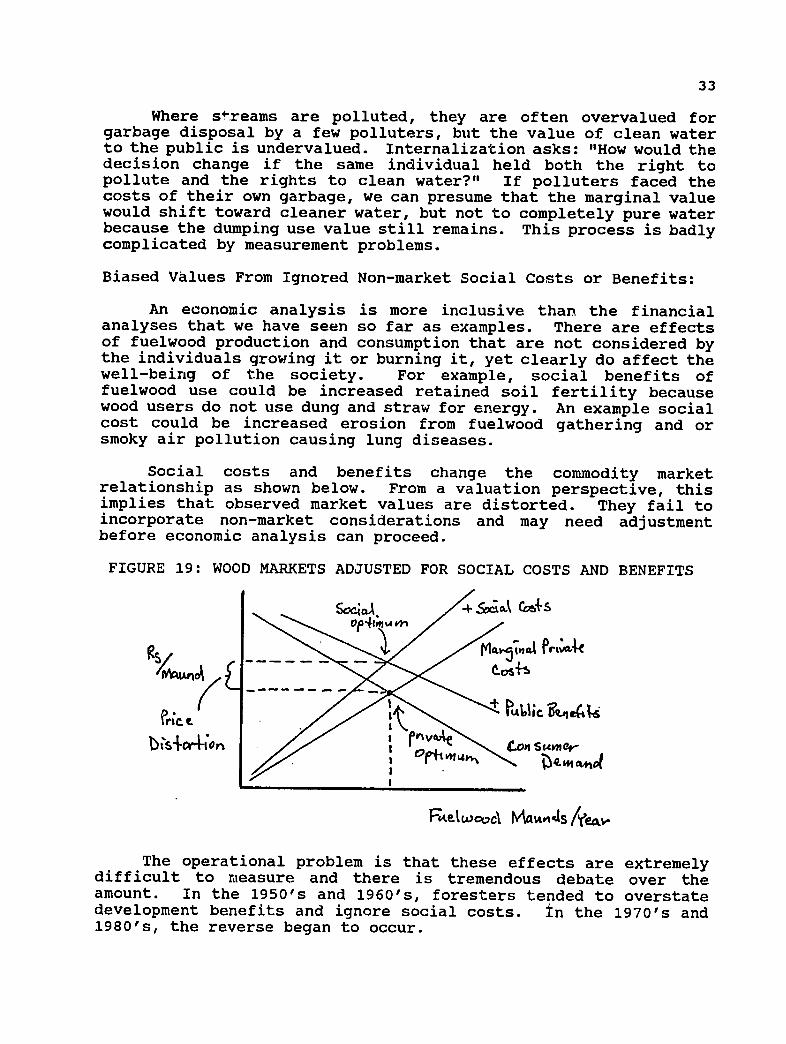
Social costs and benefits change the commodity market relationship as shown below. From a valuation perspective, this implies that observed market values are distorted. They fail to incorporate non-market considerations and may need adjustment before economic analysis can proceed.
FIGURE 19: WOOD MARKETS ADJUSTED FOR SOCIAL COSTS AND BENEFITS
b~sCon SuM4-
The operational problem is that these effects are extremelydifficult to measure and there is tremendous debate over the amount. In the 1950's and 1960's, foresters tended to overstate development benefits and ignore social costs. In the 1970's and 1980's, the reverse began to occur.

34
Theory does tell us several qualitative relationships.
1) that the socially optimal marginal value in the normal case could be higher than the market price (from including either costs or benefits).
2) that social costs could make the socially optimal consumption lower than market conditions.
3) that social benefits could make the socially optimalforest investment higher than market conditions.
An artificially higher price will both curb demand and stimulate the installation of woodlots. This is why governmentsoften tax consumption and transfer that income in the form of subsidies (or reduced other costs) to woodlot owners. The problem with transfer taxes set in one sector is that they influence others. In the fuelwood example, the tax creates an intentional disequilibrium. Unintentionally, a transfer tax shifts people to other sources of energy. It could at the same time oversupplyfuture fuelwood market in subsequent periods increasing the distortion and shift people into illegally gathered wood.
Mitigation Values of Negative Externalities:
Fuelwood plantations are reputed to shift rural farmers out of dung and straw burning which lowers agricultural fertility and yields. The extent that the provision of fuelwood increases soil fertility as reflected in the increased value of agriculturalproduction, is a mitigation shadow value of fuelwood. It is added to the direct market value of the fuelwood to reflcct societal marginal value.
Valuing Intangibles and Social Benefits:
Aesthetic and recreation values are problematic. Often market values do exist for such intangibles. There is willingness to payfor a view of Mt. Everest, or the recreation value of ibex hunting or animal park visiting. However, there is debate whether these markets are functional.
A more difficult intangible value to estimate is optiondemand. This is a willingness to pay for something to keep it in existence even if a person knows he will never consume (or even see) it. Option demand reflects the social value of knowing that a resource continues to exist. A good example might be the Chinese panda which has become the symbol of the World Wildlife Fund.
There are three valuation techniques that have varyingapplicability to intangibles. Although markets may exist, particularly where subscription funded NGO's focus on intangibles, market values are typically unreliable.

35
The two remaining common methodologies estimate shadow prices. These are the Contingent Valuation Method (CVM) or the Travel Cost Method (TCM). Both techniques first estimate a proxy demand function. By further assuming that mean willingness to pay reflects marginal value, both techniques make restricting assumptions about supply and the non-substitutability of one amenity for another.
Contingent Value Method:
CVM is a survey method where people are asked directly about their willingness to pay. For recreational valuation, at the gate surveys capture visitors' stated valuations and general population surveys capture option demand for the site. Problems include the inability of most of the population to relate to trade-offs in Rs. terms. Sometimes people lie if they think the answer will change policy. Reactions may be temporary and depend on the current newsworthiness of the site. There is also the reality problem of unlimited mental budgets for expenses that will never come from pocketbooks. Psychologically too, there will be differences between questions of how much compensation is required to give up a known right, versus how much they would be willing to pay to acquire the same right.
Travel Cost Method:
TCM assumes that consumers would react the in same way to a change in gate access prices (a marginal entry value) as they would to a change in the costs of getting there. Actual visitors to a site are surveyed to determine the amount that they actually did pay to visit it. Normally, this includes only actual out of pocket costs, even though income forgone while traveling is a major opportunity cost. Other weaknesses include: the fact that travel can be non-site specific including multiple stops, and that the act of traveling itself may have as much value as any specific site where the survey occurs.
Social Optimality Criteria:
In financial project analysis we were using valuation to weigh individual actions and cash returns and we were not interested in other considerations. The entire premise of net social benefit analysis is the achievement of societal economic efficiency. In project analysis we usually assume that all individuals, regardless of who or where they are, are identical.
In decisions about increasing social welfare we judge public resource projects by one of two criteria: Pareto optimality or Kaldor/Hicks optimality.
Pareto optimality holds: if you can make one person better off without making another worse off, the action increases net social
36
welfare. In this case, analysts don't care who gains as long as no one gets hurt.
Kaldor/Hicks optimality holds: if you can make personone better off to the extent that he could compensate those made worse off, regardless of whether compensation actually occurs, the action increases net social welfare.
Often the equality premise does not hold and projects are not judged solely on their efficiency. Sometimes it is a publicdecision maker's explicit intent to redistribute the wealth of society through forestry projects. An economic analyst must be prepared to identify the distribution of who gains and loses from projects. This adds an additional dimension to the valuation question.
Economic Distribution Analysis:
In social welfare analysis, analysts were interested in social efficiency and distribution was assumed uniform or ignored. Think of it as baking the most chupattis for the amount of ingredients we have. In economic distribution analysis, society (or its decision makers) is interested in who gets chupattis, sometimes to the extent that we would be satisfied with fewer, as long as the rightindividuals get them.
There are many situations where distribution is the point of public economic decisions, particularly in natural resources. For example, projects may be designed to tax the rich and aid the poor(or vice versa); projects can be targeted to consciously replace one industrial sector with another (gas versus fuelwood); some communities, social castes or religious sects may be targeted over others; and in natural resources we often make investment decisions based on sacrifices of one generation with returns to another.
In net social benefits analysis, we purposefully ignoredsecondary benefits, e.g. the shifting of tourists' purchases of soft drinks from Lahore to Peshawar is not new Pakistani gains in economic activity from developing tourism. The Peshawar gain is offset by Lahore losses. Economic distribution analysis attempts to measure the extent of redistribution whether this shift is intentional or happenstance.
The primary impact analysis tools are community base analysisand input/output tables. The valuation units are either in sector income terms or employment. Both units include and consider three types of distribution: a) direct employment or income due to project activities, b) indirect sectors which transact with the sector being adapted, and c) induced changes caused in the generallevel of economic activity.
37
Social welfare analysis has not yet solved the largest remaining valuation question of all, how to measure or otherwise estimate the non-market social preferences for redistribution.
Endnote:
The subject of forest valuation is richer and more involved than I have presented here in our few lectures. As noted in the preamble, I assert that valuation is the guts of financial and economic decisions to make natural resource management more efficient and to increase the welfare of society. I hope the reader is stimulated to cultivate a broader knowledge of this important subject.
We have studied resource valuation only long enough to graspthat many natural resource decisions depend as much (and often more) on astute estimation of the value of resource alternatives, as on the biological knowledge for which foresters are traditionally known.
This is an important subject in which Pakistan Forest Institute could enhance its academic and research capabilities.During his or her career, a Pakistani forest officer will be called on to efficiently manage, rationally allocate and effectively conserve a wide variety of immensely valuable Pakistani natural resource assets. All these officers train at PFI.

38
NATURAL RESOURCE ECONOMICS RESOURCE VALUATION EXERCISES
The class has been split into numbered groups. Each groupshould first elect a leader to organize your group and then performthe research project below assigned to your group number by theprofessor. Perform the specified analysis. Part of the exerciseis learning more about a specific technique than the whole classcovered generally. To do any one of these tasks will requirebackground reading beyond the subject summaries covered in lecture, so be sure to cite any additional references.
Your group should submit a report of your findings no longerthan 10 pages. An executive survey of your findings will bepresented orally to the class. In addition, each group is expectedto review and critique reports from two other groups. The reportsand critiques will be ranked by quality and all members of the group will receive the same grade.
1. LAND USE ALLOCATION PROJECT:
Obtain a map of the Peshawar valley. Explore the market forcommercial, industrial, residential, agricultural, pastoral,forested and open real estate. Test the Von Thunen and Ricardian land value theories in a local application. Pick one quadrantfrom the center of the old city (e.g. the Northeast quadrant),sample the sales evidence in various neighborhoods and draw land(not land plus building) value contours measured in 10 thousands Rs./kanal. Explain the pattern or lack of pattern that youdiscover.
2. TRANSACTION EVIDENCE APPRAISAL PROJECT:
Visit at least ten local retail fuelwood wood yards and surveythe current prices of fuelwood. For the two most common speciescollect sales prices for all the grades of fuelwood that are offered. Use your data base for TEA of fuelwood using twotechniques: a) simple means to predict fuelwood value and variance,and b) use multiple regression to determine whether speciesdifference (a dummy variable) and number of pieces/maund (acardinal variable) are significant determinants of value.
3. VALUE GROWTH CALCULATION PROJECT:
Use the wholesale Changa Manga sales depot prices for gradesof shisham timber and fuelwood in the most recent reported year(see Pakistan forestry statistics). From yield and tree volumetables estimate the volume of each product and grade in an averageshisham tree on a known productivity site for a tree of age 10, 20,30, 40, and 50 years. Determine the value growth of shisham inRupees over time, and in discounted values over infinite cycle ofshisham harvests for the same time periods.
39
4. REST DUAL VALUE COST ESTIMATION PROJECT:
Pick a single kanal of mature PFI Eucalyptus plantation.Identify how you evaluated its maturity. Estimate the volume andquality of products present in the standing trees and their local market values. From the Pakistan forestry literature and interviews with loggers, truckers, and wood agents, identify each type of cost involved in logging those trees and selling them inthe appropriate market. Estimate each of those cost components andcalculate the RVA stumpage value. Calculate the variance in yourstumpage value estimate.
5. SHADOW VALUE OF FUELWOOD USE PROJECT:
Fuelwood availability displaces dung and straw use in ruralhousehold energy needs. One social benefit of fuelwood plantationsis said to be that grain field fertility increases if straw and dung are left as organic material. Test this premise. Estimate how much straw and dung would be displaced by the annual fuelwood productivity of a kanal of Eucalyptus plantation. From the energytechnical relationship, and the fertilizer biological relationship,estimate the present value of increased grain crops produced from this increased field fertility.
6. EQUIVALENT ENERGY SUBSTITUTION PROJECT:
Estimate household energy substitution. Calculate the current average cost of a BTU of fuelwood compared to BTU's of alternativehousehold fuels including, kerosine, electricity, coal, charcoal and gas. Estimate the necessary cost change to shift a marginalfuelwood user from existing wood use to each of the alternatives. Make sure you consider the cost of conversion of the stove necessary to utilize the new energy source. Discuss non-pricefactors that would affect this change.
7. LUMBER VALUE RECOVERY PROJECT:
Visit a local sawmill where solid wood products are producedfrom Pakistani conifers. Pick five large logs that are beingmilled. Measure the initial log and the board recovery by gradeand size. Compare the value of product recovery by product value class to the cost of the log raw material. Through a time study of the milling process, estimate the average labor and capital costs of conversion from log deck to green stack for each log.
8. LAND USE VALUATION PROJECT:
Use the income approach to land valuation to help a small farmer decide which use to put a kanal of irrigated barani land.Demonstrate the proper analysis for an annual grain crop and a cropof propwood poplar cut on a six-year coppice cycle.
40
9. VALUE CHANGE OVER TIME PROJECT:
Choose a specific Pakistani wood product for which there are good historical price statistics for at least 30 to 40 years (egdepot sales of high grade deodar scants or retail fuelwood).Convert nominal prices to real (net of inflation) prices. Chart your real price results and explain the trend and any largevariability around that trend. Using linear or exponentialregression P = f(time) over the whole trend to predict productprices for the year 2000. Refit your regression using data from only the last decade and make the same extrapolation to the year2000. Explain your predictions and discuss alternative indicators of future wood use.
10. TRAVEL COST ESTIMATION PROJECT:
At the Zoological Park in Lahore, or an equally prominentPeshawar site that attracts local use and tourists, interview asmall random distribution of visitors at the front entrance (40-50) on a given weekday. Prepare a short standard questionnaire that inquires where the visitor is from, how often he/she visits thissite, the transportation mode, other costs of travel (hotel, food or gasoline), and the other sites visited during this trip.Calculate a proxy demand curve.
11. CONTINGENT VALUE ESTIMATION PROJECT:
Determine the distribution of income classes in NWFP. Designa sample of Peshawar citizens weighted by income class. Interview a small distribution (40 to 50) of these citizens to find out their willingness to pay, to be taxed, for the establishment and annual maintenance of a Khyber Pass National Historical Park. Use yoursample to expand your income class results into an estimate of a contingent value demand curve for such a park. Calculate averagedemand per capita as a proxy for marginal value. From your income data, hypothesize how much the option demand would increase as percapita income rises.