Embed Size (px)
Citation preview
1
Preparation of Bricks using Construction and Demolition waste and Sludge
A Thesis submitted in partial fulfilment
For the requirement of the degree of
Bachelor of Technology in Civil Engineering
By
Homan Jamuda
Department of Civil Engineering
National Institute of Technology, Rourkela
2014

2
Preparation of Bricks using Construction and Demolition waste and Sludge
A Thesis submitted in partial
fulfillment for the requirement of
the degree of
Bachelor of Technology in Civil Engineering
By
Homan Jamuda Roll No. 111ce0038
Under the supervision of
Prof. Kakoli K. Paul
Department of Civil Engineering
National Institute of Technology, Rourkela

3
CERTIFICATE
National Institute of Technology
Rourkela
This is to certify that the project entitled "Preparation of bricks using
construction and demolition waste and sludge" presented by Homan Jamuda,
Roll No. 111CE0038 in incomplete satisfaction of the necessity of the
recompense of Bachelor of Technology degree in Civil Engineering at National
Institute of Technology, Rourkela is a genuine work completed by him under
my watch and direction.
To the best of my insight, the matter epitomized in the theory has not been
submitted to any other college/Institute for the recompense of any Degree or
Diploma
Date: (Prof. KAKOLI K. PAUL)

4
ACKNOWLEDGEMENT
It offers me a great pleasure to thank and offer appreciation to each and every
one of those people who have specifically or by implication helped me through
the course of this study. This undertaking would have never been finished
without the commitment of those individuals.
Unfortunately, the long list of acknowledgement, regardless of how extensive
is constantly fragmented and lacking. To be sure this page of notice should
never have the capacity to touch the generousness of the individuals who
tendered their assistance to me.
As a matter of first importance I wish to express my profound feeling of
appreciation and obligation to Prof. K.K.Paul, Department of Civil Engineering
- N.I.T, Rourkela for appointing me the undertaking " preparation of bricks
using construction and demolition waste and sludge " and for her motivating
direction, helpful feedback and significant proposal all through this venture. I
also want to extend my appreciation to every one of my companions and
senior understudies who have constantly empowered and bolstered me in
doing this work. I might want to thank all the individuals from Department of
Civil Engineering who have dependably been agreeable with me.
Last however not the slightest I might want to thank the writers of different
examination articles and books that I alluded throughout this undertaking.
Homan Jamuda (111CE0038)
Department of Civil Engineering
National Institute of Technology
Rourkela – 769008

5
CONTENTS
ABSTRACT ....................................................................................................................... 8
1 CHAPTER 1: INTRODUCTION………………………………………………………………...9.
1.1 Introduction ..................................................................................................................... 10
1.2 Importance of Construction & Demolition Waste ............................................ 10
1.3 Importance of SLUDGE……………………………………………………………………..11 1.4 Advantages of it over a normal brick ..................................................................... 12
2 CHAPTER 2: LITERATURE REVIEW……………………………………………………13
3 CHAPTER 3: OBJECTIVE ....................................................................................... 17
4 CHAPTER 4: METHODOLOGY……………………………………………………………..18
4.1 Flow chart ....................................................................................................................... 19
4.2 Sample Preparation...................................................................................................... 20
4.3 Physical Properties Test ............................................................................................. 20
4.3.1 Compressive strength test…………………………………………………………20
4.3.2 Bulk Density .......................................................................................................... 21
4.4 Chemical Properties Test ............................................................................................ 21
4.4.1 pH TEST................................................................................................................... 21
4.4.2 Water Absorption ............................................................................................... 22
4.4.3 Presence of Heavy metals ............................................................................... 22
5 CHAPTER 5: RESULT & DISCUSSION…………………………………………………..23
5.1 Physical Properties Test ............................................................................................... 24
5.1.1 Compressive Strength Test ……………………………………………………….24
5.1.2 bulk density ............................................................................................................ 25
5.2 CHEMICAL PROPERTY TEST ...................................................................................... 29
5.2.1 pH TEST .................................................................................................................... 29

6
5.2.2 Water Absorption ................................................................................................ 30
5.2.3 CHEMICAL COMPOSITION ............................................................................... 33
6 CHAPTER 6: CONCLUSIONS………………………………………………………………..35
REFEREENCES ............................................................................................................................ 37
LIST OF TABLES:
TABLE
NUMBER TABLE NAME PAGE
Table 1: Methods used for testing the properties of brick 14
Table 2: Results of the Compressive Strength Test 24
Table 3: Table for Bulk Density for 30% Sludge 26
Table 4: Table for Bulk Density for 40% Sludge 27
Table 5: Table for Bulk Density for 50% Sludge 28
Table 6: Table for pH results 30
Table 7: Table For pH content for various Sludge 30
Table 8: Table For water absorption %age for 30% sludge content 31
Table 9: Table For water absorption %age for 40% sludge content 31
Table 10: Table For water absorption %age for 50% sludge content 31
Table 11: chemical composition of sludge 33
Table 12: chemical composition of clay 33

7
LIST OF FIGURES:
FIGURE
NUMBER FIGURE NAME PAGE
Figure 1: Flowchart of the process involved 19
Figure 2: Compressive strength variation 25
Figure 3: Bulk density Variation 26
Figure 4: Figure for Bulk Density for 30% Sludge 27
Figure 5: Figure for Bulk Density for 40% Sludge 28
Figure 6: Figure for Bulk Density for 50% Sludge 29
Figure 7: Figure for water absorption 32

8
ABSTRACT
The disposal of sewage wastes comprises as one of the major worldwide environmental
problems as these wastes render the environment unfriendly. The growing demand for waste
utilization has made solid wastes like sludge and demolition waste an essential composition of
this study. The possibility of reduction of the production costs provides a strong logic for use of
this waste.
Generally sludge, bio degradable materials are dumped in the land, and they decompose over the
period of time. This study involves the usage of sludge, construction and demolition waste as an
essential ingredient. The sludge was checked for its physical characterization such as bulk
density, compressive strength and chemical properties such as water absorption percentage,
presence of toxic metals such as Pb, Zn, Cu and Fe for the commercial purpose. The study was
performed by using different ratios as 3:2:2:3, 3:2:3:2, 2:3:2:3 of fly ash, cement, sludge and
demolition waste respectively for making brick samples. The test results showed a common trait
that with the increase in content of sludge, the strength decreased. A maximum compressive
strength of 15.88 MPa was achieved for the ratio 2:3:3:2 and a minimum of 11.67 MPa was
achieved for 2:1:5:2, respectively.
Moreover the bulk density of the sample also decreased. A maximum of 2.61 g/cm3 was
achieved for a 30% sludge content and a minimum of 1.983 g/cm3 for a sludge content of 50%.
This was attributed due to the organic properties present in the brick. Moreover the water
absorption percentage increased with the increased sludge percentage. With a minimum of 0.22
% was achieved for 30% to a maximum of 0.28% for 50%.
Keywords: brick kiln, construction and demolition waste, curing, environment, sludge
9
CHAPTER 1
INTRODUCTION

10
1.1 INTRODUCTION
Construction and demolition waste are usually found whenever any construction or demolition
activity takes place such as construction of bridges, flyovers, roads etc. it comprises mostly of
inert and non- biodegradable material such as sand, gravel, concrete, metal, plastic, glass, etc.
Demolition wastes are heavy, bulky and have high density and take up loads of land and space.
So what if try recycling of these wastes. [1]
These wastes can be used as landfill, base or sub base in road construction, embankment fill, and
railway ballast and most importantly in aggregate replacement method for the formation of
recycled concrete
Sludge as we know are the waste material from any source, be it Industrial Waste or Municipal
Waste. For waste water sludge or any other kind of sludge we know there have been many
attempts made to incorporate these wastes with other materials into the production of bricks, for
examples, rubber, limestone dust, wood sawdust, processed waste tea, fly ash and polystyrene
[1].
Utilization of sludge in making of light weight, artificial aggregate and cement like properties.is
a win win strategy as it not only recycles the waste product, but also alleviates the problem of
waste disposal [2]. Recycling such wastes by incorporating them into building materials is a
practical solution for pollution problem.
1.2 Importance of Construction & Demolition Waste
Construction and demolition wastes need to be handled and disposed of properly, so that the
aesthetics of the place is maintained. Landfill method is not the most efficient method for the
disposal, as precious land is used up as landfill site. Also, with the growing demand, landfill sites
are getting more difficult to manage. Development of a novel method for the disposal is required
so that these can be utilized as construction materials, thereby lowering the price of construction
and making low income housing possible [1].

11
The various importance of construction and demolition waste are as follows [3]:
Preserve the natural resources: so as to preserve the natural resources like fine particles
(river sand)
Shortages of dumping sites: The major important thing Land gets wasted due to dumping
of these wastes
Reducing the construction cost: and also to reduce the construction cost thus resolving
housing problems faced by the low income society of India.
Ingredients: The very basic solid coarser aggregates Ingredients are available already in
these waste.
1.3 Importance of sludge
On account of its high organic content and good wettability, sludge makes for an ideal additive
to the clay-shale mix of bricks. So the various importance of sludge are [4]:
In many ways sludge is the ideal additive to the clay-shale mix of bricks. How can that
be? Because it is an organic material with the added advantage of being wet. Organic
additives improve laying qualities of bricks.
From the mason's point of view, pure clay makes for a less-than-ideal brick. They
accepted mortar more readily, providing a suction that held the brick in place while the
mortar began to set.
Investigation showed that these bricks were lighter and slightly more porous, the result of
organic ``contaminants'' in the original clay. When fired, the organic material burned up,
leaving tiny voids throughout the brick.
It has become a common practice to include some organic materials in the clay mix [4]
For most though not all brickmaking. Sawdust and coal fines are commonly used,
according to Donald Agee, plant manager for the Maryland Clay Products brick
company, which has made approximately half a million of the experimental sludge bricks

12
Apart from making better quality bricks, an organic additive has several other important
advantages for brickmaking. Using such material lengthens the life of a brickmaking
plant. Clay is never brought to a brickmaking plant, the plant is sited where the clay is.
When we eventually run out of clay `the place shuts down.
It has proven most effective in restoring vegetative cover to mine tailings and other scars of the
Industry.
1.4 Advantages of it over a normal brick
The main advantages were related to the amount of energy saved and the environmentally
friendly way to dispose the sludge waste. They are as follows [4]:
Increased plasticity due to the fibrous nature of the waste added makes brick moulding
easier. So basically the workability of the brick mixture increases.
The advantages of incorporating the waste are reduction in mass due to the adhesive and
sticky nature of the sludge, lower water absorption value and shorter natural drying
process due to the presence of organic component.
The waste also saved the fuel due to the burning of the organic substances inside the
waste during the firing process. However, the physical properties have not been proven
as the experimental work only emphasised the mechanical properties.

13
CHAPTER 2
LITERATURE REVIEW

14
The very purpose of this literature is designing of a well composed commercially used
construction brick. Disposal of sewage again to the waterbodies raises the amount of aluminium
oxides in water, which has been linked to Alzheimer’s disease.
Studying the use of sludge (Chi-huang Weng et al, 2003) (Joo Hwa Tay, 1987) and (Badr El-Din
Ezzat Hegazy et al, 2012) the use of sewage treatment plant (STP) sludge in manufacturing of
constructional elements achieves both the economic and environmental benefits. Due to the
similar mineralogical composition of clay and STP sludge, this study investigated the complete
substitution of normal clay by sludge. From the obtained results, it was concluded that by
operating at the sludge content commonly, a no. of ratios was obtained and then the properties
were tested. The produced bricks properties were obviously superior to the 100% clay control-
brick in terms of strength and bulk density, but lacked good water absorption.
The brick made was according to the IS: 1077 – 1992 and IS: 2212 – 1991 norms. The properties
like Compressive strength and Bulk density were studied and taken from the references
mentioned by (Mahapatra, 2013)
Properties Method Used
Compressive strength B S 3921-74
Bulk Density Water Boiling Method
pH content pH meter
Water Absorption Water Boiling Method
Presence of heavy metals Atomic Absorption Spectrometer
Table 1: Methods used for testing the properties of brick
15
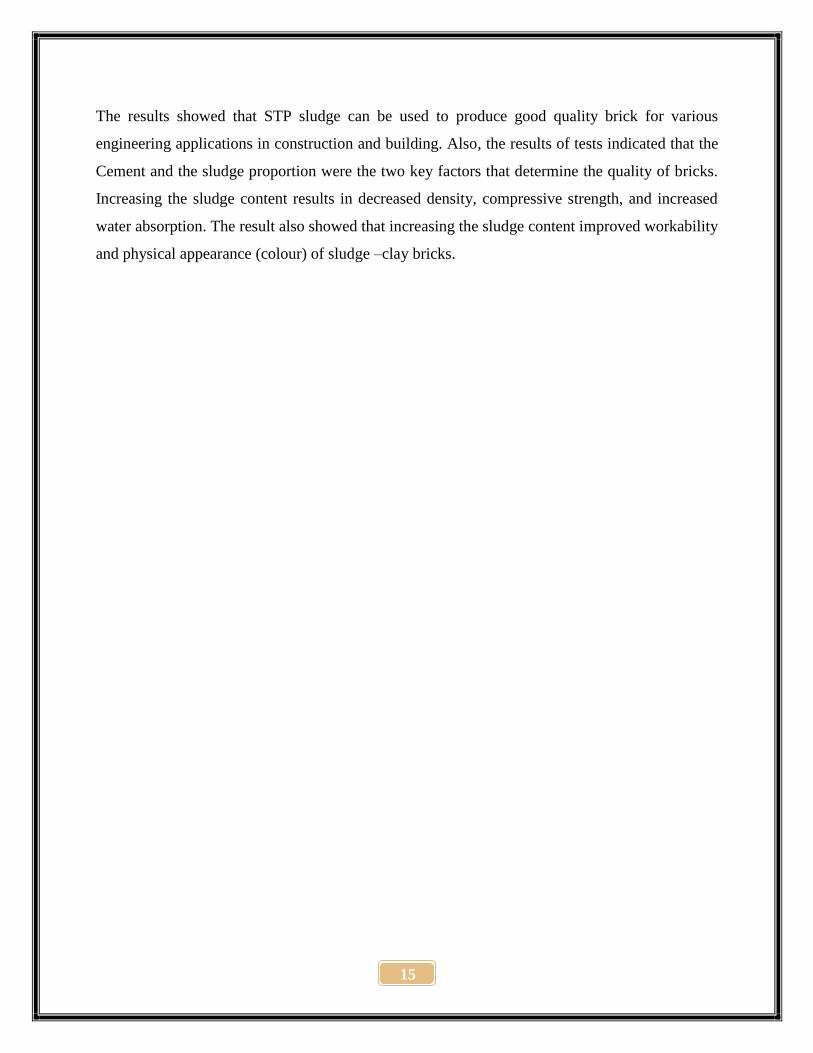
The results showed that STP sludge can be used to produce good quality brick for various
engineering applications in construction and building. Also, the results of tests indicated that the
Cement and the sludge proportion were the two key factors that determine the quality of bricks.
Increasing the sludge content results in decreased density, compressive strength, and increased
water absorption. The result also showed that increasing the sludge content improved workability
and physical appearance (colour) of sludge –clay bricks.

16
CHAPTER 3
OBJECTIVE

17
Objectives of the Study
To manufacture brick using sludge along with fly ash as a binding material and mixed
with construction & demolition waste in various ratios.
To compare the compressive strength, water absorption assigned by the Indian Standard
Specifications for load bearing bricks.
Comparison of the designed brick with traditional clay brick.

18
CHAPTER 4
EXPERIMENTAL
PROCEDURE

19
4.1 FLOW CHART
Figure 1: flowchart of the process involved
20
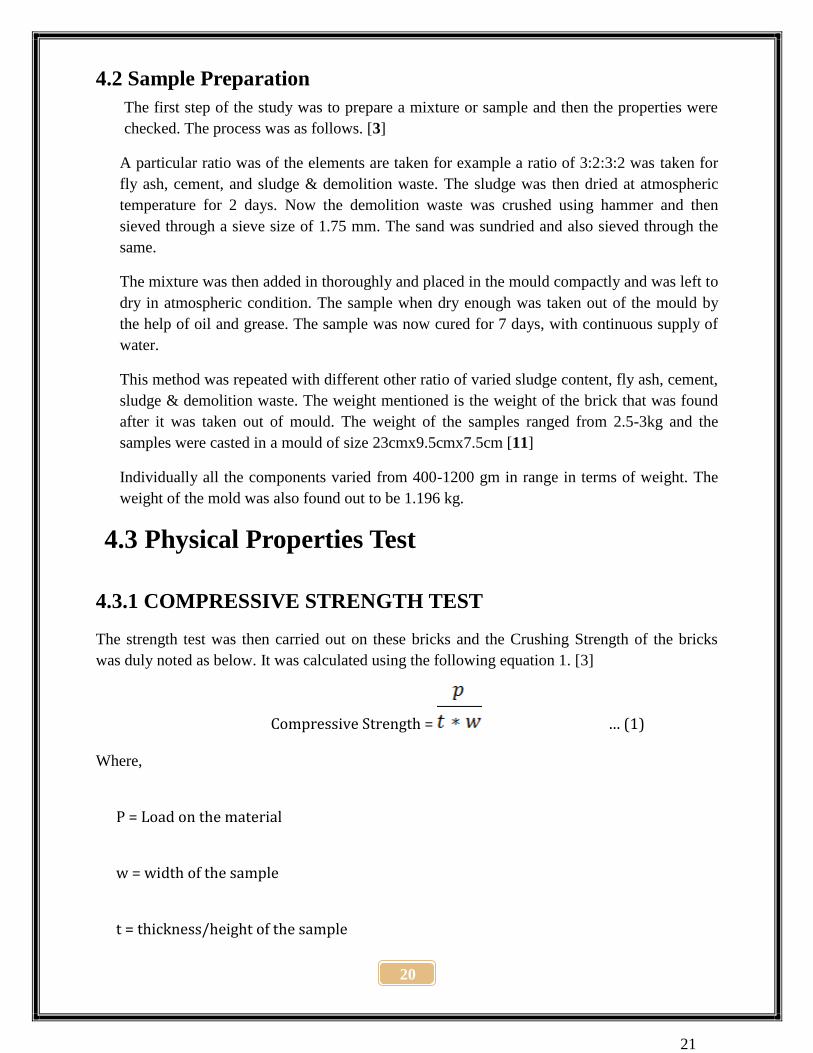
4.2 Sample Preparation
The first step of the study was to prepare a mixture or sample and then the properties were
checked. The process was as follows. [3]
A particular ratio was of the elements are taken for example a ratio of 3:2:3:2 was taken for
fly ash, cement, and sludge & demolition waste. The sludge was then dried at atmospheric
temperature for 2 days. Now the demolition waste was crushed using hammer and then
sieved through a sieve size of 1.75 mm. The sand was sundried and also sieved through the
same.
The mixture was then added in thoroughly and placed in the mould compactly and was left to
dry in atmospheric condition. The sample when dry enough was taken out of the mould by
the help of oil and grease. The sample was now cured for 7 days, with continuous supply of
water.
This method was repeated with different other ratio of varied sludge content, fly ash, cement,
sludge & demolition waste. The weight mentioned is the weight of the brick that was found
after it was taken out of mould. The weight of the samples ranged from 2.5-3kg and the
samples were casted in a mould of size 23cmx9.5cmx7.5cm [11]
Individually all the components varied from 400-1200 gm in range in terms of weight. The
weight of the mold was also found out to be 1.196 kg.
4.3 Physical Properties Test
4.3.1 COMPRESSIVE STRENGTH TEST
The strength test was then carried out on these bricks and the Crushing Strength of the bricks
was duly noted as below. It was calculated using the following equation 1. [3]
Compressive Strength = … (1)
Where,
P = Load on the material w = width of the sample t = thickness/height of the sample
21

21
4.3.2 BULK DENSITY
Bulk Density (B.D) was calculated for the following samples using the Archimedes’ principle.
The weights of the sample were taken (dry weight, D) and then this was followed by soaking the
samples in water. Soaking was done by Water Boiling method.
The weight of the samples suspended in water was taken (suspended weight, S) after which the
soaked weight (W) of the samples was measured. [4]
Bulk Density = ( ) * ρw … (2)
W = Soaked Weight
D = Dry Weight
S = Suspended Weight
4.4 Chemical Properties Test
4.4.1 pH TEST
The chemical alkanity or acidity of the bricks was tested with the help of a pH meter and the
results are as follows.
The dried sludge has pH values ranging from 6.10- 6.50 with an average of 6.30. The average pH
value for sludge ash is 8.00 with a range of 7.97-9.03. However, the clay samples are on the
acidic range; the pH is 4.40 with a range of 4.10-4.60.
A liquid solution of desired sample is prepared and then it was tested by dipping a cleaned pH
meter for about 13 second. The value was then recorded. [5]
22
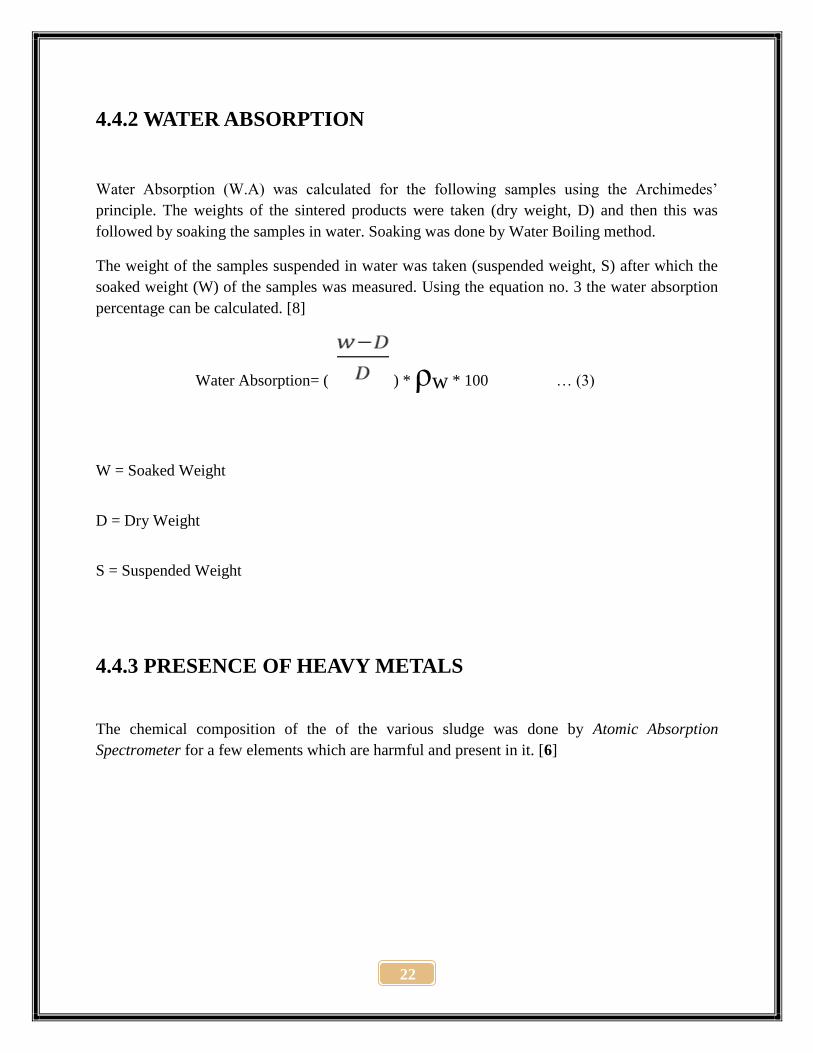
4.4.2 WATER ABSORPTION
Water Absorption (W.A) was calculated for the following samples using the Archimedes’
principle. The weights of the sintered products were taken (dry weight, D) and then this was
followed by soaking the samples in water. Soaking was done by Water Boiling method.
The weight of the samples suspended in water was taken (suspended weight, S) after which the
soaked weight (W) of the samples was measured. Using the equation no. 3 the water absorption
percentage can be calculated. [8]
Water Absorption= ( ) * ρw * 100 … (3)
W = Soaked Weight
D = Dry Weight
S = Suspended Weight
4.4.3 PRESENCE OF HEAVY METALS
The chemical composition of the of the various sludge was done by Atomic Absorption
Spectrometer for a few elements which are harmful and present in it. [6]

23
CHAPTER 5
RESULTS AND
DISCUSSION

24
5.1 Physical Properties Test
5.1.1COMPRESSIVE STRENGTH TEST
The strength test was then carried out on these bricks and the Crushing Strength of the bricks
was duly noted as below.
This test is the most important test for assuring the engineering quality of a building material.
The study showed that with the increase in %age of sludge content the strength decreased. This
is because the strength of a material greatly depends on the sludge content and the temperature
it’s being applied to. It was also seen that with the increase in amount of cement the strength
increases. This is mainly due to the properties of the cement.
The compressive strength varied from 10 MPa to 16MPa. So from the various ratio experimented
we see that the best possible ratio for building a brick came out to be 2:3:4:1 and 2:3:3:2
Sludge
(%)
Sample
I
Strength
(MPa)
of
Sample
I
Sample
II
Strength
(MPa)
Of
Sample
1I
Sample
III
Strength
(MPa)
of
Sample
1II
Sample
IV
Strength
(MPa)
of
Sample
1V
30% 3:2:3:2 13.23 2:3:3:2 15.88 2:2:3:3 14.48 3:2:3:2 13.7
40% 1:3:4:2 12.45 2:3:4:1 15.57 3:2:4:1 14.01 3:1:4:2 14.79
50% 2:1:5:2 11.67 2:2:5:1 14.07 1.5:1.5:5:2 13.23 1:2:5:2 13.54
Table 2: Results of the Compressive Strength Test

25
5.1.2 BULK DENSITY
The bricks made with clay normally have a bulk density of 1.5–2.0 g/cm3
.
As shown, the particle density of the bricks is inversely proportional to the quantity of sludge
added in the mixture. This finding is closely related to the quantity of water absorbed as
demonstrated.
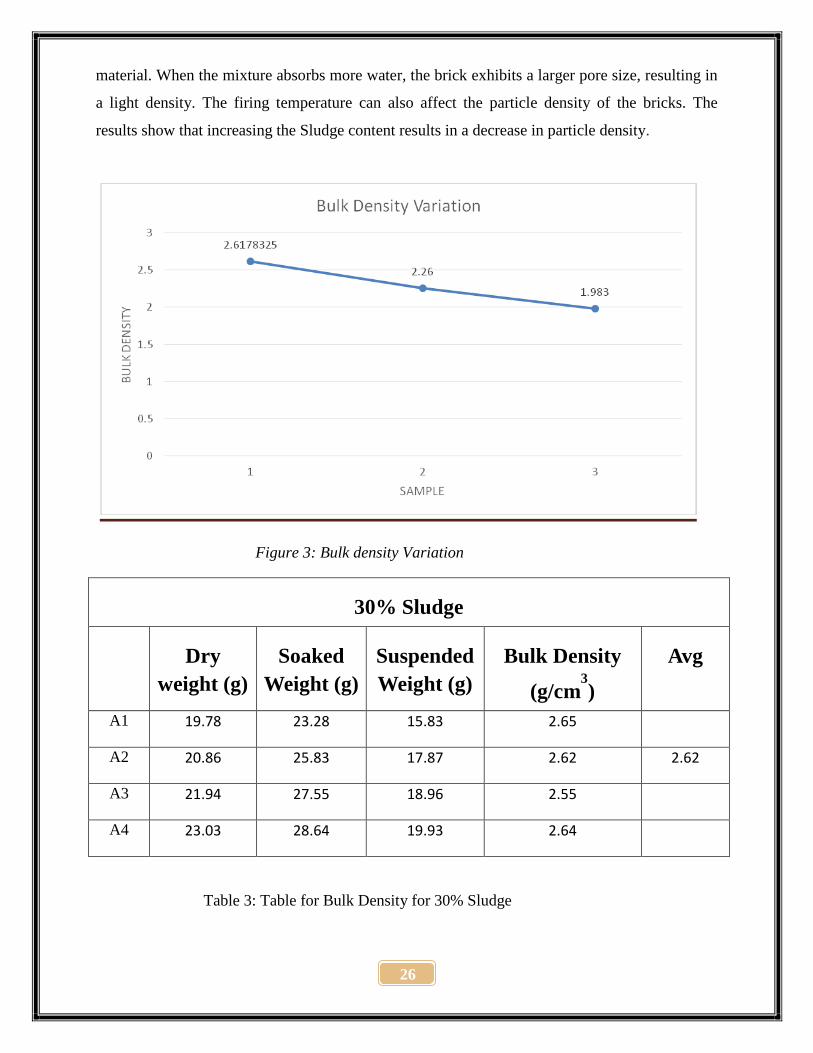
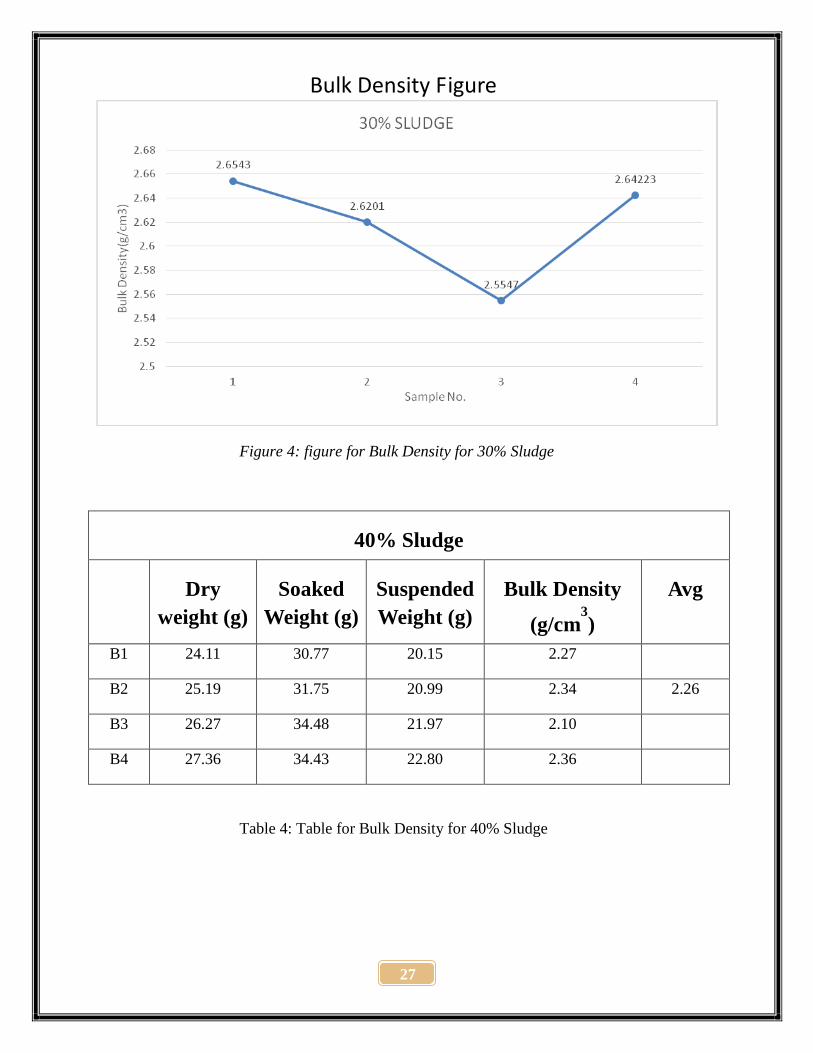
From the figure 2 it shows that the average bulk density is declining slope. However the figure 3,
figure 4, figure 5 shows that in a particular amount of sludge content, with the increase in
amount of cement it attains a maximum limit at some point and then starts decreasing from the
peak.
However the bulk density increased with the increasing amount of cement as its binding
Figure 2: compressive s trength variat ion
26
material. When the mixture absorbs more water, the brick exhibits a larger pore size, resulting in
a light density. The firing temperature can also affect the particle density of the bricks. The
results show that increasing the Sludge content results in a decrease in particle density.
Figure 3: Bulk density Variation
30% Sludge
Dry
weight (g)
Soaked
Weight (g)
Suspended
Weight (g)
Bulk Density
(g/cm3)
Avg
A1 19.78 23.28 15.83 2.65
A2 20.86 25.83 17.87 2.62 2.62
A3 21.94 27.55 18.96 2.55
A4 23.03 28.64 19.93 2.64
Table 3: Table for Bulk Density for 30% Sludge
27
Figure 4: figure for Bulk Density for 30% Sludge
40% Sludge
Dry
weight (g)
Soaked
Weight (g)
Suspended
Weight (g)
Bulk Density
(g/cm3)
Avg
B1 24.11 30.77 20.15 2.27
B2 25.19 31.75 20.99 2.34 2.26
B3 26.27 34.48 21.97 2.10
B4 27.36 34.43 22.80 2.36
Table 4: Table for Bulk Density for 40% Sludge
Bulk Density Figure

28
Figure 5: figure for Bulk Density for 40% Sludge
50% Sludge
Dry
weight (g)
Soaked
Weight (g)
Suspended
Weight (g)
Bulk Density
(g/cm3)
Avg
C1 28.44 36.91 22.53 1.98
C2 29.52 39.48 23.98 1.91 1.98
C3 30.60 38.76 23.09 1.95
C4 31.69 39.05 23.95 2.10
Table 5: Table for Bulk Density for 50% Sludge
Bulk Density Figure

29
Figure 6: figure for Bulk Density for 50% Sludge
5.2 CHEMICAL PROPERTY TEST
5.2.1 pH TEST
The chemical alkanity or acidity of the bricks was tested with the help of a pH meter and the
results are as follows.
The dried sludge has pH values ranging from 6.10- 6.50 with an average of 6.30. The average pH
value for sludge ash is 8.00 with a range of 7.97-9.03. However, the clay samples are on the
acidic range; the pH is 4.40 with a range of 4.10-4.60.
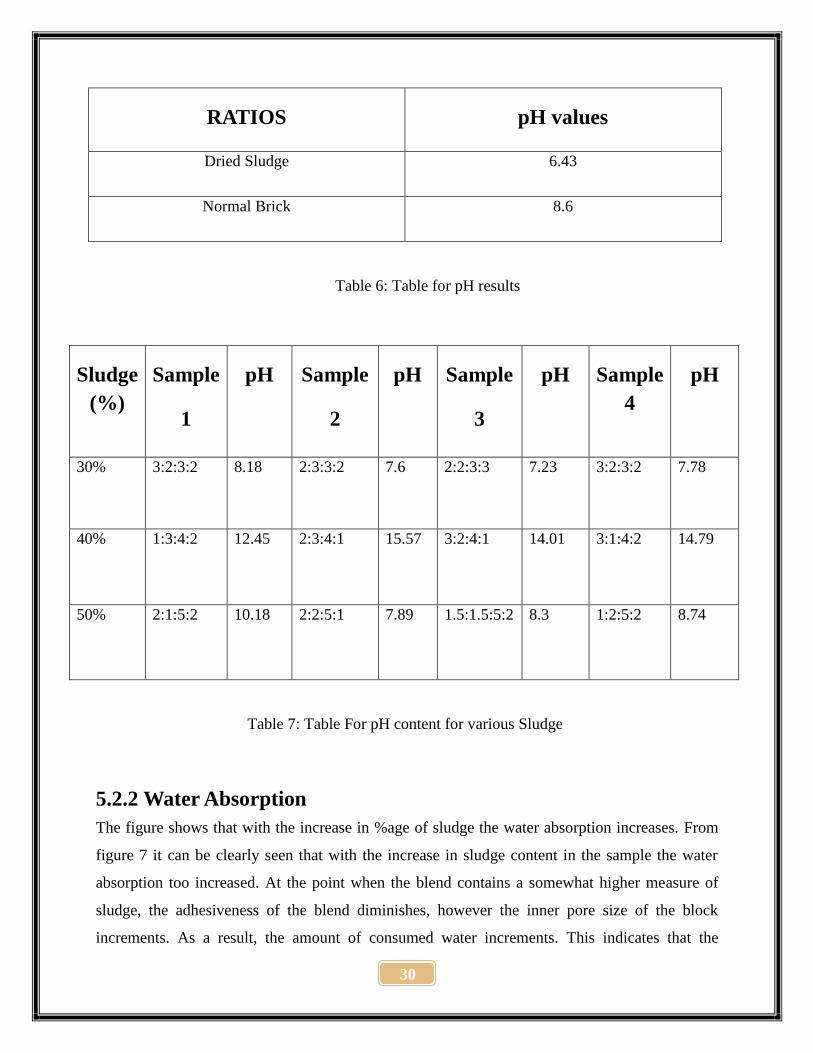
Also from the table we can see that with the increase in percentage of sludge the alkanity of the
sample too increase. This is mainly due to the presence of various metallic and nonmetallic
elements.
Bulk Density Figure
30
Table 6: Table for pH results
Sludge
(%)
Sample
1
pH Sample
2
pH Sample
3
pH Sample
4
pH
30% 3:2:3:2 8.18 2:3:3:2 7.6 2:2:3:3 7.23 3:2:3:2 7.78
40% 1:3:4:2 12.45 2:3:4:1 15.57 3:2:4:1 14.01 3:1:4:2 14.79
50% 2:1:5:2 10.18 2:2:5:1 7.89 1.5:1.5:5:2 8.3 1:2:5:2 8.74
Table 7: Table For pH content for various Sludge
5.2.2 Water Absorption
The figure shows that with the increase in %age of sludge the water absorption increases. From
figure 7 it can be clearly seen that with the increase in sludge content in the sample the water
absorption too increased. At the point when the blend contains a somewhat higher measure of
sludge, the adhesiveness of the blend diminishes, however the inner pore size of the block
increments. As a result, the amount of consumed water increments. This indicates that the
RATIOS pH values
Dried Sludge 6.43
Normal Brick 8.6
31
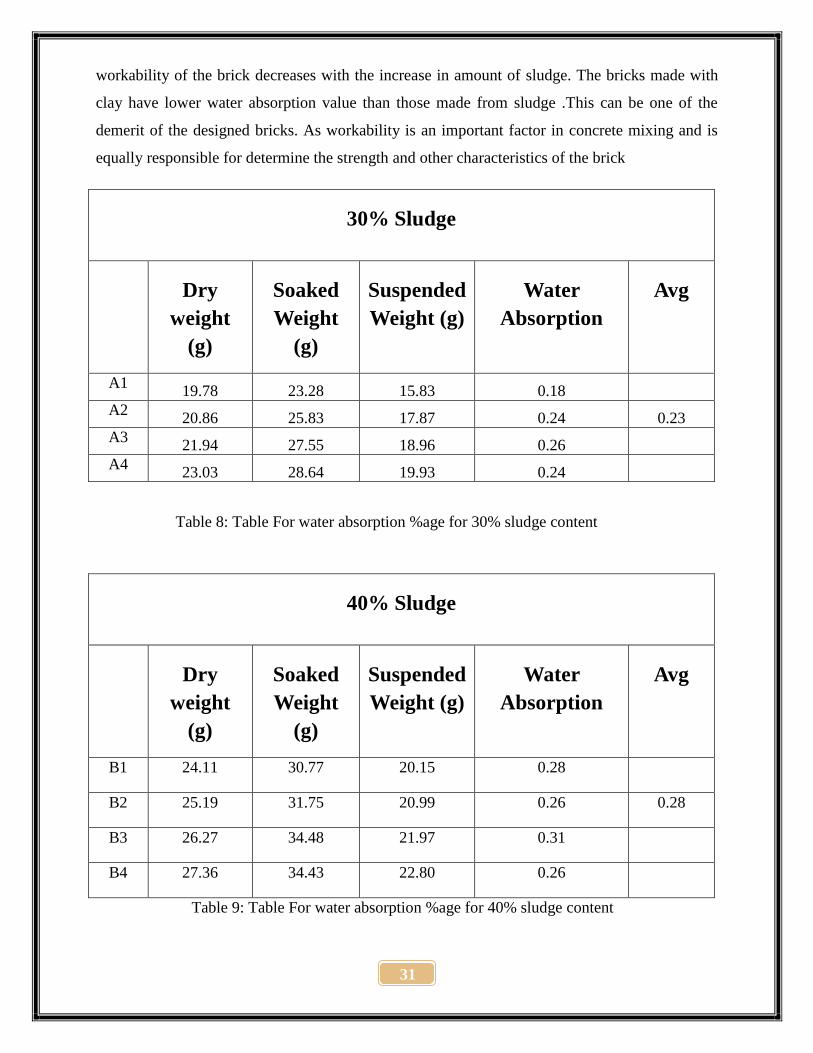
workability of the brick decreases with the increase in amount of sludge. The bricks made with
clay have lower water absorption value than those made from sludge .This can be one of the
demerit of the designed bricks. As workability is an important factor in concrete mixing and is
equally responsible for determine the strength and other characteristics of the brick
30% Sludge
Dry
weight
(g)
Soaked
Weight
(g)
Suspended
Weight (g)
Water
Absorption
Avg
A1 19.78 23.28 15.83 0.18
A2 20.86 25.83 17.87 0.24 0.23
A3 21.94 27.55 18.96 0.26
A4 23.03 28.64 19.93 0.24
Table 8: Table For water absorption %age for 30% sludge content
40% Sludge
Dry
weight
(g)
Soaked
Weight
(g)
Suspended
Weight (g)
Water
Absorption
Avg
B1 24.11 30.77 20.15 0.28
B2 25.19 31.75 20.99 0.26 0.28
B3 26.27 34.48 21.97 0.31
B4 27.36 34.43 22.80 0.26
Table 9: Table For water absorption %age for 40% sludge content

32
50% Sludge
Dry
weight
(g)
Soaked
Weight
(g)
Suspended
Weight (g)
Water
Absorption
Avg
C1 28.44 36.91 22.53 0.30
C2 29.52 39.48 23.98 0.34 0.28
C3 30.60 38.76 23.09 0.27
C4 31.69 39.05 23.95 0.23
Table 10: Table For water absorption %age for 50% sludge content
Figure 7: Figure for water absorption
Water Absorption Figure

33
5.2.3 Presence of Heavy metals
The chemical composition of the various sludge samples was done by Atomic Absorption
Spectrometer for a various elements which are harmful and present in it.
Sludge
Sample
Zn (mg/l) Pb (mg/l) Cu (mg/l) Fe (mg/l)
Sample 1 2.89 2.5 2.28 20.7
Sample II 3.62 3 2.54 25.8
Table 11: chemical composition of sludge
A clay sample was also tested in AAS and the chemical composition was found out as such.
Clay
Sample
Zn (mg/l) Pb (mg/l) Cu (mg/l) Fe (mg/l)
Sample 1 1.5 0.5 0.14 34.6
Table 12: chemical composition of clay
From the AAS we also found out that the amount of various harmful elements is very high in the
case of bricks than in the case of a normal brick.

34
5.4 Comparison of our designed brick with traditional
clay brick
Normal Brick
Designed Brick
The compressive strength of a normal 7
day cured brick is around 7.5-10 MPa.
The Brick with sludge was easily
surpassing this, and is in the range from
12-16 MPa.
The pH of a normal brick range from 7-9
While the pH value of our designed Brick
was found out to lie in range from 6-8
The Bulk Density of a normal Clay is in
the range from 1.5-2 g/cm3
While the Bulk density of our designed
brick was found out to be between 1.8-2.6
g/cm3
The water absorption of a normal brick
ranges from 15-20%
While the absorption % for designed
sludge brick was found to be from 22-28%
35
CHAPTER 6
CONCLUSION

36
The experimental results carried out during the present work would lead to the following
conclusions.
The samples with Sludge content of 30-40% was found to be vitrified.
A ratio of 2:3:3:2 containing fly ash, cement, and sludge and demolition waste,
respectively was found to be the better suitable ratio in manufacturing brick made of
sludge and demolition waste along with fly ash and also has a potential to be used as
instead of normal bricks.
While some of the properties of the designed brick with the ratio of 2:3:3:2 was found to
be absolutely fine, some weren’t. Such as compressive strength of the brick was 15.88
MPa, whereas the normal brick strength lies in the range of 7.5-10 MPa. [3] The bulk
density of it was found to be 2.62 g/cm3, whereas a normal brick ha a density of 1.8-2
g/cm3 .[4] The properties like pH was found to be 6.7 which wasn’t appropriate enough
as normal bricks have pH a of 8.5-10.5[4].
The samples and their properties were also checked according to the IS: 1077 – 1992 and
IS: 2212 – 1991, the Code of practice for brick work to be used.

37
REFEREENCES
1. Bhatia D, 2014. Research and development of quantity building material through utilization of
construction and demolition waste, B.Tech NIT Rourkela.
2. Mahapatra P, 2013. Development of acid resistant bricks using waste materials, B Tech NIT
Rourkela. 5 – 16.
3. Tay, J. H., 1987. Brick manufactured from Sludge, Journal of Environmental Engineering.Vol
113 No. 2. 1-7
4. Weng C.H, Lina D.F, Chiang P.C, 2003. Utilization of sludge as a brick material, Advances in
Environmental Research 7. 1-7
5. Ahmari S, Zhang L, 2011. Production of eco-friendly bricks from copper mine tailings
through geo polymerization, www.elsevier.com .322-326
6. Hegazy B.E.E, Fouad H.A, Hassanain A.M. April 24, 2012. Incorporation of water sludge,
silica fume, and rice husk ash in brick making. Advances in Environmental Research, Vol. 1, No.
1 (2012) 83-96.
7. Tonge P, JULY 5 1988. Bio building bricks. Using sludge in bricks: Improves quality Reduces
weight Saves energy. , The Christian Science Monitor. 6-8
8. Hegazy B.E.E, Fouad H.A, Hassanain A.M, 2012. Brick Manufacturing From Water
Treatment Sludge and Rice Husk Ash. Australian Journal of Basic and Applied Sciences, 6(3):
453-461, ISSN 1991-8178.
9. Victoria A.N, May 2013. Characterization and performance evaluation of water works sludge
as bricks material. International Journal of Engineering and Applied Sciences Vol. 3, No. 3
ISSN2305-8269.
10. Kadir1 A.A , Mohajerani A. July 4 - 6, 2011.Bricks: An excellent building material for
recycling wastes – a review. IASTED International Conference Calgary,
11. IS: 1077 – 1992 and IS: 2212 – 1991