Embed Size (px)
Citation preview

Journal of Saudi Chemical Society (2016) 20, S440–S447
King Saud University
Journal of Saudi Chemical Society
www.ksu.edu.sawww.sciencedirect.com
ORIGINAL ARTICLE
Preparation and characterization of polystyrene
based Nickel molybdate composite membrane
electrical–electrochemical properties
* Tel./fax: +91 571 2703515.E-mail addresses: [email protected], [email protected]
(Rafiuddin).
Peer review under responsibility of King Saud University.
Production and hosting by Elsevier
http://dx.doi.org/10.1016/j.jscs.2013.01.004
1319-6103 ª 2013 Production and hosting by Elsevier B.V. on behalf of King Saud University.
This is an open access article under the CC BY-NC-ND license (http://creativecommons.org/licenses/by-nc-nd/4.0/).
Urfi Ishrat, Rafiuddin *
Membrane Research Laboratory, Department of Chemistry, Aligarh Muslim University, Aligarh 202002, India
Received 2 July 2012; accepted 1 January 2013
Available online 26 January 2013
KEYWORDS
Impedance;
Membrane potential;
Particle size;
SEM micrograph;
XRD
Abstract The functional properties of the polystyrene based Nickel Molybdate composite mem-
brane prepared by applying 70 MPa pressure are described. The fabricated membrane was charac-
terized by using Fourier Transform Infrared, X-ray diffraction, particle size analyzer and Scanning
electron microscopy technique and has been investigated for its functional, diffusive, electrochem-
ical and electrical properties. The impedance data of membrane having capacitive and resistive com-
ponents are plotted, which show the sequence of semicircles representing an electrical phenomenon
due to grain material, grain boundary and interfacial phenomenon. The diffusion of electrolytes was
determined by the TMS method revealing dependence of membrane potential on the charge on the
membrane matrix, charge and size of permeating ions. The membrane determined the activity of
cations with good accuracy in the higher concentration range and shows a great selectivity for
K+. Other electrochemical properties like transport number have been discussed its selectivity.ª 2013 Production and hosting by Elsevier B.V. on behalf of King Saud University. This is an open access
article under the CC BY-NC-ND license (http://creativecommons.org/licenses/by-nc-nd/4.0/).
1. Introduction
The multitude of potential applications was identified and a
several billion dollar market was predicted for the mem-brane-based industry by the turn of this century (Lonsdale,1982). The overall success of the membrane technology, how-
ever, is lagging behind these expectations. In some applica-
tions, such as in hemodialysis, in reverse-osmosis seawaterdesalination, in micro and ultrafiltration of surface water, or
in the separation, concentration, and purification of foodand pharmaceutical Industries (Laıne et al., 2000), in fuel cellsand as battery separators and so on, membranes indeed play
an important role today. New inorganic and organic materials,super molecular structures with specific binding properties, areused as membrane materials (Khan and Rafiuddin, 2011). Nimolybdates are attractive compounds because of their struc-
tural, magnetic, catalytic and electrochemical (Li storage)properties (Strathmann, 2001; Jacob et al., 1987; Wiesmannet al., 1995; Jacob and Varamban, 1998; Livage et al., 2002;
Mazzocchia et al., 1991; Rodriguez et al., 1999). These proper-ties depend not only on their compositions and structures butalso on their particle’s morphology and size. It has been
known that preparation methods and conditions become key
Nomenclature
C1, C2 concentration of electrolyte solution either side of
the membrane(mol/l)C1+ cation concentration in membrane phase 1 (mol/l)C2+ cation concentration in membrane phase 2 (mol/l)cp capacitance of specimen in Farad (F)
Cg, Cgb capacitances of the grain and grain boundaryrespectively,
D charge density in membrane (eq/l)
F faraday constant (C/mol)FTIR Fourier Transform InfraredK distribution coefficient of ions
K2± distribution coefficient of ions (electrolyte solutionC2)
q1 charge effectiveness of membrane phase 1q2 charge effectiveness of membrane phase 2
Rg, Rgb the resistances of the grain and grain boundary,respectively,
R gas constant (J/K/mol)
SEM Scanning electron microscopyTMS Teorell, Meyer and Sieverst+ transport number of cation
t� transport number of anion
u mobility of cations in the membrane phase (m2/V/s)
v mobility of anions in the membrane phaseVk valency of cation
Vx valency of fixed charge groupXRD powder X-ray diffraction
Greek symbols
e0 permittivity of free spacee00 dielectric constant of the samplesc0�0 ; c
00� mean ionic activity coefficient for electrolytes solu-
tion C1 and C2
- mobility ratio (TMS extension theory)xg, xgb frequencies at the peaks of semicircles for grain
and grain boundary, respectively
dwm membrane potential (mV)dWm,e membrane potential (mV) (TMS extension theory)dWDon donnan potential (mV)
dWDiff diffusion potential (mV)
Preparation and characterization of polystyrene based Nickel molybdate composite membrane S441
elements to control these material parameters (Singh et al.,2009; Li et al., 2007; Yin et al., 2004; Goia, 2004).
In this article, the preparation of nickel molybdate by aSol–Gel route and membrane with polystyrene as a binderby the application of pressure has been described. The electri-
cal properties such as impedance analysis, of nickel molybdateand composite are determined using impedance spectroscopy.The surface charge density, was considered the most effective
parameter that controls the membrane phenomena; this quan-tity was derived and used to calculate the membrane potentialsfor different electrolyte concentrations. And membrane poten-tial was calculated with the help of Teorell, Meyer, and Sievers
(TMS) method (Teorell, 1935; Meyer et al., 1936; Chou andTanioka, 1998) and test the applicability of TMS equationsfor electrochemical parameters.
2. Experimental
2.1. Materials and solutions
Pure crystalline polystyrene (Otto Kemi, India, Analytical re-
agent) used as a binder (grounded and sieved through 200mesh), 0.2 M trisodium molybdate solution (E. Merck. Indiawith purity of 99.90%), 0.2 M Nickel chloride (NiCl2) solution
(Otto Kemi, India, Analytical reagent) and different electrolytesolutions (KCl, NaCl and LiCl) of various concentrations werealso prepared.
2.2. Preparation and characterization of NiMoO4
The NiMoO4 sample was prepared by the Sol–Gel method bythe reaction between nickel chloride (NiCl2), 0.2 M and So-
dium molybdate (Na2MoO4) 0.2 M solution according to thefollowing chemical equation:
NiCl2 þNa2MoO4 ! NiMoO4 þ 2NaCl
The average grain sizes are 1157.88, 1877.99, 1778.32 and
2260.90 nm for the product (by using laser diffraction Particlesize analyzer). The precipitate was heated in a crucible at550 �C for four hours under atmospheric pressure. The result-ing product was a yellow powder of b-NiMoO4 (Steinbrunn
et al., 1991). The characterization of composite was mainlyperformed by X-ray diffraction, XRD pattern and differentparameters were collected with a Rigaku D/max 2400 powder
diffractometer using Cu Ka radiation where the FT-IR spectraof composite materials were recorded in 400–4000 cm�1 rangeat room temperature.
2.3. Preparation and characterization of membrane
Pure polystyrene (Otto Kemi, India) used as a binder was
ground and sieved through 200 meshes and composite mem-brane was prepared by methods suggested by Rafiuddin et al.(Jabeen and Rafiuddin, 2008; Jabeen and Rafiuddin, 2010). Inwhich composite mixture was kept into cast die of diameter
2.45 cm and placed in an oven maintained at 200 �C for abouthalf an hour to equilibrate the reaction mixture, after that diewas transferred to a pressure device (SL-89, UK) where
70 MPa pressure was applied. And Scanning electron micros-copy (SEM) was used to observe the surface morphology, distri-bution of particles and pore size of dried membrane.
3. Result and discussion
The FTIR spectra were performed to a certain composition
and the possible addition sites of the NM and pure polysty-rene. The spectra contained weak to strong intensity peaks as-signed to various functional groups in the material synthesized.

Figure 1 FTIR spectra of (A) polystyrene (B) Nickel molybdate and (C) composite material.
Figure 2 XRD-spectrum of Nickel Molybdate-Polystyrene
Composite.
Table 1 The XRD parameters of the value of the dried
NiMoO4 powder prepared in this work.
Sample NM
Formula b-NiMoO4
Molecular weight
(g mol�1)
218.87
Temperature �C 550
Crystal system Monoclinic
Method Powder
Cell parameters a= 8.905958; b= 7.094303; c= 8.335813
a = 90.00000; b = 130.4812; c = 90.00000
2h min–max 20.00–80.00
Lattice Type p
S442 U. Ishrat, Rafiuddin
Fig. 1. The peaks in the range 696–874 cm�1 indicated thataromatic ring was present in composite material (Nakamoto,1986). The peaks 2852 and 2927 cm�1 are the C–H bond fre-quency due to styrene moiety in composite. And the XRD pat-
tern of composite material recorded from powdered sampleexhibited some sharp peaks in the spectrum Fig. 2. It was clearfrom the figure that the nature of composite material was semi-
crystalline. And different parameters calculated from Fig. 2 aregiven in Table 1. And the average particle size was also calcu-lated by particle size analyzer for that sample had been mixed
in water using ultrasonic waves. The suspended particles weremeasured by the particle size analyzer and average values areshown in Fig. 3. The Scanning electron microscopy (SEM)
had been used for the characterization of membrane surfacemorphology (Santos et al., 1997). From SEM images
Fig. 4(A) composite pore structure, micro/macro porosity, sur-face texture homogeneity, and crack free membranes had been
studied (Resina et al., 2007) and Fig. 4(B) cross sectional thick-ness was estimated to be around 10 lm and magnification of1.00 K· as observed. The pore diameters of the membrane
are very small and the distribution of nickel molybdate andpolystyrene particles is relatively uniform in the matrix; sothe membranes are compact with a low degree of porosity, sug-
gesting that the synthesized membranes are homogeneous innature and hence form a dense membrane. SEM micrographshad a large depth of field yielding a characteristic three-dimen-sional appearance useful for understanding the surface struc-
ture of composite membrane.
3.1. Electrical properties
The Nickel molybdate composite powder was pressed into pel-let of 13 mm diameter and 0.49 mm thickness for electricalmeasurements. Dielectric and impedance spectroscopy mea-
surements were carried out in the frequency range 1–1 MHzusing an LCR meter (4200). The pellets were coated on adja-cent faces with silver paste, thereby forming parallel plate
capacitor geometry. The value of dielectric constant (e0) is cal-culated using the formula, as follows

0.0
0.5
1.0
1.5
2.0
2.5
3.0
3.5
4.0
4.5
5.0
5.5
6.0
Den
sity
dis
trib
utio
n q3
*
0.5 1.0 5 10 50 100 500 1000 5000 10000particle size / nm
Figure 3 The graph shown particle size analysis.
Figure 4 Shows (A) SEM of surface and (B) cross-sectional
surface of polystyrene-based composite membrane, respectively.
Preparation and characterization of polystyrene based Nickel molybdate composite membrane S443
e0 ¼ Cpd
eoAð1:1Þ
where, e0 = permittivity of free space, d= thickness of pellet,A= cross sectional area of the flat surface of the pellet,
Cp = capacitance of the specimen in Farad (F)
The complex dielectric constant (e00) of the samples was cal-culated using the relation, as follows:
e00 ¼ e0 tan d ð1:2Þ
where, tand is the dielectric loss which is proportional to theloss of energy from the applied field into the sample and there-fore called as dielectric loss.
3.1.1. Impedance analysis
The electrical behavior of solid composite had been studiedover a wide range of frequencies at room temperature usingac technique of complex impedance spectroscopy. Especially
in the field of solid research these measurements had beenwidely used in the study of ionic conduction, grain boundaryimpedance, electrolyte/electrode interface characteristics andalso in diffusion measurements on mixed conducting solid elec-
trode materials (Franceschetti et al., 1981; Boukamp and Wie-gers, 1983; Honders and Broers, 1985). This technique wasused to separate the resistive and capacitive components of
electrical parameters and hence provides a clear picture of fea-tures of the material. Where the use of frequency dispersionmeasurements can also have a great potential for the study
of complete electrochemical systems, such as batteries (Mangeret al., 1984). The impedance data of NM composite materialshad capacitive and resistive components and were plotted in acomplex plane plot which appeared in the form of semicircles
representing an electrical phenomenon due to bulk (grain)material, grain boundary and interfacial phenomenon. Gener-ally, the grains are effective in the higher frequency region,
while the grain boundaries are effective in the lower frequencyregion. Thus the semicircle appeared in the high frequency re-gion corresponds to the grain contribution while in the low fre-
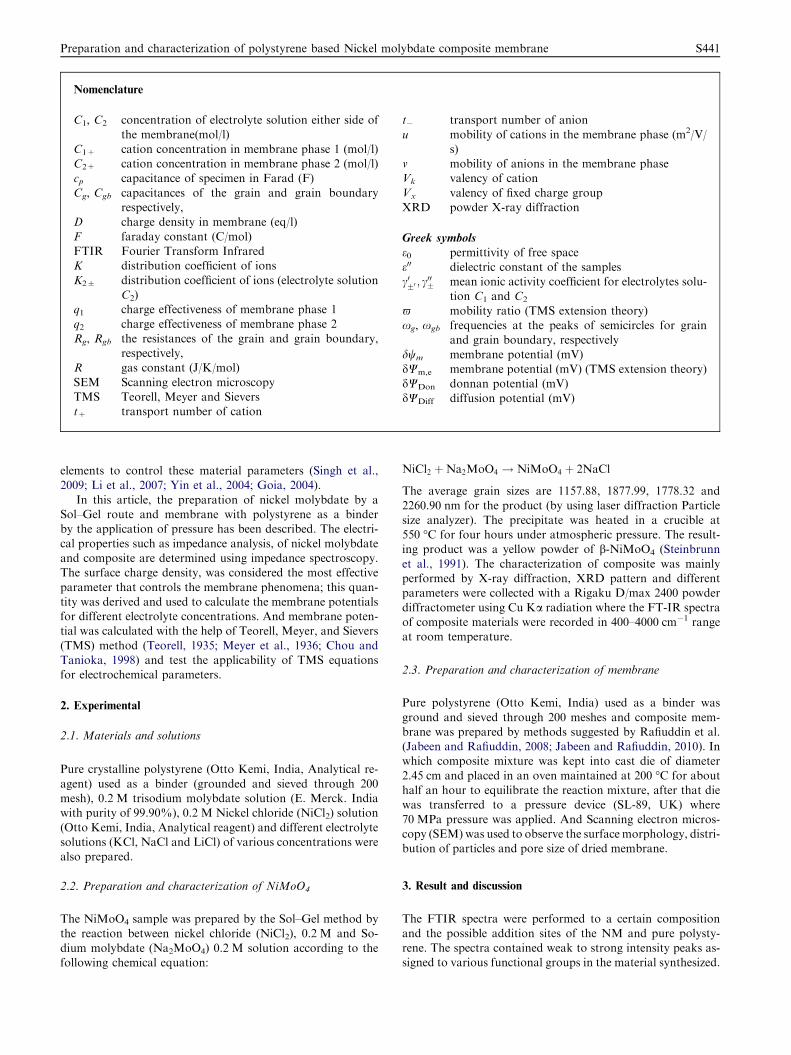
quency region it corresponds to the grain boundarycontribution. The electrical characteristic of NM was exhibitedby the appearance of semicircular arcs in Nyquist plots. Fig. 5
shows the complex impedance plots (Nyquist plots) of pureNickel Molybdate and composite material. It was an evidencethat the samples show single semicircular behavior, which sug-gested the predominance of grain boundary resistance (Rgb)
over the grain resistance (Rg). In the literature it has been men-tioned that the resistivity of a polycrystalline material in gen-eral increases with decreasing grain size (Tschope et al.,
2001). Accordingly, smaller grains imply a larger number of
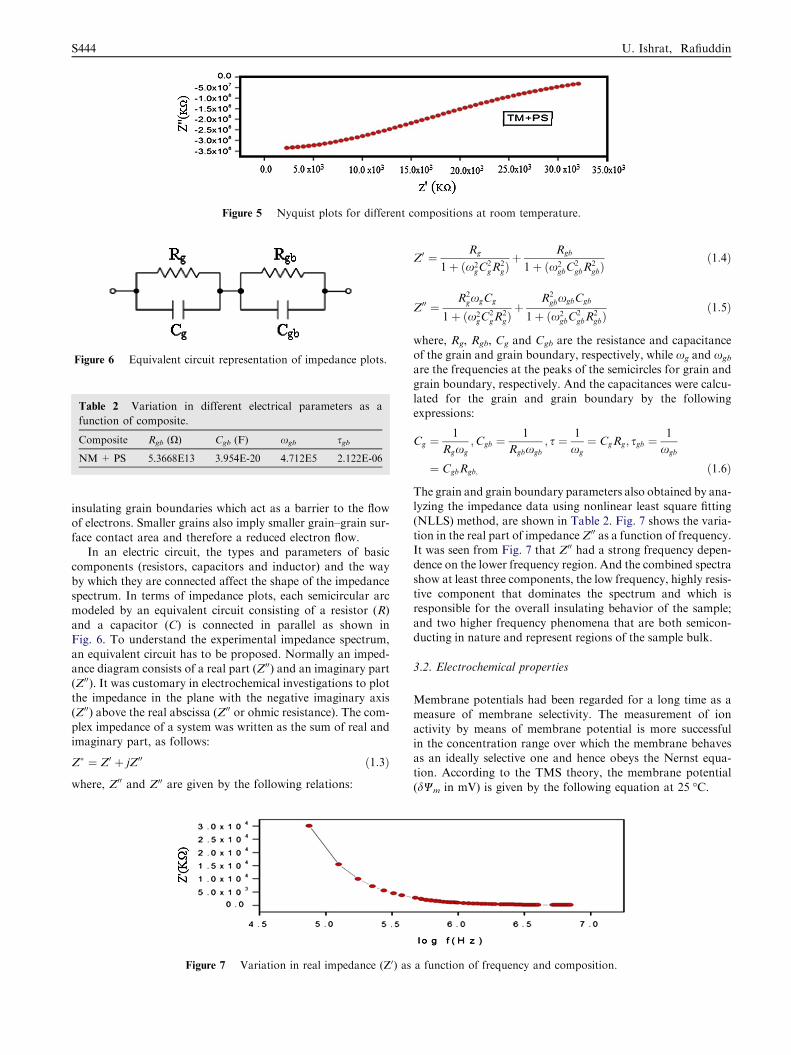
Figure 5 Nyquist plots for different compositions at room temperature.
Figure 6 Equivalent circuit representation of impedance plots.
Table 2 Variation in different electrical parameters as a
function of composite.
Composite Rgb (O) Cgb (F) xgb sgb
NM+ PS 5.3668E13 3.954E-20 4.712E5 2.122E-06
S444 U. Ishrat, Rafiuddin
insulating grain boundaries which act as a barrier to the flowof electrons. Smaller grains also imply smaller grain–grain sur-
face contact area and therefore a reduced electron flow.In an electric circuit, the types and parameters of basic
components (resistors, capacitors and inductor) and the way
by which they are connected affect the shape of the impedancespectrum. In terms of impedance plots, each semicircular arcmodeled by an equivalent circuit consisting of a resistor (R)
and a capacitor (C) is connected in parallel as shown inFig. 6. To understand the experimental impedance spectrum,an equivalent circuit has to be proposed. Normally an imped-ance diagram consists of a real part (Z00) and an imaginary part
(Z00). It was customary in electrochemical investigations to plotthe impedance in the plane with the negative imaginary axis(Z00) above the real abscissa (Z00 or ohmic resistance). The com-
plex impedance of a system was written as the sum of real andimaginary part, as follows:
Z� ¼ Z0 þ jZ00 ð1:3Þ
where, Z00 and Z00 are given by the following relations:
Figure 7 Variation in real impedance (Z0) as
Z0 ¼ Rg
1þ ðx2gC
2gR
2gÞþ Rgb
1þ ðx2gbC
2gbR
2gbÞ
ð1:4Þ
Z00 ¼R2
gxgCg
1þ ðx2gC
2gR
2gÞþ
R2gbxgbCgb
1þ ðx2gbC
2gbR
2gbÞ
ð1:5Þ
where, Rg, Rgb, Cg and Cgb are the resistance and capacitanceof the grain and grain boundary, respectively, while xg and xgb
are the frequencies at the peaks of the semicircles for grain and
grain boundary, respectively. And the capacitances were calcu-lated for the grain and grain boundary by the followingexpressions:
Cg ¼1
Rgxg
;Cgb ¼1
Rgbxgb
; s ¼ 1
xg
¼ CgRg; sgb ¼1
xgb
¼ CgbRgb; ð1:6Þ
The grain and grain boundary parameters also obtained by ana-lyzing the impedance data using nonlinear least square fitting
(NLLS) method, are shown in Table 2. Fig. 7 shows the varia-tion in the real part of impedanceZ00 as a function of frequency.It was seen from Fig. 7 that Z00 had a strong frequency depen-dence on the lower frequency region. And the combined spectra
show at least three components, the low frequency, highly resis-tive component that dominates the spectrum and which isresponsible for the overall insulating behavior of the sample;
and two higher frequency phenomena that are both semicon-ducting in nature and represent regions of the sample bulk.
3.2. Electrochemical properties
Membrane potentials had been regarded for a long time as ameasure of membrane selectivity. The measurement of ion
activity by means of membrane potential is more successfulin the concentration range over which the membrane behavesas an ideally selective one and hence obeys the Nernst equa-tion. According to the TMS theory, the membrane potential
(dWm in mV) is given by the following equation at 25 �C.
a function of frequency and composition.

Figure 8 (A) Plots of membrane potential vs �log C2 composite membrane prepared at 70 MPa. Smooth curves are the theoretical
concentration potentials. Broken line is the experimental value of dWm for different concentrations of KCl solution. (B) Plots of mobility
ratio against �log C2 for composite membrane using 1:1 electrolytes. (C) Plots of t+ (transport number) of various electrolytes. (D) Plots
of distribution coefficient against �log C2 for TMM using various 1:1 electrolytes.
Preparation and characterization of polystyrene based Nickel molybdate composite membrane S445
dWm¼59:2 logC2
ffiffiffiffiffiffiffiffiffiffiffiffiffiffiffiffiffiffi4C2
1þD2q
þD
C1
ffiffiffiffiffiffiffiffiffiffiffiffiffiffiffiffiffiffi4C2
2þD2q
þDþU log
ffiffiffiffiffiffiffiffiffiffiffiffiffiffiffiffiffiffi4C2
2þD2q
þUDffiffiffiffiffiffiffiffiffiffiffiffiffiffiffiffiffiffi4C2
1þD2q
þUD
0B@
1CAð2:1Þ
C1 and C2 are concentrations of the electrolyte solution on
either side of the membrane, U ¼ u�vuþv
� �, u and v are the mobil-
ities of cation and anion (m2/v/s), respectively, in the mem-brane phase and D is the charge on the membrane (eq/L),
and theoretical potentials across the membrane werecalculated as a function of �log C2 (Fig. 8(A)) (Jabeen andRafiuddin, 2007). The coinciding curve for membrane gave
the values of charge density (D) within the membrane phase.The D values obtained for various membrane electrolyte sys-tems are given in Table 3. The increase in the values of D with
increase in the size of the cation might be due to an increase incharge per unit volume of the membrane (Urfi Ishrat andRafiuddin, 2012) and the order for electrolytes used wasKCl > NaCl > LiCl. The membrane potentials using TMS
equations and the observed membrane potentials at differentconcentrations in various electrolyte systems have been com-pared (Fig. 8(A)). It can be concluded that the theoretical linesagree well with the experimental lines in the lower concentra-
tion region while the obvious deviations exist between thetheoretical and experimental lines at higher concentrations(Jabeen and Rafiuddin, 2008). One of the reasons is that the
mean activity coefficients of the electrolytes do not equal unity,especially in the high concentration regions, so the amount ofion pairs in the external solutions will increase as well as non
ideality cause the deviation to be more in the high concentra-tion region (Chou and Tanioka, 1999).
The membrane under consideration seems to be truly selec-
tive and specific for K+ as shown in Table 3. The variations inmembrane potential are depending on the external bulk con-centration ratio (C1/C2). Solid lines in the graphs (Fig. 8(A))showed the membrane potentials calculated from Eq. (2.1).
It was seen that the predictions of membrane potentials fromthe numerical solutions were usually higher than the predic-
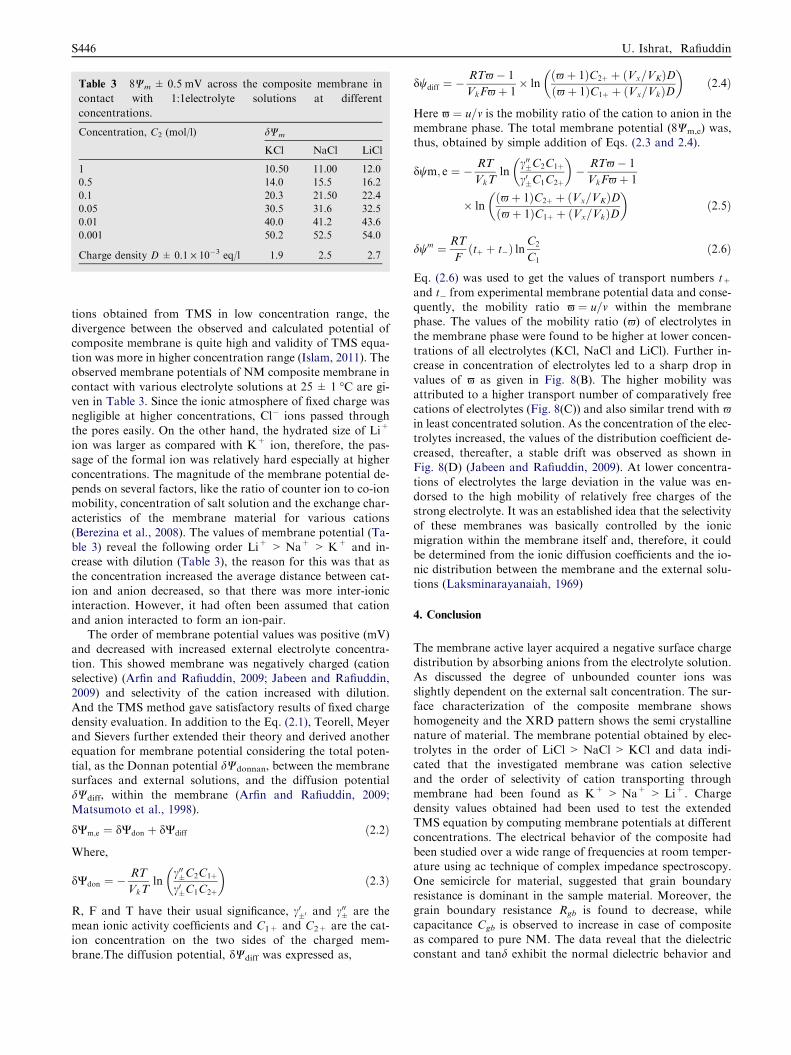
Table 3 8Wm ± 0.5 mV across the composite membrane in
contact with 1:1electrolyte solutions at different
concentrations.
Concentration, C2 (mol/l) dWm
KCl NaCl LiCl
1 10.50 11.00 12.0
0.5 14.0 15.5 16.2
0.1 20.3 21.50 22.4
0.05 30.5 31.6 32.5
0.01 40.0 41.2 43.6
0.001 50.2 52.5 54.0
Charge density D± 0.1 · 10�3 eq/l 1.9 2.5 2.7
S446 U. Ishrat, Rafiuddin
tions obtained from TMS in low concentration range, the
divergence between the observed and calculated potential ofcomposite membrane is quite high and validity of TMS equa-tion was more in higher concentration range (Islam, 2011). Theobserved membrane potentials of NM composite membrane in
contact with various electrolyte solutions at 25 ± 1 �C are gi-ven in Table 3. Since the ionic atmosphere of fixed charge wasnegligible at higher concentrations, Cl� ions passed through
the pores easily. On the other hand, the hydrated size of Li+
ion was larger as compared with K+ ion, therefore, the pas-sage of the formal ion was relatively hard especially at higher
concentrations. The magnitude of the membrane potential de-pends on several factors, like the ratio of counter ion to co-ionmobility, concentration of salt solution and the exchange char-
acteristics of the membrane material for various cations(Berezina et al., 2008). The values of membrane potential (Ta-ble 3) reveal the following order Li+ > Na+ > K+ and in-crease with dilution (Table 3), the reason for this was that as
the concentration increased the average distance between cat-ion and anion decreased, so that there was more inter-ionicinteraction. However, it had often been assumed that cation
and anion interacted to form an ion-pair.The order of membrane potential values was positive (mV)
and decreased with increased external electrolyte concentra-
tion. This showed membrane was negatively charged (cationselective) (Arfin and Rafiuddin, 2009; Jabeen and Rafiuddin,2009) and selectivity of the cation increased with dilution.
And the TMS method gave satisfactory results of fixed chargedensity evaluation. In addition to the Eq. (2.1), Teorell, Meyerand Sievers further extended their theory and derived anotherequation for membrane potential considering the total poten-
tial, as the Donnan potential dWdonnan, between the membranesurfaces and external solutions, and the diffusion potentialdWdiff, within the membrane (Arfin and Rafiuddin, 2009;
Matsumoto et al., 1998).
dWm;e ¼ dWdon þ dWdiff ð2:2Þ
Where,
dWdon ¼ �RT
VkTln
c00�C2C1þ
c0�C1C2þ
� �ð2:3Þ
R, F and T have their usual significance, c0�0 and c00� are the
mean ionic activity coefficients and C1+ and C2+ are the cat-ion concentration on the two sides of the charged mem-brane.The diffusion potential, dWdiff was expressed as,
dwdiff ¼ �RT-� 1
VkF-þ 1� ln
ð-þ 1ÞC2þ þ ðVx=VKÞDð-þ 1ÞC1þ þ ðVx=VkÞD
� �ð2:4Þ
Here - ¼ u=v is the mobility ratio of the cation to anion in themembrane phase. The total membrane potential (8Wm,e) was,thus, obtained by simple addition of Eqs. (2.3 and 2.4).
dwm; e ¼ � RT
VkTln
c00�C2C1þ
c0�C1C2þ
� �� RT-� 1
VkF-þ 1
� lnð-þ 1ÞC2þ þ ðVx=VKÞDð-þ 1ÞC1þ þ ðVx=VkÞD
� �ð2:5Þ
dwm ¼ RT
Fðtþ þ t�Þ ln
C2
C1
ð2:6Þ
Eq. (2.6) was used to get the values of transport numbers t+and t� from experimental membrane potential data and conse-quently, the mobility ratio - ¼ u=v within the membranephase. The values of the mobility ratio (-) of electrolytes in
the membrane phase were found to be higher at lower concen-trations of all electrolytes (KCl, NaCl and LiCl). Further in-crease in concentration of electrolytes led to a sharp drop invalues of - as given in Fig. 8(B). The higher mobility was
attributed to a higher transport number of comparatively freecations of electrolytes (Fig. 8(C)) and also similar trend with -in least concentrated solution. As the concentration of the elec-
trolytes increased, the values of the distribution coefficient de-creased, thereafter, a stable drift was observed as shown inFig. 8(D) (Jabeen and Rafiuddin, 2009). At lower concentra-
tions of electrolytes the large deviation in the value was en-dorsed to the high mobility of relatively free charges of thestrong electrolyte. It was an established idea that the selectivity
of these membranes was basically controlled by the ionicmigration within the membrane itself and, therefore, it couldbe determined from the ionic diffusion coefficients and the io-nic distribution between the membrane and the external solu-
tions (Laksminarayanaiah, 1969)
4. Conclusion
The membrane active layer acquired a negative surface chargedistribution by absorbing anions from the electrolyte solution.As discussed the degree of unbounded counter ions was
slightly dependent on the external salt concentration. The sur-face characterization of the composite membrane showshomogeneity and the XRD pattern shows the semi crystalline
nature of material. The membrane potential obtained by elec-trolytes in the order of LiCl > NaCl > KCl and data indi-cated that the investigated membrane was cation selective
and the order of selectivity of cation transporting throughmembrane had been found as K+ > Na+ > Li+. Chargedensity values obtained had been used to test the extendedTMS equation by computing membrane potentials at different
concentrations. The electrical behavior of the composite hadbeen studied over a wide range of frequencies at room temper-ature using ac technique of complex impedance spectroscopy.
One semicircle for material, suggested that grain boundaryresistance is dominant in the sample material. Moreover, thegrain boundary resistance Rgb is found to decrease, while
capacitance Cgb is observed to increase in case of compositeas compared to pure NM. The data reveal that the dielectricconstant and tand exhibit the normal dielectric behavior and

Preparation and characterization of polystyrene based Nickel molybdate composite membrane S447
decrease with the increase in frequency, which had been ex-plained in the light of Maxwell–Wagner model.
Acknowledgements
The authors are thankful to the Chairman Department ofChemistry for providing research facilities, All India Instituteof Medical Sciences (AIIMS), New Delhi for SEM micro-
grams, Department of Applied Physics (AMU) for X-ray dif-fraction and particle size analysis and financial assistanceprovided by the University Grant Commission (UGC) Indiais also acknowledged.
References
Arfin, T., Rafiuddin, 2009a. J. Electroanal. Chem. 636, 113–122.
Arfin, T., Rafiuddin, 2009b. Electrochim. Acta 54, 6928–6934.
Berezina, N.P., Kononenko, N.A., Dyomina, O.A., Gnusin, N.P.,
2008. Characterization of ion-exchange membrane materials:
properties vs structure. Adv. Colloid Interface Sci. 139, 3–28.
Boukamp, B.A., Wiegers, G.A., 1983. Solid State Ionics 9/10, 1193.
Chou, T.J., Tanioka, A., 1998. J. Phys. Chem. B 102, 7198.
Chou, T.J., Tanioka, A., 1999. J. Colloid Interface Sci. 212, 293–300.
Franceschetti, D.R., Schoonman, J., Macdonald, J.R., 1981. Solid
State Ionics 5, 617.
Goia, D.V., 2004. J. Mater. Chem. 14, 451.
Honders, A., Broers, G.H.J., 1985. Solid State Ionics 15, 173.
Islam, Badrul, 2011. Int. J. Chem. Sci. 9 (4), 1948–1958.
Jabeen, Fakhra, Rafiuddin, 2007. Preparation and evaluation of
effective fixed charge density of titanium phosphate membranes for
uni-univalent electrolytes in aqueous solutions. J. Sol. Gel. Sci.
Technol. 44, 195–202.
Jabeen, Fakhra, Rafiuddin, 2008. Preparation and development of the
surface charge density of vanadium phosphate membranes in
electrolyte solutions. J. Appl. Polym. Sci. 110, 3023–3030.
Jabeen, F., Rafiuddin, 2009. J. Porous Mater. 16, 257–265.
Jabeen, Fakhra, Rafiuddin, 2010. Transport studies with composite
membrane by Sol–Gel method. J. Dispersion Sci. Technol. 31,
1708–1713.
Jacob, K.T., Varamban, S.V., 1998. J. Alloys Compd. 280, 138.
Jacob, K.T., Kale, G.M., Iyengar, G.N.K., 1987. J. Mater. Sci. 22,
4274.
Khan, Mohammad Mujahid Ali., Rafiuddin, 2011. Synthesis, charac-
terization and electrochemical study of calcium phosphate ion-
exchange membrane. Desalination 272, 306–312.
Laıne, J.–M., Vial, D., Moulart, P., 2000. Status after 10 years of
operation – overview of UF technology today, proceedings of the
conference on membranes in drinking and industrial water
production. Desalination 1, 17–25.
Laksminarayanaiah, L., 1969. Transport Phenomena in Membranes.
Academic Press, New York.
Li, J.G., Ishigaki, T., Sun, X.D., 2007. J. Phys. Chem. C 111, 4969.
Livage, C., Hynaux, A., Marot, J., Nogues, M., Fe rey, G., 2002. J.
Mater. Chem. 12, 1423.
Lonsdale, H.K., 1982. The growth of membrane technology. J.
Membr. Sci. 10, 81.
Manger, R., Elkordi, M., Paxiaud, J.C., Dalard, F., Deroo, D., 1984.
J. Appl. Electrochem. 14, 293.
Matsumoto, H., Tanioka, A., Murata, TJi., Higa, M., Horiuchi, K.,
1998. Effect proton on potassium ion incounter transport across
fine porous charged membranes. J. Phys. Chem. B 102, 5011–5016.
Mazzocchia, C., Aboumrad, C., Diagne, C., Tempesti, E., Herrmann,
J.M., Thomas, G., 1991. Catal. Lett. 10, 181.
Meyer, K.H., Sievers, J.F., 1936. Helv. Chim. Acta 19, 649, 665, and 987.
Nakamoto, K., 1986. Infrared and Raman Spectra of Inorganic and
Coordinate Compounds. Wiley-Interscience, New York.
Resina, M., Macanas, J., Gyves, J.de., Munoz, M., 2007. J. Membr.
Sci. 289, 150–158.
Rodriguez, J.A., Chaturvedi, S., Hanson, J., Albornoz, A., Brito, J.L.,
1999. J. Phys. Chem. B 103, 770.
Santos, L.R.B., Pulcinelli, S.H., Santilli, C.V., 1997. J. Sol. Gel. Sci.
Technol. 8, 477.
Singh, R.N., Madhu, R., Awasthi, A.S.K.Sinha., 2009. J. Solid State
Electrochem. 13, 1613.
Steinbrunn, A., Tahri, A., Colson, J.C., 1991. Electrical transport in
polycrystalline nickel molybdate NiMoO4. Solid State Ionics 49, 99–103.
Teorell, T., 1935a. Proc. Soc. Exp. Biol. Med. 33, 282.
Teorell, T., 1935b. Proc. Natl. Acad. Sci. USA 21, 152.
Tschope, A., Sommer, E., Birringer, R., 2001. Grain size-dependent
electrical conductivity of Polycrystalline cerium oxide I. Experi-
ments.. Solid State Ionics 139, 255–265.
Ishrat, Urfi., Rafiuddin, 2012. Synthesis characterization and electrical
properties of Titanium molybdate composite membrane. Desalina-
tion 286, 8–15.
Wiesmann, M., Ehrenberg, H., Wltschek, G., Zinn, P., Weitzel, H.,
Fuess, H., 1995. J. Magn. Mater. L 1, 150.
Yin, S., Hasegawa, H., Maeda, D., Ishitsuka, M., Sato, T., 2004. J.
Photochem. Photobiol. A 1, 163.