Embed Size (px)
Citation preview

Preliminary Uncertainty Analysis of Selected Hydrodynamic and Ecological Models in the Louisiana Coastal Area
Ecosystem Restoration Plan
Emad Habib
University of Louisiana at LafayetteUniversity of Louisiana at Lafayette
Victor H. Rivera-Monroy, Jenneke M. Visser, Kenneth A. Rose
Louisiana State University
Bill Nuttle
Eco-hydrology, Canada
Acknowledgements
•• Louisiana Department of Natural ResourcesLouisiana Department of Natural Resources
•• CLEAR Facility CLEAR Facility
•• CLEAR CLEAR Uncertainty Analysis TaskEmad Habib
Victor H. Rivera-Monroy
Emily Hyfield
Dubravko Justic
William Nuttle
Kenneth A. Rose
Erick Swenson
Jenneke Visser
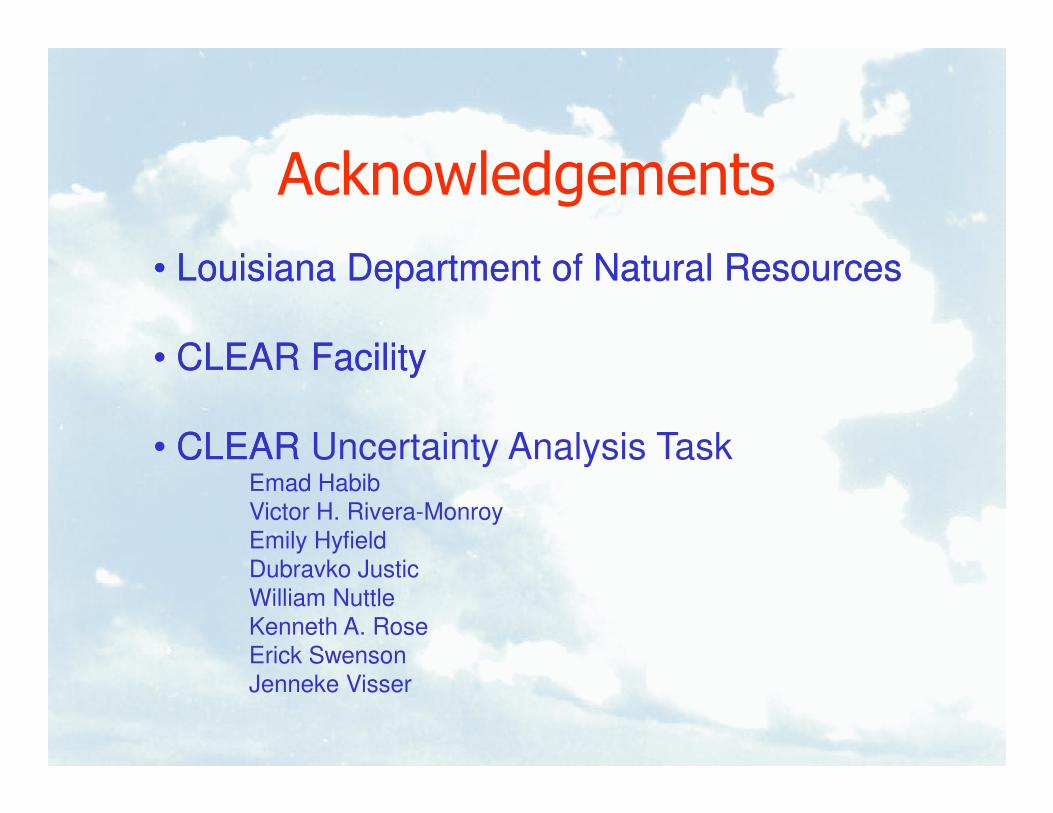
Background• Louisiana is experiencing nationally critical coastal wetland
erosion and land loss
• Key causes are reduction in freshwater and sediment inputs
• Louisiana Coastal Area (LCA) study was developed to establish framework for solving Louisiana coastal problems.
• The Coastal Louisiana Ecosystem Assessment and • The Coastal Louisiana Ecosystem Assessment and Restoration (CLEAR) effort was initiated to develop a modeling tool for evaluation of restoration alternatives and their environmental benefits.
• CLEAR model combines a set of linked modules as an ecosystem forecasting tool for geophysical processes, geomorphic features, and ecological succession.
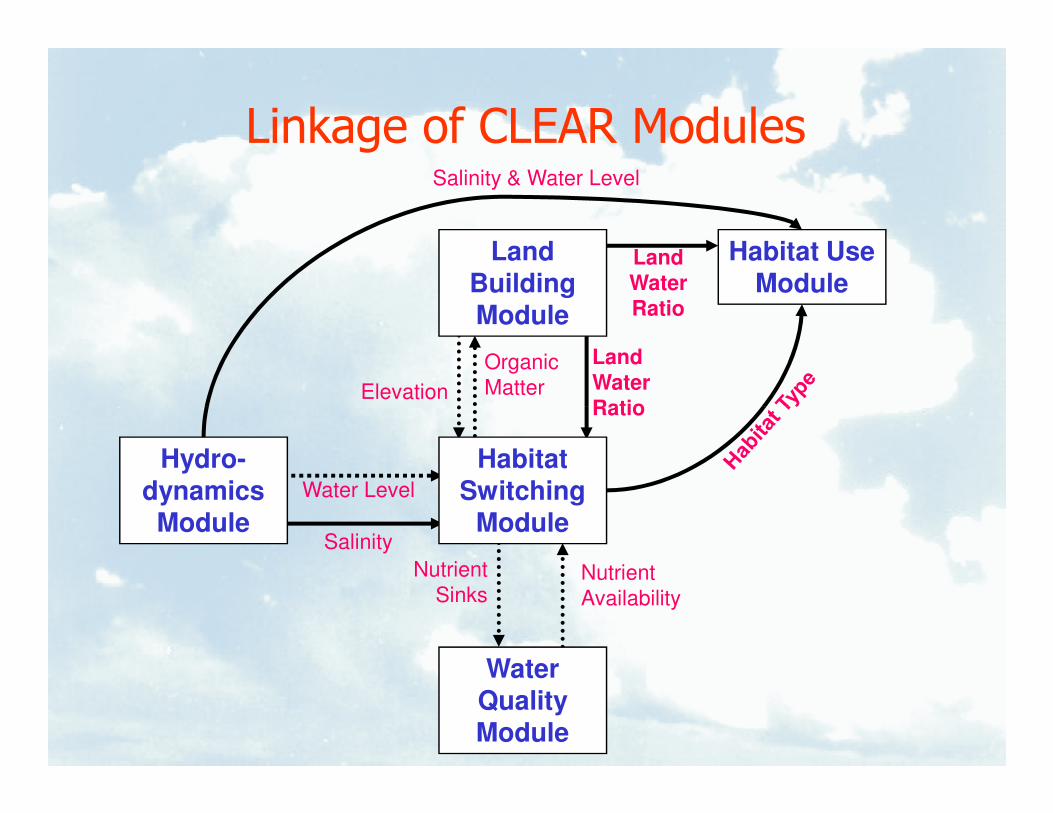
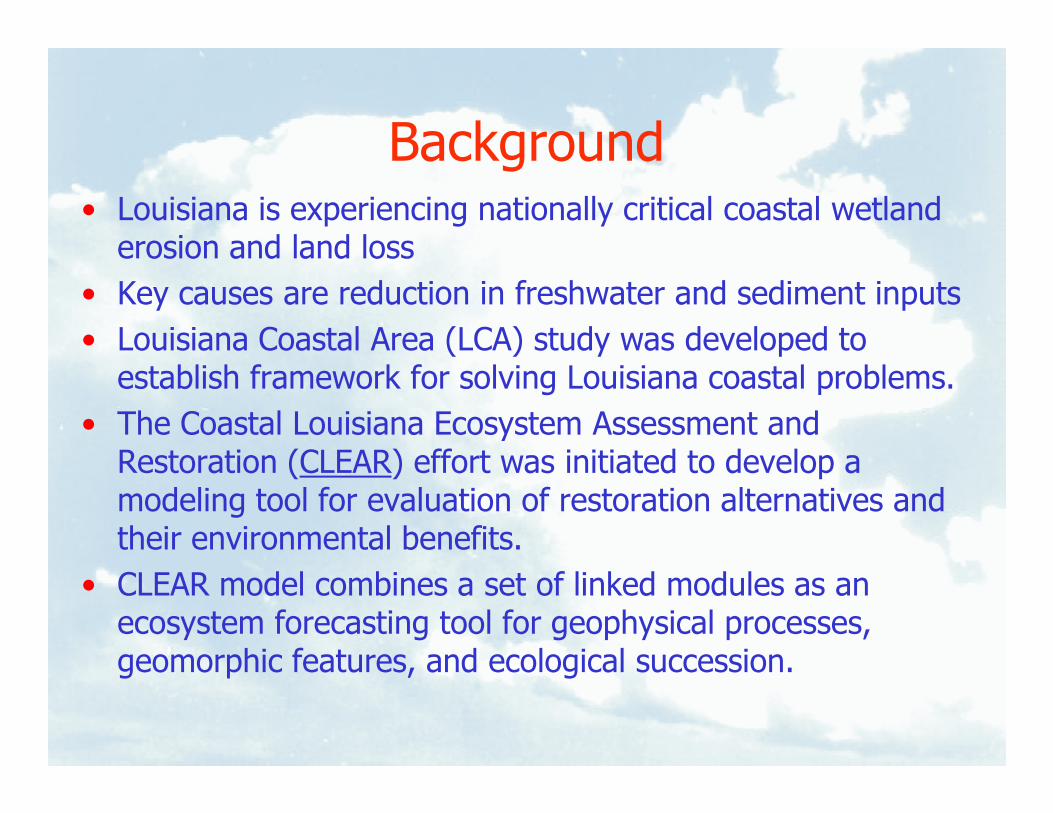
Linkage of CLEAR Modules
Organic
MatterElevation
Land
Water
Ratio
Land
Water
Ratio
Salinity & Water Level
Land Building Module
Habitat Use Module
Water Level
Salinity
Nutrient
Availability
Water Quality Module
Nutrient
Sinks
Ratio
Hydro-dynamics Module
Habitat Switching
Module
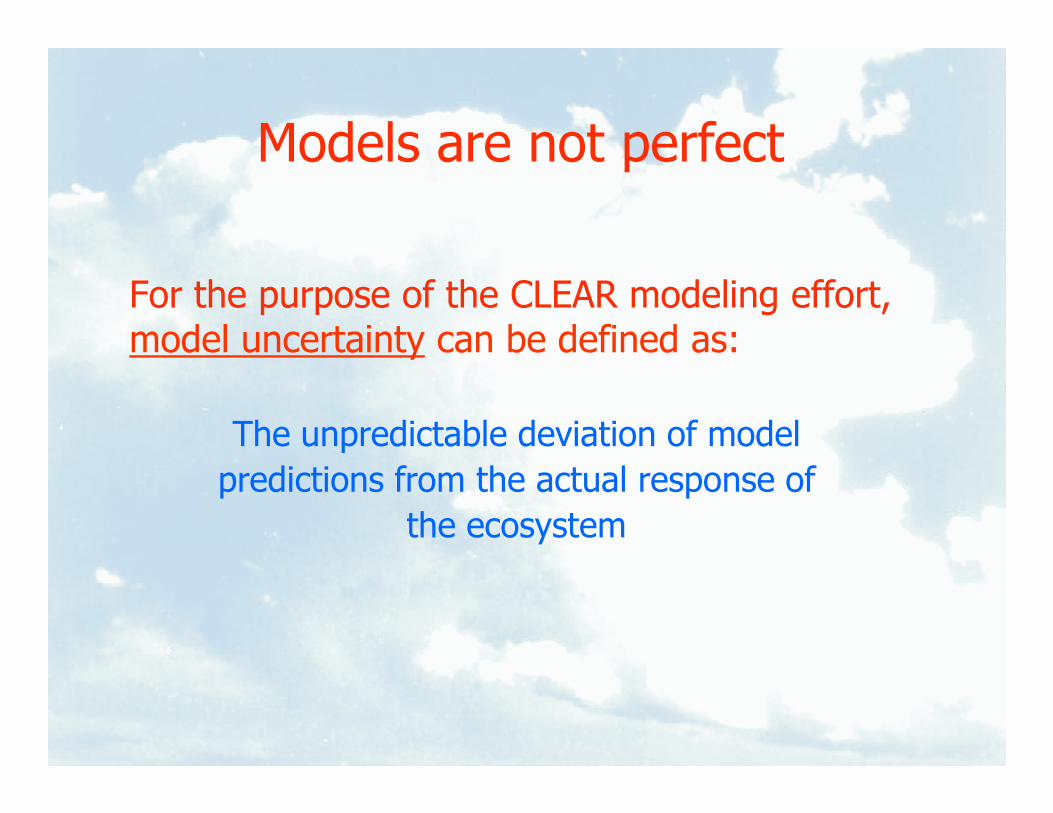
For the purpose of the CLEAR modeling effort,model uncertainty can be defined as:
Models are not perfect
The unpredictable deviation of model
predictions from the actual response of
the ecosystem
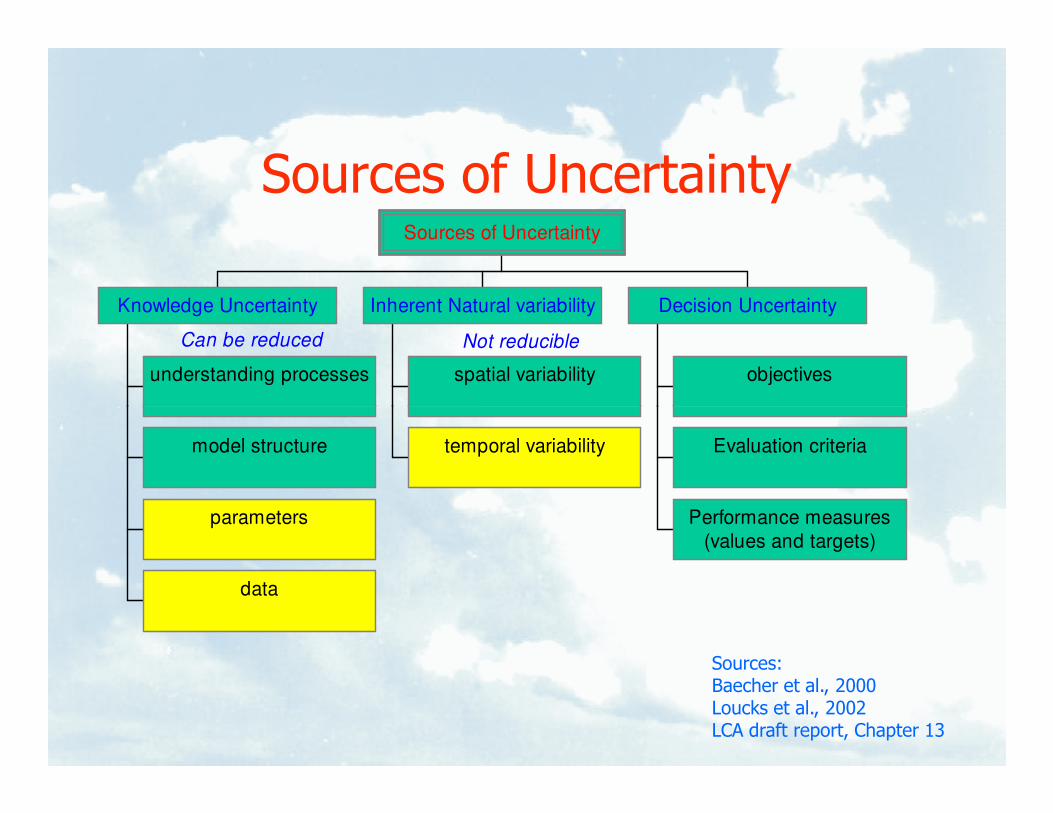
Sources of Uncertainty
Can be reduced Not reducible
understanding processes
Knowledge Uncertainty
spatial variability
Inherent Natural variability
objectives
Decision Uncertainty
Sources of Uncertainty
model structure
parameters
data
temporal variability Evaluation criteria
Performance measures
(values and targets)
Sources:Baecher et al., 2000Loucks et al., 2002LCA draft report, Chapter 13
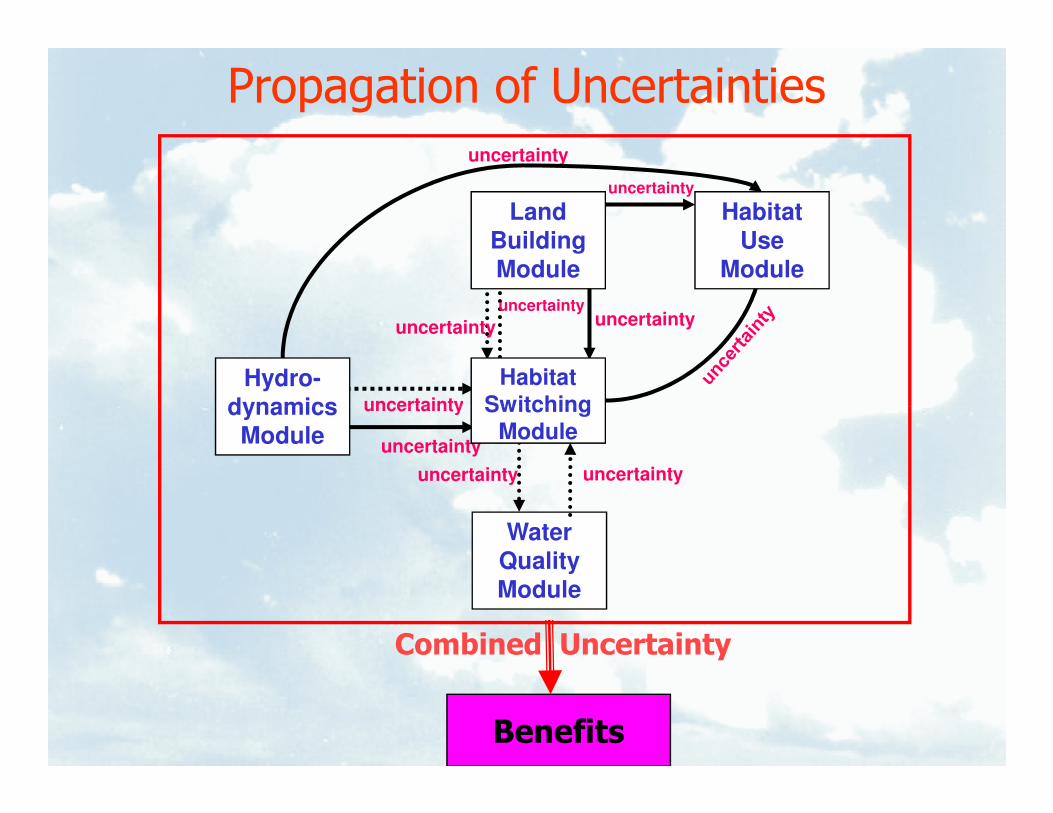
Propagation of Uncertainties
uncertainty
uncertainty
uncertainty
uncertainty
uncertainty
uncertainty
Hydro-
dynamics
Habitat Switching
Land
Building
Module
Habitat
Use
Module
Water
Quality
Module
uncertainty
uncertainty
uncertaintyuncertainty
dynamics Module
Switching Module
Benefits
Combined Uncertainty
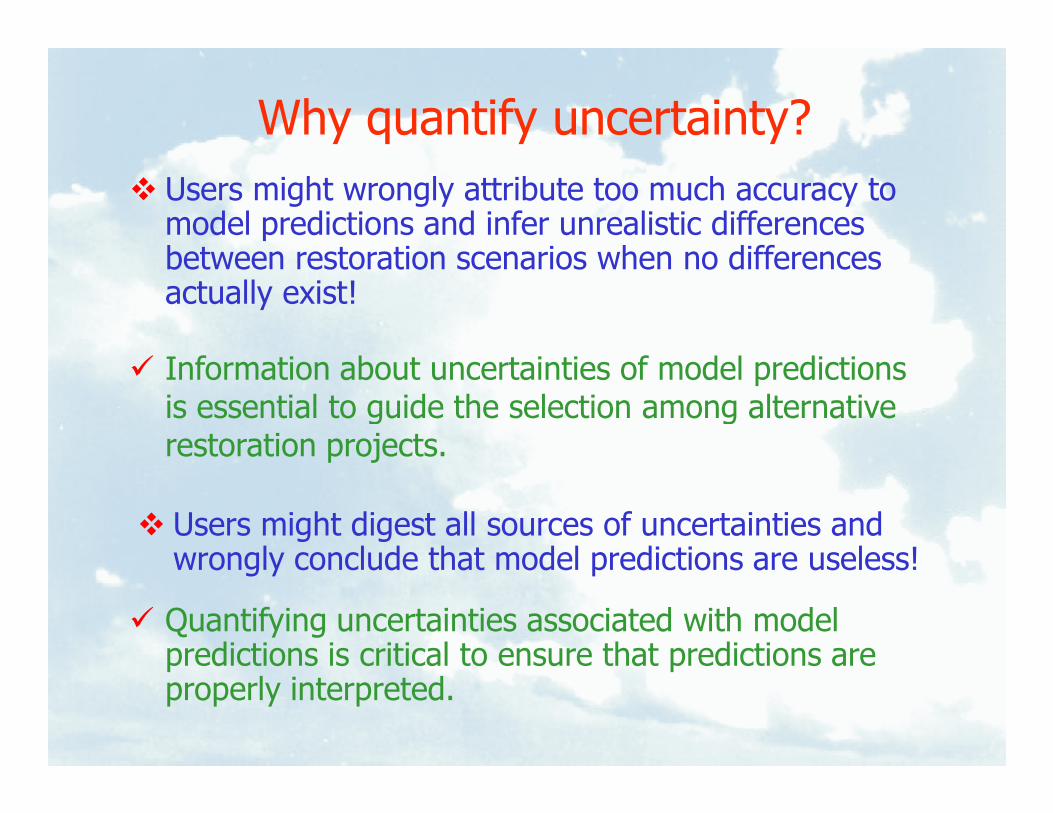
Why quantify uncertainty?
� Users might wrongly attribute too much accuracy to model predictions and infer unrealistic differences between restoration scenarios when no differences actually exist!
� Information about uncertainties of model predictions is essential to guide the selection among alternative
� Users might digest all sources of uncertainties and wrongly conclude that model predictions are useless!
� Quantifying uncertainties associated with model predictions is critical to ensure that predictions are properly interpreted.
is essential to guide the selection among alternative restoration projects.
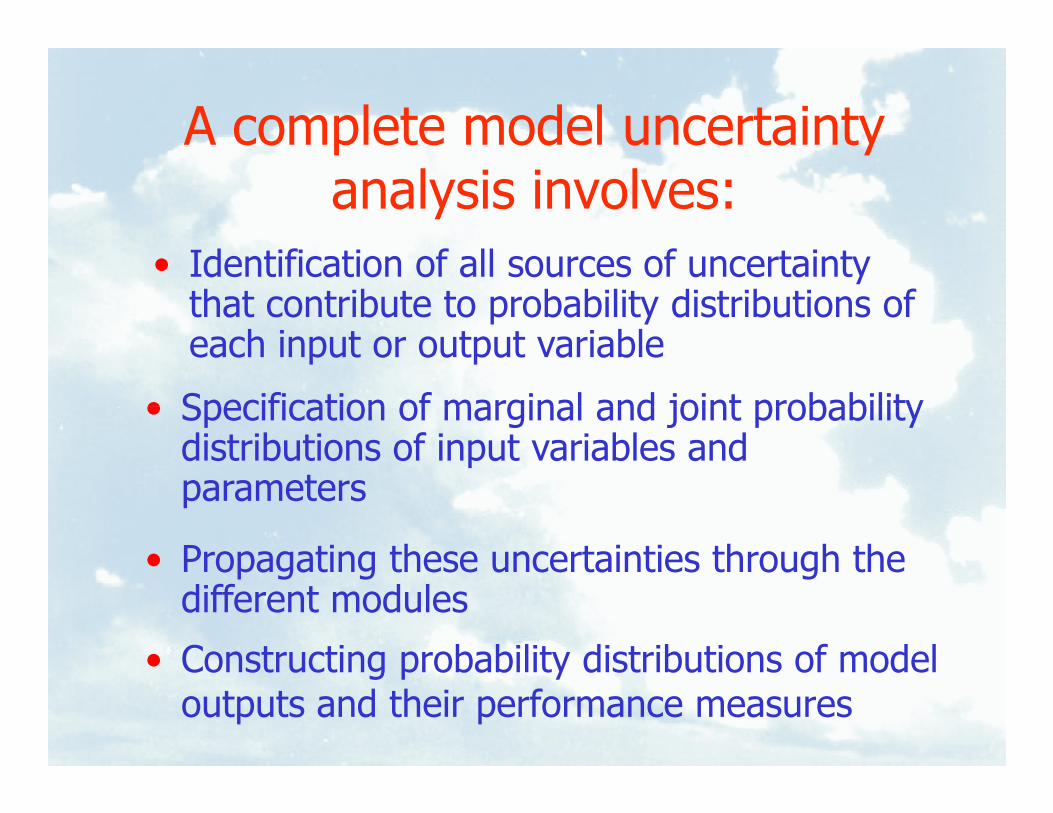
A complete model uncertainty analysis involves:
• Identification of all sources of uncertainty that contribute to probability distributions of each input or output variable
• Specification of marginal and joint probability
• Constructing probability distributions of model outputs and their performance measures
• Specification of marginal and joint probability distributions of input variables and parameters
• Propagating these uncertainties through the different modules
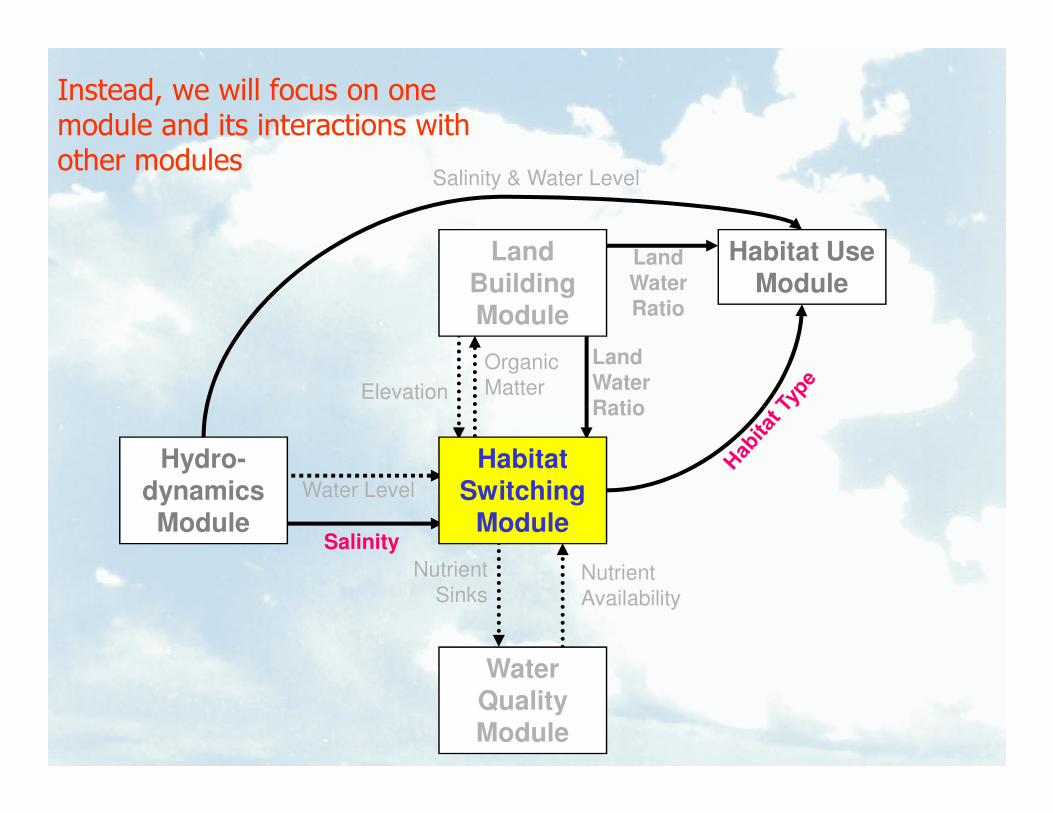
Instead, we will focus on one module and its interactions with other modules
Organic
MatterElevation
Land
Water
Ratio
Land
Water
Ratio
Salinity & Water Level
Land Building Module
Habitat Use Module
Water Level
Salinity
Nutrient
Availability
Water Quality Module
Nutrient
Sinks
Ratio
Hydro-dynamics Module
Habitat Switching
Module
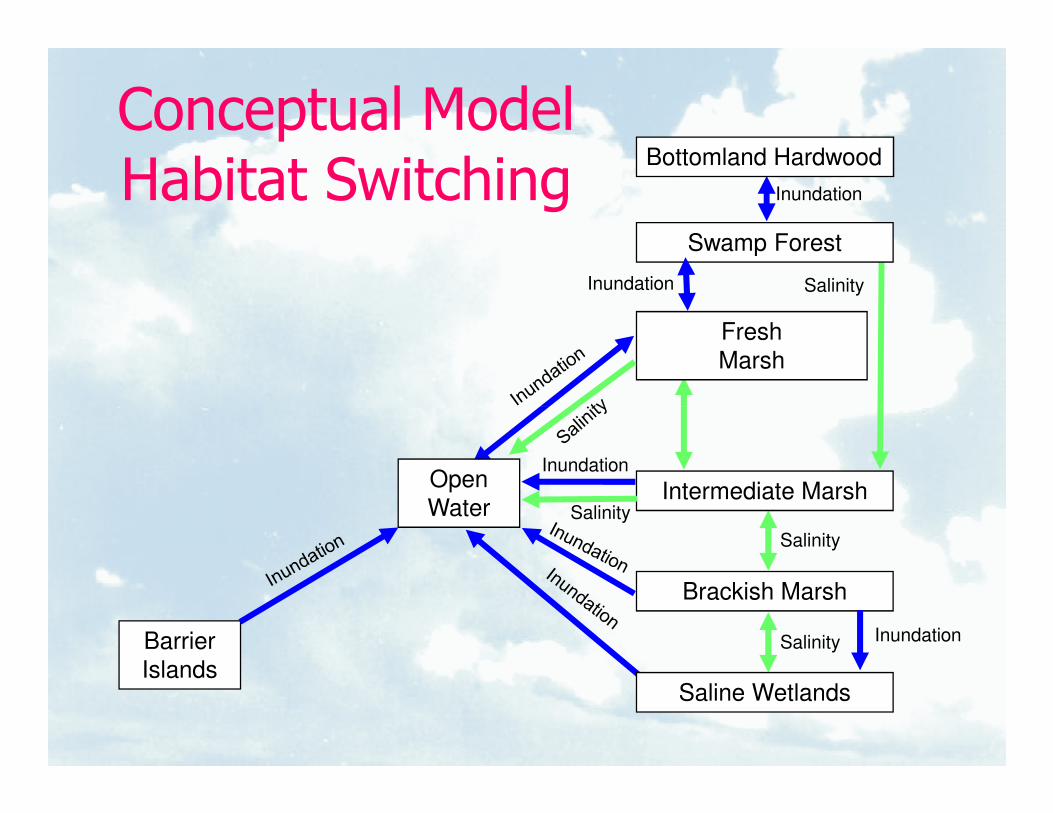
Inundation
Salinity
Bottomland Hardwood
Swamp Forest
Fresh
Marsh
Conceptual Model Habitat Switching
Inundation
Salinity
Salinity
Intermediate Marsh
Brackish Marsh
Saline Wetlands
Open
Water
Barrier
Islands
Inundation
Inundation
Salinity
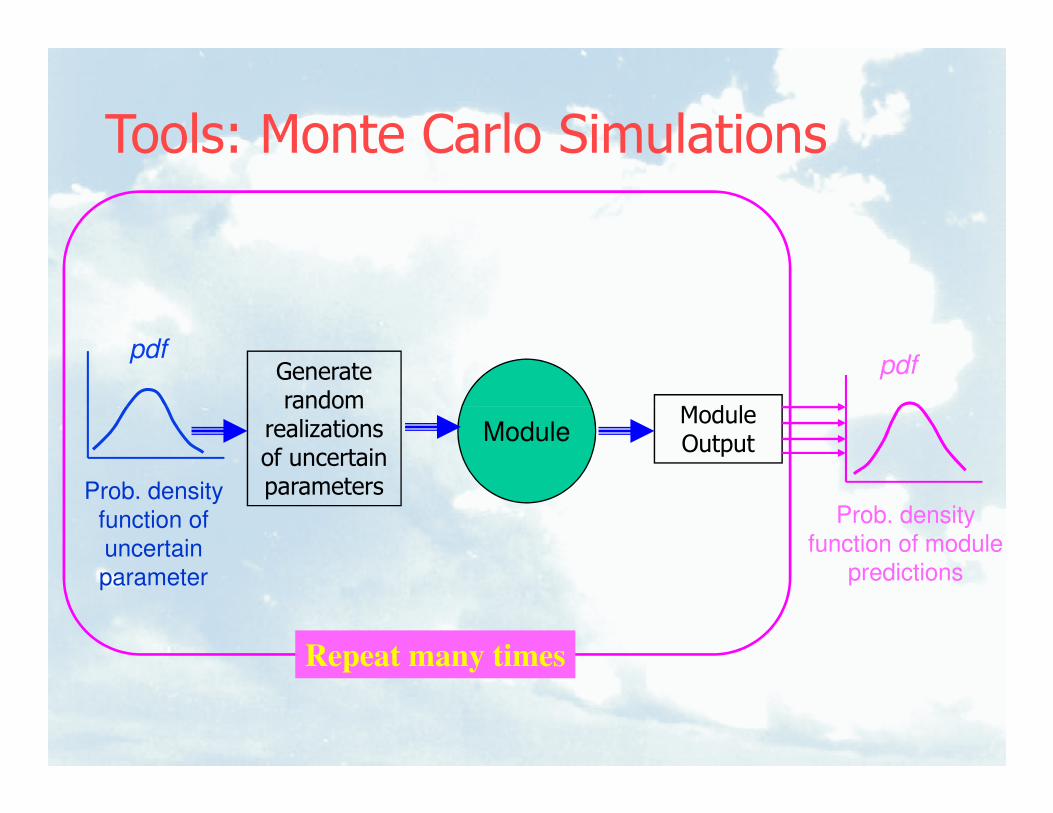
Tools: Monte Carlo Simulations
pdfGenerate random
Module
Prob. density
function of
uncertain
parameter
random realizations of uncertain parameters
ModuleModule Output
Repeat many times
Prob. density
function of module
predictions
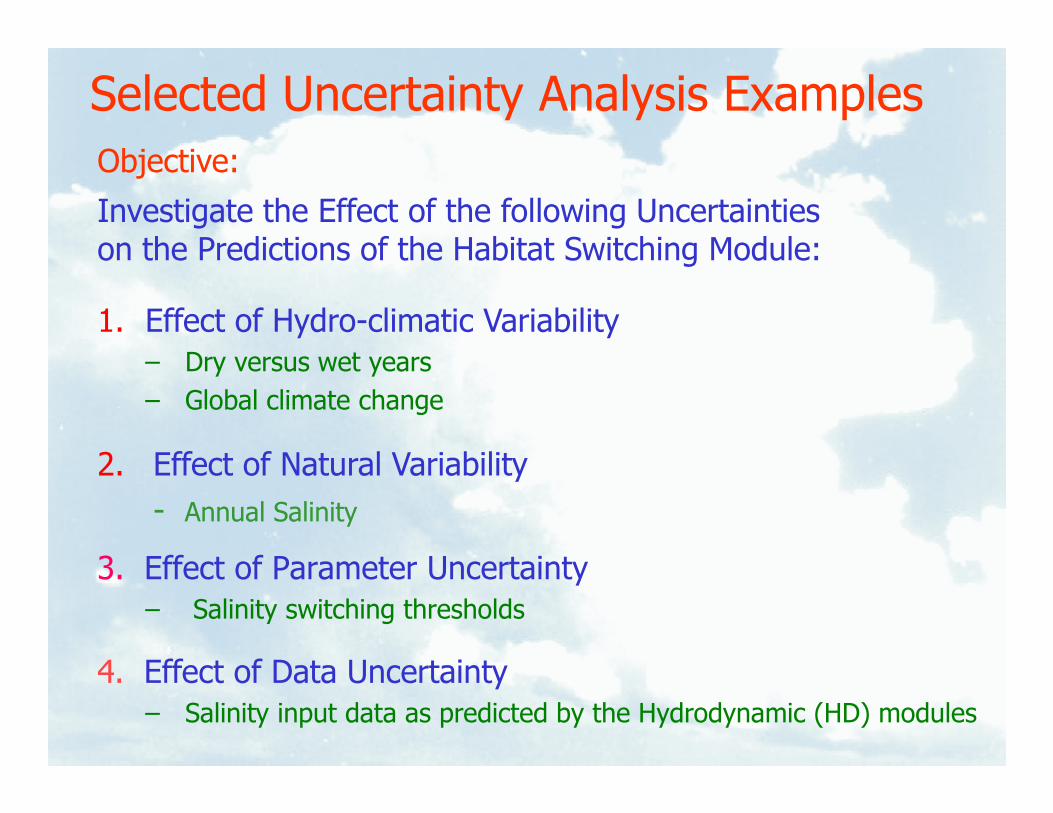
Selected Uncertainty Analysis Examples
Objective:
Investigate the Effect of the following Uncertainties on the Predictions of the Habitat Switching Module:
1. Effect of Hydro-climatic Variability
– Dry versus wet years
– Global climate change
3. Effect of Parameter Uncertainty
– Salinity switching thresholds
– Global climate change
4. Effect of Data Uncertainty
– Salinity input data as predicted by the Hydrodynamic (HD) modules
2. Effect of Natural Variability
- Annual Salinity
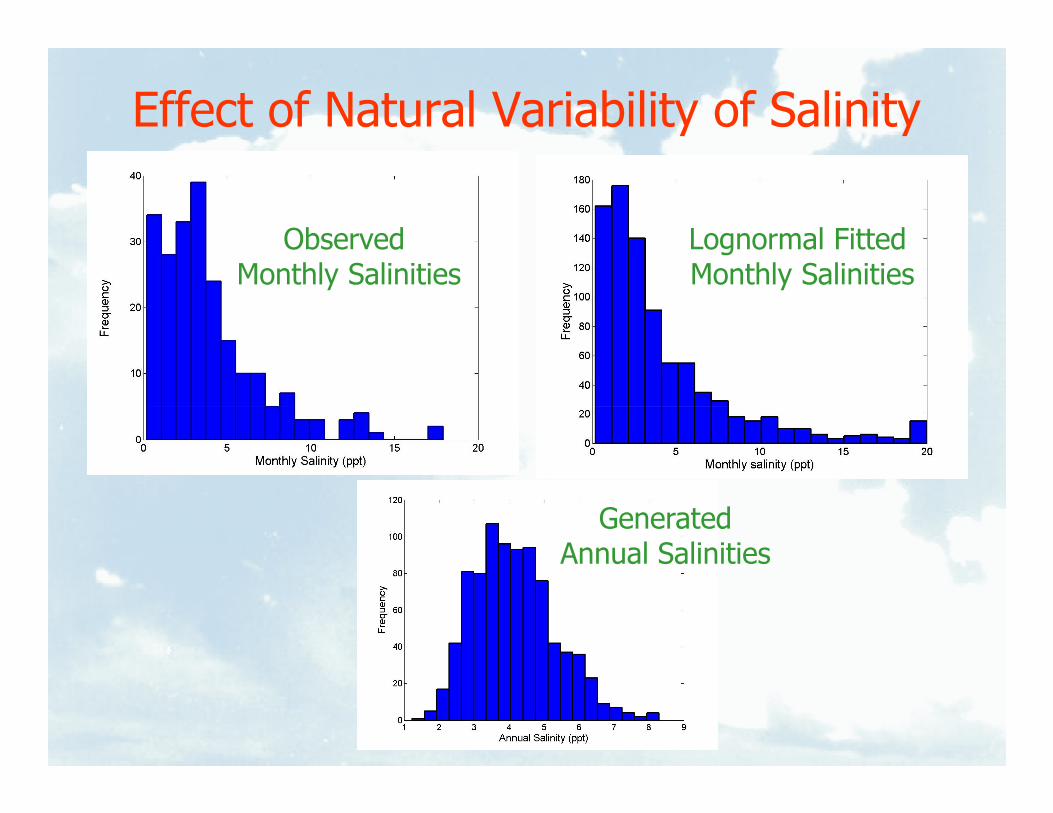
Effect of Natural Variability of Salinity
Observed Monthly Salinities
Lognormal Fitted Monthly Salinities
GeneratedAnnual Salinities
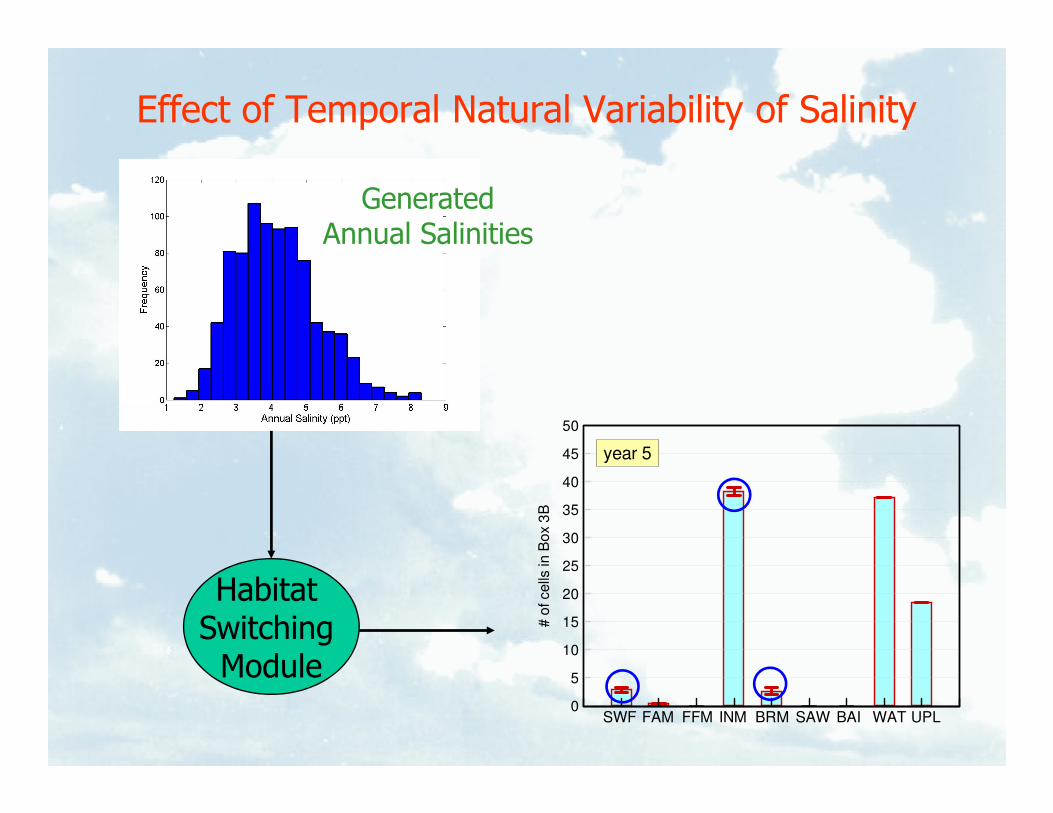
Effect of Temporal Natural Variability of Salinity
GeneratedAnnual Salinities
#o
fcells
inB
ox
3B
0
5
10
15
20
25
30
35
40
45
50
UPLSWF FFM INM BRM SAW BAI WATFAM
year 5
Habitat Switching
Module
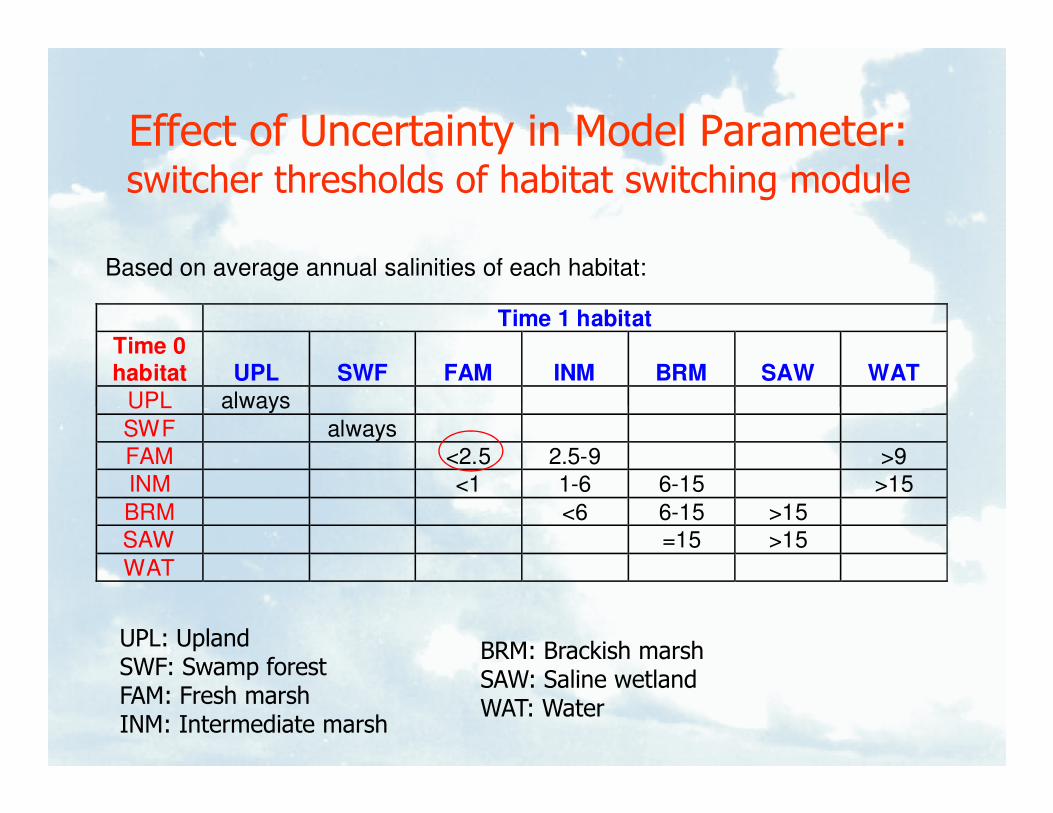
Effect of Uncertainty in Model Parameter:switcher thresholds of habitat switching module
Time 1 habitat
Time 0 habitat
UPL
SWF
FAM
INM
BRM
SAW
WAT
UPL always
Based on average annual salinities of each habitat:
UPL always
SWF always
FAM <2.5 2.5-9 >9
INM <1 1-6 6-15 >15
BRM <6 6-15 >15
SAW =15 >15
WAT
UPL: UplandSWF: Swamp forestFAM: Fresh marshINM: Intermediate marsh
BRM: Brackish marshSAW: Saline wetlandWAT: Water
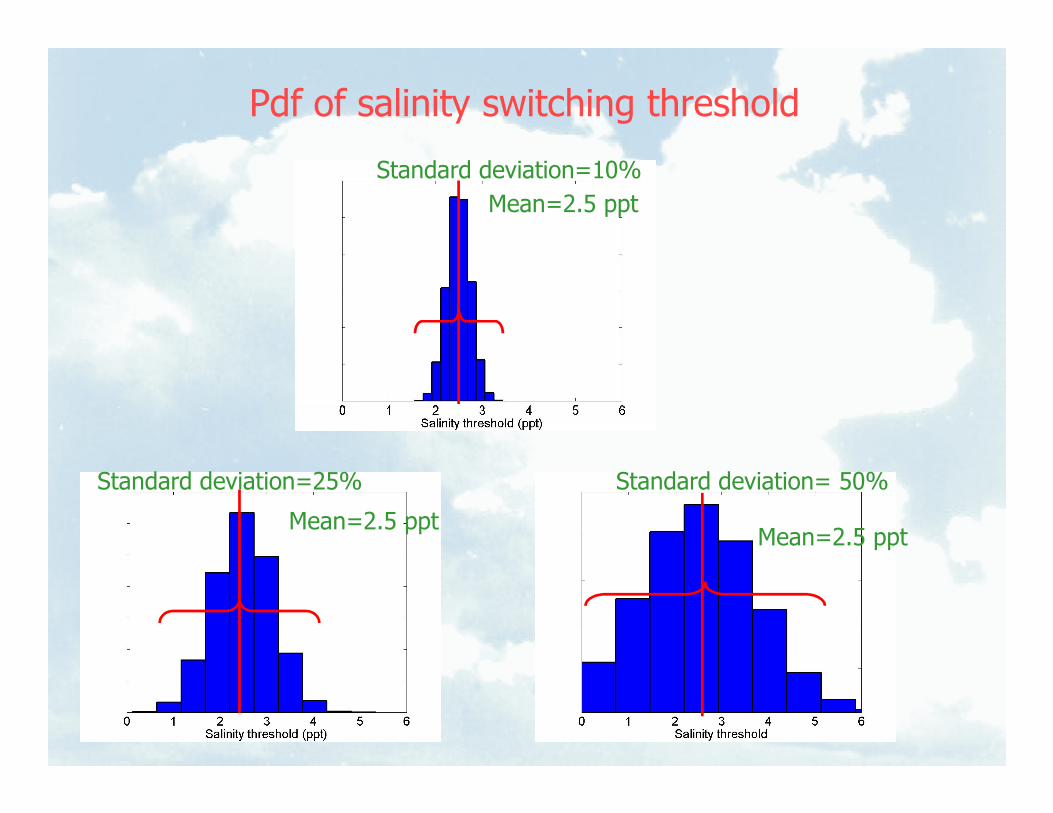
Pdf of salinity switching threshold
Mean=2.5 ppt
Standard deviation=10%
Standard deviation=25% Standard deviation= 50%
Mean=2.5 pptMean=2.5 ppt
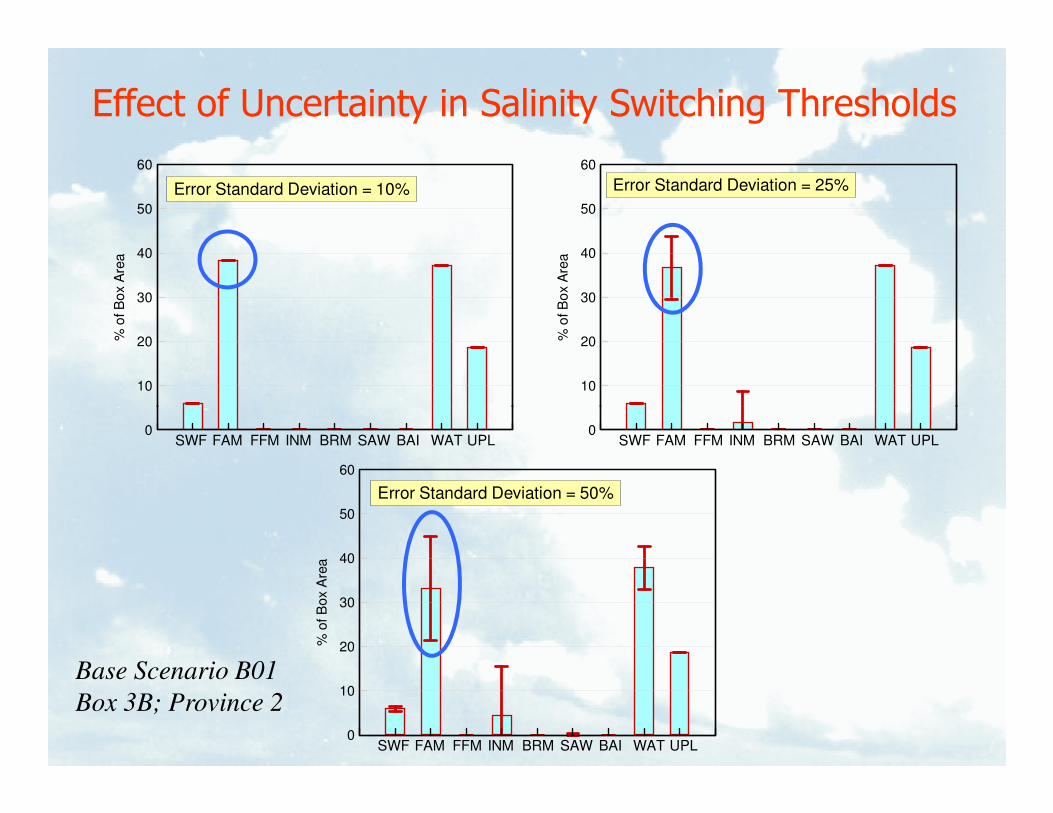
Effect of Uncertainty in Salinity Switching Thresholds
%o
fB
ox
Are
a
10
20
30
40
50
60
Error Standard Deviation = 25%
%o
fB
ox
Are
a
10
20
30
40
50
60
Error Standard Deviation = 10%
Base Scenario B01
Box 3B; Province 2
0UPLSWF FFM INM BRM SAW BAI WATFAM
0UPLSWF FFM INM BRM SAW BAI WATFAM
%ofB
ox
Are
a
0
10
20
30
40
50
60
UPLSWF FFM INM BRM SAW BAI WATFAM
Error Standard Deviation = 50%
• Inputs to many of the CLEAR modules are mostly based on predictions from
Data Uncertainty
mostly based on predictions from hydrodynamic (HD) models; these HD predictions can be associated with:
– Random errors
– Systematic errors
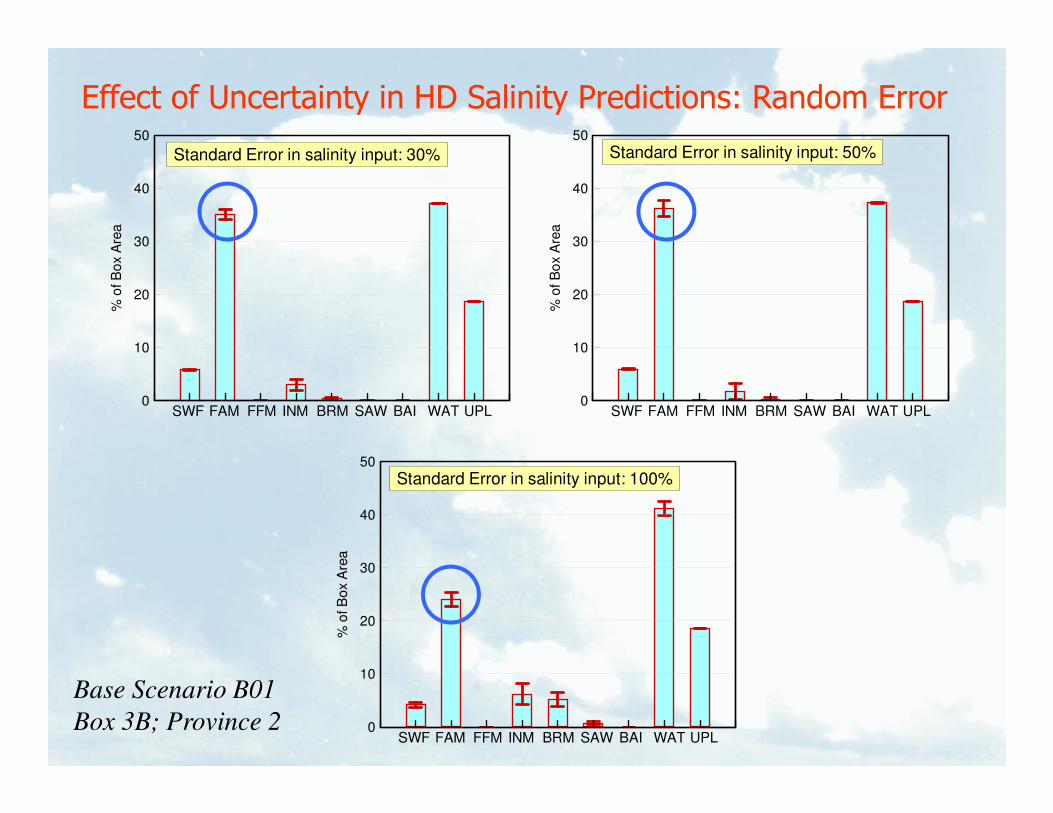
Effect of Uncertainty in HD Salinity Predictions: Random Error
%ofB
ox
Are
a
0
10
20
30
40
50
UPLSWF FFM INM BRM SAW BAI WATFAM
Standard Error in salinity input: 50%
%o
fB
ox
Are
a
0
10
20
30
40
50
UPLSWF FFM INM BRM SAW BAI WATFAM
Standard Error in salinity input: 30%
Base Scenario B01
Box 3B; Province 2
0UPLSWF FFM INM BRM SAW BAI WATFAM
%o
fB
ox
Are
a
0
10
20
30
40
50
UPLSWF FFM INM BRM SAW BAI WATFAM
Standard Error in salinity input: 100%
0UPLSWF FFM INM BRM SAW BAI WATFAM
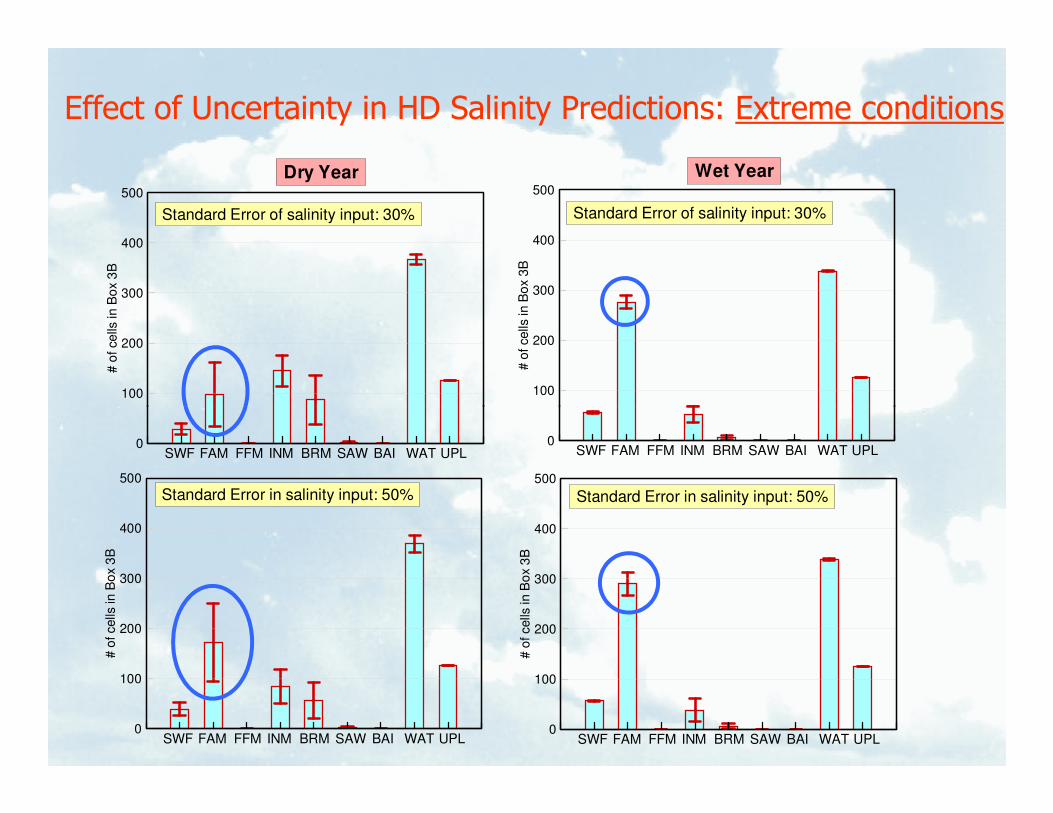
Effect of Uncertainty in HD Salinity Predictions: Extreme conditions
#o
fcells
inB
ox
3B
100
200
300
400
500
Standard Error of salinity input: 30%
Wet Year
#o
fcells
inB
ox
3B
100
200
300
400
500
Standard Error of salinity input: 30%
Dry Year
#o
fcells
inB
ox
3B
0
100
200
300
400
500
UPLSWF FFM INM BRM SAW BAI WATFAM
Standard Error in salinity input: 50%
#o
fcells
inB
ox
3B
0
100
200
300
400
500
UPLSWF FFM INM BRM SAW BAI WATFAM
Standard Error in salinity input: 50%
0UPLSWF FFM INM BRM SAW BAI WATFAM
0UPLSWF FFM INM BRM SAW BAI WATFAM
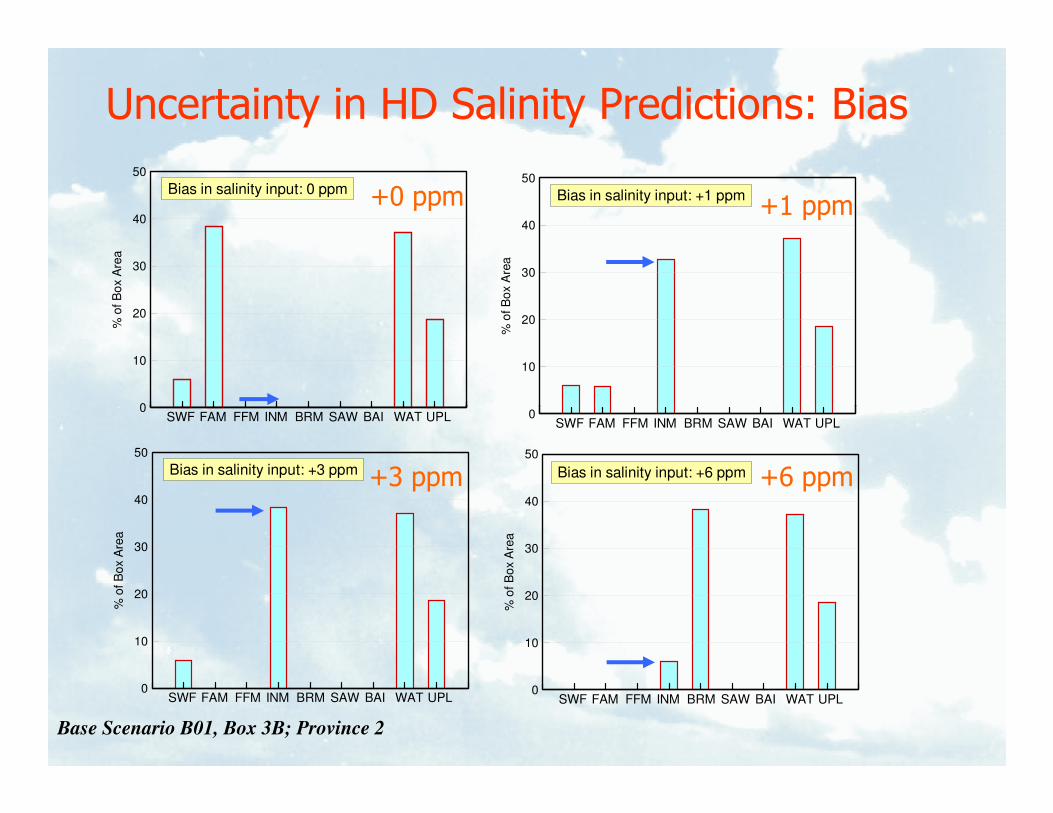
Uncertainty in HD Salinity Predictions: Bias%
ofB
ox
Are
a
0
10
20
30
40
50
Bias in salinity input: 0 ppm
%o
fB
ox
Are
a
10
20
30
40
50
Bias in salinity input: +1 ppm+0 ppm +1 ppm
Base Scenario B01, Box 3B; Province 2
0UPLSWF FFM INM BRM SAW BAI WATFAM 0
UPLSWF FFM INM BRM SAW BAI WATFAM
%o
fB
ox
Are
a
0
10
20
30
40
50
UPLSWF FFM INM BRM SAW BAI WATFAM
Bias in salinity input: +3 ppm
%o
fB
ox
Are
a
0
10
20
30
40
50
UPLSWF FFM INM BRM SAW BAI WATFAM
Bias in salinity input: +6 ppm+3 ppm +6 ppm
Summary: Natural variability and climate change effects
• Systematic, persistent long-term changes in salinity levels have more impact on model predictions than local temporal variability in the salinitythe salinity
• Effect of uncertainties in parameters of habitat switching module (e.g., switching thresholds) can be significant
– More research and data are required to improve
Summary: Effect of Uncertainty in Model Parameter
– More research and data are required to improve the selection of these parameters
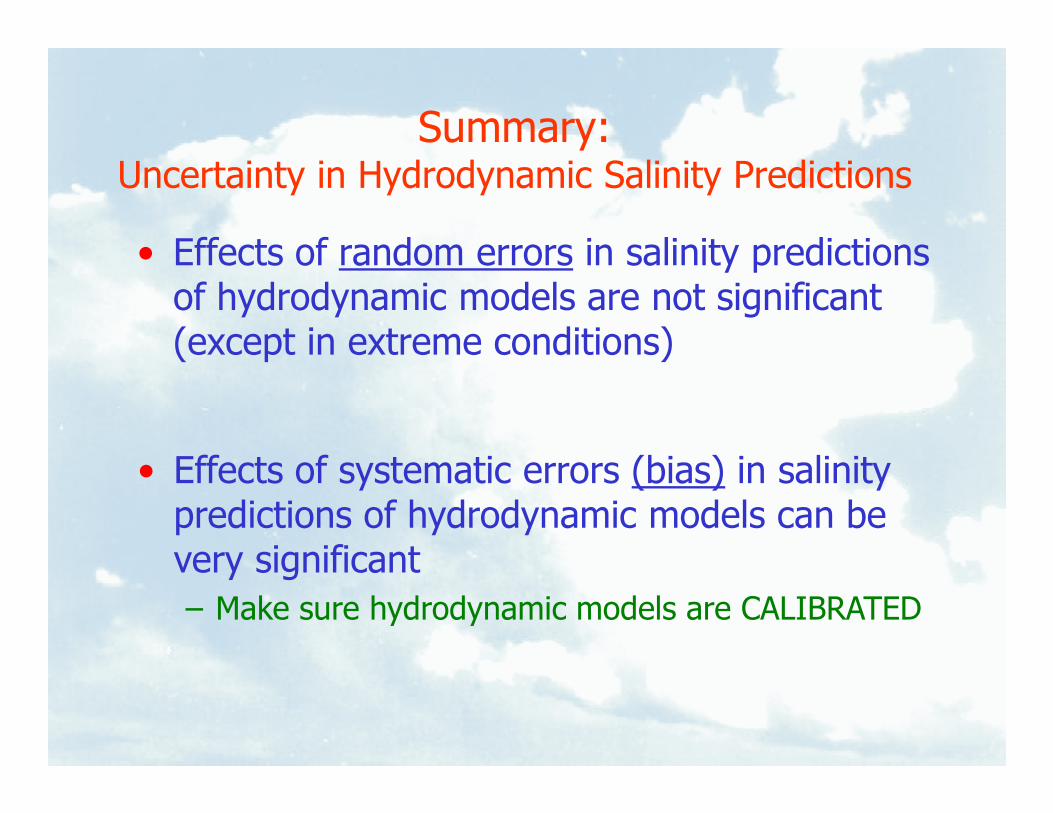
Summary: Uncertainty in Hydrodynamic Salinity Predictions
• Effects of random errors in salinity predictions of hydrodynamic models are not significant (except in extreme conditions)
• Effects of systematic errors (bias) in salinity predictions of hydrodynamic models can be very significant
– Make sure hydrodynamic models are CALIBRATED
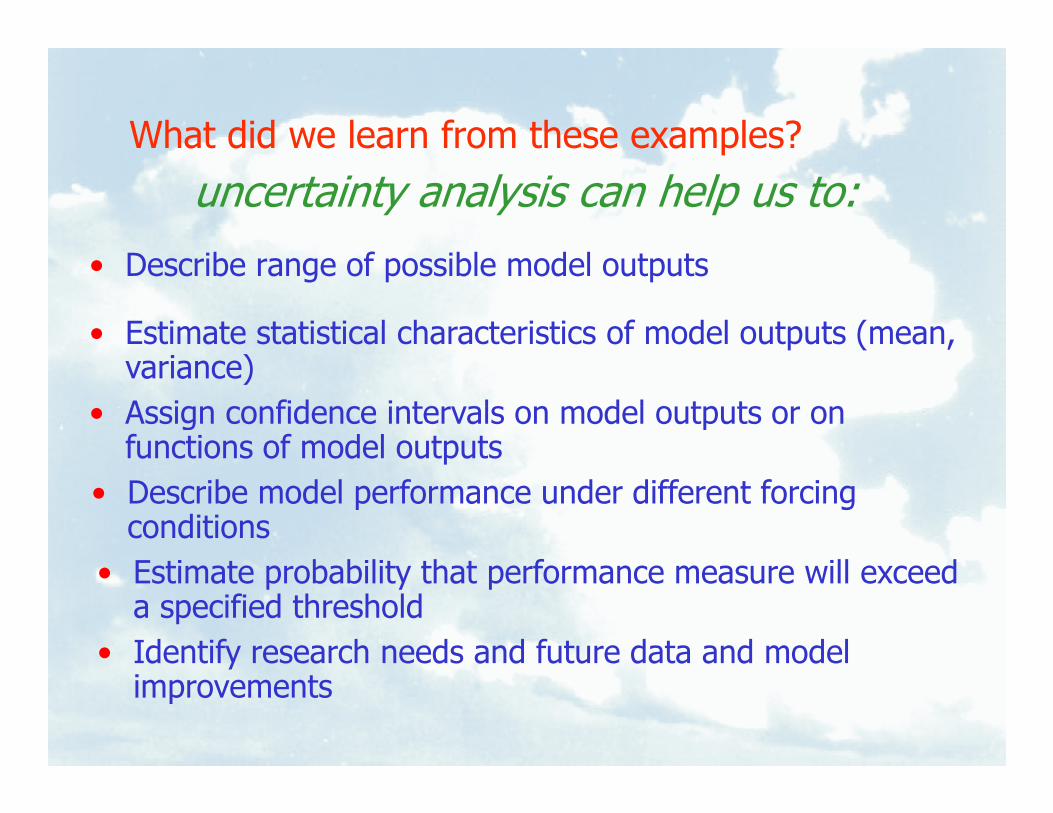
What did we learn from these examples?
• Describe range of possible model outputs
• Estimate statistical characteristics of model outputs (mean, variance)
• Assign confidence intervals on model outputs or on
uncertainty analysis can help us to:
• Assign confidence intervals on model outputs or on functions of model outputs
• Describe model performance under different forcing conditions
• Estimate probability that performance measure will exceed a specified threshold
• Identify research needs and future data and model improvements
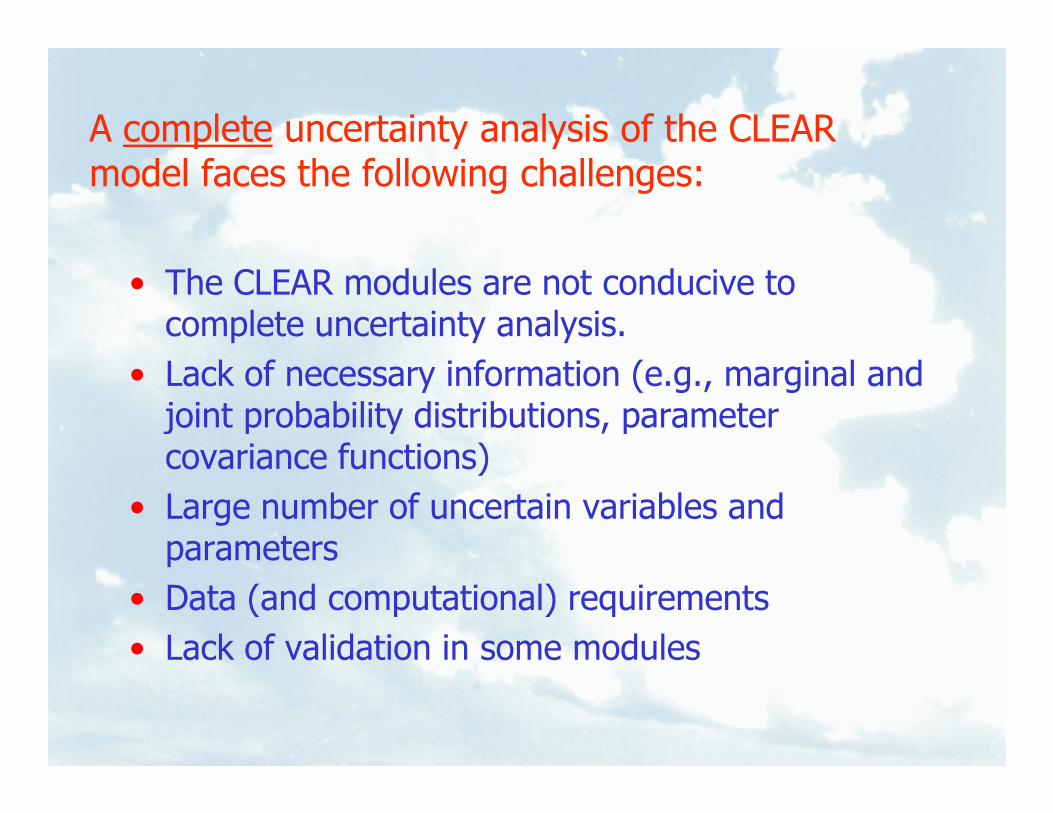
A complete uncertainty analysis of the CLEAR model faces the following challenges:
• The CLEAR modules are not conducive to complete uncertainty analysis.
• Lack of necessary information (e.g., marginal and joint probability distributions, parameter joint probability distributions, parameter covariance functions)
• Large number of uncertain variables and parameters
• Data (and computational) requirements
• Lack of validation in some modules
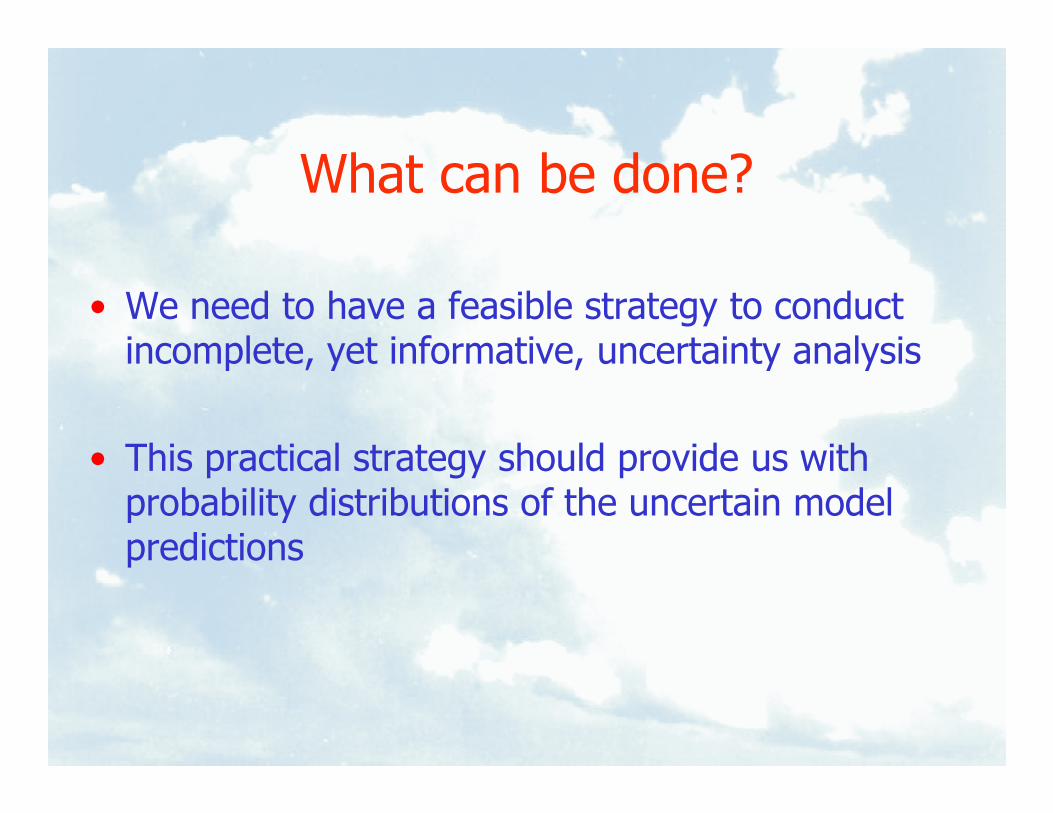
What can be done?
• We need to have a feasible strategy to conduct incomplete, yet informative, uncertainty analysis
• This practical strategy should provide us with probability distributions of the uncertain model predictions
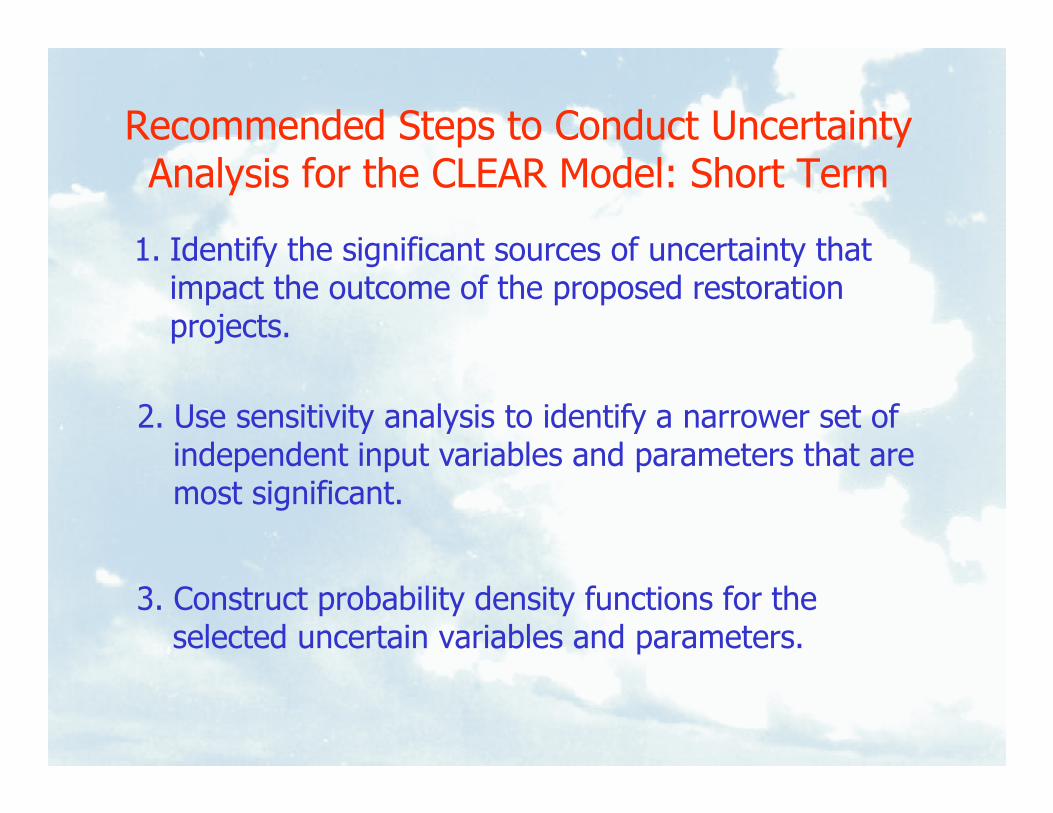
Recommended Steps to Conduct Uncertainty Analysis for the CLEAR Model: Short Term
1. Identify the significant sources of uncertainty that impact the outcome of the proposed restoration projects.
2. Use sensitivity analysis to identify a narrower set of
3. Construct probability density functions for the selected uncertain variables and parameters.
2. Use sensitivity analysis to identify a narrower set of independent input variables and parameters that are most significant.
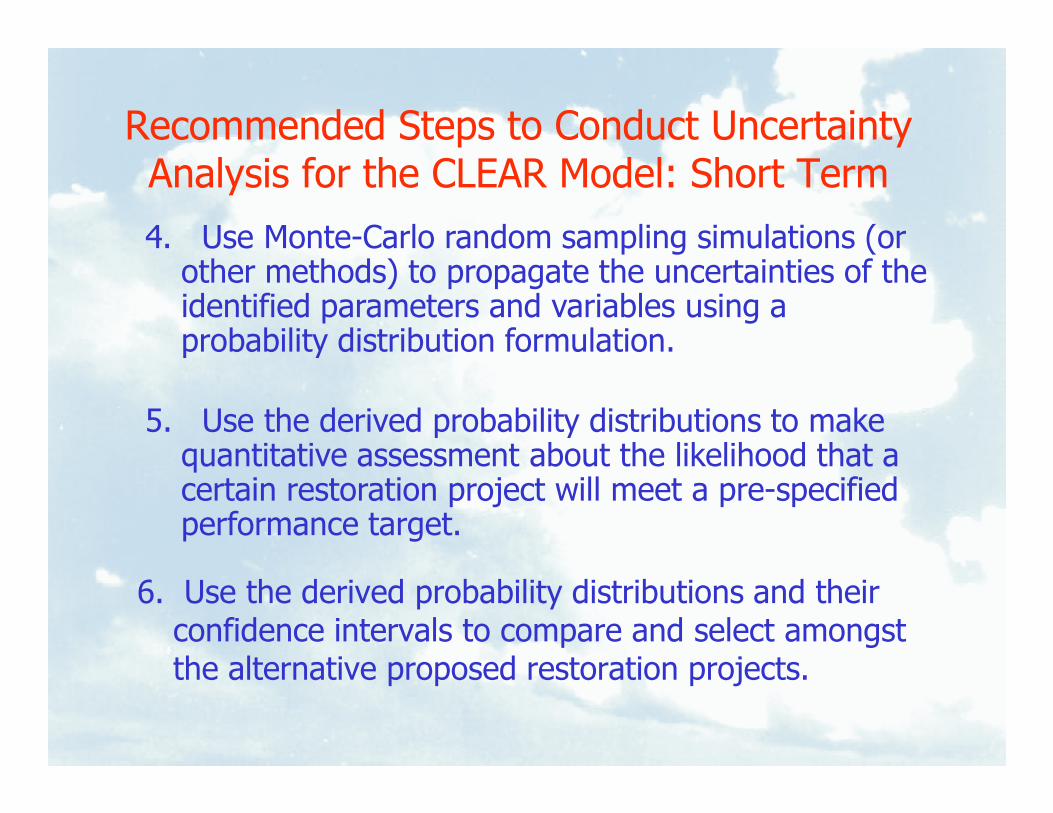
Recommended Steps to Conduct Uncertainty Analysis for the CLEAR Model: Short Term
4. Use Monte-Carlo random sampling simulations (or other methods) to propagate the uncertainties of the identified parameters and variables using a probability distribution formulation.
5. Use the derived probability distributions to make
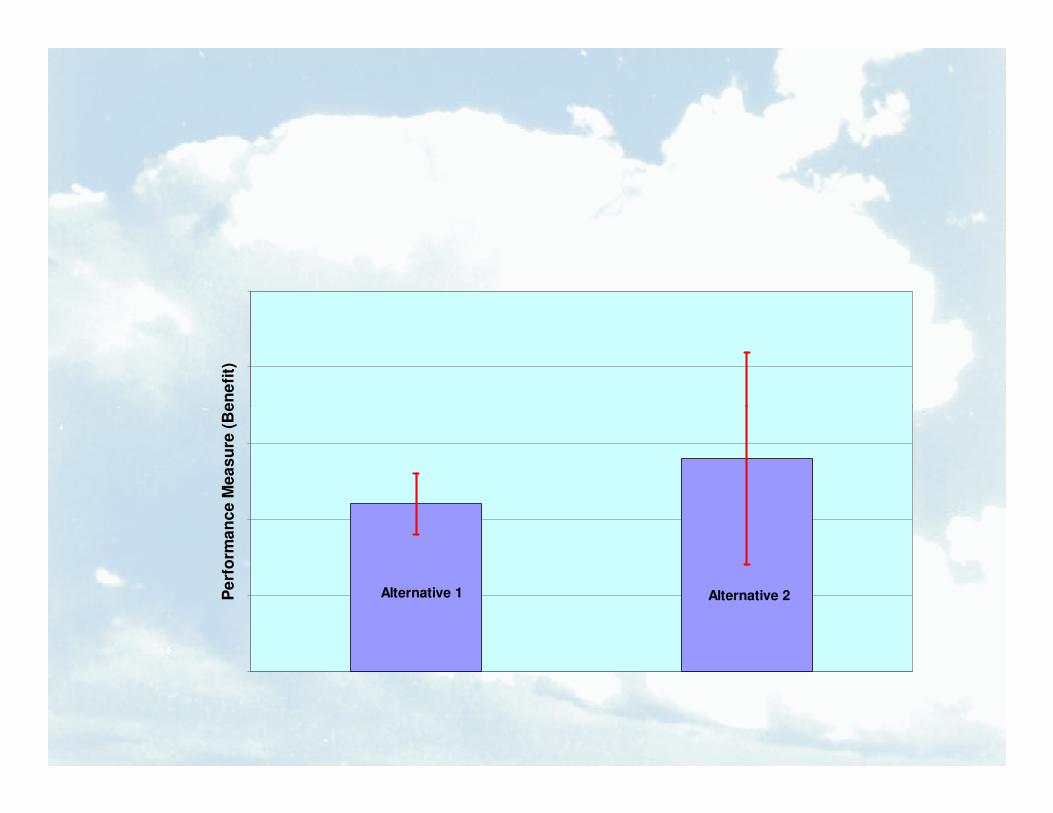
6. Use the derived probability distributions and their confidence intervals to compare and select amongst the alternative proposed restoration projects.
5. Use the derived probability distributions to make quantitative assessment about the likelihood that a certain restoration project will meet a pre-specified performance target.
Long Term Strategy:
• Model calibration and validation
• Model restructuring
• Acquisition of reference baseline data sets• Acquisition of reference baseline data sets
• …….
• …….

EndThank You!
Pe
rfo
rma
nc
e M
ea
su
re (
Be
ne
fit)
Alternative 2Alternative 1
A lte rn a tiv e 1 A lte rn a tiv e 2
Pe
rfo
rma
nc
e M
ea
su
re (
Be
ne
fit)
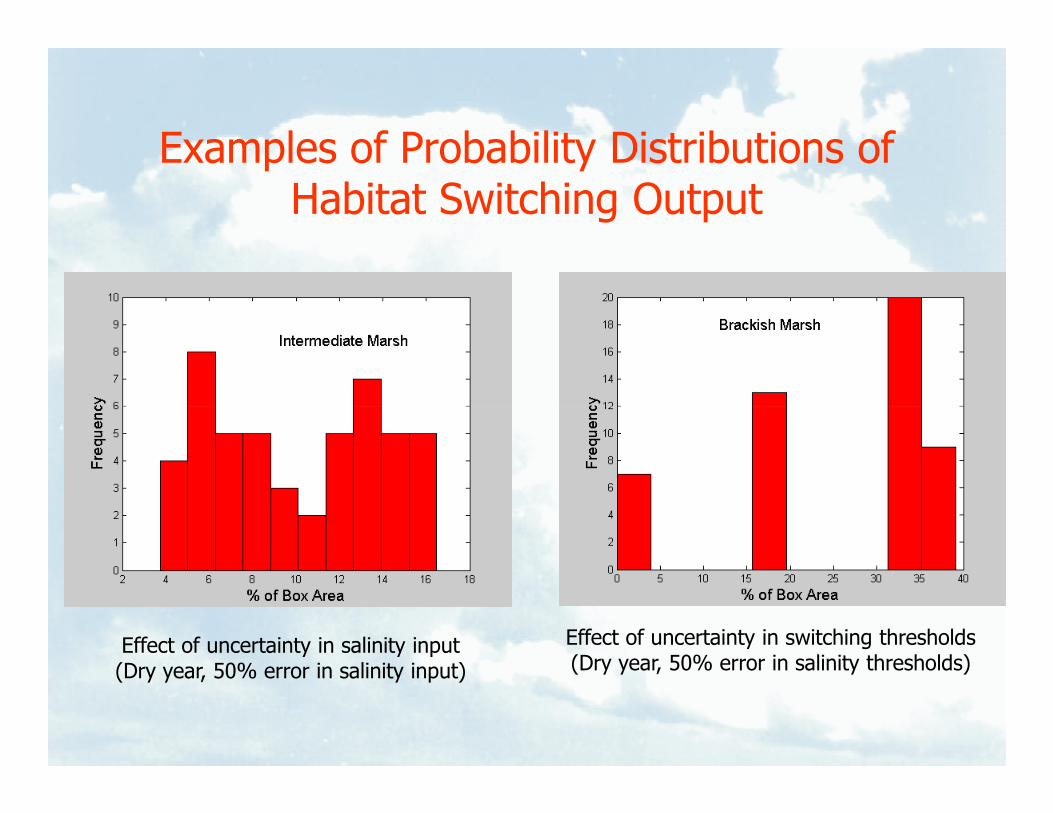
Examples of Probability Distributions of Habitat Switching Output
Effect of uncertainty in salinity input(Dry year, 50% error in salinity input)
Effect of uncertainty in switching thresholds(Dry year, 50% error in salinity thresholds)
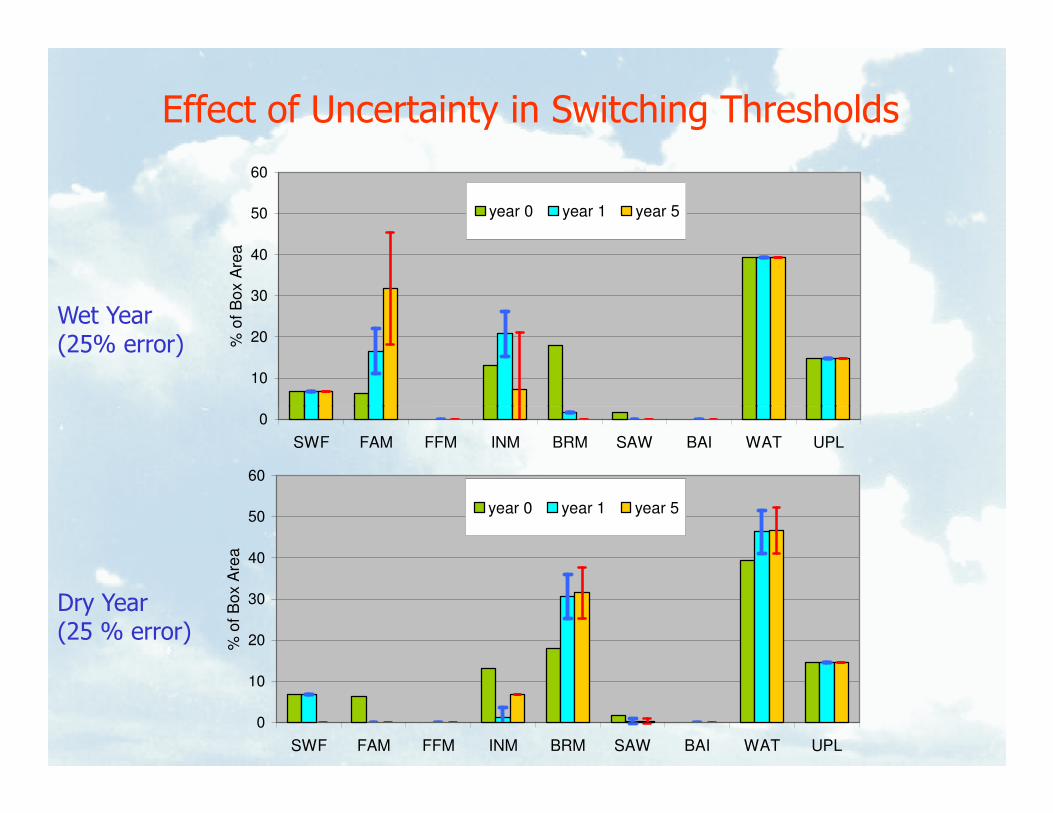
Effect of Uncertainty in Switching Thresholds
Wet Year(25% error)
10
20
30
40
50
60
% o
f B
ox A
rea
year 0 year 1 year 5
Dry Year(25 % error)
0
SWF FAM FFM INM BRM SAW BAI WAT UPL
0
10
20
30
40
50
60
SWF FAM FFM INM BRM SAW BAI WAT UPL
% o
f B
ox A
rea
year 0 year 1 year 5
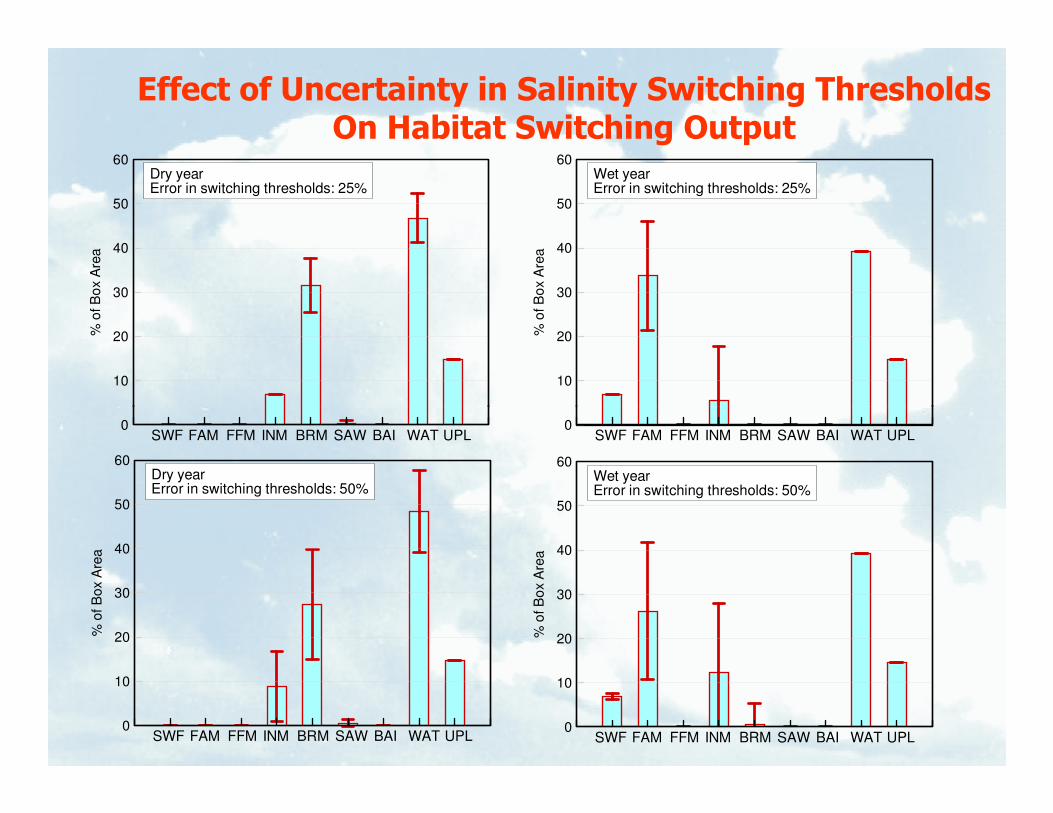
Effect of Uncertainty in Salinity Switching ThresholdsOn Habitat Switching Output
%o
fB
ox
Are
a
10
20
30
40
50
60Wet yearError in switching thresholds: 25%
%o
fB
ox
Are
a
10
20
30
40
50
60Dry yearError in switching thresholds: 25%
0UPLSWF FFM INM BRM SAW BAI WATFAM
%ofB
ox
Are
a
0
10
20
30
40
50
60
UPLSWF FFM INM BRM SAW BAI WATFAM
Dry yearError in switching thresholds: 50%
%o
fB
ox
Are
a
0
10
20
30
40
50
60
UPLSWF FFM INM BRM SAW BAI WATFAM
Wet yearError in switching thresholds: 50%
0UPLSWF FFM INM BRM SAW BAI WATFAM
How to quantify uncertainty?
�Model validation is a key factor for
performing uncertainty analysis!
�Problem: Lack of validation (for some modules)
�Problem: some models are difficult to validate
(e.g., habitat use)
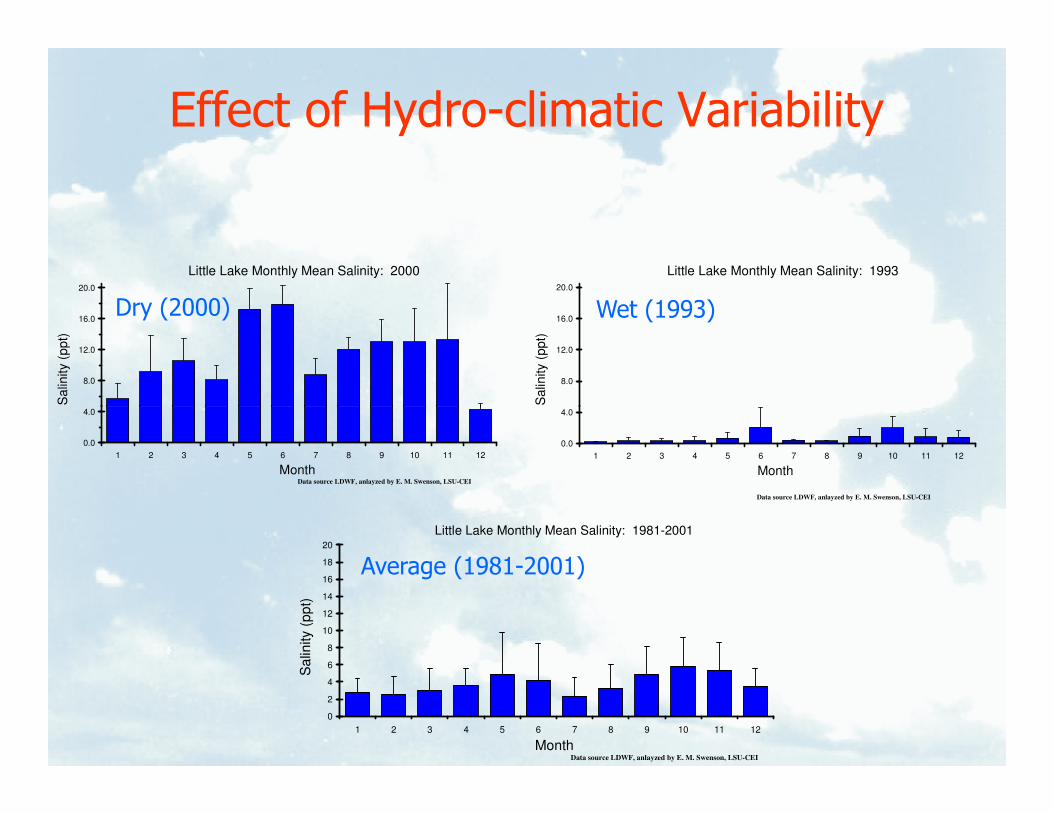
Effect of Hydro-climatic Variability
Little Lake Monthly Mean Salinity: 1993
8.0
12.0
16.0
20.0
Sa
linity (
pp
t)
Wet (1993)
Little Lake Monthly Mean Salinity: 2000
8.0
12.0
16.0
20.0
Sa
linity (
pp
t)
Dry (2000)
Little Lake Monthly Mean Salinity: 1981-2001
0
2
4
6
8
10
12
14
16
18
20
1 2 3 4 5 6 7 8 9 10 11 12
Month
Sa
linity (
pp
t)
Data source LDWF, anlayzed by E. M. Swenson, LSU-CEI
Average (1981-2001)
0.0
4.0
1 2 3 4 5 6 7 8 9 10 11 12
Month
Data source LDWF, anlayzed by E. M. Swenson, LSU-CEI
0.0
4.0
1 2 3 4 5 6 7 8 9 10 11 12
MonthData source LDWF, anlayzed by E. M. Swenson, LSU-CEI
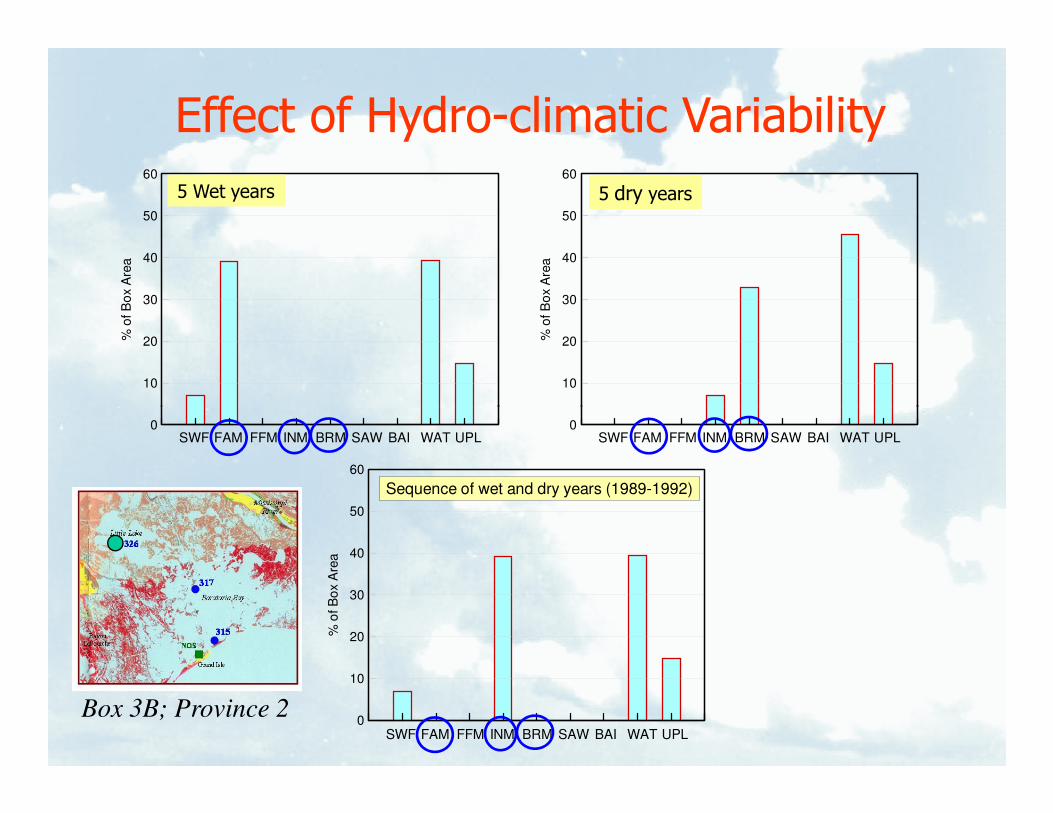
Effect of Hydro-climatic Variability%
ofB
ox
Are
a
10
20
30
40
50
60
Wet Year
%o
fB
ox
Are
a
10
20
30
40
50
60
Dry year5 Wet years 5 dry years
Box 3B; Province 2
%o
fB
ox
Are
a
0
10
20
30
40
50
60
UPLSWF FFM INM BRM SAW BAI WATFAM
Sequence of wet and dry years (1989-1992)
0UPLSWF FFM INM BRM SAW BAI WATFAM
0UPLSWF FFM INM BRM SAW BAI WATFAM
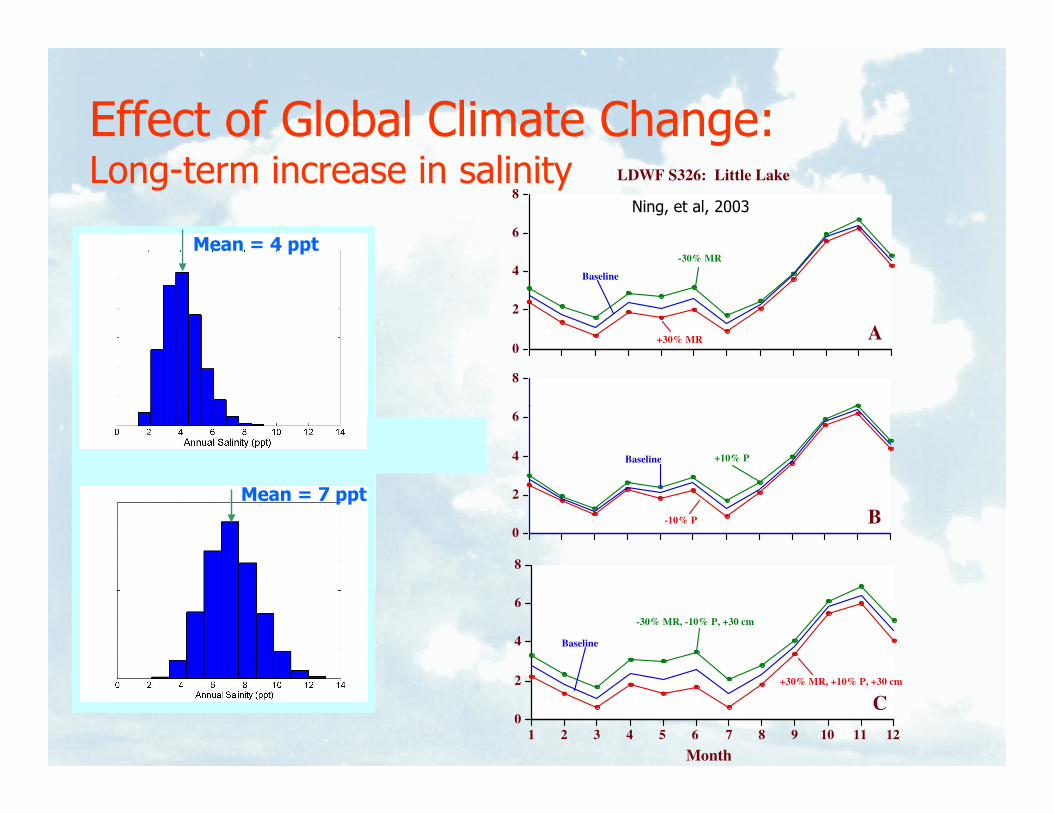
Effect of Global Climate Change:Long-term increase in salinity
0
2
4
6
8
8
Baseline
+30% MR
-30% MR
LDWF S326: Little Lake
A
Mean = 4 ppt
Ning, et al, 2003
0
2
4
6
Salinity (ppt)
0
2
4
6
8
1 2 3 4 5 6 7 8 9 10 11 12
Month
-10% P
+10% PBaseline
Baseline
-30% MR, -10% P, +30 cm
+30% MR, +10% P, +30 cm
B
C
Mean = 7 ppt
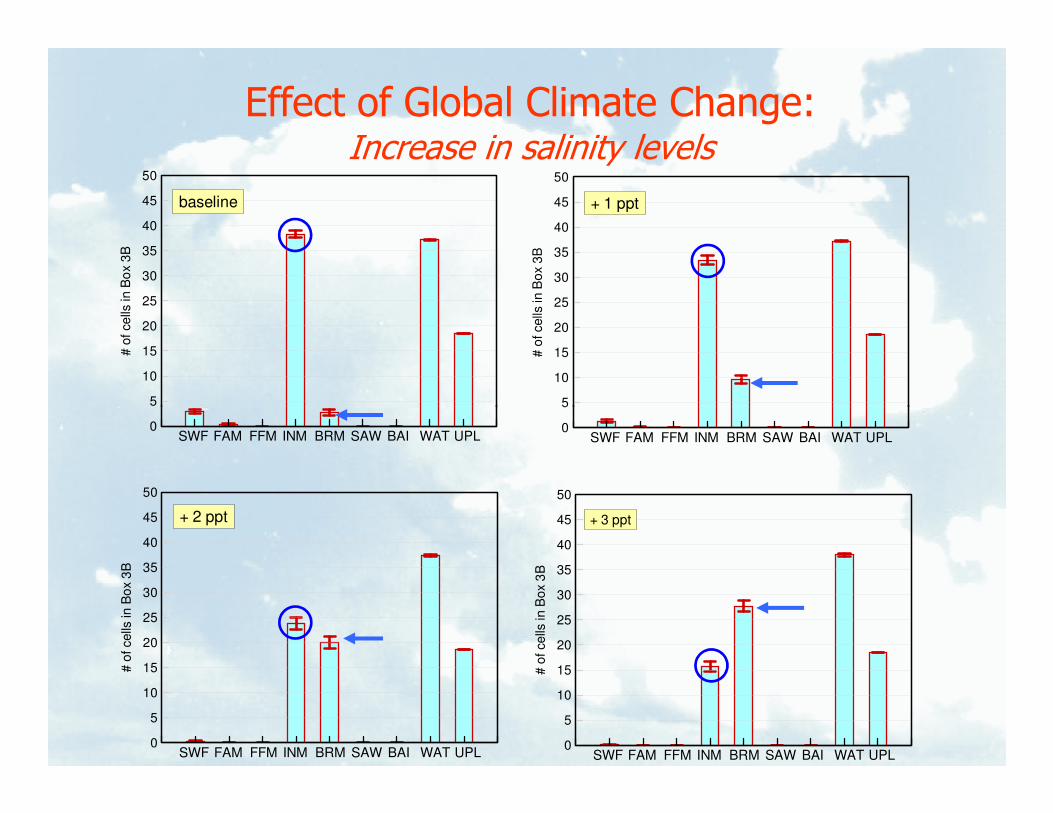
Effect of Global Climate Change:Increase in salinity levels
#ofcells
inB
ox
3B
5
10
15
20
25
30
35
40
45
50
baseline
#o
fcells
inB
ox
3B
5
10
15
20
25
30
35
40
45
50
+ 1 ppt
0
5
UPLSWF FFM INM BRM SAW BAI WATFAM0
5
UPLSWF FFM INM BRM SAW BAI WATFAM
#o
fcells
inB
ox
3B
0
5
10
15
20
25
30
35
40
45
50
UPLSWF FFM INM BRM SAW BAI WATFAM
+ 2 ppt
#ofcells
inB
ox
3B
0
5
10
15
20
25
30
35
40
45
50
UPLSWF FFM INM BRM SAW BAI WATFAM
+ 3 ppt