Embed Size (px)
Citation preview
Preliminary Southern Flank AMD Risk Assessment August 2016
AUGUST 2016
1
Document information
Function Resource Engineering (Closure Planning)
Author/s Garreth Carter/Richard Marton
Reviewer(s) Richard Marton
Date 30 August 2016
Current version no. 1.0
Document owner(s) Principal Closure Planning
File name RPD PER SF AMD Risk Assessment_v2.docx
File location Preliminary Southern Flank AMD Risk Assessment_v10.docx
Change history
Version No. Date changed Changed by Description of change
1.0 21/10/2016 Garreth Carter Initial document
AUGUST 2016
2
Table of Contents
EXECUTIVE SUMMARY .......................................................................................................................................... 5
1 INTRODUCTION ..................................................................................................................................... 6
1.1 AMD MANAGEMENT ............................................................................................................................. 6
1.2 PROJECT BACKGROUND .................................................................................................................... 6
1.2.1 Climate.................................................................................................................................... 9
1.2.2 Geology .................................................................................................................................. 9
1.2.2.1 Tertiary Sediments .................................................................................................................. 9
1.2.2.2 Proterozoic Formations ........................................................................................................... 9
1.2.3 Hydrology Surface Water ...................................................................................................... 10
1.2.4 Hydrology Groundwater ........................................................................................................ 10
1.2.5 Key Receptors ...................................................................................................................... 14
1.2.6 Pathway and Receptors ........................................................................................................ 14
2 ASSESSMENT METHODS ................................................................................................................... 15
2.1 AMD SOURCE ASSESSMENT ............................................................................................................. 15
2.1.1 AMD Classification ................................................................................................................ 15
2.1.2 Geological and laboratory Data Collection ............................................................................ 16
2.1.2.1 Geological and Assay Data................................................................................................... 16
2.1.2.2 AMD Laboratory Testing ....................................................................................................... 16
2.1.3 Assessment of Acid Drainage Potential ................................................................................ 17
2.1.4 Assessment of Metalliferous and Saline Drainage ................................................................ 19
2.2 APPROACH TO SOURCE-PATHWAY-RECEPTOR RISK ASSESSMENT .......................................... 19
3 RESULTS OF PRELIMINARY AMD SOURCE ASSESSMENT ........................................................... 20
3.1 ACIDIC DRAINAGE POTENTIAL .......................................................................................................... 20
3.1.1 Pit Walls ................................................................................................................................ 20
3.1.2 Mined Waste (Dumped ex-pit or in-pit) ................................................................................. 25
3.2 METALLIFEROUS AND SALINE DRAINAGE POTENTIAL .................................................................. 30
4 RESULTS OF SOURCE-PATHWAY-RECEPTOR RISK ASSESSMENT ............................................ 30
5 IMPROVEMENT ACTIVITIES ............................................................................................................... 33
6 REFERENCES ...................................................................................................................................... 34
AUGUST 2016
3
Tables
Table 1: AMD Classification in Block Models.......................................................................................................... 15
Table 2: Southern Flank Pit Wall Rock AMD % class by deposit (Derived from drillholes within 20m of the outside of preliminary pit shells) ................................................................................................................... 22
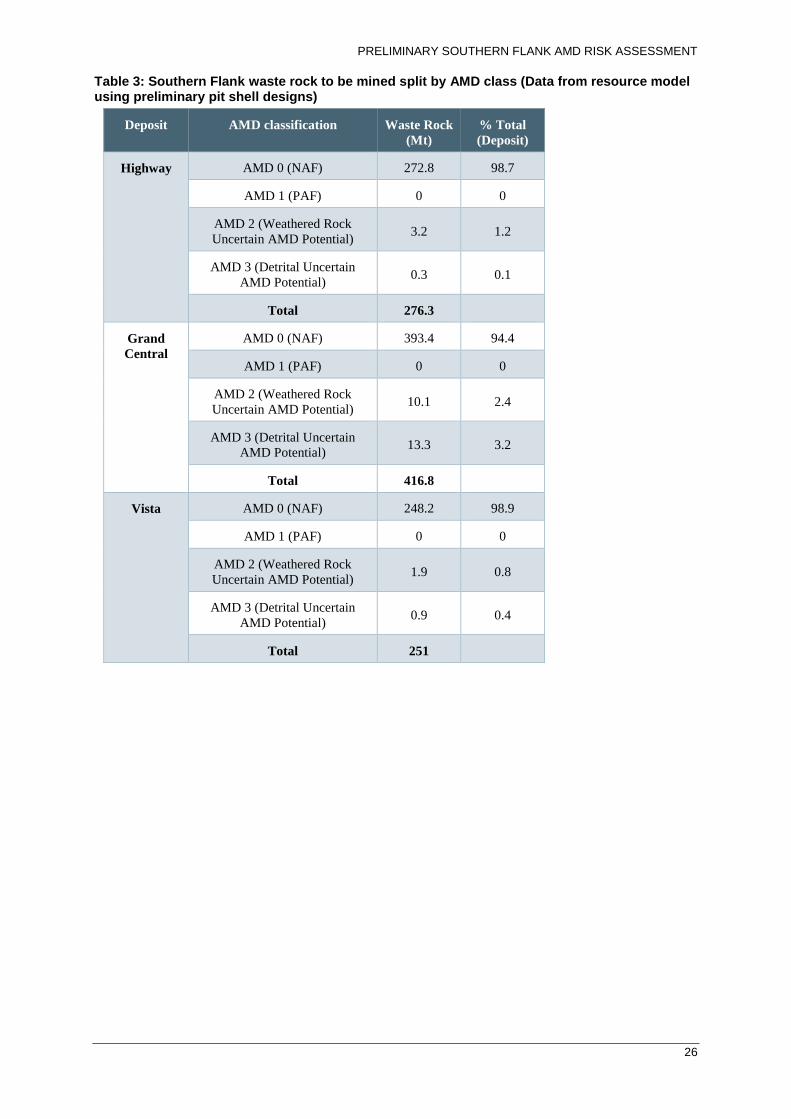
Table 3: Southern Flank waste rock to be mined split by AMD class (Data from resource model using preliminary pit shell designs) .............................................................................................................................. 26
Table 4: Southern Flank sampling of drillholes for calculated and laboratory tested NAPP by stratigraphy type (see Appendix A for stratigraphic unit name) ........................................................................................... 29
Table 5: Risk assessment summary of the likelihood of AMD generation from exposed wall rock, Southern Flank ................................................................................................................................................ 31
Table 6: Risk assessment summary of the likelihood of AMD generation from dumping of mined waste, Southern Flank ................................................................................................................................................ 31
Table 7: Risk Matrix ................................................................................................................................................ 32
Table 8: Risk assessment improvement activities .................................................................................................. 33
Figures
Figure 1: AMD Management process flow ................................................................................................................ 6
Figure 2: Southern Flank Proposed Development Location ..................................................................................... 7
Figure 3: Southern Flank deposits and indicative pit locations ................................................................................. 8
Figure 4: South Flank catchment and flow paths with regional catchments shown in the inset (after MWH, 2016) 12
Figure 5: South Flank regional hydrogeological setting and key regional receptors ............................................... 13
Figure 6: Preliminary South Flank mine plan with indicative total mined waste and waste by AMD class (excluding AMD 0 NAF material) per pushback................................................................................................. 21
Figure 7: Highway Pit Wall Source Assessment (Derived from drillholes within 20m of the outside of preliminary pit shells) ............................................................................................................................................... 23
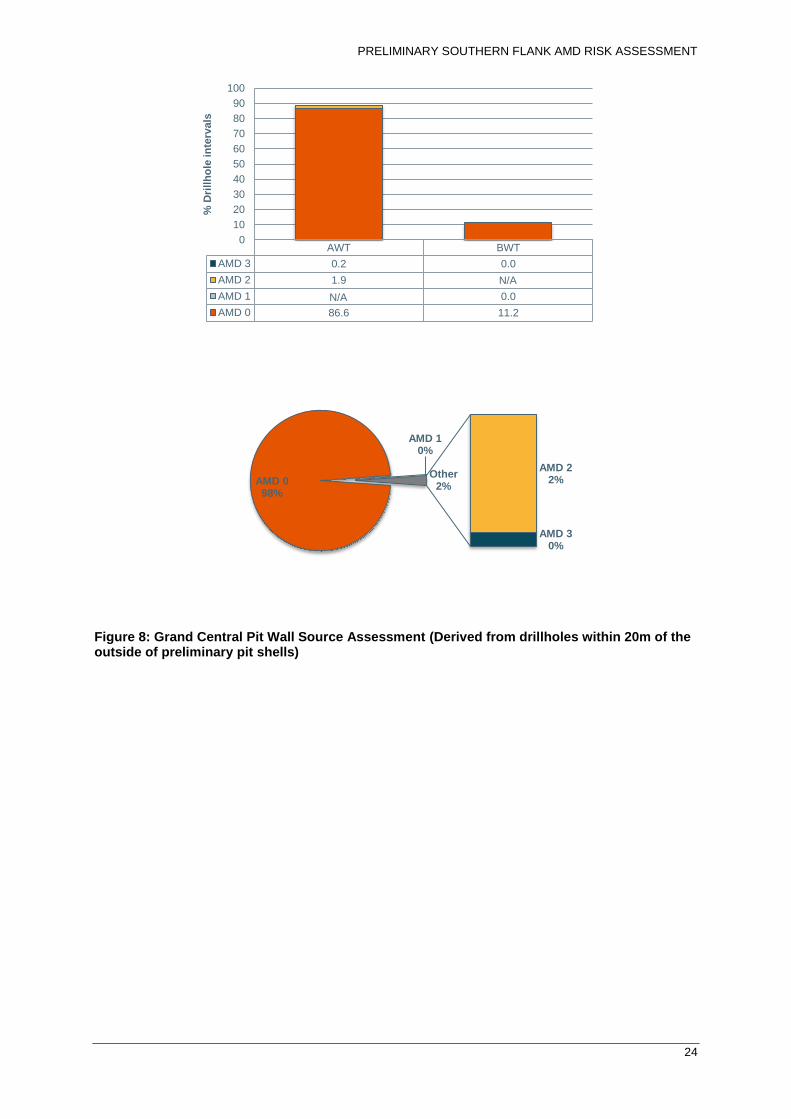
Figure 8: Grand Central Pit Wall Source Assessment (Derived from drillholes within 20m of the outside of preliminary pit shells) .......................................................................................................................................... 24
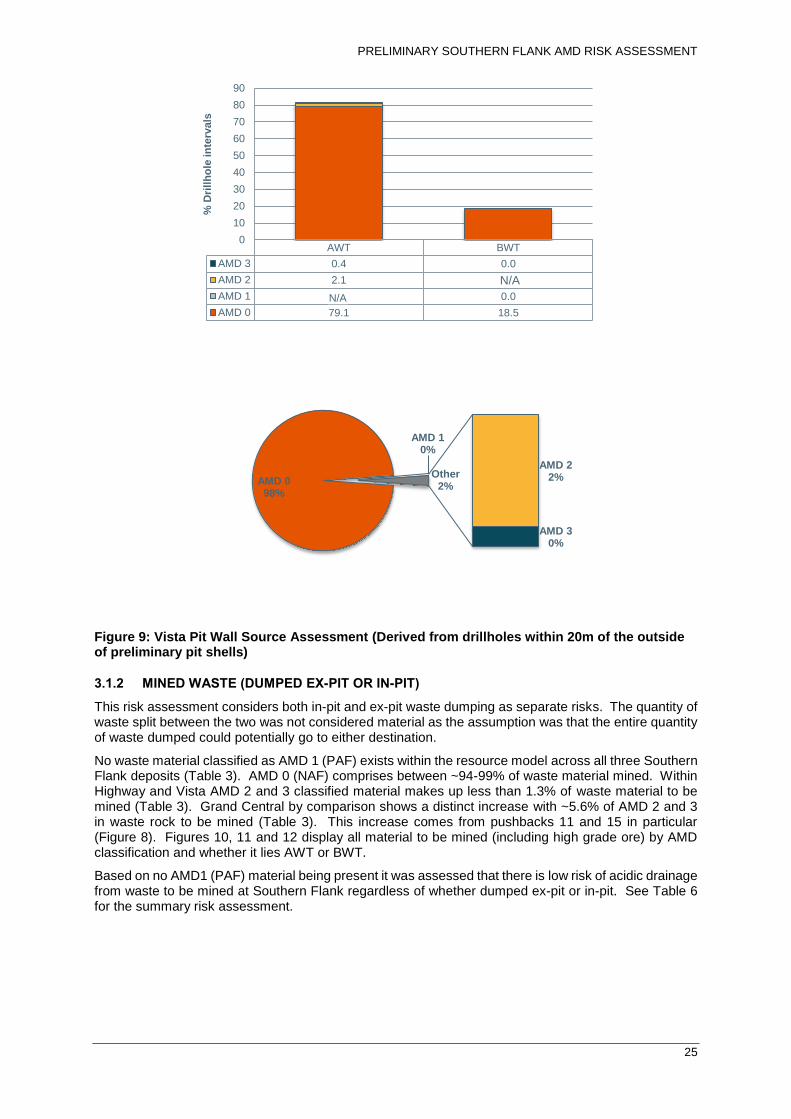
Figure 9: Vista Pit Wall Source Assessment (Derived from drillholes within 20m of the outside of preliminary pit shells) ............................................................................................................................................... 25
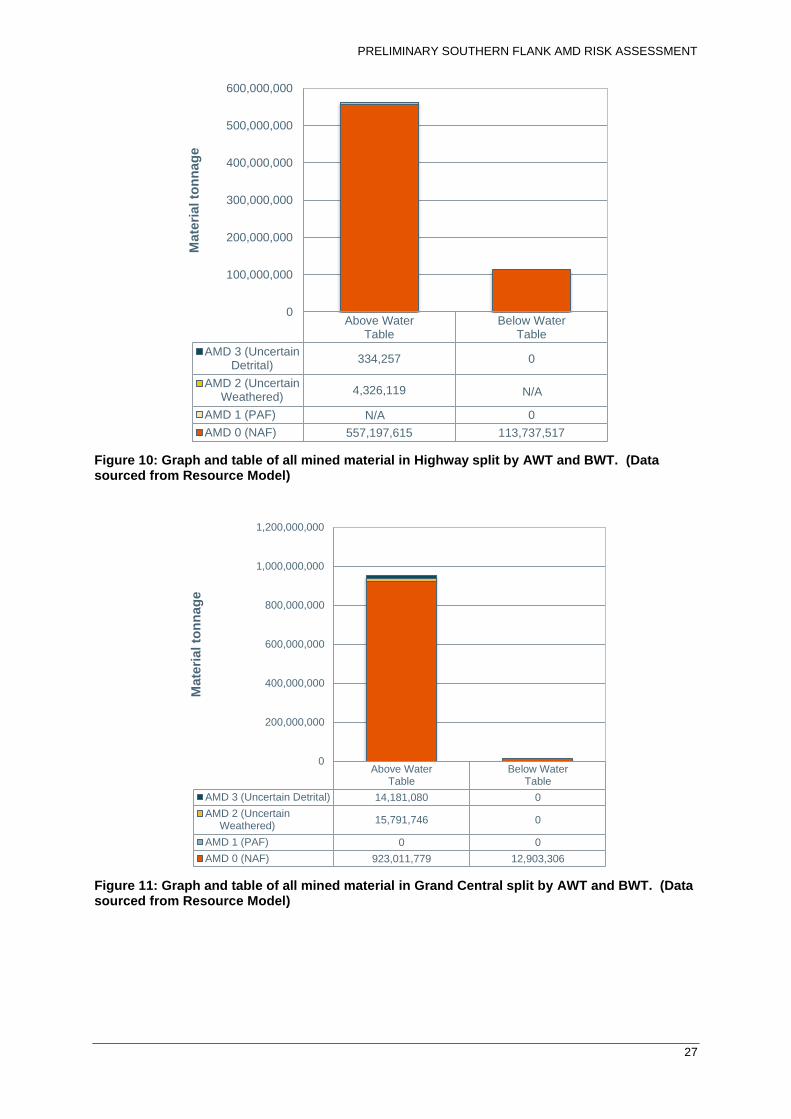
Figure 10: Graph and table of all mined material in Highway split by AWT and BWT. (Data sourced from Resource Model) .............................................................................................................................................. 27
Figure 11: Graph and table of all mined material in Grand Central split by AWT and BWT. (Data sourced from Resource Model) .............................................................................................................................. 27
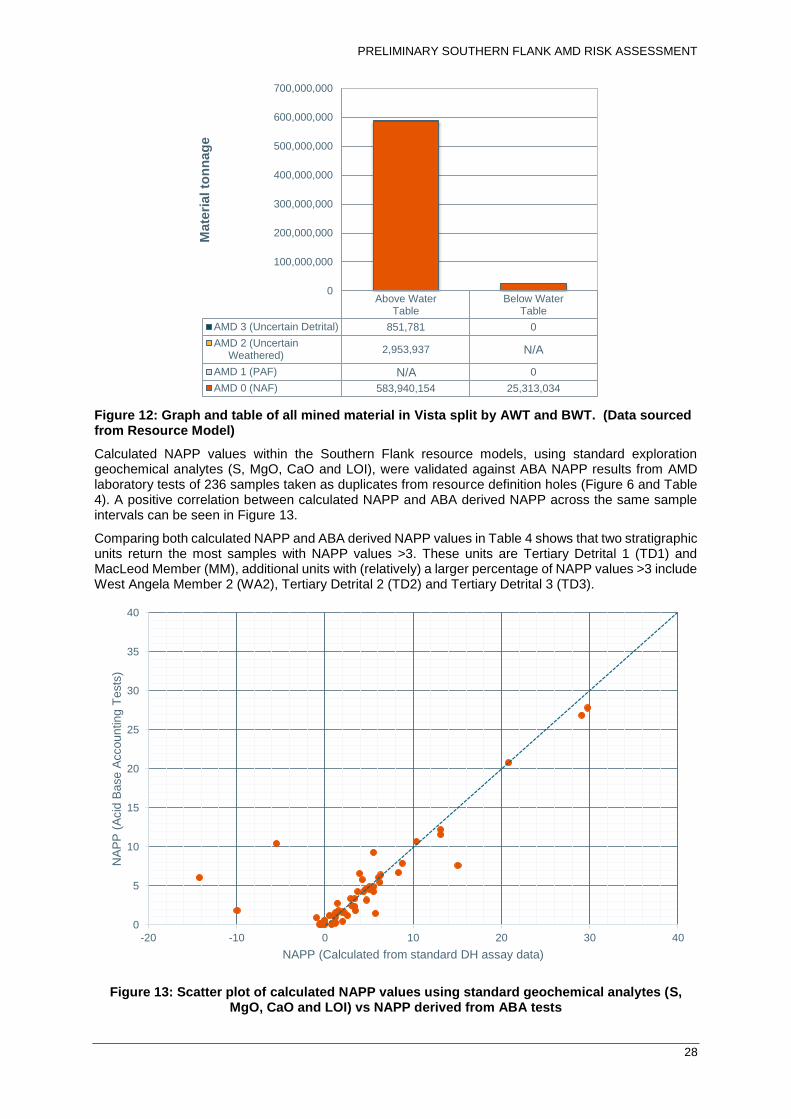
Figure 12: Graph and table of all mined material in Vista split by AWT and BWT. (Data sourced from Resource Model) .............................................................................................................................................. 28
Figure 13: Scatter plot of calculated NAPP values using standard geochemical analytes (S, MgO, CaO and LOI) vs NAPP derived from ABA tests .......................................................................................................... 28
Appendices
APPENDIX A – STRATIGRAPHIC UNIT CODES
AUGUST 2016
4
Abbreviations, acronyms and definitions
Abbreviation/Acronym Full Title
ABA Acid Base Accounting
AMD Acid and Metalliferous Drainage
ANC Acid Neutralising Capacity
AWT Above Water Table
BHPBIO BHP Billiton Iron Ore
BIF Banded Iron Formation
BWT Below water table
GBIS Geological Database
LOI Loss on Ignition
mbgl metres below ground level
mg/L milligrams per Litre
MPA Maximum Potential Acidity
Mt Million tonnes
NAF Non-acid forming
NAPP Net Acid Producing Potential
OSA Overburden Storage Area
PAF Potentially acid forming
PEC Priority Ecological Community
TDS Total Dissolved Solids
TEC Threatened Ecological Community
PRELIMINARY SOUTHERN FLANK AMD RISK ASSESSMENT
5
EXECUTIVE SUMMARY
BHP Billiton Iron Ore (BHPBIO) operates mines in the Pilbara of Western Australia that generate mine waste and expose geological surfaces that could result in acid and metalliferous drainage (AMD) if the operations and materials are not properly managed.
Southern Flank a new mine proposed to commence operation early during the 2020s is located approximately 100 kilometres north-west of Newman, Western Australia and comprises three deposits, Highway, Grand Central and Vista Oriental. This operation will mine rock from the Marra Mamba Iron Formation using conventional open cut techniques. Mined overburden (waste) will be dumped in ex-pit waste dumps or backfilled in-pit, rock will also be exposed in the pit walls. The mined waste and wall rock exposed during this style of operation has the potential to result in AMD.
BHPBIO completed an AMD risk assessment for Southern Flank in August 2016 using a source pathway and receptor based approach to understand the AMD risk. The scope of this assessment included both the operational and post mining phase and examined mined waste and rock exposed in pit walls. To ensure a valid assessment key technical specialist participated in a risk assessment workshop as part of the process. The technical disciplines engaged in the assessment included hydrologists (both groundwater and surface water), environmental advisors, an environmental geochemist, a geologist, mine planner and a closure planning specialist
To understand AMD source potential all material within the resource model was assigned an AMD code based on net acid producing potential (NAPP) values derived from standard geochemical assays (S, MgO, CaO and LOI) from over 86,000 drillhole samples. Those NAPP results and hence AMD coding in the resource model are validated through specific acid base accounting (ABA) and other geochemical tests of representative drillhole samples.
Surface water and to some extent groundwater were considered the primary pathways to local and regional environmental receptors at Southern Flank. Key receptors in the area included Weeli Wolli Springs, Coondewanna Flats, local groundwater (quality) and local flora as foliage for some key fauna species.
A key outcome from the Southern Flank AMD risk assessment was that uncontrolled AMD potential has been ranked as a low risk. This risk rating was based on no potential acid forming (PAF) material being coded as such within the resource model. Over 94% of the material to be mined has been coded as being non-acid forming (NAF). Minor to trace amounts of detrital and weathered rock material are classified as having uncertain acid generation potential, and these materials are not expected to be acid forming as they sit within oxidised areas. In oxidised zones any sulphur in the material is likely present as a non-acid forming sulphate. Some potential exists for this material to contribute to saline drainage but this will be controlled through measures and processes contained in BHPBIO procedures dealing with AMD management.
A subset of drillhole samples are also analysed for total elemental composition as well as for water leachable component. The results demonstrate that there is a low to negligible risk of metals and metalloids in waste rock and pit wall rock adversely impacting groundwater and surface water.
PRELIMINARY SOUTHERN FLANK AMD RISK ASSESSMENT
6
1 INTRODUCTION
BHP Billiton Iron Ore (BHPBIO) operates mines in the Pilbara of Western Australia that generate mine waste and expose geological surfaces that could result in Acid and Metalliferous Drainage (AMD) if the operations and materials are not properly managed.
AMD includes the release of low pH drainage waters otherwise described as Acid Rock Drainage (ARD) from potentially acid forming (PAF) mine waste or exposed surfaces. It can also include metals release or saline drainage in acidic or non-acidic waters. Potential sources of AMD include sulphide mineral bearing overburden and sulphide bearing unsaturated pit wall rock. The source of AMD could potentially be either sulphidic minerals within fresh rock (e.g. pyrite FeS2) or sparingly soluble secondary acid storing minerals within the weathered rock (e.g. alunite and jarosite). If improperly managed, AMD can cause environmental impact by altering the quality of surface and groundwater resources which support important environmental receptors.
This Southern Flank AMD risk assessment is based on the Southern Flank mine AMD source terms coupled with local/ regional hydrology and environmental receptors to derive a source-transport-receptor risk profile. The scope of this assessment includes both the operational and post mining phase.
1.1 AMD MANAGEMENT
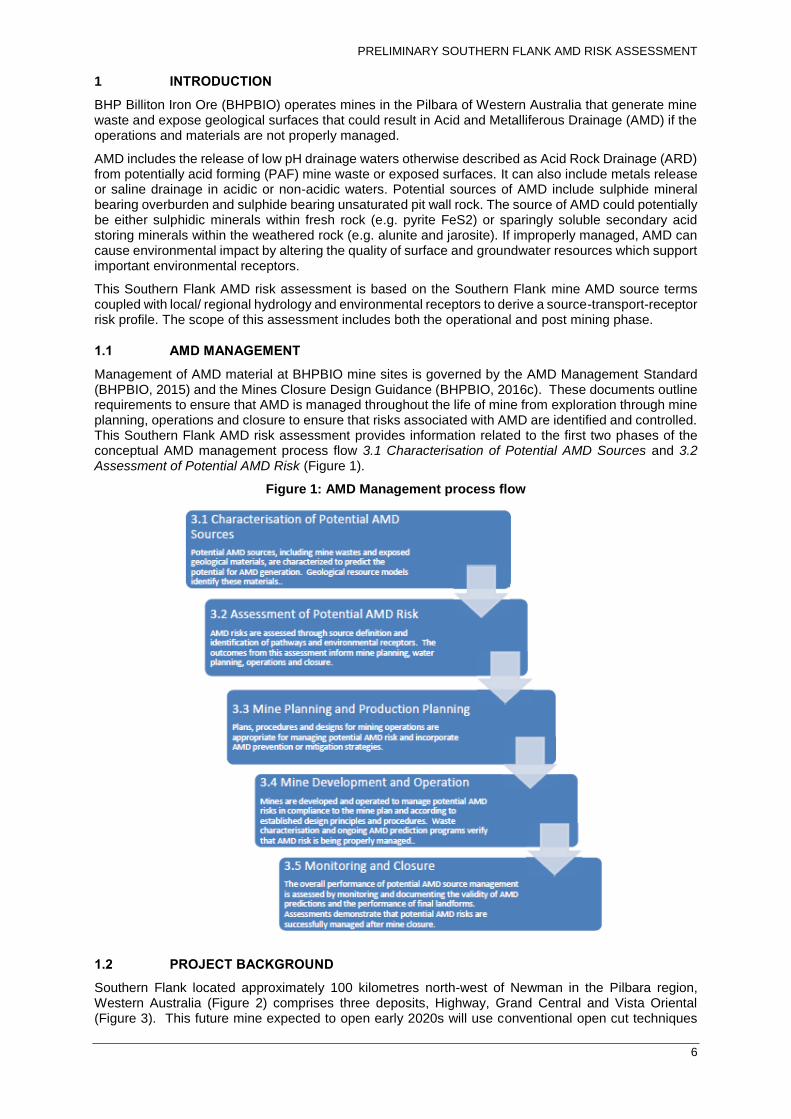
Management of AMD material at BHPBIO mine sites is governed by the AMD Management Standard (BHPBIO, 2015) and the Mines Closure Design Guidance (BHPBIO, 2016c). These documents outline requirements to ensure that AMD is managed throughout the life of mine from exploration through mine planning, operations and closure to ensure that risks associated with AMD are identified and controlled. This Southern Flank AMD risk assessment provides information related to the first two phases of the conceptual AMD management process flow 3.1 Characterisation of Potential AMD Sources and 3.2 Assessment of Potential AMD Risk (Figure 1).
Figure 1: AMD Management process flow
1.2 PROJECT BACKGROUND
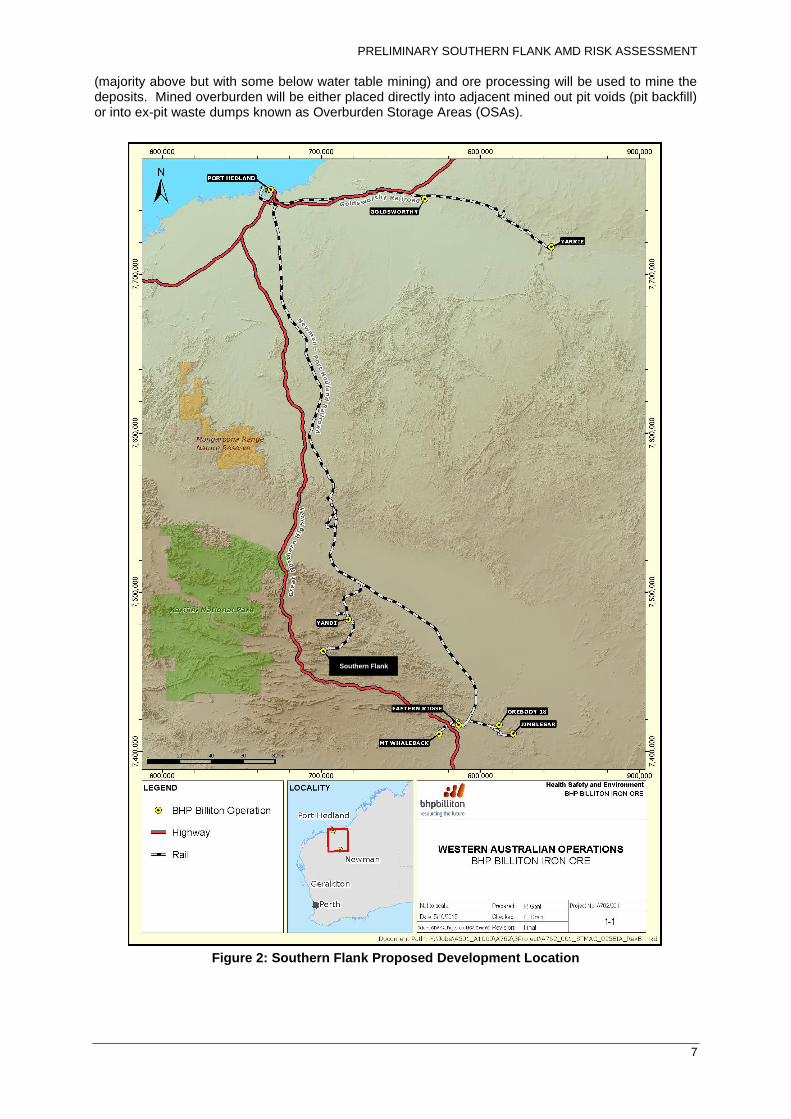
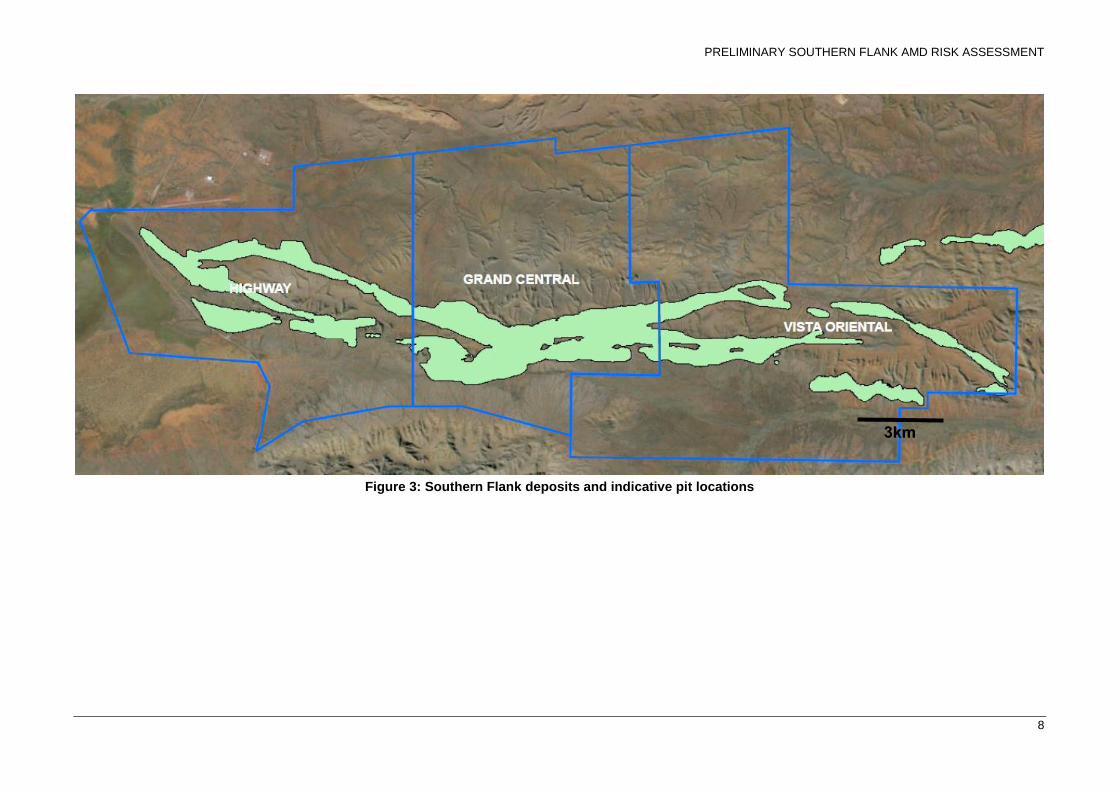
Southern Flank located approximately 100 kilometres north-west of Newman in the Pilbara region, Western Australia (Figure 2) comprises three deposits, Highway, Grand Central and Vista Oriental (Figure 3). This future mine expected to open early 2020s will use conventional open cut techniques
PRELIMINARY SOUTHERN FLANK AMD RISK ASSESSMENT
7
(majority above but with some below water table mining) and ore processing will be used to mine the deposits. Mined overburden will be either placed directly into adjacent mined out pit voids (pit backfill) or into ex-pit waste dumps known as Overburden Storage Areas (OSAs).
Figure 2: Southern Flank Proposed Development Location
Southern Flank
PRELIMINARY SOUTHERN FLANK AMD RISK ASSESSMENT
8
Figure 3: Southern Flank deposits and indicative pit locations
3km
PRELIMINARY SOUTHERN FLANK AMD RISK ASSESSMENT
9
1.2.1 CLIMATE
A semi-arid to arid climate characterises the Pilbara region, Western Australia, typified by irregular rainfall and hot summers. Tropical lows and cyclones dominate the Pilbara’s climate in the summer wet season. Cyclonic systems deliver widespread rain across the region, with rainfall occurring mostly between December and March. During the spring to autumn months, however, a semi-permanent low pressure system influences the formation of convective thunderstorms of varying size and intensity, producing heavy localised rainfall over short periods (Charles et al., 2013).
The mean annual distribution of rainfall across the Pilbara (during the period 1911 to 2011) shows a gradual reduction from north to south, typically 300 to 350 mm in the north, decreasing to less than 250 mm in the south. Southern Flank is located approximately 90km southwest of the nearest weather station Marillana (BOM ID 5009), that has a long-term average annual rainfall recorded of 327 mm. Mean maximum temperatures during the warmest months of the year (November to February) are often above 40°C, while the mean maximum temperature during the winter months (June to August) is approximately 25°C.
1.2.2 GEOLOGY
The main geological units in the Project area include:
Tertiary Sediments
Wittenoom Formation
Marra Mamba Iron Formation
1.2.2.1 TERTIARY SEDIMENTS
Tertiary alluvial sediments have been deposited immediately south of Southern Flank and in valleys within the area, where they mostly overlie the eroded bedrock of the Wittenoom Formation. The sediments are composed of semi-consolidated and cemented alluvium, colluvium/detritals comprising sands, silts, clays, lignite and ligneous clays and calcrete deposits up to tens of meters in thickness. BHPBIO recognised three lithological units within this formation; the lithological code is TDx, with “x” ranging from 1 to 31.
Pyrite can be associated with these sediments, particularly with lignite and ligneous clays located within the fresh zone. This pyrite is formed as a result of bacterially mediated sulphate reduction in the presence of iron and organic carbon. Pyrite from these sediments is ultra-fine grained, framboidal, and is expected to be far more reactive (i.e. more rapid oxidation rate) than pyrite within the Proterozoic formations. In addition, acidity storing secondary minerals (e.g. alunite and jarosite) within the oxidised portion of the sediments may be present. As a result, these materials have the potential to generate AMD.
1.2.2.2 PROTEROZOIC FORMATIONS
Wittenoom Formation
The Wittenoom formation is located throughout Southern Flank, mostly below the Tertiary sediments. The following members comprise the Wittenoom Formation:
Bee Gorge Member, the uppermost member of the Wittenoom Formation consists of alternating beds of shale and dolomite with minor cherts, volcaniclastics and BIF.
Paraburdoo Member, the middle unit of the Wittenoom Formation, consists of thin to thick-bedded dolomite with minor amounts of chert and argillite partings.
West Angela Member, a shale unit in the base of the Wittenoom Formation contains dolomite, dolomitic argillite, chert and minor BIF.
Marra Mamba Iron Formation
PRELIMINARY SOUTHERN FLANK AMD RISK ASSESSMENT
10
At South Flank most ore lies within the upper Marra Mamba Iron Formation, the following members comprise this formation:
Mt Newman Member, the uppermost unit of the Marra Mamba Iron Formation; is a sequence of BIF, shales siltstones and minor cherts and significant goethite/haematite mineralisation with a maximum thickness of 60m. This member contains most ore that will be mined at South Flank.
Macleod Member the middle unit of the Marra Mamba Iron Formation, consists of shale with thin BIF interbeds and chert to a maximum thickness of 45m.
Nammuldi Member is the base unit of the Marra Mamba Iron Formation, comprising yellow weathering chert, cherty BIF and some shale bands. It has a maximum thickness of 100m.
1.2.3 HYDROLOGY SURFACE WATER
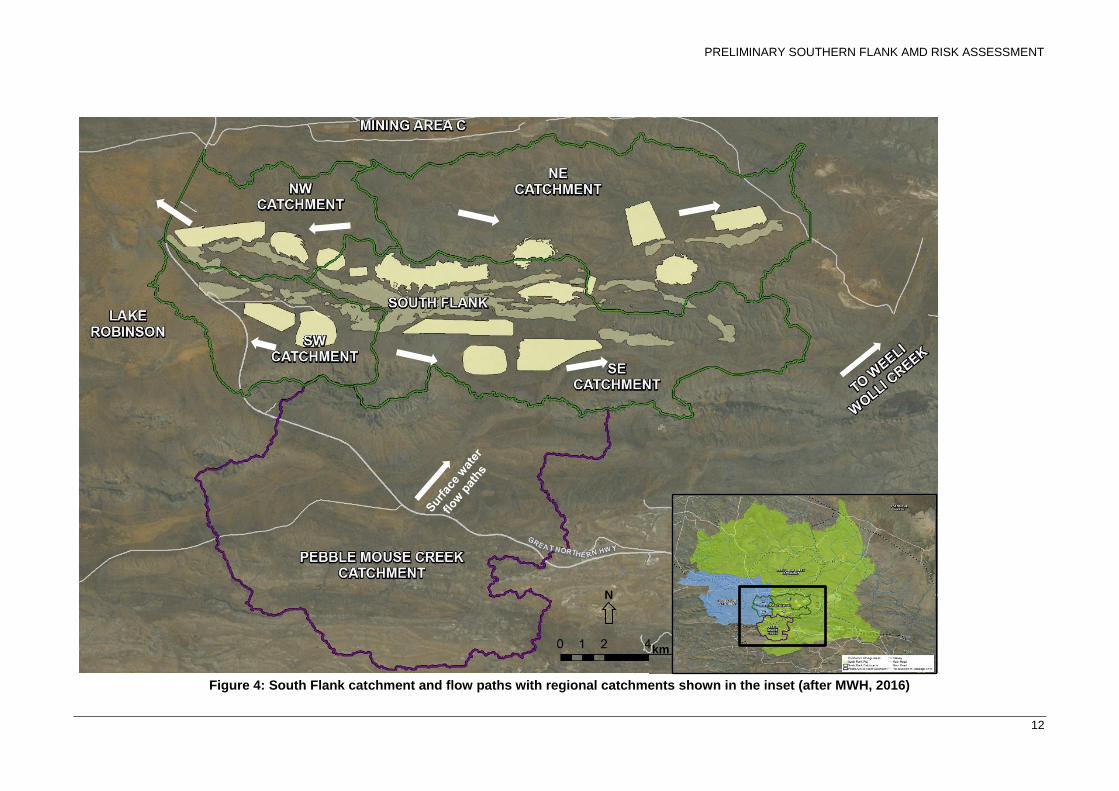
Southern Flank lies within two main catchments, the Weeli Wolli Creek Catchment (upstream from Weeli Wolli Spring) and Coondewanna Catchment (Figure 4). A recent assessment of the surface water regime at Southern Flank (MWH, 2016) informally subdivided the local area into 4 catchments: NW catchment, SW catchment, NE catchment and SE catchment (Figure 4). Of these subdivisions the NW and SW catchment fall within the Coondewanna Catchment with surface water flows directed to the west. The other two subdivisions, NE and SE catchment, fall with the Weeli Wolli Creek Catchment with surface water flow directed to the east. This divide was an important feature during the AMD risk assessment to understand the influence of any potential AMD impacts to receptors.
As an ephemeral drainage feature Weeli Wolli Creek flows in direct response to rainfall, flowing toward Weeli Wolli Spring as a natural surface expression of groundwater flow resulting from hydrogeological features in the Weeli Wolli Creek bed. The surface water catchment upstream from Weeli Wolli Spring has an approximate area of 1,450 km2.
Weeli Wolli Creek is one of several large watercourses discharging into the Fortescue Marsh, and Weeli Wolli Spring is located around 60km upstream from the marsh. Several tributary creeks enter into Weeli Wolli Creek upstream from the spring, including Pebble Mouse Creek, the main creek crossing the South Flank development area.
Creeks in the area typically have 0 to 2 flow events a year. These events are generally short duration, with little post rainfall flow persistence, although peak discharges are typically generated by longer duration storms which saturate the catchment and streambed, resulting in streamflow.
Coondewanna Catchment (Figure 4) drains internally with a catchment of about 860 km2, runoff discharges into an internal depression known as Lake Robinson where water dissipates by seepage and evapotranspiration.
Local hydrology – operational phase
Changes in natural surface water flow patterns resulting from development of pits, OSAs and other infrastructure were identified in the South Flank Surface Water Environmental Impact Assessment (MWH, 2016). Impacts to the surface water flow volume and quality is not expected to be significant due to the minimal area disturbed compared to the overall catchment size.
1.2.4 HYDROLOGY GROUNDWATER
The conceptual understanding of Mining Area C groundwater was undertaken by RPS (2014) and summarised below.
The Southern Flank deposits are situated in a groundwater catchment that is coincident with the surface water catchments of Weeli Wolli Spring and Coondewanna.
The regional groundwater flow system is hosted in valley aquifers (detritals) and underlying dolomite (where karstic). This system is surrounded by low permeability (aquitard) geology. Within the low permeability units however there are pods of high-permeability material associated with orebodies. The extent to which the orebodies are in hydraulic connection with the broader regional groundwater system varies. The hydrogeology can be influenced by structural features with an enhancement of permeability associated with faults and folds, and dykes potentially acting as flow barriers.
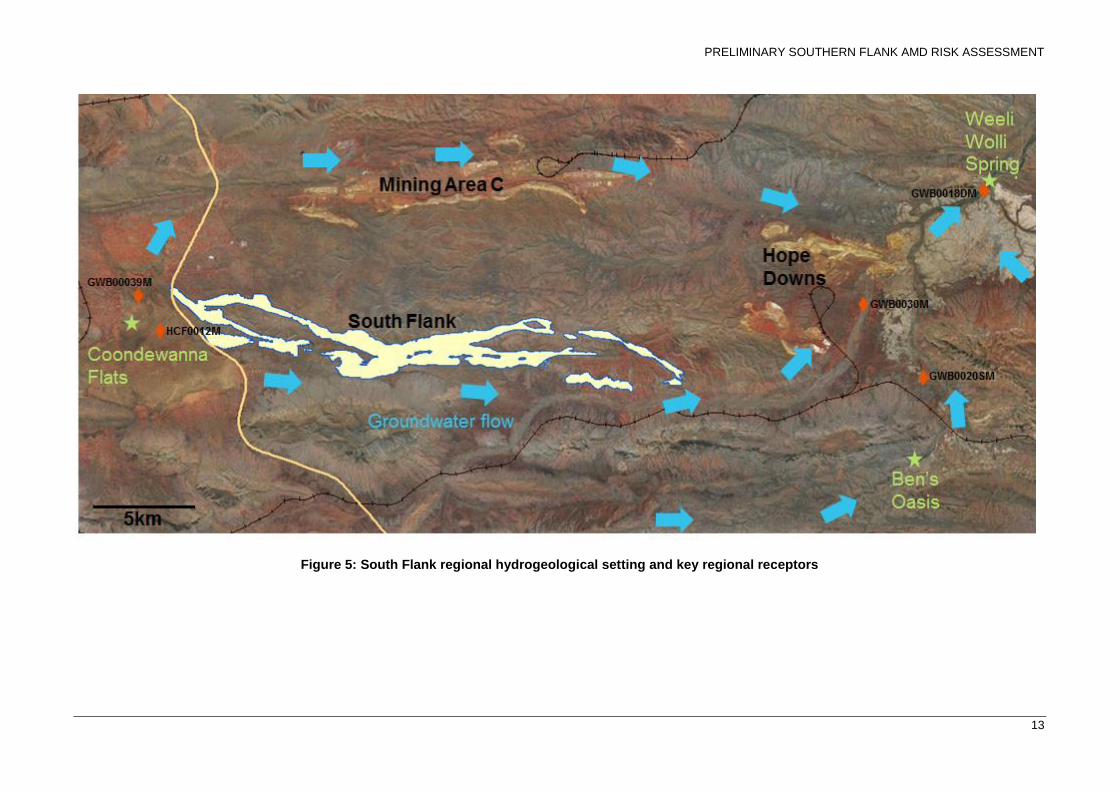
Groundwater generally flows across the catchment from west to east; from Coondewanna Flats and along the North and South Flank Valleys (Figure 5). Groundwater then flows to Weeli Wolli Spring that marks the surface and groundwater outflow from the groundwater catchment.
PRELIMINARY SOUTHERN FLANK AMD RISK ASSESSMENT
11
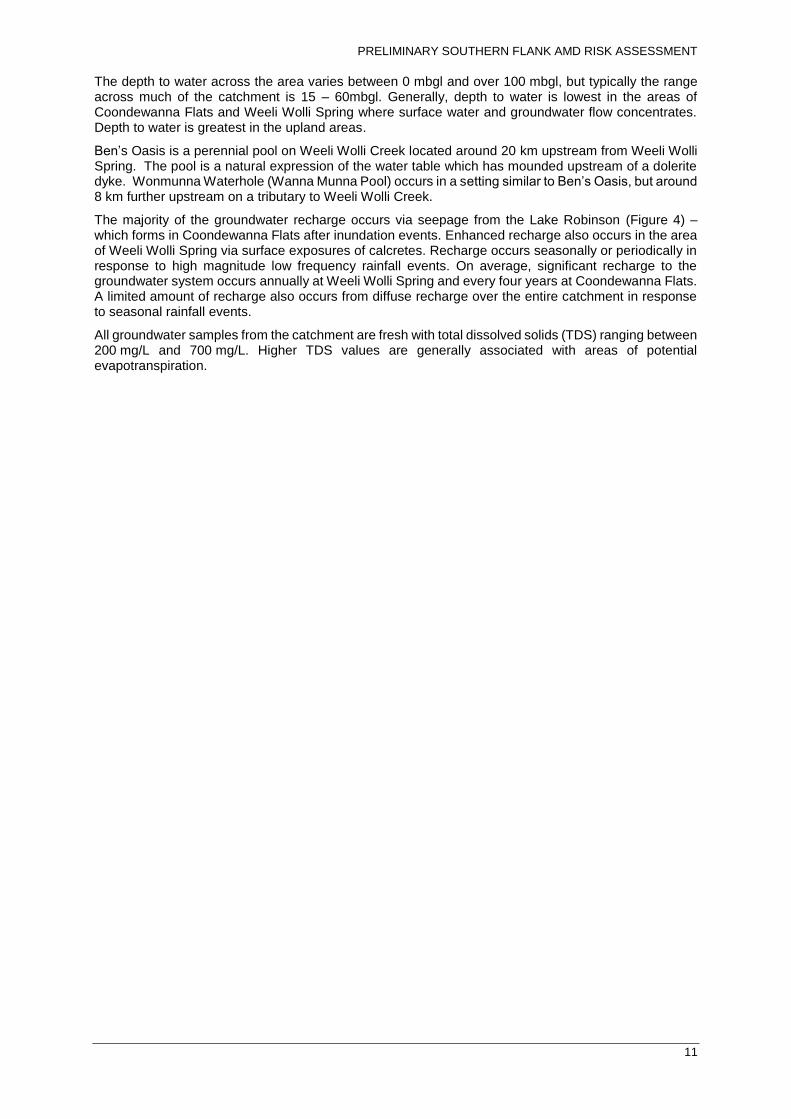
The depth to water across the area varies between 0 mbgl and over 100 mbgl, but typically the range across much of the catchment is 15 – 60mbgl. Generally, depth to water is lowest in the areas of Coondewanna Flats and Weeli Wolli Spring where surface water and groundwater flow concentrates. Depth to water is greatest in the upland areas.
Ben’s Oasis is a perennial pool on Weeli Wolli Creek located around 20 km upstream from Weeli Wolli Spring. The pool is a natural expression of the water table which has mounded upstream of a dolerite dyke. Wonmunna Waterhole (Wanna Munna Pool) occurs in a setting similar to Ben’s Oasis, but around 8 km further upstream on a tributary to Weeli Wolli Creek.
The majority of the groundwater recharge occurs via seepage from the Lake Robinson (Figure 4) – which forms in Coondewanna Flats after inundation events. Enhanced recharge also occurs in the area of Weeli Wolli Spring via surface exposures of calcretes. Recharge occurs seasonally or periodically in response to high magnitude low frequency rainfall events. On average, significant recharge to the groundwater system occurs annually at Weeli Wolli Spring and every four years at Coondewanna Flats. A limited amount of recharge also occurs from diffuse recharge over the entire catchment in response to seasonal rainfall events.
All groundwater samples from the catchment are fresh with total dissolved solids (TDS) ranging between 200 mg/L and 700 mg/L. Higher TDS values are generally associated with areas of potential evapotranspiration.
PRELIMINARY SOUTHERN FLANK AMD RISK ASSESSMENT
12
Figure 4: South Flank catchment and flow paths with regional catchments shown in the inset (after MWH, 2016)
N
km
PRELIMINARY SOUTHERN FLANK AMD RISK ASSESSMENT
13
Figure 5: South Flank regional hydrogeological setting and key regional receptors
PRELIMINARY SOUTHERN FLANK AMD RISK ASSESSMENT
14
1.2.5 KEY RECEPTORS
The Southern Flank mining area has no ecohydrological assets that are directly protected under legislation (Tier 1), however, regionally both Weeli Wolli Spring and Coondewanna Flats are considered with BHPBIO to be Tier 2 assets (BHPBIO, 2016a) (Figure 5).
Weeli Wolli Springs
Weeli Wolli Spring occurs in a zone of confluence of surface water and groundwater flows from the headwaters of the Upper Weeli Wolli Creek catchment. Groundwater is shallow (less than 10 m bgl) and becomes shallower towards the spring. As the aquifer thins and narrows towards Weeli Wolli Spring, groundwater flow is concentrated and discharged over near-surface basement as baseflow. The Weeli Wolli Spring Community Priority Ecological Community (PEC) (Priority 1) supports permanent and persistent pools and riparian woodland communities with a groundwater dependency. The groundwater system supports a diverse stygofauna assemblage. The valley of Weeli Wolli Spring also contains a very rich microbat assemblage. Weeli Wolli Spring is affected by the existing Hope Downs mine (third-party operated). The operators of the Hope Downs mine have implemented measures to artificially maintain the water regime in accordance with Ministerial conditions. Elements of the Weeli Wolli Spring Community PEC also occur at Ben’s Oasis, located approximately 20 km upstream and south of Weeli Wolli Spring. At this location, the vegetation is concentrated along a relatively narrow creek channel adjacent to some surface water pools. There is limited documented information about the geology, hydrology, or ecology of this area.
Coondewanna Flats
Coondewanna Flats is a receiving area for surface water runoff from surrounding catchments. Floodwaters accumulate on the flats, replenishing soil moisture in the deep unsaturated profile and contributing to groundwater recharge. Lake Robinson is the principal drainage terminus within the flats and contributes to groundwater recharge when inundated.
The water table lies at 20 to 30 m bgl within an unconfined calcrete aquifer that is overlain by unsaturated Tertiary detritals.
Coondewanna Flats supports regionally unusual Eucalyptus victrix woodland communities, with two being classified as PECs (Priority 1 and Priority 3). The ecological water requirements of these woodlands are considered to be met by surface water; however, a precautionary approach has been adopted as further studies are required to fully demonstrate and validate any groundwater dependency.
Local area foliage for fauna
No Threatened Ecological Communities (TECs) or PECs occur within the Southern Flank area. It has assessed that some local areas, particularly river gorges and major gorge/gully systems, have ecological value to local terrestrial fauna including Ghost Bats and the Pilbara Barking Gecko (BHPBIO, 2016b).
Groundwater System
The local groundwater system was assessed during the Southern Flank AMD risk assessment to be an important receptor in regards to the water quality with all groundwater samples from the catchment being fresh. The main recharge zone for the groundwater system is Lake Robinson (BHPBIO, 2016b) which comes under the influence of surface water flows from western Southern Flank.
1.2.6 PATHWAY AND RECEPTORS
At Southern Flank surface water flows were consider to be the most important pathway from source to key regional receptors as well as local receptors. Drainage in the western-most parts of Southern Flank flow towards the west with surface water in central and eastern-Southern Flank flowing east into Weeli Wooli Creek via Pebble Mouse Creek (Figure 4).
Groundwater flow in the Southern Flank area flows west to east with the valley to the south of Southern Flank deposits likely to be a conduit to the Weeli Wolli Springs area. Local groundwater recharge is dominantly through surface waters at Lake Robinson and around the Weeli Wolli Springs area via surface calcrete exposures. Limited amounts of diffuse recharge occurs over the entire catchment in response to seasonal rainfall events (BHPBIO, 2016b). .This suggests that there may be limited connectivity from future open pits to groundwater systems particularly in the northern pits of Southern Flank. It was determined for the purposes of this risk assessment that southern pits had positive connectivity to the groundwater system and groundwater was a pathway to Weeli Wooli Springs.
PRELIMINARY SOUTHERN FLANK AMD RISK ASSESSMENT
15
2 ASSESSMENT METHODS
2.1 AMD SOURCE ASSESSMENT
2.1.1 AMD CLASSIFICATION
PAF material was historically identified in geological and mine planning block models based on total sulfur content, degree of weathering and lithology, and the focus was on material known to have a high acid generating potential (i.e., unweathered black shales). Improvements have been made to procedures for identifying and coding PAF and other material that may contribute to AMD in geological and mine planning block models. These improvements are possible based on the collection of extensive geochemical characterisation data and learnings from preliminary AMD risk assessments and research studies. This is resulting in the more accurate documentation of AMD risk and facilitating improvements in tracking and managing mined waste material as well as residual risks from material exposed in pit voids.
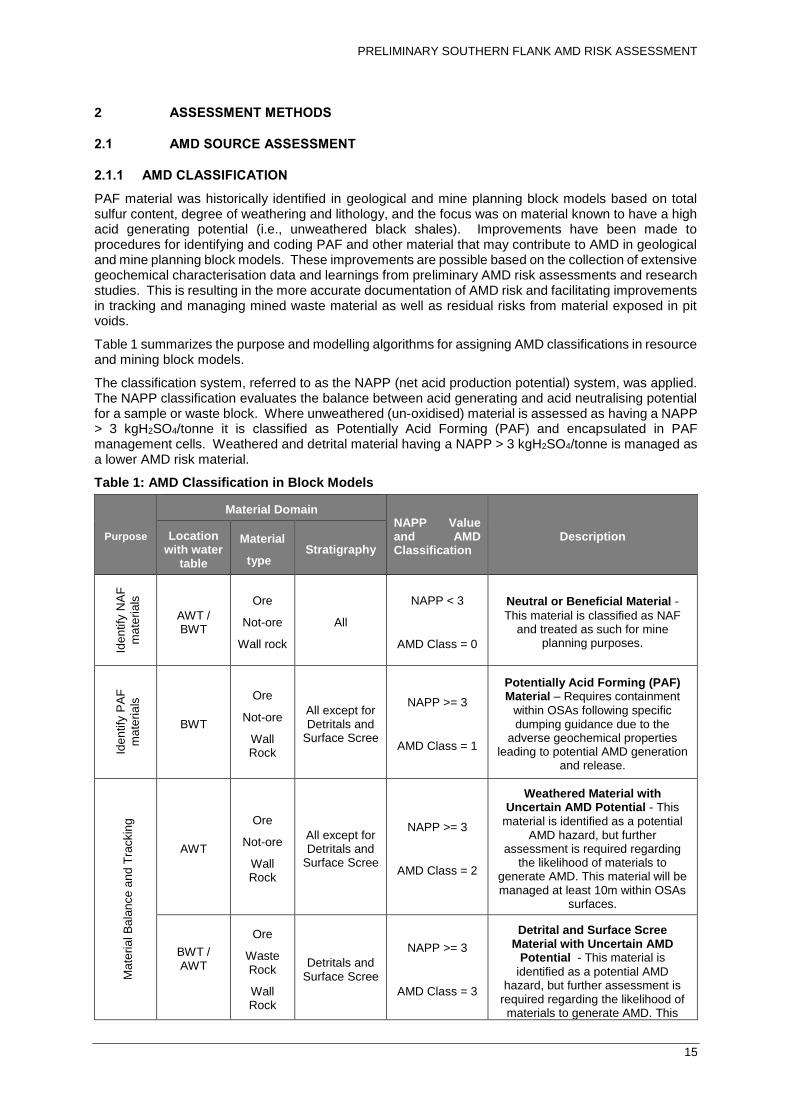
Table 1 summarizes the purpose and modelling algorithms for assigning AMD classifications in resource and mining block models.
The classification system, referred to as the NAPP (net acid production potential) system, was applied. The NAPP classification evaluates the balance between acid generating and acid neutralising potential for a sample or waste block. Where unweathered (un-oxidised) material is assessed as having a NAPP > 3 kgH2SO4/tonne it is classified as Potentially Acid Forming (PAF) and encapsulated in PAF management cells. Weathered and detrital material having a NAPP > 3 kgH2SO4/tonne is managed as a lower AMD risk material.
Table 1: AMD Classification in Block Models
Purpose
Material Domain NAPP Value and AMD Classification
Description Location with water
table
Material
type Stratigraphy
Ide
ntify
NA
F
ma
teria
ls
AWT / BWT
Ore
Not-ore
Wall rock
All
NAPP < 3
AMD Class = 0
Neutral or Beneficial Material -
This material is classified as NAF and treated as such for mine
planning purposes.
Ide
ntify
PA
F
ma
teria
ls
BWT
Ore
Not-ore
Wall Rock
All except for Detritals and
Surface Scree
NAPP >= 3
AMD Class = 1
Potentially Acid Forming (PAF) Material – Requires containment
within OSAs following specific dumping guidance due to the
adverse geochemical properties leading to potential AMD generation
and release.
Ma
teria
l B
ala
nce
an
d T
rackin
g
AWT
Ore
Not-ore
Wall Rock
All except for Detritals and
Surface Scree
NAPP >= 3
AMD Class = 2
Weathered Material with Uncertain AMD Potential - This
material is identified as a potential AMD hazard, but further
assessment is required regarding the likelihood of materials to
generate AMD. This material will be managed at least 10m within OSAs
surfaces.
BWT / AWT
Ore
Waste Rock
Wall Rock
Detritals and Surface Scree
NAPP >= 3
AMD Class = 3
Detrital and Surface Scree Material with Uncertain AMD
Potential - This material is
identified as a potential AMD hazard, but further assessment is
required regarding the likelihood of materials to generate AMD. This
PRELIMINARY SOUTHERN FLANK AMD RISK ASSESSMENT
16
Purpose
Material Domain NAPP Value and AMD Classification
Description Location with water
table
Material
type Stratigraphy
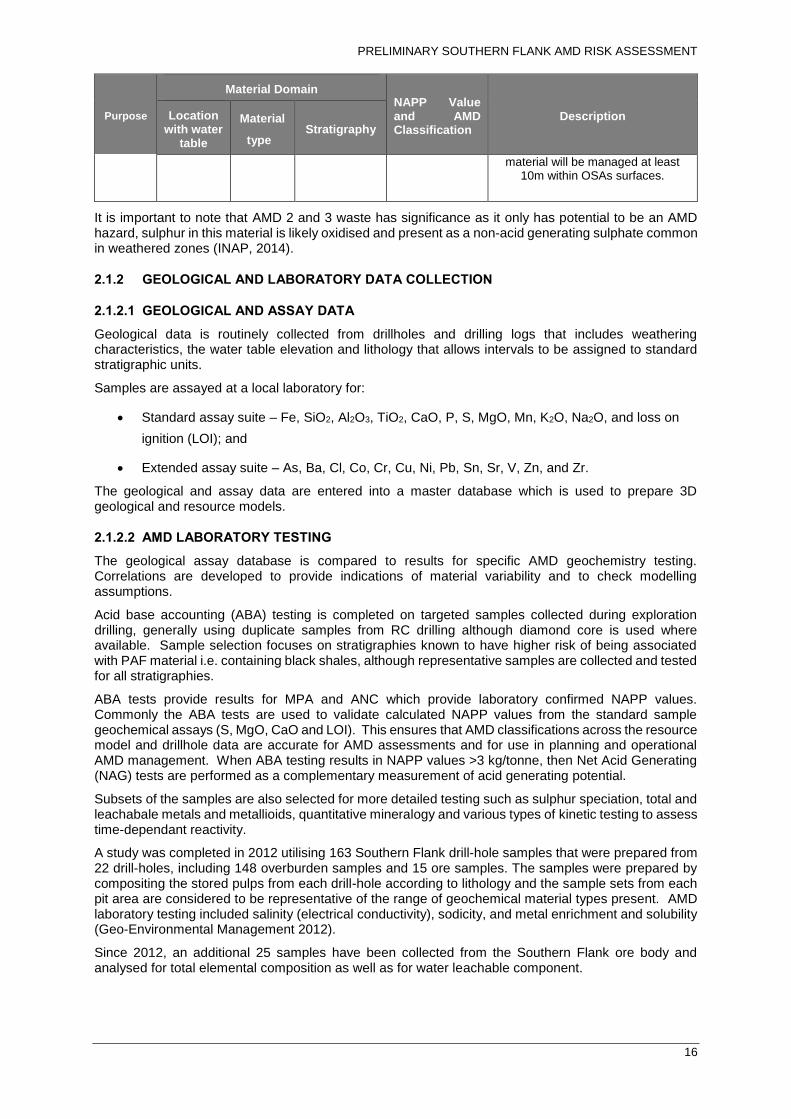
material will be managed at least 10m within OSAs surfaces.
It is important to note that AMD 2 and 3 waste has significance as it only has potential to be an AMD hazard, sulphur in this material is likely oxidised and present as a non-acid generating sulphate common in weathered zones (INAP, 2014).
2.1.2 GEOLOGICAL AND LABORATORY DATA COLLECTION
2.1.2.1 GEOLOGICAL AND ASSAY DATA
Geological data is routinely collected from drillholes and drilling logs that includes weathering characteristics, the water table elevation and lithology that allows intervals to be assigned to standard stratigraphic units.
Samples are assayed at a local laboratory for:
Standard assay suite – Fe, SiO2, Al2O3, TiO2, CaO, P, S, MgO, Mn, K2O, Na2O, and loss on
ignition (LOI); and
Extended assay suite – As, Ba, Cl, Co, Cr, Cu, Ni, Pb, Sn, Sr, V, Zn, and Zr.
The geological and assay data are entered into a master database which is used to prepare 3D geological and resource models.
2.1.2.2 AMD LABORATORY TESTING
The geological assay database is compared to results for specific AMD geochemistry testing. Correlations are developed to provide indications of material variability and to check modelling assumptions.
Acid base accounting (ABA) testing is completed on targeted samples collected during exploration drilling, generally using duplicate samples from RC drilling although diamond core is used where available. Sample selection focuses on stratigraphies known to have higher risk of being associated with PAF material i.e. containing black shales, although representative samples are collected and tested for all stratigraphies.
ABA tests provide results for MPA and ANC which provide laboratory confirmed NAPP values. Commonly the ABA tests are used to validate calculated NAPP values from the standard sample geochemical assays (S, MgO, CaO and LOI). This ensures that AMD classifications across the resource model and drillhole data are accurate for AMD assessments and for use in planning and operational AMD management. When ABA testing results in NAPP values >3 kg/tonne, then Net Acid Generating (NAG) tests are performed as a complementary measurement of acid generating potential.
Subsets of the samples are also selected for more detailed testing such as sulphur speciation, total and leachabale metals and metallioids, quantitative mineralogy and various types of kinetic testing to assess time-dependant reactivity.
A study was completed in 2012 utilising 163 Southern Flank drill-hole samples that were prepared from 22 drill-holes, including 148 overburden samples and 15 ore samples. The samples were prepared by compositing the stored pulps from each drill-hole according to lithology and the sample sets from each pit area are considered to be representative of the range of geochemical material types present. AMD laboratory testing included salinity (electrical conductivity), sodicity, and metal enrichment and solubility (Geo-Environmental Management 2012).
Since 2012, an additional 25 samples have been collected from the Southern Flank ore body and analysed for total elemental composition as well as for water leachable component.
PRELIMINARY SOUTHERN FLANK AMD RISK ASSESSMENT
17
2.1.3 ASSESSMENT OF ACID DRAINAGE POTENTIAL
Data for conducting the AMD source risk assessment was sourced from the Geological Database (GBIS) and the Resource Models for Southern Flank deposits. Two types of assessments were completed.
Geological data - Scoping level AMD Risk Assessment
This assessment utilised drill core assay, geological data, and the 3D planned pit shell. The assessment was extended to waste and low-grade ore located within the pit shell, and waste, low-grade and high-grade ore located within the wallrock. The wallrock was defined as that volume of rock located outside the pit shell but within ~20 meters from it.
This assessment was qualitative in nature for material quantities. Geochemical properties were assessed based on exploration data and included total sulphur, magnesium, calcium and loss on ignition. Total S was used to estimate MPA, while calcium, magnesium and loss of ignition are used to infer ANC. MPA and ANC combined are used to infer the NAPP value for each interval (AMD model classification). The NAPP value was then used to assign an AMD class to each drillhole interval.
Material domains that were assessed included:
In-pit waste rock
In-pit low-grade ore
Wallrock (includes waste rock, low-grade ore and high-grade ore)
An assessment tool referred to as the DH_Database_Tool was used to estimate the AMD hazard associated with in-pit and wallrock materials. Using the drillhole assay and geochemical database the DH_Database_Tool generated a series of tables and graphs including:
The distribution (number of intervals and percentage) of the drillhole intervals for in-pit and wallrock materials as a function of lithology, location with respect to the water table, weathering, and AMD classification.
Statistical analysis for total S, ANC, and NAPP values for drillhole intervals for in-pit and wallrock materials as a function of lithology, location with respect to the water table, weathering, and AMD classification.
QA/QC analysis for LOI estimated from assay data and LOI measured in the laboratory
Whiskers plots for the distribution of total S, ANC, and NAPP for in-pit and wallrock materials as a function of lithology.
Pie and bar charts summarising the distribution of drillcore intervals as a function of AMD classification and location with respect to the water table for in-pit and wall rock materials.
This assessment identifed specific characteristics associated with key material domains within the proposed development and highlighted those lithologies/domains that may pose the highest risk or offer the most beneficial characteristics.
3D resource models - Preliminary AMD Risk Assessment
This assessment utilised outputs from the Resource Block Models. The assessment provided a quantitative assessment of the AMD risk posed by the deposits by estimating material tonnages as a function of the AMD classification (AMD model) coded in the block model. Geochemical properties were assessed based on block model attributes (i.e. total S, magnesium, calcium and loss on ignition values). AMD classifications within the resource model are based on kriging of the standard geochemical analytes S, MgO, CaO and LOI from drillhole samples within each resource model block.
Material domains that were assessed included:
In-pit waste blocks
In-pit low-grade ore blocks
In-pit ore blocks (high grade)
The assessment of the distribution of material by AMD class based on Geological data indicated a low risk for AMD associated with pit wall rock, so a detailed assessment of the AMD risk for this domain was not conducted.
PRELIMINARY SOUTHERN FLANK AMD RISK ASSESSMENT
18
An assessment tool referred to as the MB_Assessment_Tool was used to manipulate the outputs from the Resource Block Models and assess the AMD risk associated with the deposits. For each material domain material balance outputs included the following parameters: Total S, ANC, NAPP, ANC/MPA ratio, rock type, weathering, location with respect to the water table, ore type, AMD model classification, and tonnage.
Material balances were produced as a function of all the following variables:
AMD classification binned as follows:
AMD 0 (NAF, NAPP <3)
AMD 1 (PAF, NAPP ≥ 3)
AMD 2 (Uncertain, oxidised material with NAPP ≥3)
AMD 3 (Uncertain, detritals with NAPP ≥3)
NAPP binned as follows:
≤-30 kg H2SO4 /t
-30 to ≤-3 kg H2SO4 /t
in 1 kg H2SO4 /t intervals from -3 to 6 kg H2SO4 /t
6 to ≤10 kg H2SO4 /t
>10 to ≤30 kg H2SO4 /t
>30 kg H2SO4 /t
Total S binned as follows:
0.1wt% intervals from 0 to 0.4wt% total sulphur
0.2wt% intervals from 0.4 to 1.0wt% total sulphur
1.0wt% intervals from >1 to ≤7wt% total sulphur
>7 wt%
ANC binned as follows:
from 0 to ≤5 kg H2SO4 /t
from > 5 to ≤20 kg H2SO4 /t
from > 20 to ≤50 kg H2SO4 /t
from > 50 to ≤100 kg H2SO4 /t
from > 100 to ≤400 kg H2SO4 /t
>400 kg H2SO4 /t
ANC/MPA ratio binned as follows:
1 unit intervals from 0 to 3
>3
The outputs from the block model were used to estimate the tonnage of PAF, NAF and Uncertain materials based on the AMD classification scheme. Outputs also included a statistical summary of the following geochemical parameters:
Total S: Average S, Min S, Max S
ANC: Average ANC, Min ANC, Max ANC
NAPP: Average NAPP, Min NAPP, Max NAPP
ANC/MPA: Average NAPP, Min NAPP, Max NAPP
The MB_Assessment_Tool generated a series of tables and graphs to estimate the AMD hazard including:
PRELIMINARY SOUTHERN FLANK AMD RISK ASSESSMENT
19
The tonnage of materials as a function of lithology, location with respect to the water table, weathering, and AMD classification for waste rock, low-grade ore, high-grade ore.
Statistical analysis for total S, ANC, NAPP and ANC/MPA values as a function of lithology, location with respect to the water table, weathering, and AMD classification and associated material balance breakdown.
Material balance breakdown as a function of ANC, NAPP and Total Sulphur cut-off grades.
Bar charts summarising the material balance as a function of AMD classification, location as a function of the water table and weathering for all materials.
Bar charts summarising the tonnage distribution of waste rock, low-grade ore and high-grade ore as a function of ANC, NAPP and S cut-off values.
2.1.4 ASSESSMENT OF METALLIFEROUS AND SALINE DRAINAGE
Results for metals and other potential contaminants within the drill hole assay database are limited to a few analytes (Al2O3, Fe, K2O, Mn, P, SiO2 and TiO2).
A ‘first pass’ assessment of the potential for metalliferous leaching based on assay data and block modelling was completed as follows:
The distribution of S and AMD classes was used to infer the potential for metalliferous drainage. The potential for acid forming materials is considered to be linked to the potential for metalliferous leaching on the basis that many elements are more soluble and leachable under acidic conditions. Also, the distribution of many trace elements is likely to be coincident with the distribution of sulphide minerals and sulphide weathering products.
Available Fe results provide an understanding of the distribution of iron oxides in the overburden materials. In many samples, iron is a major component and a high proportion of iron is probably in the form of iron oxides such as magnetite (Fe3O4), hematite (Fe2O3) and goethite (FeOOH). Many minor and trace components could be present as impurities within these iron oxides (e.g. positive correlations between arsenic and iron have been noted elsewhere in the Pilbara, and have been attributed to incorporation in iron oxides). Iron oxides and oxy-hydroxides are also known to be strong adsorbents, and could be coincident with high adsorbed trace element loads.
The distribution of Mn was examined as a possible indicator of the distribution of transition metals in the mined materials.
The other analytes contained within the geological database are considered of limited value with respect to assessing the potential for metalliferous and saline drainage. SiO2, Al2O3 and K2O are major components of silicates – a mineral group that is considered unlikely to be reactive under the geochemical conditions expected within most OSAs or stockpiles (unless strongly acidic conditions are encountered). TiO2 is most likely hosted by similarly unreactive minerals such as ilmenite (FeTiO3) or rutile (TiO2). Phosphorus (P) is likely to be present either as an impurity in the iron oxides or the silicates, or possibly in the form of minor phosphates (also likely to be relatively unreactive).
The potential for metalliferous and saline drainage was also assessed based on a review of AMD laboratory analytical results for testing completed using the detailed AMD testing methods described in Section 2.1.2. Results were reviewed to assess the potential generation of salinity and leachable metals and metalloids.
In addition to the AMD testing data for Southern Flank samples, BHPBIO has collected AMD testing data for similar deposits across the BHPBIO operations. The regional AMD geochemistry database is used to assess data trends within and across geographical areas for common stratigraphic units.
2.2 APPROACH TO SOURCE-PATHWAY-RECEPTOR RISK ASSESSMENT
Risk Management is an integral component of the BHPBIO closure planning process. The risk management process involves establishing the context, risk identification, risk analysis, risk evaluation and risk treatment identification associated with selection of closure options or the design and execution of closure projects.
AMD risk assessments involve the evaluation of source, pathway and receptor risk of impacts for environmental, ecological or human health risk. The process involves technical specialists in quantitative and qualitative assessment based on scientific data and information. Relevant and current knowledge on source, pathway and receptors is used to inform the overall AMD risk assessment.
PRELIMINARY SOUTHERN FLANK AMD RISK ASSESSMENT
20
A workshop was held with subject matter experts to conduct a formal AMD risk assessment on Southern Flank. A detailed risk assessment matrix was developed as well as summary information for pit wall rock and mined waste based on the severity and likelihood of risk related events.
3 RESULTS OF PRELIMINARY AMD SOURCE ASSESSMENT
This section summarises the results of the preliminary AMD source assessment that were generated using methods described in Section 2.0.
3.1 ACIDIC DRAINAGE POTENTIAL
The Southern Flank AMD risk assessment undertaken during July 2016 used geochemical assay data from over 80,000 drillhole samples to calculate NAPP values and assign material to potential AMD classes (Tables 2 and 3) as per Section 2.1.1. In undertaking the source assessment two primary sources of material were considered, these were mined waste and material left exposed as wallrock in mined pits. The AMD source assessment included both bona fide waste material and low grade ore. Low grade ore was included due to uncertainty about whether it would be considered an ore product during operations.
Assessment of mined waste utilised AMD classification from blocks within the resource model (Table 1), whereas the scoping level assessment of wallrock used AMD classification derived from drillholes (calculated across each sample interval) as per Section 2.1.3. Within the risk assessment mined waste was risk assessed separately whether the material was dumped in-pit or ex-pit as AMD related impacts are different depending on the final waste destination. Even though early stage mine planning indicates that a percentage of mined waste will be returned as backfill this risk assessment looked at overall waste quantities and its AMD classification rather than assessing the relative split of in-pit versus ex-pit dumped waste.
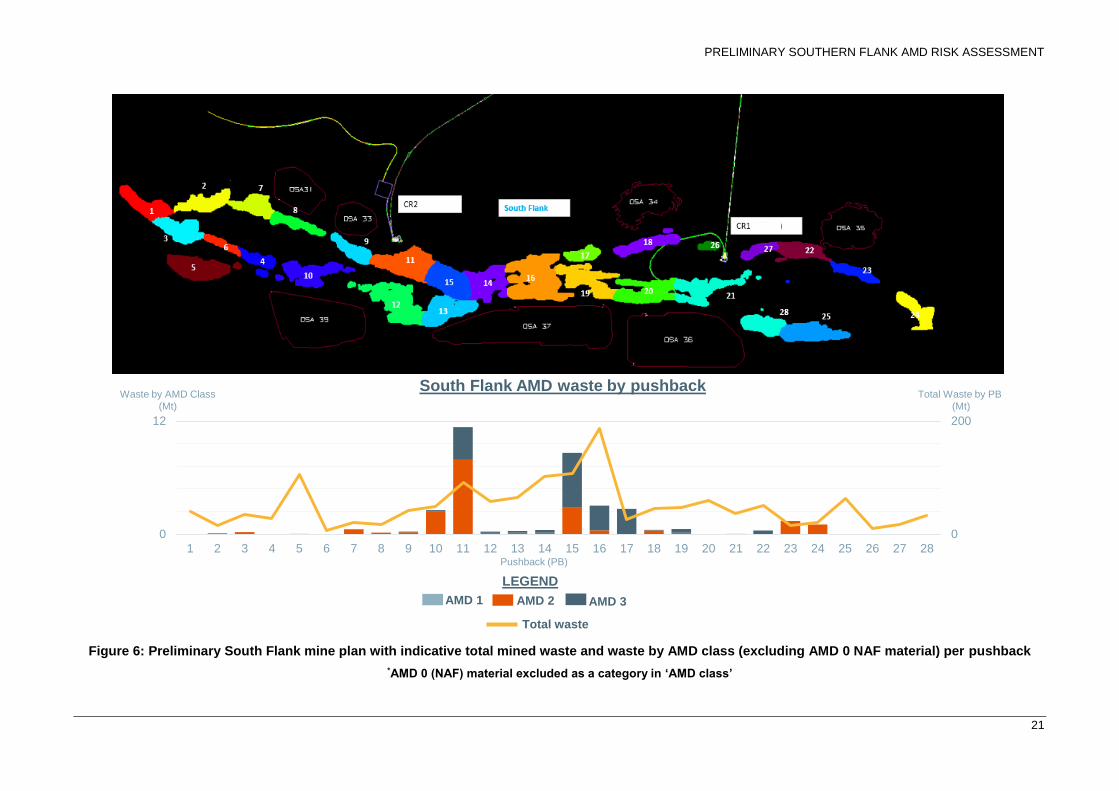
As described in the sections below assessment of the acid drainage potential of Southern Flank determined the mining operations to be low risk, dominantly due to no AMD 1 (PAF) material being identified in the resource model. An overview of waste material to be mined at Southern Flank by AMD classification is shown in Figure 6. Uncertain material classified as AMD2 or AMD3 occurs only as minor amounts relative to the overall mined waste component.
3.1.1 PIT WALLS
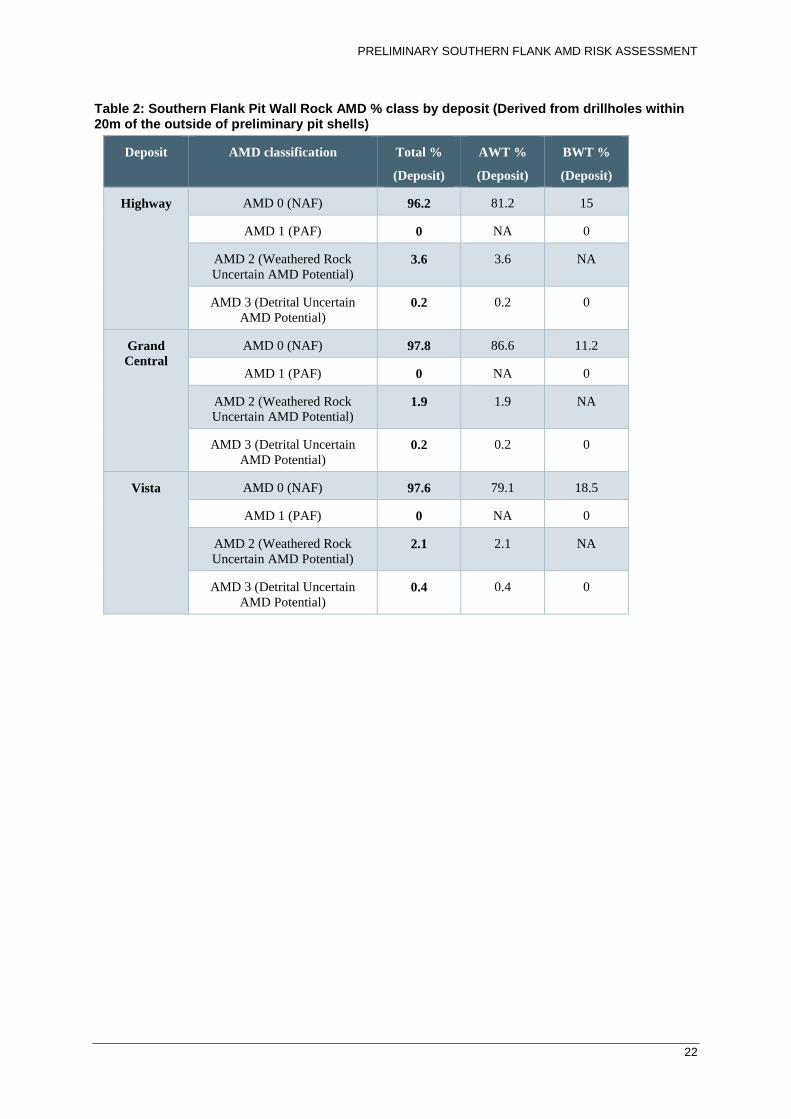
All three Southern Flank deposits show no AMD1 (PAF) classified material as being exposed within the pit wall rock (Table 2). Across all the deposits exposed pit wall material has between ~96-98% AMD 0 (NAF) material. Approximately 2-4% of material being AMD 2 weathered rock and AMD 3 detrital material has uncertain AMD potential (Table 2). About 85% of all exposed wall rock will sit AWT and therefore be subjected to varying intensity of oxidation and weathering meaning any sulphur present will likely be in a non-acid form of sulphate. Figures 7, 8 and 9 provide a breakdown of exposed pit wall rock AMD class by deposit.
Based on no AMD1 (PAF) material in the final pit walls at Southern Flank it was assessed that there is low risk of AMD from exposed wall rock. See Section 4 for the summary risk assessment.
.
PRELIMINARY SOUTHERN FLANK AMD RISK ASSESSMENT
21
Figure 6: Preliminary South Flank mine plan with indicative total mined waste and waste by AMD class (excluding AMD 0 NAF material) per pushback
*AMD 0 (NAF) material excluded as a category in ‘AMD class’
0
200
0
12
1 2 3 4 5 6 7 8 9 10 11 12 13 14 15 16 17 18 19 20 21 22 23 24 25 26 27 28
Waste by AMD Class
(Mt)
Total Waste by PB
(Mt)
Pushback (PB)
South Flank AMD waste by pushback
AMD 1 AMD 2 AMD 3
Total waste
LEGEND
PRELIMINARY SOUTHERN FLANK AMD RISK ASSESSMENT
22
Table 2: Southern Flank Pit Wall Rock AMD % class by deposit (Derived from drillholes within 20m of the outside of preliminary pit shells)
Deposit AMD classification Total %
(Deposit)
AWT %
(Deposit)
BWT %
(Deposit)
Highway AMD 0 (NAF) 96.2 81.2 15
AMD 1 (PAF) 0 NA 0
AMD 2 (Weathered Rock
Uncertain AMD Potential) 3.6 3.6 NA
AMD 3 (Detrital Uncertain
AMD Potential) 0.2 0.2 0
Grand
Central
AMD 0 (NAF) 97.8 86.6 11.2
AMD 1 (PAF) 0 NA 0
AMD 2 (Weathered Rock
Uncertain AMD Potential) 1.9 1.9 NA
AMD 3 (Detrital Uncertain
AMD Potential) 0.2 0.2 0
Vista AMD 0 (NAF) 97.6 79.1 18.5
AMD 1 (PAF) 0 NA 0
AMD 2 (Weathered Rock
Uncertain AMD Potential) 2.1 2.1 NA
AMD 3 (Detrital Uncertain
AMD Potential) 0.4 0.4 0

PRELIMINARY SOUTHERN FLANK AMD RISK ASSESSMENT
23
Figure 7: Highway Pit Wall Source Assessment (Derived from drillholes within 20m of the outside of preliminary pit shells)
AWT BWT
AMD 3 0.2 0.0
AMD 2 3.6 0.0
AMD 1 0.0 0.0
AMD 0 81.2 15.0
0
10
20
30
40
50
60
70
80
90
% D
rill
ho
le in
terv
als
N/A
N/A
AMD 096%
AMD 10%
AMD 24%
AMD 30%
Other4%
PRELIMINARY SOUTHERN FLANK AMD RISK ASSESSMENT
24
Figure 8: Grand Central Pit Wall Source Assessment (Derived from drillholes within 20m of the outside of preliminary pit shells)
AWT BWT
AMD 3 0.2 0.0
AMD 2 1.9 0.0
AMD 1 0.0 0.0
AMD 0 86.6 11.2
0
10
20
30
40
50
60
70
80
90
100
% D
rill
ho
le in
terv
als
N/A
N/A
AMD 098%
AMD 10%
AMD 22%
AMD 30%
Other2%
PRELIMINARY SOUTHERN FLANK AMD RISK ASSESSMENT
25
Figure 9: Vista Pit Wall Source Assessment (Derived from drillholes within 20m of the outside of preliminary pit shells)
3.1.2 MINED WASTE (DUMPED EX-PIT OR IN-PIT)
This risk assessment considers both in-pit and ex-pit waste dumping as separate risks. The quantity of waste split between the two was not considered material as the assumption was that the entire quantity of waste dumped could potentially go to either destination.
No waste material classified as AMD 1 (PAF) exists within the resource model across all three Southern Flank deposits (Table 3). AMD 0 (NAF) comprises between ~94-99% of waste material mined. Within Highway and Vista AMD 2 and 3 classified material makes up less than 1.3% of waste material to be mined (Table 3). Grand Central by comparison shows a distinct increase with ~5.6% of AMD 2 and 3 in waste rock to be mined (Table 3). This increase comes from pushbacks 11 and 15 in particular (Figure 8). Figures 10, 11 and 12 display all material to be mined (including high grade ore) by AMD classification and whether it lies AWT or BWT.
Based on no AMD1 (PAF) material being present it was assessed that there is low risk of acidic drainage from waste to be mined at Southern Flank regardless of whether dumped ex-pit or in-pit. See Table 6 for the summary risk assessment.
AWT BWT
AMD 3 0.4 0.0
AMD 2 2.1 0.0
AMD 1 0.0 0.0
AMD 0 79.1 18.5
0
10
20
30
40
50
60
70
80
90
% D
rill
ho
le in
terv
als
N/A
N/A
AMD 098%
AMD 10%
AMD 22%
AMD 30%
Other2%
PRELIMINARY SOUTHERN FLANK AMD RISK ASSESSMENT
26
Table 3: Southern Flank waste rock to be mined split by AMD class (Data from resource model using preliminary pit shell designs)
Deposit AMD classification Waste Rock
(Mt)
% Total
(Deposit)
Highway AMD 0 (NAF) 272.8 98.7
AMD 1 (PAF) 0 0
AMD 2 (Weathered Rock
Uncertain AMD Potential) 3.2 1.2
AMD 3 (Detrital Uncertain
AMD Potential) 0.3 0.1
Total 276.3
Grand
Central
AMD 0 (NAF) 393.4 94.4
AMD 1 (PAF) 0 0
AMD 2 (Weathered Rock
Uncertain AMD Potential) 10.1 2.4
AMD 3 (Detrital Uncertain
AMD Potential) 13.3 3.2
Total 416.8
Vista AMD 0 (NAF) 248.2 98.9
AMD 1 (PAF) 0 0
AMD 2 (Weathered Rock
Uncertain AMD Potential) 1.9 0.8
AMD 3 (Detrital Uncertain
AMD Potential) 0.9 0.4
Total 251
PRELIMINARY SOUTHERN FLANK AMD RISK ASSESSMENT
27
Figure 10: Graph and table of all mined material in Highway split by AWT and BWT. (Data sourced from Resource Model)
Figure 11: Graph and table of all mined material in Grand Central split by AWT and BWT. (Data sourced from Resource Model)
Above WaterTable
Below WaterTable
AMD 3 (UncertainDetrital)
334,257 0
AMD 2 (UncertainWeathered)
4,326,119 0
AMD 1 (PAF) 0 0
AMD 0 (NAF) 557,197,615 113,737,517
0
100,000,000
200,000,000
300,000,000
400,000,000
500,000,000
600,000,000
Ma
teri
al to
nn
ag
e
N/A
N/A
Above WaterTable
Below WaterTable
AMD 3 (Uncertain Detrital) 14,181,080 0
AMD 2 (UncertainWeathered)
15,791,746 0
AMD 1 (PAF) 0 0
AMD 0 (NAF) 923,011,779 12,903,306
0
200,000,000
400,000,000
600,000,000
800,000,000
1,000,000,000
1,200,000,000
Mate
rial to
nn
ag
e
PRELIMINARY SOUTHERN FLANK AMD RISK ASSESSMENT
28
Figure 12: Graph and table of all mined material in Vista split by AWT and BWT. (Data sourced from Resource Model)
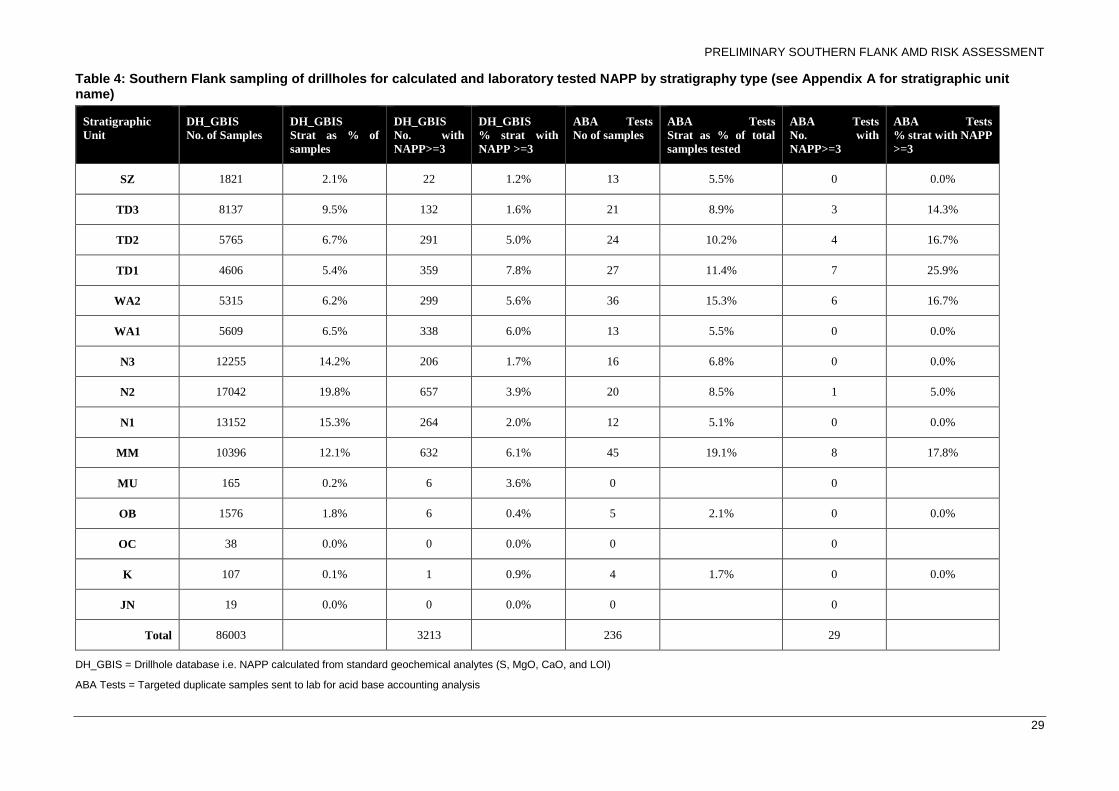
Calculated NAPP values within the Southern Flank resource models, using standard exploration geochemical analytes (S, MgO, CaO and LOI), were validated against ABA NAPP results from AMD laboratory tests of 236 samples taken as duplicates from resource definition holes (Figure 6 and Table 4). A positive correlation between calculated NAPP and ABA derived NAPP across the same sample intervals can be seen in Figure 13.
Comparing both calculated NAPP and ABA derived NAPP values in Table 4 shows that two stratigraphic units return the most samples with NAPP values >3. These units are Tertiary Detrital 1 (TD1) and MacLeod Member (MM), additional units with (relatively) a larger percentage of NAPP values >3 include West Angela Member 2 (WA2), Tertiary Detrital 2 (TD2) and Tertiary Detrital 3 (TD3).
Figure 13: Scatter plot of calculated NAPP values using standard geochemical analytes (S, MgO, CaO and LOI) vs NAPP derived from ABA tests
Above WaterTable
Below WaterTable
AMD 3 (Uncertain Detrital) 851,781 0
AMD 2 (UncertainWeathered)
2,953,937 0
AMD 1 (PAF) 0 0
AMD 0 (NAF) 583,940,154 25,313,034
0
100,000,000
200,000,000
300,000,000
400,000,000
500,000,000
600,000,000
700,000,000
Mate
rial to
nn
ag
e
N/A
N/A
0
5
10
15
20
25
30
35
40
-20 -10 0 10 20 30 40
NA
PP
(A
cid
Base A
ccounting T
ests
)
NAPP (Calculated from standard DH assay data)
PRELIMINARY SOUTHERN FLANK AMD RISK ASSESSMENT
29
Table 4: Southern Flank sampling of drillholes for calculated and laboratory tested NAPP by stratigraphy type (see Appendix A for stratigraphic unit name)
Stratigraphic
Unit
DH_GBIS
No. of Samples
DH_GBIS
Strat as % of
samples
DH_GBIS
No. with
NAPP>=3
DH_GBIS
% strat with
NAPP >=3
ABA Tests
No of samples
ABA Tests
Strat as % of total
samples tested
ABA Tests
No. with
NAPP>=3
ABA Tests
% strat with NAPP
>=3
SZ 1821 2.1% 22 1.2% 13 5.5% 0 0.0%
TD3 8137 9.5% 132 1.6% 21 8.9% 3 14.3%
TD2 5765 6.7% 291 5.0% 24 10.2% 4 16.7%
TD1 4606 5.4% 359 7.8% 27 11.4% 7 25.9%
WA2 5315 6.2% 299 5.6% 36 15.3% 6 16.7%
WA1 5609 6.5% 338 6.0% 13 5.5% 0 0.0%
N3 12255 14.2% 206 1.7% 16 6.8% 0 0.0%
N2 17042 19.8% 657 3.9% 20 8.5% 1 5.0%
N1 13152 15.3% 264 2.0% 12 5.1% 0 0.0%
MM 10396 12.1% 632 6.1% 45 19.1% 8 17.8%
MU 165 0.2% 6 3.6% 0 0
OB 1576 1.8% 6 0.4% 5 2.1% 0 0.0%
OC 38 0.0% 0 0.0% 0 0
K 107 0.1% 1 0.9% 4 1.7% 0 0.0%
JN 19 0.0% 0 0.0% 0 0
Total 86003 3213 236 29
DH_GBIS = Drillhole database i.e. NAPP calculated from standard geochemical analytes (S, MgO, CaO, and LOI)
ABA Tests = Targeted duplicate samples sent to lab for acid base accounting analysis
30
3.2 METALLIFEROUS AND SALINE DRAINAGE POTENTIAL
Metalliferrous drainage is unlikely to be a risk because of the absence of AMD 1 material (PAF) and the generation of acidic conditions that can mobilise metals and metalloids. AMD 2 and 3 material may have the potential to contribute to saline drainage. In areas of more concentrated AMD 2 and 3 waste rock, such as pushback 11 and 15 (Figure 7), saline drainage potential may require more attention in mine planning and operational management.
Review of AMD laboratory testing results (Geo-Environmental Management 2012) indicates that the majority of the overburden is expected to have relatively low salinity. However, the small quantity of overburden which is expected to have a sulfur content ≥0.1 %S may become saline, irrespective of whether the material is NAF or PAF. The majority of the overburden is expected to have low sodicity. However, high sodicity occurred in all of the samples that had low pH water extracts.
Arsenic, Fe, Sb and Se are expected to be enriched in the majority of the overburden materials and B, Hg and Mn may also be enriched in some of the overburden materials. These results indicate that a number of environmentally sensitive metals and metalloids could be mobilised under the expected prevailing near-neutral pH conditions within the proposed OSA’s and pits. However, leach testing does not indicate these metals and metalloids are readily available for release.
The results of more recent multi-element chemical analyses, including the calculated global abundance indicators (GAI), can provide a very conservative indication of how the measured elemental abundances compare to average ‘crustal’ abundances. Results for total elemental data indicate potential enrichment of As, Cr, Pb, Sb and Se in some of the samples. Leach testing data indicate that none of the potentially enriched metals and metalloids leach at concentrations exceeding Australian drinking water or stock water guidelines. These results demonstrate that there is a low risk of waste rock and pit wall rock adversely impacting environmental conditions within the Southern Flank mining area.
A comparison to AMD testing data for BHPBIO has collected AMD testing data for similar deposits across the BHPBIO operations indicates that the results for similar deposits are consistent with the data collected from ore deposits within the Southern Flank mining area.
4 RESULTS OF SOURCE-PATHWAY-RECEPTOR RISK ASSESSMENT
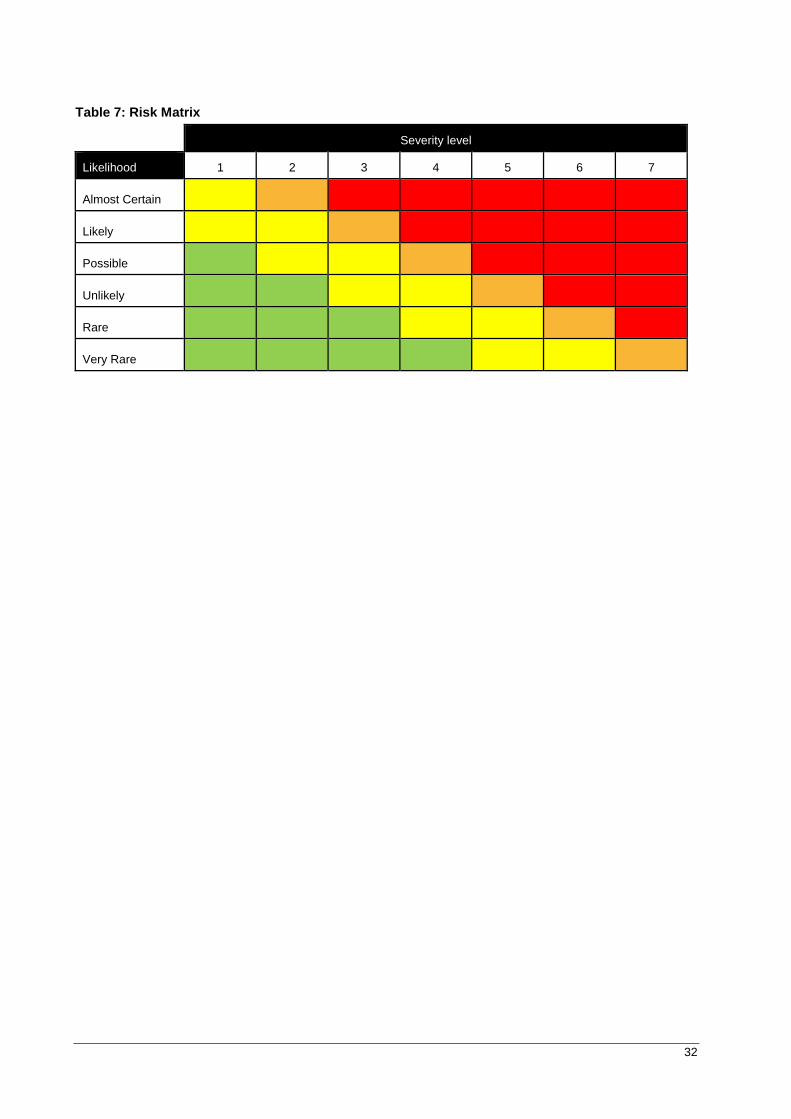
During August 2016 a workshop was held to conduct a formal AMD risk assessment on Southern Flank. Specialists from relevant disciplines within BHBPIO attended including mine planning, environment, hydrology (both surface water and groundwater), heritage, environmental geochemistry, geology and closure planning. They represent relevant areas of expertise to provide input allowing an informed assessment outcome. A presentation provided participants with context and data on AMD at Southern Flank, and a detailed risk assessment output was produced. Tables 5 and 6 summarise the results for exposed wall rock and mined waste, respectively, and Table 7 shows the risk assessment matrix used to rank each risk.
For all deposits at Southern Flank, exposed wall rock and dumped mined waste (in-pit and ex-pit) presents a low risk even prior to controls being implemented. While not discussed in detail BHPBIO have standards and procedures that govern controls and treatment of AMD 1 to 3 classified material.
Assessment of AMD potential at Southern Flank was based on early stage mine plans, future mine plan iterations will likely see some changes to pit wall position and tonnages. Data presented here was assessed as being representative of AMD data across the Southern Flank project area, any future adjustments to mine plans are not expected to cause material change in AMD potential. Should significant change occur to the mine plan or future drilling sample data change AMD classification then the AMD risk assessment will need to be updated.
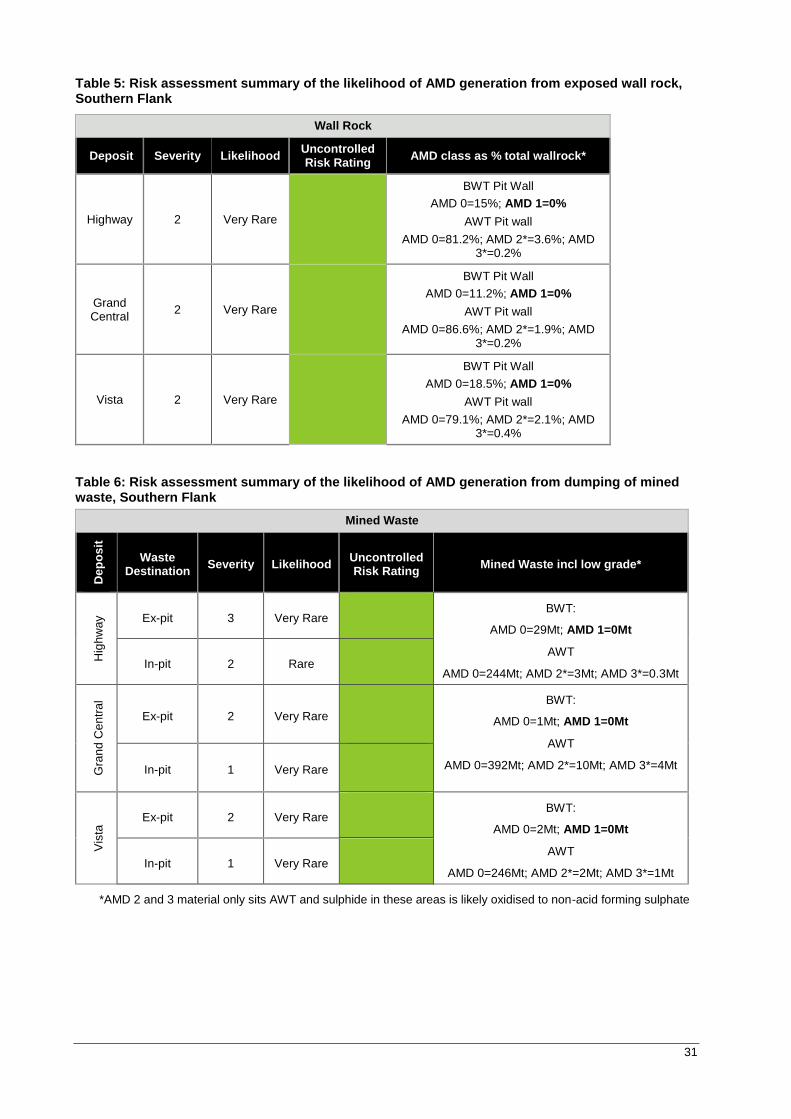
31
Table 5: Risk assessment summary of the likelihood of AMD generation from exposed wall rock, Southern Flank
Wall Rock
Deposit Severity Likelihood Uncontrolled Risk Rating
AMD class as % total wallrock*
Highway 2 Very Rare
BWT Pit Wall
AMD 0=15%; AMD 1=0%
AWT Pit wall
AMD 0=81.2%; AMD 2*=3.6%; AMD 3*=0.2%
Grand Central
2 Very Rare
BWT Pit Wall
AMD 0=11.2%; AMD 1=0%
AWT Pit wall
AMD 0=86.6%; AMD 2*=1.9%; AMD 3*=0.2%
Vista 2 Very Rare
BWT Pit Wall
AMD 0=18.5%; AMD 1=0%
AWT Pit wall
AMD 0=79.1%; AMD 2*=2.1%; AMD 3*=0.4%
Table 6: Risk assessment summary of the likelihood of AMD generation from dumping of mined waste, Southern Flank
Mined Waste
Dep
os
it
Waste Destination
Severity Likelihood Uncontrolled Risk Rating
Mined Waste incl low grade*
Hig
hw
ay
Ex-pit 3 Very Rare BWT:
AMD 0=29Mt; AMD 1=0Mt
AWT
AMD 0=244Mt; AMD 2*=3Mt; AMD 3*=0.3Mt In-pit 2 Rare
Gra
nd
Ce
ntr
al
Ex-pit 2 Very Rare
BWT:
AMD 0=1Mt; AMD 1=0Mt
AWT
AMD 0=392Mt; AMD 2*=10Mt; AMD 3*=4Mt In-pit 1 Very Rare
Vis
ta Ex-pit 2 Very Rare
BWT:
AMD 0=2Mt; AMD 1=0Mt
AWT
AMD 0=246Mt; AMD 2*=2Mt; AMD 3*=1Mt In-pit 1 Very Rare
*AMD 2 and 3 material only sits AWT and sulphide in these areas is likely oxidised to non-acid forming sulphate
32
Table 7: Risk Matrix
Severity level
Likelihood 1 2 3 4 5 6 7
Almost Certain
Likely
Possible
Unlikely
Rare
Very Rare
33
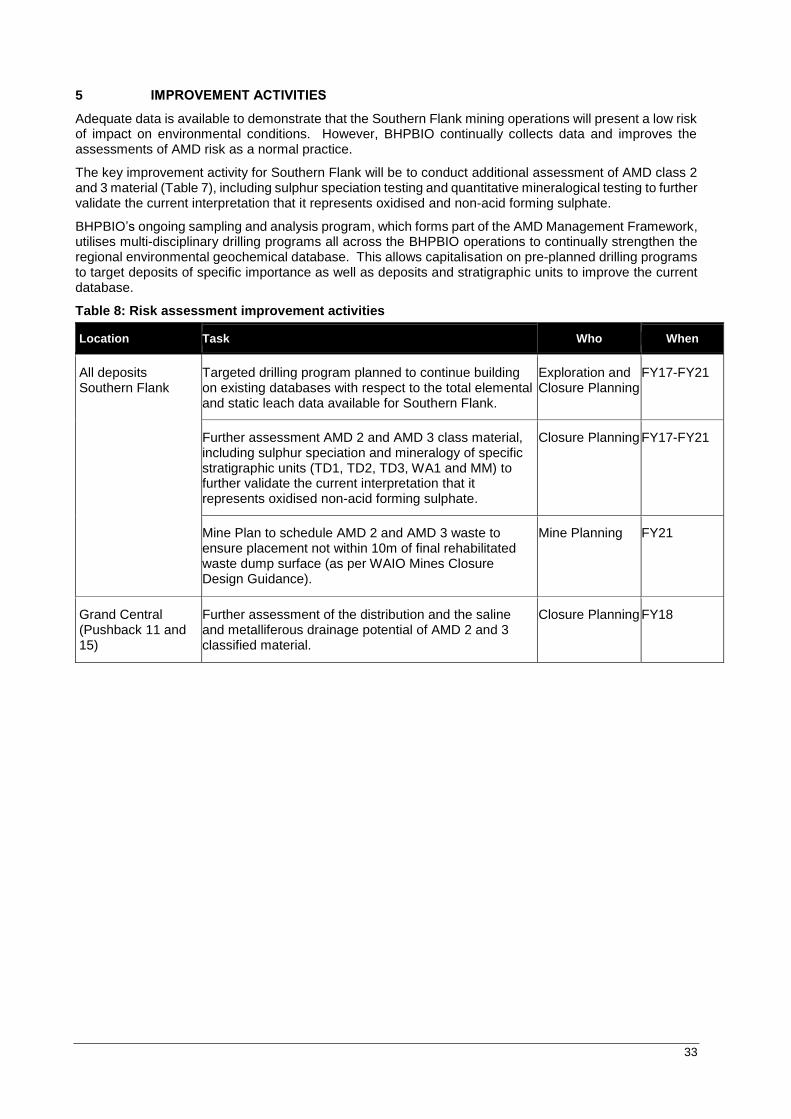
5 IMPROVEMENT ACTIVITIES
Adequate data is available to demonstrate that the Southern Flank mining operations will present a low risk of impact on environmental conditions. However, BHPBIO continually collects data and improves the assessments of AMD risk as a normal practice.
The key improvement activity for Southern Flank will be to conduct additional assessment of AMD class 2 and 3 material (Table 7), including sulphur speciation testing and quantitative mineralogical testing to further validate the current interpretation that it represents oxidised and non-acid forming sulphate.
BHPBIO’s ongoing sampling and analysis program, which forms part of the AMD Management Framework, utilises multi-disciplinary drilling programs all across the BHPBIO operations to continually strengthen the regional environmental geochemical database. This allows capitalisation on pre-planned drilling programs to target deposits of specific importance as well as deposits and stratigraphic units to improve the current database.
Table 8: Risk assessment improvement activities
Location Task Who When
All deposits Southern Flank
Targeted drilling program planned to continue building on existing databases with respect to the total elemental and static leach data available for Southern Flank.
Exploration and Closure Planning
FY17-FY21
Further assessment AMD 2 and AMD 3 class material, including sulphur speciation and mineralogy of specific stratigraphic units (TD1, TD2, TD3, WA1 and MM) to further validate the current interpretation that it represents oxidised non-acid forming sulphate.
Closure Planning FY17-FY21
Mine Plan to schedule AMD 2 and AMD 3 waste to ensure placement not within 10m of final rehabilitated waste dump surface (as per WAIO Mines Closure Design Guidance).
Mine Planning FY21
Grand Central (Pushback 11 and 15)
Further assessment of the distribution and the saline and metalliferous drainage potential of AMD 2 and 3 classified material.
Closure Planning FY18
34
6 REFERENCES
BHP Billiton Iron Ore Pty Ltd (2015) WAIO Acid and Metalliferous Drainage Management Standard [0096370] Version 004
BHP Billiton Iron Ore Pty Ltd (2016a) Pilbara Public Environmental Review Strategic Proposal
BHP Billiton Iron Ore Pty Ltd (2016b) Mining Area C Mine Closure Plan (rev 3)
Charles SP, Fu G, Silberstein RP, Mpelasoka F, McFarlane D, Hodgson G, Teng J, Gabrovsek C, Ali R, Barron O, Aryal SK, Dawes W, van Niel T and Chiew FHS (2013). Interim report on the hydroclimate of the Pilbara past, present and future, A report to the West Australian Government and industry partners from the CSIRO Pilbara Water Resource Assessment, CSIRO Water for a Healthy Country, Australia.
Geo-Environmental Management Pty Ltd (2012) Environmental Geochemistry Assessment of the South Flank Iron Ore Project, Western Australia
International Network for Acid Prevention (INAP), (2014). Global Acid Rock Drainage Guide
MWH, August 2016, South Flank Surface Water Environmental Impact Assessment
RPS (2014) Central Pilbara Hub Ecohydrological Conceptual Model. Report prepared for BHP Billiton iron Ore
35
APPENDIX A – Stratigraphic Unit Codes
SZ Surface Scree
Tertiary Detritals
TD 3 Tertiary Detritals 3 (Upper unit)
TD 2 Tertiary Detritals 2 (Middle unit)
TD 1 Tertiary Detritals 1 or Red Ochre Detritals (Lower unit)
Wittenoom Formation
OC Undifferentiated Bee Gorge Member
OB Undifferentiated Paraburdoo Member
WA2 West Angela Member (Upper unit)
WA1 West Angela Member (Lower unit)
Marra Mamba Iron Formation
N3 Mount Newman Member (Upper unit)
N2 Mount Newman Member (Middle unit)
N1 Mount Newman Member (Lower unit)
MM MacLeod Member
MU Nammuldi Member
Jeerinah Formation
JN Jeerinah Formation
Other
K Intrusive Dykes/Sills