Embed Size (px)
Citation preview

ENVIRONMENTAL
WATER
WASTEWATER
GEOTECHNICAL
CIVIL
PROJECTMANAGEMENT
con
sult
ing
en
gin
ee
rs
Universal Property Group Pty Ltd
P1505038JR02V01December 2015
Preliminary Salinity and GeotechnicalAssessment:Lot 5 DP 262886, 312 South Street,Marsden Park, NSW

martensPreliminary Salinity and Geotechnical Assessment:
312 South Street, Marsden Park, NSW.P1505038JR02V01 – December 2015
Page 2
Copyright Statement
Martens & Associates Pty Ltd (Publisher) is the owner of the copyright subsisting in this publication. Other than aspermitted by the Copyright Act and as outlined in the Terms of Engagement, no part of this report may be reprintedor reproduced or used in any form, copied or transmitted, by any electronic, mechanical, or by other means, nowknown or hereafter invented (including microcopying, photocopying, recording, recording tape or throughelectronic information storage and retrieval systems or otherwise), without the prior written permission of Martens &Associates Pty Ltd. Legal action will be taken against any breach of its copyright. This report is available only asbook form unless specifically distributed by Martens & Associates in electronic form. No part of it is authorised to becopied, sold, distributed or offered in any other form.
The document may only be used for the purposes for which it was commissioned. Unauthorised use of this documentin any form whatsoever is prohibited. Martens & Associates Pty Ltd assumes no responsibility where the document isused for purposes other than those for which it was commissioned.
Limitations Statement
The sole purpose of this report and the associated services performed by Martens & Associates Pty Ltd is to completea Preliminary Salinity and Geotechnical Assessment in accordance with the scope of services set out by UniversalProperty Group Pty Ltd (hereafter known as the Client). That scope of works and services were defined by therequests of the Client, by the time and budgetary constraints imposed by the Client, and by the availability of accessto the site.
Martens & Associates Pty Ltd derived the data in this report primarily from a number of sources including siteinspections, correspondence regarding the proposal, examination of records in the public domain, interviews withindividuals with information about the site or the project, and field explorations conducted on the dates indicated.The passage of time, manifestation of latent conditions or impacts of future events may require further examination /exploration of the site and subsequent data analyses, together with a re-evaluation of the findings, observations andconclusions expressed in this report.
In preparing this report, Martens & Associates Pty Ltd may have relied upon and presumed accurate certaininformation (or absence thereof) relative to the site. Except as otherwise stated in the report, Martens & AssociatesPty Ltd has not attempted to verify the accuracy of completeness of any such information (including for examplesurvey data supplied by others).
The findings, observations and conclusions expressed by Martens & Associates Pty Ltd in this report are not, andshould not be considered an opinion concerning the completeness and accuracy of information supplied by others.No warranty or guarantee, whether express or implied, is made with respect to the data reported or to the findings,observations and conclusions expressed in this report. Further, such data, findings and conclusions are based solelyupon site conditions, information and drawings supplied by the Client etc. in existence at the time of theinvestigation.
This report has been prepared on behalf of and for the exclusive use of the Client, and is subject to and issued inconnection with the provisions of the agreement between Martens & Associates Pty Ltd and the Client. Martens &Associates Pty Ltd accepts no liability or responsibility whatsoever for or in respect of any use of or reliance upon thisreport by any third party.

martensPreliminary Salinity and Geotechnical Assessment:
312 South Street, Marsden Park, NSW.P1505038JR02V01 – December 2015
Page 3
December 2015Copyright Martens & Associates Pty Ltd
All Rights Reserved
Head OfficeSuite 201, 20 George Street
Hornsby, NSW 2077, AustraliaACN 070 240 890 ABN 85 070 240 890
Phone: +61-2-9476-9999Fax: +61-2-9476-8767
Email: [email protected]: www.martens.com.au
Document and Distribution Status
Author(s) Reviewer(s) Project Manager Signature
Hamed Naghibi Ralph Erni Gray Taylor
Re
vis
ion
No
.
Description StatusRelease
Date
Document Location
File
Co
py
Un
ive
rsa
l
Pro
pe
rty
Gro
up
Pty
Ltd
1Preliminary Salinity and
GeotechnicalAssessment
Draft 04.12.2015 1E, 1H, 1P 1P
Distribution Types: F = Fax, H = Hard copy, P = PDF document, E = Other electronic format. Digits indicate number of documentcopies.
All enquiries regarding this project are to be directed to the Project Manager.

martensPreliminary Salinity and Geotechnical Assessment:
312 South Street, Marsden Park, NSW.P1505038JR02V01 – December 2015
Page 4
Contents
1 INTRODUCTION........................................................................................................ 5
1.1 Overview 5
1.2 Proposed Development 5
1.3 Assessment Objectives 5
1.4 Investigation Scope of Works 6
2 SITE CONDITIONS .................................................................................................... 7
2.1 General Site Details 7
2.2 Subsurface Conditions 8
3 SALINITY ASSESSMENT............................................................................................. 9
3.1 Documented Salinity Risk Potential 9
3.2 Broad Scale Salinity Processes 9
3.3 Signs of Potential Saline Soils at the site 9
3.4 Assessed Salinity Risk Potential 9
3.5 Laboratory Testing 11
3.6 Recommendations 13
4 GEOTECHNICAL ASSESSMENT .............................................................................. 15
4.1 Preliminary Soil and Rock Strength Properties 15
4.2 Risks of Slope Instability 15
4.3 Initial Design and Construction Advice and Recommendations 15
4.4 Site Classification 17
5 PRELIMINARY PAVEMENT THICKNESS DESIGN .................................................... 18
5.1 Overview 18
5.2 Equivalent Standard Axles 18
5.3 CBR Assessment 18
5.4 Pavement Thickness 19
5.5 Earthworks 20
6 PROPOSED ADDITIONAL ASSESSMENTS............................................................... 22
6.1 Proposed Additional Assessment 22
6.2 Proposed Monitoring and Inspection Program 22
6.3 Contingency Plan 23
7 LIMITATIONS........................................................................................................... 24
8 REFERENCES ........................................................................................................... 25
ATTACHMENT A - FIGURES......................................................................................... 26
ATTACHMENT B - BOREHOLE LOGS........................................................................... 29
ATTACHMENT C - DCP ‘N’ COUNTS .......................................................................... 40
ATTACHMENT D - ENVIROLAB LABORATORY RESULTS ............................................. 42
ATTACHMENT E - CBR TEST RESULTS........................................................................... 50
ATTACHMENT F - CSIRO SHEET BTF 18....................................................................... 52
ATTACHMENT G - NOTES ABOUT THIS REPORT ......................................................... 57

martensPreliminary Salinity and Geotechnical Assessment:
312 South Street, Marsden Park, NSW.P1505038JR02V01 – December 2015
Page 5
1 Introduction
1.1 Overview
This report documents the findings of a preliminary salinity andgeotechnical assessment, including pavement thickness design,completed to support a development application (DA) to BlacktownCity Council for the proposed redevelopment of Lot 5 DP 262886, 312South Street, Marsden Park, NSW (‘the site’). The site location is shown inFigure 1, Attachment A.
1.2 Proposed Development
We understand that the proposed development will consist of sitesubdivision for low density residential development, which will include:
o Earthworks for preparation of development platforms, includingredirecting and filling of existing water courses/ dams.
o Construction of above-ground buildings requiring limited bulkexcavation, assumed < 1m below ground level (BGL).
o Installation of stormwater infrastructure.
o Construction of new local access roads.
o Landscaping.
1.3 Assessment Objectives
1.3.1 Salinity Assessment
The objective of the salinity assessment is to assess the risk of soil salinityso that consideration can be given to local prevailing salinity conditionsand the impacts of, and on, the proposed development. Thisassessment has been carried out in general accordance with thefollowing guidelines:
o Department of Land and Water Conservation (DLWC, 2002), SiteInvestigations for Urban Salinity.
o Australian Standard (AS) 3600 (2009), Concrete structures.
1.3.2 Geotechnical Assessment and Pavement Thickness Design
The objectives of the geotechnical assessment and pavementthickness design include:

martensPreliminary Salinity and Geotechnical Assessment:
312 South Street, Marsden Park, NSW.P1505038JR02V01 – December 2015
Page 6
o Assessing geotechnical conditions for management ofgeotechnical risks that may affect the proposed development,the site and surrounding land and infrastructure.
o Provision of preliminary recommendations and advice for initialdesign and construction of the proposed development.
o Provision of preliminary pavement thickness design.
The assessment was undertaken in general accordance with theprinciples of the following guidelines / standards:
o AS 1289.6.3.2 (1997), Determination of the penetration resistanceof a soil - 9kg dynamic cone penetrometer test.
o AS 1726 (1993), Geotechnical site investigations.
o AS 2870 (2011), Residential slabs and footings.
o AS 3798 (2007), Guidelines on earthworks for commercial andresidential developments.
1.4 Investigation Scope of Works
Site investigation undertaken on 10 November 2015 included:
o A site walkover survey to confirm expected topography andgeology, to assess existing site conditions such asgeomorphological features, soil / rock exposures, surfacedrainage and vegetation and to identify evidence of possiblesaline soil or groundwater conditions.
o Reviewing DBYD survey plans.
o Ten boreholes, BH101 to BH110, to characterise subsurfacematerials and infer depth to top of rock, drilled up to 2.7 mBGLusing a 4WD truck-mounted hydraulic drill rig with spiral augersfitted with a V-shaped bit (V-bit) or tungsten carbide bit (TC-bit).
o Ten Dynamic Cone Penetrometer (DCP) tests, DCP101 to DCP110,up to 2.7 mBGL, to assist soil characterisation and estimation ofsoil strength in accordance with AS 1289.6.3.2 (1997) and assessdepth to top of rock.
o Collection of soil samples for laboratory testing and futurereference.
Approximate investigation locations are shown in Figure 1,Attachment A.

martensPreliminary Salinity and Geotechnical Assessment:
312 South Street, Marsden Park, NSW.P1505038JR02V01 – December 2015
Page 7
2 Site Conditions
2.1 General Site Details
Table 1 presents a summary of general site details. Existing site featuresare shown in Figure 1, Attachment A.
Table 1: Summary of general site details.
Item Description/Detail
Site address (Lot/DP) 312 South Street, Marsden Park, NSW (Lot 5 DP 262886).
Local Government Area(LGA)
Blacktown City Council.
Site area Approximately 10.05 ha.
Topography On near-level land.
Typical slopes, aspect North/north east aspect with grades generally < 15 %.
ElevationRanging from approximately 40 mAHD in the north eastern andnorth western corners to approximately 46 mAHD in the site’s southeastern corner.
Expected geology
Wianamatta Group Bringelly Shale comprising shale, carbonaceousclaystone, claystone, laminite, fine to medium grained lithicsandstone and rare coal and tuff (DME (1983) Penrith 1:100,000Geological Series Sheet 9030).
Expected soil landscape
The NSW Environment and Heritage eSPADE website identifies thesite as having soils of the Berkshire Park soil landscapes consisting ofweakly pedal orange heavy clays and clayey sands, often mottled.Ironstone nodules common. Large silcrete boulders occur insand/clay matrix. Solods, yellow and red podzolic soils, chocolatesoils, and structured clays and plastic clays.
Current land use Rural residential.
Proposed land use Residential (low density).
Existing sitedevelopment
The site is rural with existing brick and tile roofed dwelling and sheds.The majority of the site is open paddock, with two dams located inthe northern portion. The site is currently used for pig farming andbreeding (A & T Cauchi), and cattle and sheep grazing.
The site is bordered by cleared and undeveloped rural property tothe north, the former Blacktown City Council Waste Services Depotto the north east, rural residential property to the east, South Streetto the south, and Glengarrie Road to the west.
Existing vegetation Grass and trees.
Drainage Site drainage is via overland flow.

martensPreliminary Salinity and Geotechnical Assessment:
312 South Street, Marsden Park, NSW.P1505038JR02V01 – December 2015
Page 8
2.2 Subsurface Conditions
2.2.1 Encountered Subsurface Materials
Table 2 summarises subsurface materials and conditions, inferred fromborehole and DCP test results, to investigation termination depth.Encountered conditions are described in more detail on borehole logs,Attachment B, and associated explanatory notes, Attachment G. ForDCP test results refer to DCP ‘N’ counts in Attachment C.
Table 2: Generalised inferred subsurface profile to borehole termination depth.
Notes:
1 Refer to borehole logs for more detailed material descriptions at test locations.
2 Indicative depth range below ground level, to investigation termination depth, which mayvary across site depending on site and local geological conditions.
3 V-bit refusal.
4 Investigation termination depth (target depth reached).
5 Not encountered.
6 Hard clay between 0.2 m and 0.6 mBGL.
2.2.2 Groundwater
Groundwater inflow was not observed in the boreholes up to a depthof 2.7 mBGL. Review of DPI water Real Time groundwater databaseindicates that one groundwater bore with final depth of 14 m is locatedwithin 500 m of the site. Groundwater had not been encountered in thementioned groundwater bore.
We expect that the groundwater level at the entire site is unlikely to belocated above a depth of 3 mBGL. Further site investigations wouldneed to be carried out to assess permanent and fluctuatinggroundwater levels, if required, which may include installation ofgroundwater monitoring wells.
Layer 1Depth (mBGL)2
BH101 BH102 BH103 BH104 BH105 BH106 BH107 BH108 BH109 BH110
TOPSOIL / FILL: Silty CLAY(firm to very stiff)
0.0 –
0.2
0.0 –
0.1
0.0 –
0.2
0.0 –
0.2
0.0 –
0.1
0.0 –
0.25
0.0 –
0.35
0.0 –
0.3
0.0 –
0.25
0.0 –
0.1
RESIDUAL SOIL: CLAY (firmto very stiff)
0.2 –
0.9
0.1 –
0.6
0.2 –
1.2
0.2 –
2.06
0.1 –
0.75
0.25 –
1.5NE5
0.3 –
1.2
0.25 –
1.35
0.1 –
1.2
RESIDUAL SOIL: CLAY (verystiff to hard)
0.9 –
1.63
0.6 –
2.03
1.2 –
1.83
2.0 –
2.53,4
0.70 –
2.54
1.5 –
2.73,4
0.35 –
2.63,4
1.2 –
1.73
1.35 –
2.54NE5
WEATHERED ROCK:SILTSTONE (inferred low tomedium strength)
1.6 –
2.34
2.0 –2.54
1.8 –
2.44NE5 NE5 NE5 NE5
1.7 –
2.54NE5
1.2 –
2.54

martensPreliminary Salinity and Geotechnical Assessment:
312 South Street, Marsden Park, NSW.P1505038JR02V01 – December 2015
Page 9
3 Salinity Assessment
3.1 Documented Salinity Risk Potential
The 1:100,000 Salinity Potential in Western Sydney Map (DIPNR, 2002)indicates the site to be located in an area of moderate salinitypotential (Figure 2, Attachment A).
3.2 Broad Scale Salinity Processes
In producing the Salinity Potential Map, the Western Sydney RegionalOrganisation of Councils (WSROC) developed a number of alternativemodels of processes by which salinity may occur in Western Sydney(WSROC, 2003, pgs. 16 to 20).
A list of key broad scale salinity processes likely to impact the site,including summarised descriptions of each process, is presented inTable 3.
3.3 Signs of Potential Saline Soils at the site
No obvious signs of saline conditions were observed at the site:
o Vegetation growth appeared healthy and uninhibited.
o No water marks or salt crystals were observed on the groundsurface.
o Site surface drainage appeared generally good.
o No evidence of concentrated surface erosion was observed.
3.4 Assessed Salinity Risk Potential
In Table 3, the broad scale salinity processes have been assessed interms of likelihood of occurring at the site, considering the proposeddevelopment, site observations and investigation findings.
Table 3: Potential for broad scale salinity processes at the site.
Key salinityprocess
Description Potential at subject site
Localisedconcentrationof salinity
Localised concentration of salts due torelatively high evaporation rates.
Usually associated with waterlogged soil andpoor drainage.
Exacerbated by increased water use and/ orblocking of surface and subsurface waterflow associated with urban development.
Moderate – No evidence oflocalised salt concentration,waterlogged soil, poor drainage,and/ or blocking of surface andsubsurface water flow observed.However, existing dams andprevious water use may haveinfluenced the salinity.
martensPreliminary Salinity and Geotechnical Assessment:
312 South Street, Marsden Park, NSW.P1505038JR02V01 – December 2015
Page 10
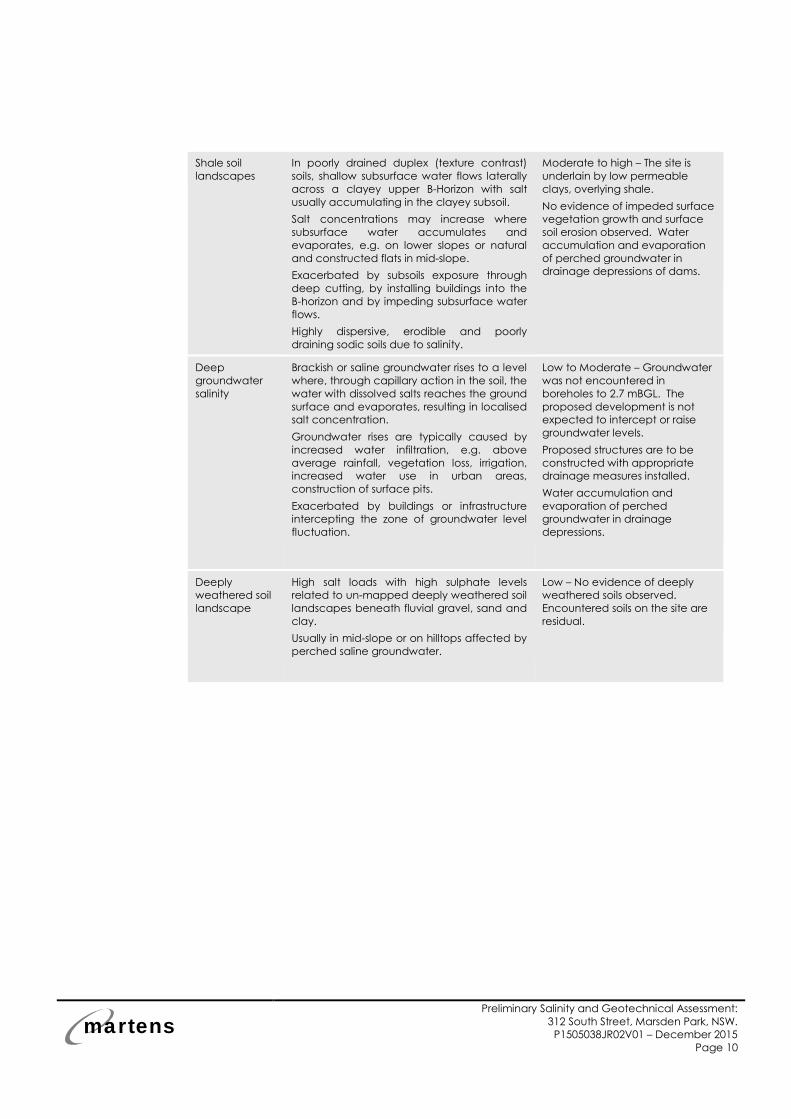
Shale soillandscapes
In poorly drained duplex (texture contrast)soils, shallow subsurface water flows laterallyacross a clayey upper B-Horizon with saltusually accumulating in the clayey subsoil.
Salt concentrations may increase wheresubsurface water accumulates andevaporates, e.g. on lower slopes or naturaland constructed flats in mid-slope.
Exacerbated by subsoils exposure throughdeep cutting, by installing buildings into theB-horizon and by impeding subsurface waterflows.
Highly dispersive, erodible and poorlydraining sodic soils due to salinity.
Moderate to high – The site isunderlain by low permeableclays, overlying shale.
No evidence of impeded surfacevegetation growth and surfacesoil erosion observed. Wateraccumulation and evaporationof perched groundwater indrainage depressions of dams.
Deepgroundwatersalinity
Brackish or saline groundwater rises to a levelwhere, through capillary action in the soil, thewater with dissolved salts reaches the groundsurface and evaporates, resulting in localisedsalt concentration.
Groundwater rises are typically caused byincreased water infiltration, e.g. aboveaverage rainfall, vegetation loss, irrigation,increased water use in urban areas,construction of surface pits.
Exacerbated by buildings or infrastructureintercepting the zone of groundwater levelfluctuation.
Low to Moderate – Groundwaterwas not encountered inboreholes to 2.7 mBGL. Theproposed development is notexpected to intercept or raisegroundwater levels.
Proposed structures are to beconstructed with appropriatedrainage measures installed.
Water accumulation andevaporation of perchedgroundwater in drainagedepressions.
Deeplyweathered soillandscape
High salt loads with high sulphate levelsrelated to un-mapped deeply weathered soillandscapes beneath fluvial gravel, sand andclay.
Usually in mid-slope or on hilltops affected byperched saline groundwater.
Low – No evidence of deeplyweathered soils observed.Encountered soils on the site areresidual.

martensPreliminary Salinity and Geotechnical Assessment:
312 South Street, Marsden Park, NSW.P1505038JR02V01 – December 2015
Page 11
3.5 Laboratory Testing
3.5.1 Overview
24 soil samples from ten boreholes were submitted to Envirolab Services,a National Association of Testing Authorities (NATA) accreditedlaboratory, for chemical testing (Electrical Conductivity (EC), pH andsoluble SO4). The testing was carried out for salinity classification and toassess an exposure classification for design of buried concretestructures. Sampling was targeted to achieve a representativecoverage of site conditions in line with assessed subsurface profiles,proposed earthworks and the limited investigation scope.
Groundwater was not observed down to investigation depth limits,being 2.7 mBGL. Perched groundwater from surface water seepageinflow may occur, particularly in the vicinity of creeks, as a result ofrainfall events, and should be tested if encountered duringconstruction.
3.5.2 Results – Salinity Classification
Laboratory test results for salinity classification are summarised in TableLaboratory test certificates are provided in Attachment D.
Table 4: Salinity test results.
Sample ID 1 MaterialEC(1:5)
(dS/m)ECe
(dS/m) 2Salinity Classification 3
5038/101/0.2 Clay 0.065 0.58 Non-saline
5038/101/0.5 Clay 0.120 0.96 Non-saline
5038/101/1.0 Clay 0.690 5.52 Moderately saline
5038/102/0.5 Clay 0.740 5.92 Moderately saline
5038/102/1.5 Clay 0.890 7.12 Moderately saline
5038/103/0.2 Clay 0.083 0.75 Non-saline
5038/103/0.5 Clay 0.320 2.56 Slightly saline
5038/103/1.5 Clay 1.100 8.80 Very saline
5038/104/0.2 Clay 0.120 1.08 Non-saline
5038/104/0.5 Clay 0.087 0.70 Non-saline
5038/105/0.5 Clay 1.500 12.00 Very saline
5038/105/2.0 Clay 0.740 5.92 Moderately saline
5038/106/0.2 Silty Clay 0.160 1.44 Non-saline
5038/106/0.5 Clay 0.240 1.92 Non-saline
5038/106/1.5 Clay 0.860 6.88 Moderately saline
5038/107/0.2 Silty Clay 0.210 1.89 Non-saline

martensPreliminary Salinity and Geotechnical Assessment:
312 South Street, Marsden Park, NSW.P1505038JR02V01 – December 2015
Page 12
Sample ID 1 MaterialEC(1:5)
(dS/m)ECe
(dS/m) 2Salinity Classification 3
5038/107/0.5 Clay 0.250 2.00 Slightly saline
5038/107/1.5 Clay 1.000 8.00 Very saline
5038/108/0.2 Silty Clay 0.140 1.26 Non-saline
5038/108/1.0 Clay 0.970 7.76 Moderately saline
5038/109/0.2 Silty Clay 0.770 6.93 Moderately saline
5038/109/1.0 Clay 1.300 10.4 Very saline
5038/110/0.2 Clay 0.093 0.74 Non-saline
5038/110/1.0 Clay 1.000 8.00 Very saline
Notes:
1 Project#/Borehole#/Depth (mBGL)
2 Based on EC to ECe multiplication factors from Table 6.1 in DLWC (2002).
3 Based on Table 6.2 of DLWC (2002) where ECe <2 dS/m = non-saline, ECe of 2-4 dS/m = slightlysaline, ECe of 4-8 dS/m = moderately saline, ECe of 8-16 dS/m = very saline and ECe of >16 dS/m= highly saline.
Results indicate subsurface materials up to 0.5 mBGL are classified asnon-saline to slightly saline. Residual clay soils below this depth aregenerally classified as moderately to very saline.
3.5.3 Results – Exposure Classification
Sulphate and pH test results for exposure classification are summarisedin Table 5. Laboratory test certificates are presented in Attachment D.
Table 5: Exposure classification test results.
Sample ID1 ECe (dS/m) 2 pH Sulphate (SO4) (mg/kg) Exposure Classification3
5038/101/0.2 0.58 5.8 24 A1
5038/101/0.5 0.96 5.4 120 A2
5038/101/1.0 5.52 4.9 180 A2
5038/102/0.5 5.92 4.7 330 A2
5038/102/1.5 7.12 4.7 320 A2
5038/103/0.2 0.75 6.1 38 A1
5038/103/0.5 2.56 5.2 210 A2
5038/103/1.5 8.80 4.8 250 B1
5038/104/0.2 1.08 5.6 110 A1
5038/104/0.5 0.70 5.9 47 A1
5038/105/0.5 12.00 5.0 1300 B1
5038/105/2.0 5.92 4.9 410 A2
5038/106/0.2 1.44 5.7 82 A1
5038/106/0.5 1.92 5.5 170 A2

martensPreliminary Salinity and Geotechnical Assessment:
312 South Street, Marsden Park, NSW.P1505038JR02V01 – December 2015
Page 13
Sample ID1 ECe (dS/m) 2 pH Sulphate (SO4) (mg/kg) Exposure Classification3
5038/106/1.5 6.88 4.9 340 A2
5038/107/0.2 1.89 6.4 79 A1
5038/107/0.5 2.00 6.4 100 A1
5038/107/1.5 8.00 5.5 480 B1
5038/108/0.2 1.26 6.4 35 A1
5038/108/1.0 7.76 4.9 830 A2
5038/109/0.2 6.93 6.5 370 A2
5038/109/1.0 10.4 5.0 630 B1
5038/110/0.2 0.74 5.8 78 A1
5038/110/1.0 8.00 5.1 650 B1
Notes:
1 Project#/Borehole#/Depth (mBGL)
2 From table 4.
3 Exposure classification for buried reinforced concrete based on Tables 4.8.1 and 4.8.2 of AS3600 (2009).
In accordance with AS3600 (2009), an exposure classification forconcrete of ‘B1’ should be adopted for preliminary design of buriedconcrete structures.
3.6 Recommendations
Future buried concrete structures should be designed in accordancewith the concrete cover specifications in AS 3600 (2009) for an exposureclassification of ‘B1’.
We recommend that saline soil management strategies are included inthe design and construction of the proposed development.
Management strategies for earthworks and landscaping shouldinclude, but not be limited to:
o Maintaining natural water balance.
o Limiting irrigation.
o Limiting soil disturbance, such as cut and fill, so saline or sodicsubsoils are not exposed or groundwater is not intercepted.
o Planting of suitable salt-tolerant plant species.
o Retention of existing deep-rooted vegetation.
o Offset landscaping and gardens from building and retainingwalls.
o Treating soils with gypsum before landscaping to suit selectivespecies.

martensPreliminary Salinity and Geotechnical Assessment:
312 South Street, Marsden Park, NSW.P1505038JR02V01 – December 2015
Page 14
o Where consistent with future land use and landscaping plan,planting of deep-rooted, preferably native, trees to increasewater absorption.
o Sealing, e.g. by lining, of stormwater detention ponds and waterfeatures to reduce infiltration.
o Preparing sediment and erosion control plans that take intoaccount saline soils.
o Replacing excavated soils in their original order.
o Any long term irrigation or watering on-site is to be at a level thatdoes not cause groundwater to become perched.
Management strategies for new buildings and services should include,but not be limited to:
o Limiting soil disturbance, such as compaction of soils, cutting andfilling.
o Designing and building structures to limit interference withnatural water flow on site.
o Using appropriate construction materials and techniques to saltproof buildings and infrastructure.
o Utilising damp proof courses and water proofing of slabs.
o Using exposure grade bricks/masonry below damp course or inretaining walls.
o Providing concrete strength and cover to steel reinforcing inaccordance with AS 3600 (2009) and the exposure classificationsoutlined in Table 5.
o Limiting excess surface water infiltration into the soil by designing,installing and maintaining appropriate stormwater drainage(gutters, downpipes, pits and pipes).
o Further assessment including laboratory testing, to improvecharacterisation of site salinity conditions, particularly inproposed development areas, and assess potential ensuingimplications on the proposed development and mitigationrequirements.

martensPreliminary Salinity and Geotechnical Assessment:
312 South Street, Marsden Park, NSW.P1505038JR02V01 – December 2015
Page 15
4 Geotechnical Assessment
4.1 Preliminary Soil and Rock Strength Properties
Soil and rock strengths were estimated from DCP test results inconjunction with borehole derived soil profile data. Preliminary soil androck strength properties are summarised in Table 6.
Table 6: Preliminary estimated soil and inferred rock strength properties.
Layer 1Yin-situ
2
(kN/m3)Cu 3
(kPa)Φ’ 4
()E’ 5
(MPa)
TOPSOIL / FILL: Silty CLAY (firm to very stiff) 17 25 NA6 5
RESIDUAL SOIL: CLAY (firm to very stiff) 17 25 NA6 5
RESIDUAL SOIL: CLAY (very stiff to hard) 18 150 NA6 30
WEATHERED ROCK: SILTSTONE (inferredlow to medium strength)
23 NA6 28 100
Notes:
1 Refer to borehole logs in Attachment B for material description details.
2 Inferred average In-situ unit weight for layer, based on visual assessment only (±2 kN/m3)
3 Undrained shear strength (± 5 kPa) assuming normally consolidated clay.
4 Effective internal friction angle (± 2 ) assuming drained conditions.
5 Effective Elastic Modulus (±10 %).
6 Not applicable.
4.2 Risks of Slope Instability
No evidence of former land instability was observed during the sitewalkover survey.
Site grades are typically < 5%. The risk of landslides impacting theproposed development is considered very low, subject to therecommendations in this report and adoption of industry standarddesign and construction methodologies. A slope risk assessment inaccordance with Australian Geomechanics Society (2007) guidelineswas not undertaken.
4.3 Initial Design and Construction Advice and Recommendations
From a geotechnical viewpoint, we consider the site to be suitable forthe proposed development, subject to the recommendationspresented in this report. No information regarding proposed structures,including footing requirements, was made available at the time ofreporting.
For the purpose of this report, we have considered typical structuresassociated with low density residential development. Site specific

martensPreliminary Salinity and Geotechnical Assessment:
312 South Street, Marsden Park, NSW.P1505038JR02V01 – December 2015
Page 16
testing will be required at detailed design stage to provide furtherrecommendations.
Table 7 presents a summary of preliminary geotechnicalrecommendations for initial design and developing constructionmethodologies for the proposed development.
Table 7: Preliminary geotechnical recommendations for initial design and construction.
Item Recommendation
Footings Shallow footings, such as pad and strip footings, slab-on-ground ordeepened pier or piled footings may be adopted as support for newstructures. Footings should be founded on natural material. Shallowfootings and piles may be designed adopting preliminarygeotechnical design parameters of 100 kPa and 500 kPa, respectively,subject to a founding depth of at least 0.6 mBGL, a pile socket of atleast 0.5 m or 1 pile diameter, whichever is greater. These valuesshould be confirmed by further assessment as detailed in Section 6.2and during construction by a geotechnical engineer on site.
All footings should found on material with similar end bearing capacityto limit differential movement across the building footprint. Individualpad footings should not span the interface between differentfoundation materials.
All footings should be inspected by a Geotechnical Engineer andconstructed with minimal delay following excavation. TheGeotechnical Engineer is to confirm encountered conditions satisfydesign assumptions and that the base of all excavations is free fromloose or softened material and water prior to footing construction.Water that has ponded in the base of excavations and any resultantsoftened material is to be removed prior to footing construction. If adelay in construction is anticipated, a concrete blinding layer of atleast 50 mm thickness should be placed to protect the foundationmaterial of shallow footings.
Earthworks Soils should generally be readily excavated using conventionalearthmoving equipment. All earthwork and preparation is to beapproved by a Geotechnical Engineer and undertaken inaccordance with AS 3798 (2007), Code of Practice 'Excavation Work'(Safe Work Australia, 2015) and Blacktown City Council’s engineeringguidelines (2005).
Retaining Structures/batters
Any excavations exceeding 0.75 m in height should be supported bysuitably designed and installed retaining or shoring structures.Alternatively, soil overburden may be excavated without structuralsupports but with a maximum temporary (less than 1 month) batterslope of 1 V (vertical): 2 H (horizontal) and permanent batter slope of1 V: 3 H. Retaining structures to be constructed as part of site worksare to be engineer designed and backfilled with suitable granularmaterial and free-draining drainage materials. Preliminary designmay adopt preliminary active and passive earth pressure coefficientsof 0.4 and 2.5 respectively.
Retaining wall design should consider additional surcharge loadingfrom existing and proposed structures, construction equipment,backfill compaction and static water pressures unless subsoil drainageis provided behind retaining walls.
Suitable drainage measures, such as a geotextile enclosed 100 mmagricultural pipes, should be included to redirect water that maycollect behind the retaining walls.

martensPreliminary Salinity and Geotechnical Assessment:
312 South Street, Marsden Park, NSW.P1505038JR02V01 – December 2015
Page 17
4.4 Site Classification
Clay of generally medium to high plasticity was encountered at depthsup to 2.7 mBGL. The clay is likely to have a high potential to shrink andswell as a result of changes in soil moisture content.
A preliminary site classification of ‘H1’ should be adopted for design oflightly loaded shallow footings, in accordance with AS 2870 (2011),subject to the recommendations presented in this report and CSIROguidelines (CSIRO BTF 18, 2003). A preliminary site classification of ‘P’should be adopted where footings are likely to be impacted by thepresence of uncontrolled fill or soft or loose foundation material or byenvironments that could lead to exceptional moisture conditionvariations within foundation material, such as areas impacted bycreeks, dams and filling.
Overland Flows All surface runoff should be diverted away from excavation areasduring construction works and from any retaining structures, footingsor the crest and base of embankments to prevent wateraccumulation, foundation / embankment material strength reductionand pore water pressure increases.
Soil erosion Soil overburden should be removed in a manner that reduces the riskof sedimentation of natural drainage channels and existingstormwater drainage systems in the vicinity of the site. All spoil on siteshould be properly controlled by erosion control measures to preventtransportation of sediments off-site. The following erosion controlmeasures should be considered, in conjunction with recommendationby Landcom (2004), to limit surface run-off and associated risk ofsurface scour, soil erosion and sedimentation:
o Maintain vegetation where possible.
o Disturb minimal area during excavation.
o Landscape disturbed areas following completion ofconstructions.
o Use gabion mattress, or other suitable energy reductionsolutions, where required.
o Direct water away from structures.

martensPreliminary Salinity and Geotechnical Assessment:
312 South Street, Marsden Park, NSW.P1505038JR02V01 – December 2015
Page 18
5 Preliminary Pavement Thickness Design
5.1 Overview
A preliminary pavement thickness design was undertaken for potentialnew cul-de-sac and local access roads. The design adopted a trafficloading of Equivalent Standard Axles (ESA) in accordance withBlacktown City Council’s Engineering Guide for Development (2005)and Austroads (2012) Guide to Pavement Technology Part 2 PavementStructural Design. A CBR value, adopted for the preliminary design, wasestimated using limited lab and field test results.
5.2 Equivalent Standard Axles
Table presents ESA values adopted for design of the proposed cul-de-sac and local roads.
Table 8: ESA values for proposed cul-de sac and local access roads.
Road Type N (ESA)
Cul-de-sac 5x10⁴
Local road 2x10⁵
5.3 CBR Assessment
Two bulk soil samples were collected and submitted to ResourceLaboratories, a NATA accredited laboratory, for CBR testing. Samplenumber 5038/CBR1 was collected from approximately 40 m to the northof BH109, and Sample number 5038/CBR2 from approximately 30 m tothe west of BH103 (Figure 1, Attachment A). A four day soaked CBR testwas conducted in accordance with AS 1289.1.1, 2.1.1, 5.1.1 and 6.1.1.Test results are summarised in Table . A laboratory test certificate isprovided in Attachment E.
Table 9: Laboratory CBR.
Sample Number MaterialSample Depth
(mBGL)CBR1 Value
5038/CBR1 CLAY 0.2 – 0.4 12
5038/CBR2 CLAY 0.2 – 0.4 4
Notes:
1 Four day soak, compacted to 98 % SMDD (±2 % of OMC), applying a 4.5 kg surcharge.

martensPreliminary Salinity and Geotechnical Assessment:
312 South Street, Marsden Park, NSW.P1505038JR02V01 – December 2015
Page 19
Based on Austroads (2012) and DCP test results, residual clay subgradematerials at test locations have a likely average CBR of between 4.0and 6.0 may be applicable to the residual clay subgrade.
Given the limited laboratory test results, DCP-CBR correlations usingAustroads (2012) and CBR values considered typical for the subgradematerial encountered at the site, we have adopted a CBR value of 4for preliminary design purposes. If material of inferior quality isuncovered during excavation, lower CBR values may be applicableand pavement material thickness may need to be revised.
Additional CBR testing is recommended to provide a better indicationof subgrade conditions across pavement areas, considering finaldesign levels, and / or provide statistical means to support a higher CBRdesign value. The additional testing may be undertaken atConstruction Certification stage.
5.4 Pavement Thickness
Table presents preliminary recommended pavement materialthicknesses for proposed cul-de-sac and local streets.
Table 10: Preliminary pavement material thickness design for CBR of 4
Road Type Layer Thickness (mm)
Cul-de-sac 2 x 25 mm layer of AC10(Pavement Surfacing)
502
Base (DGB 20) 1501
Sub-base (DGS 40) 1501
Total pavement depth 350
Local Street 2 x 25 mm layer of AC10(Pavement Surfacing)
502
Base (DGB 20) 1501
Sub-base (DGS 40) 1651
Total pavement depth 365
Notes:
1 Minimum based on Blacktown City Council’s Engineering Guide for Development (2005).
2 Impact of turning or stopping vehicles at end of road or intersections not included inassessment.

martensPreliminary Salinity and Geotechnical Assessment:
312 South Street, Marsden Park, NSW.P1505038JR02V01 – December 2015
Page 20
5.5 Earthworks
5.5.1 Subgrade Preparation
The subgrade is to be trimmed and compacted with density testing ofthe upper 300 mm layer at a rate of 1 test per 50 m of road length.Minimum density shall be 100 % Maximum Dry Density (MDD) at astandard compactive effort within -2 % and +2 % of optimum moisturecontent (OMC). Prior to placement of pavement material, thesubgrade shall be proof rolled and approved by a GeotechnicalEngineer.
Soft spots can be treated by one of the following methods subject tofinal design by Martens:
1. Removal and replacement with approved fill underGeotechnical Engineer’s direction.
2. In-situ stabilisation with cement, lime or similar binding agent to adepth of at least 300 mm below finished level. Use of thismethod and extent will depend on the condition of material tobe stabilised.
5.5.2 Subsoil Drainage
Surface and subsoil drainage should be provided in accordance withCouncil requirements. Typically subsurface drains are installed on theupslope side of all internal roads and generally extend 500 mm belowpavement level.
5.5.3 Placement and Testing of Pavement Material
Pavement materials shall be placed in layers (when compacted) notthicker than 250 mm or less than 75 mm. Pavement materials shall becompacted to the following condition:
o Sub-base - Minimum 98 % MDD at modified compactive effort(±2 % OMC).
o Base - Minimum 98 % MDD at modified compactive effort (±2 %OMC).
Compaction testing shall be undertaken by a NATA accreditedlaboratory in accordance with procedures as outlined in AS1289.Testing should be carried out at a rate of 1 per 250 m2 per layer or 3 perlayer placed, whichever is the greater. Each pavement layer shall beproof rolled under Geotechnical Engineers’ supervision. Subsequent

martensPreliminary Salinity and Geotechnical Assessment:
312 South Street, Marsden Park, NSW.P1505038JR02V01 – December 2015
Page 21
pavement layers shall not be placed prior to approval of underlyinglayer by the Geotechnical Engineer.
5.5.4 Fill Placement
Should filling be required to raise subgrade levels, the use of site-wonexcavated materials may be considered, subject to implementingstringent moisture conditioning controls, or mixing with lime to assistmaterial placement and testing. Alternatively, suitable granular fill,approved for use by a Geotechnical Engineer may be adopted.
All earthwork and fill material testing and preparation is to be approvedby a Geotechnical Engineer and undertaken in accordance with AS3798 (2007) and Blacktown City Council’s engineering guidelines (2005).

martensPreliminary Salinity and Geotechnical Assessment:
312 South Street, Marsden Park, NSW.P1505038JR02V01 – December 2015
Page 22
6 Proposed Additional Assessments
6.1 Proposed Additional Assessment
We recommend the following additional assessments are carried outduring development of final design and prior to issuing of a constructioncertificate to better manage geotechnical risks, where applicable:
o Assessment of foundation condition up to at least 2 m below finalbulk excavation and foundation levels, as applicable.
o Laboratory testing of soil and rock, as necessary, for moreaccurate assessment of subsurface conditions at future dwellingand infrastructure locations and of associated designparameters and to confirm or alter preliminary site classificationsand design assumptions. This should include shrink/swell andAtterberg Limits laboratory testings.
o Assessment of subsurface conditions, including CBR testing,along proposed road alignments.
o Assessment of site specific foundation material capacityconsidering adopted footing types.
o Review of construction staging plans by a GeotechnicalEngineer.
o Groundwater level if excavations are likely to extend below 2mBGL.
o Further salinity testing to delineate salinity conditions across soilprofiles and development areas, considering final developmentdetails.
6.2 Proposed Monitoring and Inspection Program
To maintain site stability during site works and limit adversegeotechnical impacts on the site and surrounding areas as a result ofthe proposed development, we recommend the following is inspectedand monitored (Table ) during site works. This program may beupdated following further detailed investigations.
martensPreliminary Salinity and Geotechnical Assessment:
312 South Street, Marsden Park, NSW.P1505038JR02V01 – December 2015
Page 23
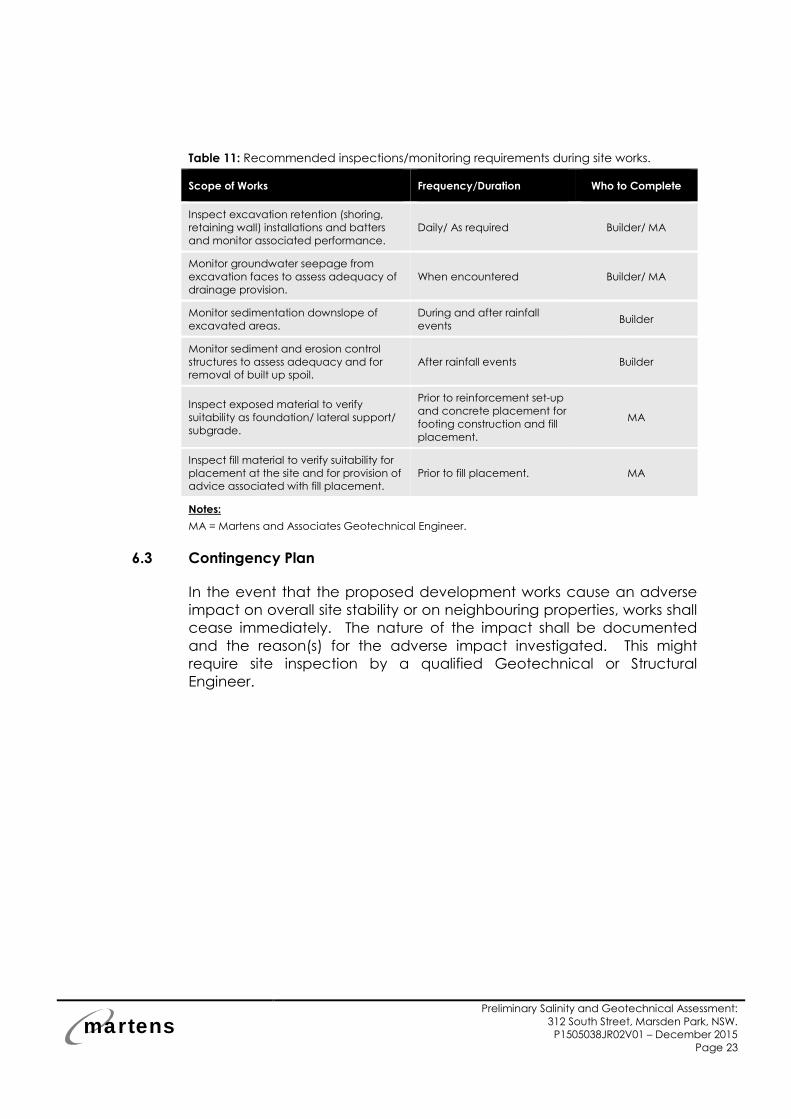
Table 11: Recommended inspections/monitoring requirements during site works.
Scope of Works Frequency/Duration Who to Complete
Inspect excavation retention (shoring,retaining wall) installations and battersand monitor associated performance.
Daily/ As required Builder/ MA
Monitor groundwater seepage fromexcavation faces to assess adequacy ofdrainage provision.
When encountered Builder/ MA
Monitor sedimentation downslope ofexcavated areas.
During and after rainfallevents
Builder
Monitor sediment and erosion controlstructures to assess adequacy and forremoval of built up spoil.
After rainfall events Builder
Inspect exposed material to verifysuitability as foundation/ lateral support/subgrade.
Prior to reinforcement set-upand concrete placement forfooting construction and fillplacement.
MA
Inspect fill material to verify suitability forplacement at the site and for provision ofadvice associated with fill placement.
Prior to fill placement. MA
Notes:
MA = Martens and Associates Geotechnical Engineer.
6.3 Contingency Plan
In the event that the proposed development works cause an adverseimpact on overall site stability or on neighbouring properties, works shallcease immediately. The nature of the impact shall be documentedand the reason(s) for the adverse impact investigated. This mightrequire site inspection by a qualified Geotechnical or StructuralEngineer.

martensPreliminary Salinity and Geotechnical Assessment:
312 South Street, Marsden Park, NSW.P1505038JR02V01 – December 2015
Page 24
7 Limitations
The recommendations presented in this report are based on limitedpreliminary investigations and include specific issues to be addressedduring the design and construction phases of the project. In the eventthat any of the recommendations presented in this report are notimplemented, the general recommendations may becomeinapplicable and Martens & Associates accept no responsibilitywhatsoever for the performance of the works undertaken whererecommendations are not implemented in full and properly tested,inspected and documented.
Occasionally, subsurface conditions between and below thecompleted boreholes or other tests may be found to be different (ormay be interpreted to be different) from those expected. Variationcan also occur with groundwater conditions, especially after climaticchanges. If such differences appear to exist, we recommend that youimmediately contact Martens & Associates.

martensPreliminary Salinity and Geotechnical Assessment:
312 South Street, Marsden Park, NSW.P1505038JR02V01 – December 2015
Page 25
8 References
Australia Standard 1289.6.3.2 (AS, 1997) Determination of thepenetration resistance of a soil - 9kg dynamic cone penetrometer test.
Australia Standard 1726 (AS, 1993) Geotechnical site investigations.
Australia Standard 2870 (AS, 2011) Australia Standard, Residential slabsand footings.
Australia Standard 3600 (AS, 2009) Concrete structures.
Australia Standard 3798 (AS, 2007) Guidelines on earthworks forcommercial and residential developments.
Austroads (2012) Guide to Pavement Technology, Part 2 PavementStructural Design
Blacktown City Council (2006), Development Control Plan.
Blacktown City Council (2005), Engineering Guide for Development.
CSIRO BTF 18 (2003) Foundation Maintenance and FootingPerformance: A homeowner’s Guide.
Department of Land and Water Conservation (DLWC, 2002) Siteinvestigations for urban salinity.
Department of Infrastructure Planning and Natural Resources (DIPNR,2002) Salinity Potential in Western Sydney Map.
Geological Survey of NSW Department of Minerals and Energy (1991),Penrith 1:100,000 Geological Series Sheet 9030.
Landcom (2004) Managing Urban Stormwater: Soils and Construction.
Western Sydney Regional Organisation of Councils (WSROC, 2003)Western Sydney Salinity Code of Practice.
NSW Department of Primary Industries, Water’s real-time data.

martensPreliminary Salinity and Geotechnical Assessment:
312 South Street, Marsden Park, NSW.P1505038JR02V01 – December 2015
Page 26
Attachment A - Figures

martensPreliminary Salinity and Geotechnical Assessment:
312 South Street, Marsden Park, NSW.P1505038JR02V01 – December 2015
Page 27
mart
en
s
Drawn:
Approved:
Date:
Scale:
HN
RE
03.12.2015
Not to Scale File No: P1505038JR02V01
Environment | Water | Wastewater | Geotechnical | Civil | ManagementMartens & Associates Pty Ltd ABN 85 070 240 890
FIGURE 1
Drawing No:
GEOTECHNICAL TESTING LOCATION PLAN312 South Street, Marsden Park, NSW
(Source: Nearmap)
-BH101-DCP101
-BH102-DCP102
-BH103-DCP103
-BH104-DCP104
-BH105-DCP105
-BH106-DCP106
-BH107-DCP107
-BH108-DCP108
-BH109-DCP109
-BH110-DCP110
Indicative borehole and DCP test location
Key:
N
CBR1
CBR2
Approximate site boundary
Indicative CBR sampling location
Glengarrie Road
South Street

martensPreliminary Salinity and Geotechnical Assessment:
312 South Street, Marsden Park, NSW.P1505038JR02V01 – December 2015
Page 28
Indicative site location
mart
en
s
Drawn:
Approved:
Date:
Scale:
HN
RE
03.12.2015
Not to Scale File No: P1505038JR02V01
Environment | Water | Wastewater | Geotechnical | Civil | ManagementMartens & Associates Pty Ltd ABN 85 070 240 890
FIGURE 2
Drawing No:
1:100,000 MAP of SALINITY POTENTIAL IN WESTERN SYDNEY(Source: DIPNR, 2002)
N

martensPreliminary Salinity and Geotechnical Assessment:
312 South Street, Marsden Park, NSW.P1505038JR02V01 – December 2015
Page 29
Attachment B - Borehole Logs

Qualit
yS
he
etN
o.4
(C) Copyright Martens & Associates Pty. Ltd . 2015
Engineering Log -MARTENS & ASSOCIATES PTY LTDSuite 201, 20 george St, Hornsby, NSW 2077 Australia
Phone: (02) 9476 9999 Fax: (02) 9476 [email protected] WEB: http://www.martens.com.au
P1505038
1.0
2.0
3.0
4.0
1.0
2.0
3.0
4.0
4.54.5
martens
REFSheet of
SU
PP
OR
T
WA
TE
R
RESULTS ANDADDITIONAL OBSERVATIONS
EXCAVATION DATA
ME
TH
OD
MATERIAL DATA SAMPLING & TESTING
EXCAVATION LOG TO BE READ IN CONJUNCTION WITH ACCOMPANYING REPORT NOTES AND ABBREVIATIONS
MO
IST
UR
E
DE
PT
H(M
)
TY
PE
DE
PT
H(M
)
CLIENT
PROJECT NO.
PROJECT
SITE
DR
ILL
ING
RE
SIS
TA
NC
E
L M H R
EQUIPMENT
EXCAVATION DIMENSIONS
EASTING
NORTHING
RL SURFACE
ASPECT
COMMENCED
LOGGED
GEOLOGY
COMPLETED
CHECKED
VEGETATION
EQUIPMENT / METHODN Natural exposureX Existing excavationBH Backhoe bucketHA Hand augerS SpadeCC Concrete CorerV V-bitTC Tungsten Carbide BitPT Push tube
MOISTURED DryM MoistW WetWp Plastic limitWl Liquid limit
WATERN None observedX Not measured
Water level
Water outflow
Water inflow
SUPPORTSH ShoringSC ShotcreteRB Rock BoltsNil No support
CLASSIFICATIONSYMBOLS ANDSOIL DESCRIPTION
USCS
Agricultural
CONSISTENCYVS Very SoftS SoftF FirmSt StiffVSt Very StiffH HardF Friable
DENSITYVL Very LooseL LooseMD Medium DenseD DenseVD Very Dense
DRILLINGRESISTANCEL LowM ModerateH HighR Refusal
SLOPE
SAMPLING & TESTINGA Auger sampleB Bulk sampleU Undisturbed sampleD Disturbed sampleUx Tube sample (x mm)pp Pocket penetrometerSPT Standard penetration testCBR California Bearing Ratio
VS Vane shearDCP Dynamic cone
penetrometerFD Field densityM Moisture contentWS Water sample
GR
AP
HIC
LO
G
CL
AS
SIF
ICA
TIO
N
CO
NS
IST
EN
CY
DE
NS
ITY
IND
EX
MATERIAL DESCRIPTION
SOIL NAME, plasticity or particle characteristics,colour, secondary and minor components,
moisture condition, consistency/relative density,
ROCK NAME, grain size, texture/fabric, colour,strength, weathering.
BH101
N
Y
Borehole
1 1
4WD Truck Mounted Rig
Ø90mm X 2.3m depth
NA
NA
NA
North West
10/11/15
GMT
Siltstone/Shale
10/11/15
RE
Grass
<2%
Universal Property Group Pty Ltd
Preliminary Salinity and Geotechnical Assessment
312 South Street, Marsden Park, NSW
End of borehole (TC-bit refusal).Terminated at 2.3m on inferred
medium strength siltstone.
- TOPSOIL
2.3
Silty CLAY - Low to medium plasticity,brown, with rootlets.
V Nil N MCL-CI
0.2
- RESIDUAL
CLAY - Medium to high plasticity,light grey/red.
V Nil N D
0.7
- WEATHERED ROCK
1.6
CLAY - Medium plasticity, red/brown.V Nil N M CI
SILTSTONE - Inferred low to mediumstrength, distinctly weathered.
TC Nil N D
- RESIDUAL
CI-CH
V-bit refusal at 1.6m.
A 0.2 /S/01
A
A
A
A
0.5 /S/01
1.0 /S/01
1.5 /S/01
2.0 /R/01
F
St
VSt-H
St

Qualit
yS
he
etN
o.4
(C) Copyright Martens & Associates Pty. Ltd . 2015
Engineering Log -MARTENS & ASSOCIATES PTY LTDSuite 201, 20 george St, Hornsby, NSW 2077 Australia
Phone: (02) 9476 9999 Fax: (02) 9476 [email protected] WEB: http://www.martens.com.au
P1505038
1.0
2.0
3.0
4.0
1.0
2.0
3.0
4.0
4.54.5
martens
REFSheet of
SU
PP
OR
T
WA
TE
R
RESULTS ANDADDITIONAL OBSERVATIONS
EXCAVATION DATA
ME
TH
OD
MATERIAL DATA SAMPLING & TESTING
EXCAVATION LOG TO BE READ IN CONJUNCTION WITH ACCOMPANYING REPORT NOTES AND ABBREVIATIONS
MO
IST
UR
E
DE
PT
H(M
)
TY
PE
DE
PT
H(M
)
CLIENT
PROJECT NO.
PROJECT
SITE
DR
ILL
ING
RE
SIS
TA
NC
E
L M H R
EQUIPMENT
EXCAVATION DIMENSIONS
EASTING
NORTHING
RL SURFACE
ASPECT
COMMENCED
LOGGED
GEOLOGY
COMPLETED
CHECKED
VEGETATION
EQUIPMENT / METHODN Natural exposureX Existing excavationBH Backhoe bucketHA Hand augerS SpadeCC Concrete CorerV V-bitTC Tungsten Carbide BitPT Push tube
MOISTURED DryM MoistW WetWp Plastic limitWl Liquid limit
WATERN None observedX Not measured
Water level
Water outflow
Water inflow
SUPPORTSH ShoringSC ShotcreteRB Rock BoltsNil No support
CLASSIFICATIONSYMBOLS ANDSOIL DESCRIPTION
USCS
Agricultural
CONSISTENCYVS Very SoftS SoftF FirmSt StiffVSt Very StiffH HardF Friable
DENSITYVL Very LooseL LooseMD Medium DenseD DenseVD Very Dense
DRILLINGRESISTANCEL LowM ModerateH HighR Refusal
SLOPE
SAMPLING & TESTINGA Auger sampleB Bulk sampleU Undisturbed sampleD Disturbed sampleUx Tube sample (x mm)pp Pocket penetrometerSPT Standard penetration testCBR California Bearing Ratio
VS Vane shearDCP Dynamic cone
penetrometerFD Field densityM Moisture contentWS Water sample
GR
AP
HIC
LO
G
CL
AS
SIF
ICA
TIO
N
CO
NS
IST
EN
CY
DE
NS
ITY
IND
EX
MATERIAL DESCRIPTION
SOIL NAME, plasticity or particle characteristics,colour, secondary and minor components,
moisture condition, consistency/relative density,
ROCK NAME, grain size, texture/fabric, colour,strength, weathering.
BH102
N
Y
Borehole
1 1
Hydraulic Rig
Ø90mm X 2.5m depth
NA
NA
NA
North West
10/11/15
GMT
Siltstone/Shale
10/11/15
RE
Grass
<2%
Universal Property Group Pty Ltd
Geotechnical Investigation
312 South Street, Marsden Park, NSW
End of borehole. Terminated at 2.5m oninferred medium strength siltstone.
- TOPSOIL
2.5
- RESIDUAL
CLAY - Medium to high plasticity,light grey/red.
V Nil N D
0.6
- WEATHERED ROCK
CLAY - Medium plasticity, red/brown.V Nil N M CI
SILTSTONE - Inferred low to mediumstrength, distinctly weathered.
TC Nil N D
- RESIDUAL
CI-CH
V-bit refusal at 2.0m.
A 0.2 /S/01
A
A
A
0.5 /S/01
1.0 /S/01
1.5 /S/01
A 2.0 /R/01
A 2.5 /R/01
Fill: Silty CLAY - Low to medium plasticity,brown, with rootlets.
V Nil N MCL-CI0.1
VSt
VSt
VSt
St

Qualit
yS
he
etN
o.4
(C) Copyright Martens & Associates Pty. Ltd . 2015
Engineering Log -MARTENS & ASSOCIATES PTY LTDSuite 201, 20 george St, Hornsby, NSW 2077 Australia
Phone: (02) 9476 9999 Fax: (02) 9476 [email protected] WEB: http://www.martens.com.au
P1505038
1.0
2.0
3.0
4.0
1.0
2.0
3.0
4.0
4.54.5
martens
REFSheet of
SU
PP
OR
T
WA
TE
R
RESULTS ANDADDITIONAL OBSERVATIONS
EXCAVATION DATA
ME
TH
OD
MATERIAL DATA SAMPLING & TESTING
EXCAVATION LOG TO BE READ IN CONJUNCTION WITH ACCOMPANYING REPORT NOTES AND ABBREVIATIONS
MO
IST
UR
E
DE
PT
H(M
)
TY
PE
DE
PT
H(M
)
CLIENT
PROJECT NO.
PROJECT
SITE
DR
ILL
ING
RE
SIS
TA
NC
E
L M H R
EQUIPMENT
EXCAVATION DIMENSIONS
EASTING
NORTHING
RL SURFACE
ASPECT
COMMENCED
LOGGED
GEOLOGY
COMPLETED
CHECKED
VEGETATION
EQUIPMENT / METHODN Natural exposureX Existing excavationBH Backhoe bucketHA Hand augerS SpadeCC Concrete CorerV V-bitTC Tungsten Carbide BitPT Push tube
MOISTURED DryM MoistW WetWp Plastic limitWl Liquid limit
WATERN None observedX Not measured
Water level
Water outflow
Water inflow
SUPPORTSH ShoringSC ShotcreteRB Rock BoltsNil No support
CLASSIFICATIONSYMBOLS ANDSOIL DESCRIPTION
USCS
Agricultural
CONSISTENCYVS Very SoftS SoftF FirmSt StiffVSt Very StiffH HardF Friable
DENSITYVL Very LooseL LooseMD Medium DenseD DenseVD Very Dense
DRILLINGRESISTANCEL LowM ModerateH HighR Refusal
SLOPE
SAMPLING & TESTINGA Auger sampleB Bulk sampleU Undisturbed sampleD Disturbed sampleUx Tube sample (x mm)pp Pocket penetrometerSPT Standard penetration testCBR California Bearing Ratio
VS Vane shearDCP Dynamic cone
penetrometerFD Field densityM Moisture contentWS Water sample
GR
AP
HIC
LO
G
CL
AS
SIF
ICA
TIO
N
CO
NS
IST
EN
CY
DE
NS
ITY
IND
EX
MATERIAL DESCRIPTION
SOIL NAME, plasticity or particle characteristics,colour, secondary and minor components,
moisture condition, consistency/relative density,
ROCK NAME, grain size, texture/fabric, colour,strength, weathering.
BH103
N
Y
Borehole
1 1
Hydraulic Rig
Ø90mm X 2.4m depth
NA
NA
NA
North West
10/11/15
GMT
Siltstone/Shale
10/11/15
RE
Grass
<2%
Universal Property Group Pty Ltd
Geotechnical Investigation
312 South Street, Marsden Park, NSW
End of borehole (TC-bit refusal).Terminated at 2.4m on inferred
medium strength siltstone.
- TOPSOIL
2.4
Silty CLAY - Low to medium plasticity,brown, with rootlets.
V Nil N MCL-CI
0.2
- RESIDUAL
CLAY - Medium to high plasticity,light grey/red.
V Nil N D
1.2
- WEATHERED ROCK
1.8
CLAY - Medium plasticity, red/brown.V Nil N M CI
SILTSTONE - Inferred low to mediumstrength, distinctly weathered.
TC Nil N D
- RESIDUAL
CI-CH
V-bit refusal at 1.8m.
A 0.2 /S/01
A
A
A
A
0.5 /S/01
1.0 /S/01
1.5 /S/01
2.0 /R/01
A 2.5 /R/01
VSt
VSt
H

Qualit
yS
he
etN
o.4
(C) Copyright Martens & Associates Pty. Ltd . 2015
Engineering Log -MARTENS & ASSOCIATES PTY LTDSuite 201, 20 george St, Hornsby, NSW 2077 Australia
Phone: (02) 9476 9999 Fax: (02) 9476 [email protected] WEB: http://www.martens.com.au
P1505038
1.0
2.0
3.0
4.0
1.0
2.0
3.0
4.0
4.54.5
martens
REFSheet of
SU
PP
OR
T
WA
TE
R
RESULTS ANDADDITIONAL OBSERVATIONS
EXCAVATION DATA
ME
TH
OD
MATERIAL DATA SAMPLING & TESTING
EXCAVATION LOG TO BE READ IN CONJUNCTION WITH ACCOMPANYING REPORT NOTES AND ABBREVIATIONS
MO
IST
UR
E
DE
PT
H(M
)
TY
PE
DE
PT
H(M
)
CLIENT
PROJECT NO.
PROJECT
SITE
DR
ILL
ING
RE
SIS
TA
NC
E
L M H R
EQUIPMENT
EXCAVATION DIMENSIONS
EASTING
NORTHING
RL SURFACE
ASPECT
COMMENCED
LOGGED
GEOLOGY
COMPLETED
CHECKED
VEGETATION
EQUIPMENT / METHODN Natural exposureX Existing excavationBH Backhoe bucketHA Hand augerS SpadeCC Concrete CorerV V-bitTC Tungsten Carbide BitPT Push tube
MOISTURED DryM MoistW WetWp Plastic limitWl Liquid limit
WATERN None observedX Not measured
Water level
Water outflow
Water inflow
SUPPORTSH ShoringSC ShotcreteRB Rock BoltsNil No support
CLASSIFICATIONSYMBOLS ANDSOIL DESCRIPTION
USCS
Agricultural
CONSISTENCYVS Very SoftS SoftF FirmSt StiffVSt Very StiffH HardF Friable
DENSITYVL Very LooseL LooseMD Medium DenseD DenseVD Very Dense
DRILLINGRESISTANCEL LowM ModerateH HighR Refusal
SLOPE
SAMPLING & TESTINGA Auger sampleB Bulk sampleU Undisturbed sampleD Disturbed sampleUx Tube sample (x mm)pp Pocket penetrometerSPT Standard penetration testCBR California Bearing Ratio
VS Vane shearDCP Dynamic cone
penetrometerFD Field densityM Moisture contentWS Water sample
GR
AP
HIC
LO
G
CL
AS
SIF
ICA
TIO
N
CO
NS
IST
EN
CY
DE
NS
ITY
IND
EX
MATERIAL DESCRIPTION
SOIL NAME, plasticity or particle characteristics,colour, secondary and minor components,
moisture condition, consistency/relative density,
ROCK NAME, grain size, texture/fabric, colour,strength, weathering.
BH104
A 2.0 /S/01
A 2.5 /S/01
N
Y
Borehole
1 1
Hydraulic Rig
Ø90mm X 2.5m depth
NA
NA
NA
North West
10/11/15
GMT
Siltstone/Shale
10/11/15
RE
Grass
<2%
Universal Property Group Pty Ltd
Geotechnical Investigation
312 South Street, Marsden Park, NSW
End of borehole (V-bit refusal). Terminated at 2.5mon inferred low to medium strength siltstone.
- TOPSOILSilty CLAY - Low to medium plasticity,
brown, with rootlets.V Nil N M
CL-CI
0.2
- RESIDUAL
CLAY - Medium to high plasticity,light grey/red.
V Nil N D
0.7
- WEATHERED ROCK
2.5
CLAY - Medium plasticity, red/brown.V Nil N M CI
- RESIDUAL
CI-CH
V-bit refusal at 2.5m.
A 0.2 /S/01
A
A
A
0.5 /S/01
1.0 /S/01
1.5 /S/01
VSt
H
St-VSt
F-St
F-St
H

Qualit
yS
he
etN
o.4
(C) Copyright Martens & Associates Pty. Ltd . 2015
Engineering Log -MARTENS & ASSOCIATES PTY LTDSuite 201, 20 george St, Hornsby, NSW 2077 Australia
Phone: (02) 9476 9999 Fax: (02) 9476 [email protected] WEB: http://www.martens.com.au
P1505038
1.0
2.0
3.0
4.0
1.0
2.0
3.0
4.0
4.54.5
martens
REFSheet of
SU
PP
OR
T
WA
TE
R
RESULTS ANDADDITIONAL OBSERVATIONS
EXCAVATION DATA
ME
TH
OD
MATERIAL DATA SAMPLING & TESTING
EXCAVATION LOG TO BE READ IN CONJUNCTION WITH ACCOMPANYING REPORT NOTES AND ABBREVIATIONS
MO
IST
UR
E
DE
PT
H(M
)
TY
PE
DE
PT
H(M
)
CLIENT
PROJECT NO.
PROJECT
SITE
DR
ILL
ING
RE
SIS
TA
NC
E
L M H R
EQUIPMENT
EXCAVATION DIMENSIONS
EASTING
NORTHING
RL SURFACE
ASPECT
COMMENCED
LOGGED
GEOLOGY
COMPLETED
CHECKED
VEGETATION
EQUIPMENT / METHODN Natural exposureX Existing excavationBH Backhoe bucketHA Hand augerS SpadeCC Concrete CorerV V-bitTC Tungsten Carbide BitPT Push tube
MOISTURED DryM MoistW WetWp Plastic limitWl Liquid limit
WATERN None observedX Not measured
Water level
Water outflow
Water inflow
SUPPORTSH ShoringSC ShotcreteRB Rock BoltsNil No support
CLASSIFICATIONSYMBOLS ANDSOIL DESCRIPTION
USCS
Agricultural
CONSISTENCYVS Very SoftS SoftF FirmSt StiffVSt Very StiffH HardF Friable
DENSITYVL Very LooseL LooseMD Medium DenseD DenseVD Very Dense
DRILLINGRESISTANCEL LowM ModerateH HighR Refusal
SLOPE
SAMPLING & TESTINGA Auger sampleB Bulk sampleU Undisturbed sampleD Disturbed sampleUx Tube sample (x mm)pp Pocket penetrometerSPT Standard penetration testCBR California Bearing Ratio
VS Vane shearDCP Dynamic cone
penetrometerFD Field densityM Moisture contentWS Water sample
GR
AP
HIC
LO
G
CL
AS
SIF
ICA
TIO
N
CO
NS
IST
EN
CY
DE
NS
ITY
IND
EX
MATERIAL DESCRIPTION
SOIL NAME, plasticity or particle characteristics,colour, secondary and minor components,
moisture condition, consistency/relative density,
ROCK NAME, grain size, texture/fabric, colour,strength, weathering.
BH105
A 2.0 /S/01
N
Y
Borehole
1 1
Hydraulic Rig
Ø90mm X 2.5m depth
NA
NA
NA
North
10/11/15
GMT
Siltstone/Shale
10/11/15
RE
Grass
<2%
Universal Property Group Pty Ltd
Geotechnical Investigation
312 South Street, Marsden Park, NSW
End of borehole. Terminated at 2.5mon inferred hard clay.
- TOPSOIL
CLAY - Medium to high plasticity,light grey/red.
V Nil N D
2.5
CLAY - Medium plasticity, red/brown.V Nil N M CI
- RESIDUAL
CI-CH
A 0.2 /S/01
A
A
A
0.5 /S/01
1.0 /S/01
1.5 /S/01
Silty CLAY - Low to medium plasticity,brown, with rootlets.
V Nil N MCL-CI0.1
- RESIDUAL
St-VSt
H
St
F-St

Qualit
yS
he
etN
o.4
(C) Copyright Martens & Associates Pty. Ltd . 2015
Engineering Log -MARTENS & ASSOCIATES PTY LTDSuite 201, 20 george St, Hornsby, NSW 2077 Australia
Phone: (02) 9476 9999 Fax: (02) 9476 [email protected] WEB: http://www.martens.com.au
P1505038
1.0
2.0
3.0
4.0
1.0
2.0
3.0
4.0
4.54.5
martens
REFSheet of
SU
PP
OR
T
WA
TE
R
RESULTS ANDADDITIONAL OBSERVATIONS
EXCAVATION DATA
ME
TH
OD
MATERIAL DATA SAMPLING & TESTING
EXCAVATION LOG TO BE READ IN CONJUNCTION WITH ACCOMPANYING REPORT NOTES AND ABBREVIATIONS
MO
IST
UR
E
DE
PT
H(M
)
TY
PE
DE
PT
H(M
)
CLIENT
PROJECT NO.
PROJECT
SITE
DR
ILL
ING
RE
SIS
TA
NC
E
L M H R
EQUIPMENT
EXCAVATION DIMENSIONS
EASTING
NORTHING
RL SURFACE
ASPECT
COMMENCED
LOGGED
GEOLOGY
COMPLETED
CHECKED
VEGETATION
EQUIPMENT / METHODN Natural exposureX Existing excavationBH Backhoe bucketHA Hand augerS SpadeCC Concrete CorerV V-bitTC Tungsten Carbide BitPT Push tube
MOISTURED DryM MoistW WetWp Plastic limitWl Liquid limit
WATERN None observedX Not measured
Water level
Water outflow
Water inflow
SUPPORTSH ShoringSC ShotcreteRB Rock BoltsNil No support
CLASSIFICATIONSYMBOLS ANDSOIL DESCRIPTION
USCS
Agricultural
CONSISTENCYVS Very SoftS SoftF FirmSt StiffVSt Very StiffH HardF Friable
DENSITYVL Very LooseL LooseMD Medium DenseD DenseVD Very Dense
DRILLINGRESISTANCEL LowM ModerateH HighR Refusal
SLOPE
SAMPLING & TESTINGA Auger sampleB Bulk sampleU Undisturbed sampleD Disturbed sampleUx Tube sample (x mm)pp Pocket penetrometerSPT Standard penetration testCBR California Bearing Ratio
VS Vane shearDCP Dynamic cone
penetrometerFD Field densityM Moisture contentWS Water sample
GR
AP
HIC
LO
G
CL
AS
SIF
ICA
TIO
N
CO
NS
IST
EN
CY
DE
NS
ITY
IND
EX
MATERIAL DESCRIPTION
SOIL NAME, plasticity or particle characteristics,colour, secondary and minor components,
moisture condition, consistency/relative density,
ROCK NAME, grain size, texture/fabric, colour,strength, weathering.
BH106
A 2.0 /S/01
A 2.5 /S/01
N
Y
Borehole
1 1
Hydraulic Rig
Ø90mm X 2.7m depth
NA
NA
NA
North
10/11/15
GMT
Siltstone/Shale
10/11/15
RE
Grass
<2%
Universal Property Group Pty Ltd
Geotechnical Investigation
312 South Street, Marsden Park, NSW
End of borehole (V-bit refusal). Terminated at 2.7mon inferred low to medium strength siltstone.
- TOPSOIL
Silty CLAY - Low to medium plasticity,brown, with rootlets.
V Nil N MCL-CI
0.25
- RESIDUAL
CLAY - Medium to high plasticity,light grey/red.
V Nil N D
1.5
2.7
CLAY - Medium plasticity, red/brown.V Nil N M CI
- RESIDUAL
CI-CH
V-bit refusal at 2.7m.
A 0.2 /S/01
A
A
A
0.5 /S/01
1.0 /S/01
1.5 /S/01
VSt
St-VSt
VSt

Qualit
yS
he
etN
o.4
(C) Copyright Martens & Associates Pty. Ltd . 2015
Engineering Log -MARTENS & ASSOCIATES PTY LTDSuite 201, 20 george St, Hornsby, NSW 2077 Australia
Phone: (02) 9476 9999 Fax: (02) 9476 [email protected] WEB: http://www.martens.com.au
P1505038
1.0
2.0
3.0
4.0
1.0
2.0
3.0
4.0
4.54.5
martens
REFSheet of
SU
PP
OR
T
WA
TE
R
RESULTS ANDADDITIONAL OBSERVATIONS
EXCAVATION DATA
ME
TH
OD
MATERIAL DATA SAMPLING & TESTING
EXCAVATION LOG TO BE READ IN CONJUNCTION WITH ACCOMPANYING REPORT NOTES AND ABBREVIATIONS
MO
IST
UR
E
DE
PT
H(M
)
TY
PE
DE
PT
H(M
)
CLIENT
PROJECT NO.
PROJECT
SITE
DR
ILL
ING
RE
SIS
TA
NC
E
L M H R
EQUIPMENT
EXCAVATION DIMENSIONS
EASTING
NORTHING
RL SURFACE
ASPECT
COMMENCED
LOGGED
GEOLOGY
COMPLETED
CHECKED
VEGETATION
EQUIPMENT / METHODN Natural exposureX Existing excavationBH Backhoe bucketHA Hand augerS SpadeCC Concrete CorerV V-bitTC Tungsten Carbide BitPT Push tube
MOISTURED DryM MoistW WetWp Plastic limitWl Liquid limit
WATERN None observedX Not measured
Water level
Water outflow
Water inflow
SUPPORTSH ShoringSC ShotcreteRB Rock BoltsNil No support
CLASSIFICATIONSYMBOLS ANDSOIL DESCRIPTION
USCS
Agricultural
CONSISTENCYVS Very SoftS SoftF FirmSt StiffVSt Very StiffH HardF Friable
DENSITYVL Very LooseL LooseMD Medium DenseD DenseVD Very Dense
DRILLINGRESISTANCEL LowM ModerateH HighR Refusal
SLOPE
SAMPLING & TESTINGA Auger sampleB Bulk sampleU Undisturbed sampleD Disturbed sampleUx Tube sample (x mm)pp Pocket penetrometerSPT Standard penetration testCBR California Bearing Ratio
VS Vane shearDCP Dynamic cone
penetrometerFD Field densityM Moisture contentWS Water sample
GR
AP
HIC
LO
G
CL
AS
SIF
ICA
TIO
N
CO
NS
IST
EN
CY
DE
NS
ITY
IND
EX
MATERIAL DESCRIPTION
SOIL NAME, plasticity or particle characteristics,colour, secondary and minor components,
moisture condition, consistency/relative density,
ROCK NAME, grain size, texture/fabric, colour,strength, weathering.
BH107
A 2.0 /S/01
N
Y
Borehole
1 1
Hydraulic Rig
Ø90mm X 2.6m depth
NA
NA
NA
East
10/11/15
GMT
Siltstone/Shale
10/11/15
RE
Grass
<2%
Universal Property Group Pty Ltd
Geotechnical Investigation
312 South Street, Marsden Park, NSW
End of borehole (V-bit refusal). Terminated at2.6m on inferred low strength siltstone.
- TOPSOIL
Silty CLAY - Low to medium plasticity,brown.
V Nil N MCL-CI
0.35
- RESIDUAL
CLAY - Medium to high plasticity,light grey/red.
V Nil N D
1.5
2.6
CLAY - Medium plasticity, red/brown.V Nil N M CI
- RESIDUAL
CI-CH
V-bit refusal at 2.6m.
A 0.2 /S/01
A
A
A
0.5 /S/01
1.0 /S/01
1.5 /S/01
F-St
VSt
VSt-H

Qualit
yS
he
etN
o.4
(C) Copyright Martens & Associates Pty. Ltd . 2015
Engineering Log -MARTENS & ASSOCIATES PTY LTDSuite 201, 20 george St, Hornsby, NSW 2077 Australia
Phone: (02) 9476 9999 Fax: (02) 9476 [email protected] WEB: http://www.martens.com.au
P1505038
1.0
2.0
3.0
4.0
1.0
2.0
3.0
4.0
4.54.5
martens
REFSheet of
SU
PP
OR
T
WA
TE
R
RESULTS ANDADDITIONAL OBSERVATIONS
EXCAVATION DATA
ME
TH
OD
MATERIAL DATA SAMPLING & TESTING
EXCAVATION LOG TO BE READ IN CONJUNCTION WITH ACCOMPANYING REPORT NOTES AND ABBREVIATIONS
MO
IST
UR
E
DE
PT
H(M
)
TY
PE
DE
PT
H(M
)
CLIENT
PROJECT NO.
PROJECT
SITE
DR
ILL
ING
RE
SIS
TA
NC
E
L M H R
EQUIPMENT
EXCAVATION DIMENSIONS
EASTING
NORTHING
RL SURFACE
ASPECT
COMMENCED
LOGGED
GEOLOGY
COMPLETED
CHECKED
VEGETATION
EQUIPMENT / METHODN Natural exposureX Existing excavationBH Backhoe bucketHA Hand augerS SpadeCC Concrete CorerV V-bitTC Tungsten Carbide BitPT Push tube
MOISTURED DryM MoistW WetWp Plastic limitWl Liquid limit
WATERN None observedX Not measured
Water level
Water outflow
Water inflow
SUPPORTSH ShoringSC ShotcreteRB Rock BoltsNil No support
CLASSIFICATIONSYMBOLS ANDSOIL DESCRIPTION
USCS
Agricultural
CONSISTENCYVS Very SoftS SoftF FirmSt StiffVSt Very StiffH HardF Friable
DENSITYVL Very LooseL LooseMD Medium DenseD DenseVD Very Dense
DRILLINGRESISTANCEL LowM ModerateH HighR Refusal
SLOPE
SAMPLING & TESTINGA Auger sampleB Bulk sampleU Undisturbed sampleD Disturbed sampleUx Tube sample (x mm)pp Pocket penetrometerSPT Standard penetration testCBR California Bearing Ratio
VS Vane shearDCP Dynamic cone
penetrometerFD Field densityM Moisture contentWS Water sample
GR
AP
HIC
LO
G
CL
AS
SIF
ICA
TIO
N
CO
NS
IST
EN
CY
DE
NS
ITY
IND
EX
MATERIAL DESCRIPTION
SOIL NAME, plasticity or particle characteristics,colour, secondary and minor components,
moisture condition, consistency/relative density,
ROCK NAME, grain size, texture/fabric, colour,strength, weathering.
BH108
N
Y
Borehole
1 1
Hydraulic Rig
Ø90mm X 2.5m depth
NA
NA
NA
East
10/11/15
GMT
Siltstone/Shale
10/11/15
RE
Grass
<2%
Universal Property Group Pty Ltd
Geotechnical Investigation
312 South Street, Marsden Park, NSW
End of borehole (TC-bit refusal). Terminated at2.5m on inferred low to medium strength
siltstone.
- TOPSOIL
2.5
Silty CLAY - Low to medium plasticity,brown, with rootlets.
V Nil N MCL-CI
0.3
- RESIDUAL
CLAY - Medium to high plasticity,light grey/red.
V Nil N D
0.8
- WEATHERED ROCK
1.7
CLAY - Medium plasticity, red/brown.V Nil N M CI
SILTSTONE - Inferred low to mediumstrength, distinctly weathered.
TC Nil N D
- RESIDUAL
CI-CH
V-bit refusal at 1.7m.
A 0.2 /S/01
A
A
A
A
0.5 /S/01
1.0 /S/01
1.5 /S/01
2.0 /R/01
F-St
St
St-VSt
H

Qualit
yS
he
etN
o.4
(C) Copyright Martens & Associates Pty. Ltd . 2015
Engineering Log -MARTENS & ASSOCIATES PTY LTDSuite 201, 20 george St, Hornsby, NSW 2077 Australia
Phone: (02) 9476 9999 Fax: (02) 9476 [email protected] WEB: http://www.martens.com.au
P1505038
1.0
2.0
3.0
4.0
1.0
2.0
3.0
4.0
4.54.5
martens
REFSheet of
SU
PP
OR
T
WA
TE
R
RESULTS ANDADDITIONAL OBSERVATIONS
EXCAVATION DATA
ME
TH
OD
MATERIAL DATA SAMPLING & TESTING
EXCAVATION LOG TO BE READ IN CONJUNCTION WITH ACCOMPANYING REPORT NOTES AND ABBREVIATIONS
MO
IST
UR
E
DE
PT
H(M
)
TY
PE
DE
PT
H(M
)
CLIENT
PROJECT NO.
PROJECT
SITE
DR
ILL
ING
RE
SIS
TA
NC
E
L M H R
EQUIPMENT
EXCAVATION DIMENSIONS
EASTING
NORTHING
RL SURFACE
ASPECT
COMMENCED
LOGGED
GEOLOGY
COMPLETED
CHECKED
VEGETATION
EQUIPMENT / METHODN Natural exposureX Existing excavationBH Backhoe bucketHA Hand augerS SpadeCC Concrete CorerV V-bitTC Tungsten Carbide BitPT Push tube
MOISTURED DryM MoistW WetWp Plastic limitWl Liquid limit
WATERN None observedX Not measured
Water level
Water outflow
Water inflow
SUPPORTSH ShoringSC ShotcreteRB Rock BoltsNil No support
CLASSIFICATIONSYMBOLS ANDSOIL DESCRIPTION
USCS
Agricultural
CONSISTENCYVS Very SoftS SoftF FirmSt StiffVSt Very StiffH HardF Friable
DENSITYVL Very LooseL LooseMD Medium DenseD DenseVD Very Dense
DRILLINGRESISTANCEL LowM ModerateH HighR Refusal
SLOPE
SAMPLING & TESTINGA Auger sampleB Bulk sampleU Undisturbed sampleD Disturbed sampleUx Tube sample (x mm)pp Pocket penetrometerSPT Standard penetration testCBR California Bearing Ratio
VS Vane shearDCP Dynamic cone
penetrometerFD Field densityM Moisture contentWS Water sample
GR
AP
HIC
LO
G
CL
AS
SIF
ICA
TIO
N
CO
NS
IST
EN
CY
DE
NS
ITY
IND
EX
MATERIAL DESCRIPTION
SOIL NAME, plasticity or particle characteristics,colour, secondary and minor components,
moisture condition, consistency/relative density,
ROCK NAME, grain size, texture/fabric, colour,strength, weathering.
BH109
A 2.0 /S/01
N
Y
Borehole
1 1
Hydraulic Rig
Ø90mm X 2.5m depth
NA
NA
NA
East
10/11/15
GMT
Siltstone/Shale
10/11/15
RE
Grass
<2%
Universal Property Group Pty Ltd
Geotechnical Investigation
312 South Street, Marsden Park, NSW
End of borehole. Terminated at 2.5mon hard clay.
- TOPSOIL
Silty CLAY - Low to medium plasticity,brown, with rootlets.
V Nil N MCL-CI
0.25
- RESIDUAL
CLAY - Medium to high plasticity,light grey/red.
V Nil N D
1.5
2.5
CLAY - Medium plasticity, red/brown.V Nil N M CI
- RESIDUAL
CI-CH
A 0.2 /S/01
A
A
A
0.5 /S/01
1.0 /S/01
1.5 /S/01
1.35
St
St-VSt
H
VSt

Qualit
yS
he
etN
o.4
(C) Copyright Martens & Associates Pty. Ltd . 2015
Engineering Log -MARTENS & ASSOCIATES PTY LTDSuite 201, 20 george St, Hornsby, NSW 2077 Australia
Phone: (02) 9476 9999 Fax: (02) 9476 [email protected] WEB: http://www.martens.com.au
P1505038
1.0
2.0
3.0
4.0
1.0
2.0
3.0
4.0
4.54.5
martens
REFSheet of
SU
PP
OR
T
WA
TE
R
RESULTS ANDADDITIONAL OBSERVATIONS
EXCAVATION DATA
ME
TH
OD
MATERIAL DATA SAMPLING & TESTING
EXCAVATION LOG TO BE READ IN CONJUNCTION WITH ACCOMPANYING REPORT NOTES AND ABBREVIATIONS
MO
IST
UR
E
DE
PT
H(M
)
TY
PE
DE
PT
H(M
)
CLIENT
PROJECT NO.
PROJECT
SITE
DR
ILL
ING
RE
SIS
TA
NC
E
L M H R
EQUIPMENT
EXCAVATION DIMENSIONS
EASTING
NORTHING
RL SURFACE
ASPECT
COMMENCED
LOGGED
GEOLOGY
COMPLETED
CHECKED
VEGETATION
EQUIPMENT / METHODN Natural exposureX Existing excavationBH Backhoe bucketHA Hand augerS SpadeCC Concrete CorerV V-bitTC Tungsten Carbide BitPT Push tube
MOISTURED DryM MoistW WetWp Plastic limitWl Liquid limit
WATERN None observedX Not measured
Water level
Water outflow
Water inflow
SUPPORTSH ShoringSC ShotcreteRB Rock BoltsNil No support
CLASSIFICATIONSYMBOLS ANDSOIL DESCRIPTION
USCS
Agricultural
CONSISTENCYVS Very SoftS SoftF FirmSt StiffVSt Very StiffH HardF Friable
DENSITYVL Very LooseL LooseMD Medium DenseD DenseVD Very Dense
DRILLINGRESISTANCEL LowM ModerateH HighR Refusal
SLOPE
SAMPLING & TESTINGA Auger sampleB Bulk sampleU Undisturbed sampleD Disturbed sampleUx Tube sample (x mm)pp Pocket penetrometerSPT Standard penetration testCBR California Bearing Ratio
VS Vane shearDCP Dynamic cone
penetrometerFD Field densityM Moisture contentWS Water sample
GR
AP
HIC
LO
G
CL
AS
SIF
ICA
TIO
N
CO
NS
IST
EN
CY
DE
NS
ITY
IND
EX
MATERIAL DESCRIPTION
SOIL NAME, plasticity or particle characteristics,colour, secondary and minor components,
moisture condition, consistency/relative density,
ROCK NAME, grain size, texture/fabric, colour,strength, weathering.
BH110
N
Y
Borehole
1 1
Hydraulic Rig
Ø90mm X 2.5m depth
NA
NA
NA
East
10/11/15
GMT
Siltstone/Shale
10/11/15
RE
Grass
<2%
Universal Property Group Pty Ltd
Geotechnical Investigation
312 South Street, Marsden Park, NSW
End of borehole. Terminated at 2.5m on inferredlow to medium strength siltstone.
- TOPSOIL
2.5
CLAY - Medium to high plasticity,light grey/red.
V Nil N D
0.6
- WEATHERED ROCK
1.1
CLAY - Medium plasticity, red/brown.V Nil N M CI
SILTSTONE - Inferred low to mediumstrength, distinctly weathered.
TC Nil N D
- RESIDUAL
CI-CH
V-bit refusal at 1.1m.
A 0.2 /S/01
A
A
A
A
0.5 /S/01
1.0 /S/01
1.5 /S/01
2.0 /R/01
Fill: Silty CLAY - Low to medium plasticity,brown, with rootlets.
V Nil N MCL-CI0.1
- RESIDUAL
VSt
VSt
St-VSt
H
St-VSt

martensPreliminary Salinity and Geotechnical Assessment:
312 South Street, Marsden Park, NSW.P1505038JR02V01 – December 2015
Page 40
Attachment C - DCP ‘N’ Counts

Dynamic Cone Penetrometer Test Log Summary
Depth Interval
(m)DCP101 DCP102 DCP103 DCP104 DCP105 DCP106 DCP107 DCP108 DCP109 DCP110
0.15 13 15 12 16 5 8 5 3 5 11
0.30 5 12 10 16 2 10 8 4 8 10
0.45 3 8 7 23 5 12 17 9 10 9
0.60 2 9 5 20 6 9 24 5 10 9
0.75 2 6 5 8 10 6 12 4 4 6
0.90 8 5 3 4 14 6 10 4 6 8
1.05 16 7 5 2 22 6 9 3 4 5
1.20 19 7 15 9 27 8 13 6 5 Bounce @ 1.20 m
1.35 26 7 5 / 50 mm 9 Bounce @ 1.35 m 10 12 12 7
1.50 21 9 Bounce @ 1.40 m 8 12 12 10 / 50 mm 11
1.65 25 6 / 50 mm 10 13 16 Bounce @ 1.40 m 17
1.80 Bounce @ 1.65 m Bounce @ 1.55 m 12 14 16 30
1.95 14 15 18 35
2.10 Bounce @ 2.10 m 19 16 Terminated @ 1.95 m
2.25 23 22
2.40 14 Bounce @ 2.40 m
2.55 16
2.70 Bounce @ 2.70 m
2.85
3.00
3.15
3.30
3.45
3.60
3.75
3.90
4.05
4.20
4.35
4.50
4.65
4.80
4.95
5.10
5.25
5.40
5.55
5.70
5.85
6.00
6.15
6.30
6.45
6.60
6.75
6.90
7.05
7.20
7.35
7.50
7.65
7.80
7.95
8.10
8.25
8.40
Comments
Logged by GMT
Checked by
Site 312 South Street, Marsden Park, NSW DCP Group Reference
TEST DATA
RE
P1505038JS01V01
Client Universal Property Group Pty Ltd Log Date 10.11.2015
Suite 201, 20 George Street, Hornsby, NSW 2077 Ph: (02) 9476 9999 Fax: (02) 9476 8767, [email protected], www.martens.com.au
martensconsulting engineers since 1989

martensPreliminary Salinity and Geotechnical Assessment:
312 South Street, Marsden Park, NSW.P1505038JR02V01 – December 2015
Page 42
Attachment D - Envirolab Laboratory Results

CERTIFICATE OF ANALYSIS 137265
Client:
Martens & Associates Pty Ltd
Suite 201, 20 George St
Hornsby
NSW 2077
Attention: Grant Taylor
Sample log in details:
Your Reference: P1505038, 312 South St, Marsden Park
No. of samples: 24 Soils
Date samples received / completed instructions received 11/11/15 / 11/11/15
Analysis Details:
Please refer to the following pages for results, methodology summary and quality control data.
Samples were analysed as received from the client. Results relate specifically to the samples as received.
Results are reported on a dry weight basis for solids and on an as received basis for other matrices.
Please refer to the last page of this report for any comments relating to the results.
Report Details:
Date results requested by: / Issue Date: 18/11/15 / 16/11/15
Date of Preliminary Report: Not Issued
NATA accreditation number 2901. This document shall not be reproduced except in full.
Accredited for compliance with ISO/IEC 17025. Tests not covered by NATA are denoted with *.
Results Approved By:
Page 1 of 7Envirolab Reference: 137265
Revision No: R 00

Client Reference: P1505038, 312 South St, Marsden Park
Misc Inorg - Soil
Our Reference: UNITS 137265-1 137265-2 137265-3 137265-4 137265-5
Your Reference ------------- 5038 / 101 /
0.2 /S/01
5038 / 101 /
0.5 /S/01
5038 / 101 /
1.0 /S/01
5038 / 102
/0.5 /S/01
5038 / 102
/1.5 /S/01
Date Sampled ------------ 10/11/2015 10/11/2015 10/11/2015 10/11/2015 10/11/2015
Type of sample Soil Soil Soil Soil Soil
Date prepared - 12/11/2015 12/11/2015 12/11/2015 12/11/2015 12/11/2015
Date analysed - 12/11/2015 12/11/2015 12/11/2015 12/11/2015 12/11/2015
pH 1:5 soil:water pH Units 5.8 5.4 4.9 4.7 4.7
Electrical Conductivity 1:5 soil:water µS/cm 65 120 690 740 890
Sulphate, SO4 1:5 soil:water mg/kg 24 120 180 330 320
Misc Inorg - Soil
Our Reference: UNITS 137265-6 137265-7 137265-8 137265-9 137265-10
Your Reference ------------- 5038 / 103
/0.2 /S/01
5038 / 103
/0.5 /S/01
5038 / 103
/1.5 /S/01
5038 / 104
/0.2 /S/01
5038 / 104
/0.5 /S/01
Date Sampled ------------ 10/11/2015 10/11/2015 10/11/2015 10/11/2015 10/11/2015
Type of sample Soil Soil Soil Soil Soil
Date prepared - 12/11/2015 12/11/2015 12/11/2015 12/11/2015 12/11/2015
Date analysed - 12/11/2015 12/11/2015 12/11/2015 12/11/2015 12/11/2015
pH 1:5 soil:water pH Units 6.1 5.2 4.8 5.6 5.9
Electrical Conductivity 1:5 soil:water µS/cm 83 320 1,100 120 87
Sulphate, SO4 1:5 soil:water mg/kg 38 210 250 110 47
Misc Inorg - Soil
Our Reference: UNITS 137265-11 137265-12 137265-13 137265-14 137265-15
Your Reference ------------- 5038 / 105
/0.5 /S/01
5038 / 105
/2.0 /S/01
5038 / 106
/0.2 /S/01
5038 / 106
/0.5 /S/01
5038 / 106
/1.5 /S/01
Date Sampled ------------ 10/11/2015 10/11/2015 10/11/2015 10/11/2015 10/11/2015
Type of sample Soil Soil Soil Soil Soil
Date prepared - 12/11/2015 12/11/2015 12/11/2015 12/11/2015 12/11/2015
Date analysed - 12/11/2015 12/11/2015 12/11/2015 12/11/2015 12/11/2015
pH 1:5 soil:water pH Units 5.0 4.9 5.7 5.5 4.9
Electrical Conductivity 1:5 soil:water µS/cm 1,500 740 160 240 860
Sulphate, SO4 1:5 soil:water mg/kg 1,300 410 82 170 340
Misc Inorg - Soil
Our Reference: UNITS 137265-16 137265-17 137265-18 137265-19 137265-20
Your Reference ------------- 5038 / 107
/0.2 /S/01
5038 / 107
/0.5 /S/01
5038 / 107
/1.5 /S/01
5038 / 108
/0.2 /S/01
5038 / 108
/1.0 /S/01
Date Sampled ------------ 10/11/2015 10/11/2015 10/11/2015 10/11/2015 10/11/2015
Type of sample Soil Soil Soil Soil Soil
Date prepared - 12/11/2015 12/11/2015 12/11/2015 12/11/2015 12/11/2015
Date analysed - 12/11/2015 12/11/2015 12/11/2015 12/11/2015 12/11/2015
pH 1:5 soil:water pH Units 6.4 6.4 5.5 6.4 4.9
Electrical Conductivity 1:5 soil:water µS/cm 210 250 1,000 140 970
Sulphate, SO4 1:5 soil:water mg/kg 79 100 480 35 830
Page 2 of 7Envirolab Reference: 137265
Revision No: R 00

Client Reference: P1505038, 312 South St, Marsden Park
Misc Inorg - Soil
Our Reference: UNITS 137265-21 137265-22 137265-23 137265-24
Your Reference ------------- 5038 / 109
/0.2 /S/01
5038 / 109
/1.0 /S/01
5038 / 110
/0.2 /S/01
5038 / 110
/1.0 /S/01
Date Sampled ------------ 10/11/2015 10/11/2015 10/11/2015 10/11/2015
Type of sample Soil Soil Soil Soil
Date prepared - 12/11/2015 12/11/2015 12/11/2015 12/11/2015
Date analysed - 12/11/2015 12/11/2015 12/11/2015 12/11/2015
pH 1:5 soil:water pH Units 6.5 5.0 5.8 5.1
Electrical Conductivity 1:5 soil:water µS/cm 770 1,300 93 1,000
Sulphate, SO4 1:5 soil:water mg/kg 370 630 78 650
Page 3 of 7Envirolab Reference: 137265
Revision No: R 00

Client Reference: P1505038, 312 South St, Marsden Park
Method ID Methodology Summary
Inorg-001 pH - Measured using pH meter and electrode in accordance with APHA latest edition, 4500-H+. Please note
that the results for water analyses are indicative only, as analysis outside of the APHA storage times.
Inorg-002 Conductivity and Salinity - measured using a conductivity cell at 25oC in accordance with APHA latest edition
2510 and Rayment & Lyons.
Inorg-081 Anions - a range of Anions are determined by Ion Chromatography, in accordance with APHA latest edition,
4110-B.
Page 4 of 7Envirolab Reference: 137265
Revision No: R 00

Client Reference: P1505038, 312 South St, Marsden Park
QUALITY CONTROL UNITS PQL METHOD Blank Duplicate
Sm#
Duplicate results Spike Sm# Spike %
Recovery
Misc Inorg - Soil Base ll Duplicate ll %RPD
Date prepared - 12/11/2
015
137265-1 12/11/2015 || 12/11/2015 LCS-1 12/11/2015
Date analysed - 12/11/2
015
137265-1 12/11/2015 || 12/11/2015 LCS-1 12/11/2015
pH 1:5 soil:water pH Units Inorg-001 [NT] 137265-1 5.8 || 5.6 || RPD: 4 LCS-1 101%
Electrical Conductivity
1:5 soil:water
µS/cm 1 Inorg-002 <1 137265-1 65 || 70 || RPD: 7 LCS-1 91%
Sulphate, SO4 1:5
soil:water
mg/kg 10 Inorg-081 <10 137265-1 24 || 25 || RPD: 4 LCS-1 99%
QUALITY CONTROL UNITS Dup. Sm# Duplicate Spike Sm# Spike % Recovery
Misc Inorg - Soil Base + Duplicate + %RPD
Date prepared - 137265-11 12/11/2015 || 12/11/2015 137265-2 12/11/2015
Date analysed - 137265-11 12/11/2015 || 12/11/2015 137265-2 12/11/2015
pH 1:5 soil:water pH Units 137265-11 5.0 || 5.0 || RPD: 0 [NR] [NR]
Electrical Conductivity 1:5
soil:water
µS/cm 137265-11 1500 || 1500 || RPD: 0 [NR] [NR]
Sulphate, SO4 1:5
soil:water
mg/kg 137265-11 1300 || 1200 || RPD: 8 137265-2 70%
QUALITY CONTROL UNITS Dup. Sm# Duplicate
Misc Inorg - Soil Base + Duplicate + %RPD
Date prepared - 137265-24 12/11/2015 || 12/11/2015
Date analysed - 137265-24 12/11/2015 || 12/11/2015
pH 1:5 soil:water pH Units 137265-24 5.1 || 5.1 || RPD: 0
Electrical Conductivity 1:5
soil:water
µS/cm 137265-24 1000 || 970 || RPD: 3
Sulphate, SO4 1:5
soil:water
mg/kg 137265-24 650 || 630 || RPD: 3
Page 5 of 7Envirolab Reference: 137265
Revision No: R 00

Client Reference: P1505038, 312 South St, Marsden Park
Report Comments:
Asbestos ID was analysed by Approved Identifier: Not applicable for this job
Asbestos ID was authorised by Approved Signatory: Not applicable for this job
INS: Insufficient sample for this test PQL: Practical Quantitation Limit NT: Not tested
NR: Test not required RPD: Relative Percent Difference NA: Test not required
<: Less than >: Greater than LCS: Laboratory Control Sample
Page 6 of 7Envirolab Reference: 137265
Revision No: R 00

Client Reference: P1505038, 312 South St, Marsden Park
Quality Control Definitions
Blank: This is the component of the analytical signal which is not derived from the sample but from reagents,
glassware etc, can be determined by processing solvents and reagents in exactly the same manner as for samples.
Duplicate : This is the complete duplicate analysis of a sample from the process batch. If possible, the sample
selected should be one where the analyte concentration is easily measurable.
Matrix Spike : A portion of the sample is spiked with a known concentration of target analyte. The purpose of the matrix
spike is to monitor the performance of the analytical method used and to determine whether matrix interferences exist.
LCS (Laboratory Control Sample) : This comprises either a standard reference material or a control matrix (such as a blank
sand or water) fortified with analytes representative of the analyte class. It is simply a check sample.
Surrogate Spike: Surrogates are known additions to each sample, blank, matrix spike and LCS in a batch, of compounds
which are similar to the analyte of interest, however are not expected to be found in real samples.
Laboratory Acceptance Criteria
Duplicate sample and matrix spike recoveries may not be reported on smaller jobs, however, were analysed at a frequency
to meet or exceed NEPM requirements. All samples are tested in batches of 20. The duplicate sample RPD and matrix
spike recoveries for the batch were within the laboratory acceptance criteria.
Filters, swabs, wipes, tubes and badges will not have duplicate data as the whole sample is generally extracted
during sample extraction.
Spikes for Physical and Aggregate Tests are not applicable.
For VOCs in water samples, three vials are required for duplicate or spike analysis.
Duplicates: <5xPQL - any RPD is acceptable; >5xPQL - 0-50% RPD is acceptable.
Matrix Spikes, LCS and Surrogate recoveries: Generally 70-130% for inorganics/metals; 60-140%
for organics (+/-50% surrogates) and 10-140% for labile SVOCs (including labile surrogates), ultra trace organics
and speciated phenols is acceptable.
In circumstances where no duplicate and/or sample spike has been reported at 1 in 10 and/or 1 in 20 samples
respectively, the sample volume submitted was insufficient in order to satisfy laboratory QA/QC protocols.
When samples are received where certain analytes are outside of recommended technical holding times (THTs),
the analysis has proceeded. Where analytes are on the verge of breaching THTs, every effort will be made to analyse
within the THT or as soon as practicable.
Where sampling dates are not provided, Envirolab are not in a position to comment on the validity
of the analysis where recommended technical holding times may have been breached.
Page 7 of 7Envirolab Reference: 137265
Revision No: R 00

martensPreliminary Salinity and Geotechnical Assessment:
312 South Street, Marsden Park, NSW.P1505038JR02V01 – December 2015
Page 50
Attachment E - CBR Test Results

ABN: 25 131 532 020
Sydney: 12/1 Boden Road Seven Hills NSW 2147 | PO Box 45 Pendle Hill NSW 2145
Ph: (02) 9674 7711 | Fax: (02) 9674 7755 | Email: [email protected]
Customer: Job number: 15-0099
Project: P1505038 Report number: 1
Location: Page: 1 of 1
Sampling method: Samples tested as received Test method(s):
7454 7455
5038/CBR1 5038/CBR2 #N/A #N/A
10/11/2015 10/11/2015 #N/A #N/A
SILTY CLAY, trace
of sand and
gravel, brown
mottled orange-
brown/red-brown
CLAY, with silt,
trace of gravel,
mottled pale
grey/grey/orange-
brown/red-brown
#N/A #N/A
1.63 1.68
20.1 19.8
n/a n/a
0 0
N N
1.60 1.65
1.59 1.62
20.2 19.9
22.5 22.2
22.5 24.9
21.5 20.9
98.0 98.0
100.5 100.5
4 4
Standard Standard
4.5 4.5
0.5 1.5
2.5 2.5
12 4.0
Approved Signatory: C. Greely Date: 25/11/2015
Accredited for compliance with ISO/IEC 17025. NATA Accredited Laboratory Number: 17062
R20.v7/ 1 of 1
Notes: Specified LDR: 98 ±1%
AS 1289.1.1, 2.1.1, 5.1.1, 6.1.1
CBR Value (%)
Compactive effort
Swell after soaking (%)
Penetration (mm)
Dry density after soak (t/m3)
Period of soaking (days)
Mass of surcharge applied (kg)
Density ratio before soaking (%)
Moisture ratio before soaking (%)
Moisture content after soak (%)
Moisture content after test - remaining depth (%)
Moisture content after test - top 30mm (%)
Moisture content before soak (%)
Test Report
California Bearing Ratio
Material description
Dry density before soak (t/m3)
Laboratory sample no.
Maximum dry density (t/m3)
Optimum moisture content (%)
Oversize retained on 19.0mm sieve (%)
Field moisture content (%)
Oversize included (Y/N)
Customer sample no.
Date sampled
Results
Martens & Associates Pty Ltd
312 South Street, Marsden Park, NSW

martensPreliminary Salinity and Geotechnical Assessment:
312 South Street, Marsden Park, NSW.P1505038JR02V01 – December 2015
Page 52
Attachment F - CSIRO Sheet BTF 18

Foundation Maintenance and Footing Performance:A Homeowner’s GuideBuildings can and often do move. This movement can be up, down, lateral or rotational. The fundamental cause of movement in buildings can usually be related to one or more problems in the foundation soil. It is important for the homeowner to identify the soil type in order to ascertain the measures that should be put in place in order to ensure that problems in the foundation soil can be prevented, thus protecting against building movement.
This Building Technology File is designed to identify causes of soil-related building movement, and to suggest methods of prevention of resultant cracking in buildings.
Soil Types The types of soils usually present under the topsoil in land zoned for residential buildings can be split into two approximate groups – granular and clay. Quite often, foundation soil is a mixture of both types. The general problems associated with soils having granular content are usually caused by erosion. Clay soils are subject to saturation and swell/shrink problems.Classifications for a given area can generally be obtained by application to the local authority, but these are sometimes unreliable and if there is doubt, a geotechnical report should be commissioned. As most buildings suffering movement problems are founded on clay soils, there is an emphasis on classification of soils according to the amount of swell and shrinkage they experience with variations of water content. The table below is Table 2.1 from AS 2870-2011, the Residential Slab and Footing Code.
Causes of Movement
Settlement due to construction There are two types of settlement that occur as a result of construction: • Immediate settlement occurs when a building is first placed
on its foundation soil, as a result of compaction of the soil under the weight of the structure. The cohesive quality of clay soil mitigates against this, but granular (particularly sandy) soil is susceptible.
• Consolidation settlement is a feature of clay soil and may take place because of the expulsion of moisture from the soil or because of the soil’s lack of resistance to local compressive or shear stresses. This will usually take place during the first few months after construction, but has been known to take many years in exceptional cases.
These problems are the province of the builder and should be taken into consideration as part of the preparation of the site for construction. Building Technology File 19 (BTF 19) deals with these problems.
ErosionAll soils are prone to erosion, but sandy soil is particularly susceptible to being washed away. Even clay with a sand component of say 10% or more can suffer from erosion.
SaturationThis is particularly a problem in clay soils. Saturation creates a bog- like suspension of the soil that causes it to lose virtually all of its bearing capacity. To a lesser degree, sand is affected by saturation because saturated sand may undergo a reduction in volume, particularly imported sand fill for bedding and blinding layers. However, this usually occurs as immediate settlement and should normally be the province of the builder.
Seasonal swelling and shrinkage of soil All clays react to the presence of water by slowly absorbing it, making the soil increase in volume (see table below). The degree of increase varies considerably between different clays, as does the degree of decrease during the subsequent drying out caused by fair weather periods. Because of the low absorption and expulsion rate, this phenomenon will not usually be noticeable unless there are prolonged rainy or dry periods, usually of weeks or months, depending on the land and soil characteristics. The swelling of soil creates an upward force on the footings of the building, and shrinkage creates subsidence that takes away the support needed by the footing to retain equilibrium.
Shear failure This phenomenon occurs when the foundation soil does not have sufficient strength to support the weight of the footing. There are two major post-construction causes:
• Significant load increase. • Reduction of lateral support of the soil under the footing due to
erosion or excavation.
In clay soil, shear failure can be caused by saturation of the soil adjacent to or under the footing.
GENERAL DEFINITIONS OF SITE CLASSES
Class Foundation
A Most sand and rock sites with little or no ground movement from moisture changes
S Slightly reactive clay sites, which may experience only slight ground movement from moisture changes
M Moderately reactive clay or silt sites, which may experience moderate ground movement from moisture changes
H1 Highly reactive clay sites, which may experience high ground movement from moisture changes
H2 Highly reactive clay sites, which may experience very high ground movement from moisture changes
E Extremely reactive sites, which may experience extreme ground movement from moisture changesNotes1. Where controlled fill has been used, the site may be classified A to E according to the type of fill used.2. Filled sites. Class P is used for sites which include soft fills, such as clay or silt or loose sands; landslip; mine subsidence; collapsing soils; soil subject to erosion;
reactive sites subject to abnormal moisture conditions or sites which cannot be classified otherwise.3. Where deep-seated moisture changes exist on sites at depths of 3 m or greater, further classification is needed for Classes M to E (M-D, H1-D, H2-D and E-D).
BTF 18-2011replaces
Information Sheet 10/91
081203 BTF 18 3pp.indd 1 25/10/12 12:40:29

Tree root growthTrees and shrubs that are allowed to grow in the vicinity of footings can cause foundation soil movement in two ways: • Roots that grow under footings may increase in cross-sectional
size, exerting upward pressure on footings. • Roots in the vicinity of footings will absorb much of the moisture
in the foundation soil, causing shrinkage or subsidence.
Unevenness of MovementThe types of ground movement described above usually occur unevenly throughout the building’s foundation soil. Settlement due to construction tends to be uneven because of: • Differing compaction of foundation soil prior to construction. • Differing moisture content of foundation soil prior to
construction.
Movement due to non-construction causes is usually more uneven still. Erosion can undermine a footing that traverses the flow or can create the conditions for shear failure by eroding soil adjacent to a footing that runs in the same direction as the flow. Saturation of clay foundation soil may occur where subfloor walls create a dam that makes water pond. It can also occur wherever there is a source of water near footings in clay soil. This leads to a severe reduction in the strength of the soil which may create local shear failure. Seasonal swelling and shrinkage of clay soil affects the perimeter of the building first, then gradually spreads to the interior. The swelling process will usually begin at the uphill extreme of the building, or on the weather side where the land is flat. Swelling gradually reaches the interior soil as absorption continues. Shrinkage usually begins where the sun’s heat is greatest.
Effects of Uneven Soil Movement on Structures
Erosion and saturation Erosion removes the support from under footings, tending to create subsidence of the part of the structure under which it occurs. Brickwork walls will resist the stress created by this removal of support by bridging the gap or cantilevering until the bricks or the mortar bedding fail. Older masonry has little resistance. Evidence of failure varies according to circumstances and symptoms may include: • Step cracking in the mortar beds in the body of the wall or above/
below openings such as doors or windows. • Vertical cracking in the bricks (usually but not necessarily in line
with the vertical beds or perpends).
Isolated piers affected by erosion or saturation of foundations will eventually lose contact with the bearers they support and may tilt or fall over. The floors that have lost this support will become bouncy, sometimes rattling ornaments etc.
Seasonal swelling/shrinkage in clay Swelling foundation soil due to rainy periods first lifts the most exposed extremities of the footing system, then the remainder of the perimeter footings while gradually permeating inside the building footprint to lift internal footings. This swelling first tends to create a dish effect, because the external footings are pushed higher than the internal ones. The first noticeable symptom may be that the floor appears slightly dished. This is often accompanied by some doors binding on the floor or the door head, together with some cracking of cornice mitres. In buildings with timber flooring supported by bearers and joists, the floor can be bouncy. Externally there may be visible dishing of the hip or ridge lines. As the moisture absorption process completes its journey to the innermost areas of the building, the internal footings will rise. If the spread of moisture is roughly even, it may be that the symptoms will temporarily disappear, but it is more likely that swelling will be uneven, creating a difference rather than a disappearance in symptoms. In buildings with timber flooring supported by bearers and joists, the isolated piers will rise more easily than the strip footings or piers under walls, creating noticeable doming of flooring. As the weather pattern changes and the soil begins to dry out, the external footings will be first affected, beginning with the locations where the sun’s effect is strongest. This has the effect of lowering the
external footings. The doming is accentuated and cracking reduces or disappears where it occurred because of dishing, but other cracks open up. The roof lines may become convex. Doming and dishing are also affected by weather in other ways. In areas where warm, wet summers and cooler dry winters prevail, water migration tends to be toward the interior and doming will be accentuated, whereas where summers are dry and winters are cold and wet, migration tends to be toward the exterior and the underlying propensity is toward dishing.
Movement caused by tree roots In general, growing roots will exert an upward pressure on footings, whereas soil subject to drying because of tree or shrub roots will tend to remove support from under footings by inducing shrinkage.
Complications caused by the structure itself Most forces that the soil causes to be exerted on structures are vertical – i.e. either up or down. However, because these forces are seldom spread evenly around the footings, and because the building resists uneven movement because of its rigidity, forces are exerted from one part of the building to another. The net result of all these forces is usually rotational. This resultant force often complicates the diagnosis because the visible symptoms do not simply reflect the original cause. A common symptom is binding of doors on the vertical member of the frame.
Effects on full masonry structures Brickwork will resist cracking where it can. It will attempt to span areas that lose support because of subsided foundations or raised points. It is therefore usual to see cracking at weak points, such as openings for windows or doors. In the event of construction settlement, cracking will usually remain unchanged after the process of settlement has ceased. With local shear or erosion, cracking will usually continue to develop until the original cause has been remedied, or until the subsidence has completely neutralised the affected portion of footing and the structure has stabilised on other footings that remain effective. In the case of swell/shrink effects, the brickwork will in some cases return to its original position after completion of a cycle, however it is more likely that the rotational effect will not be exactly reversed, and it is also usual that brickwork will settle in its new position and will resist the forces trying to return it to its original position. This means that in a case where swelling takes place after construction and cracking occurs, the cracking is likely to at least partly remain after the shrink segment of the cycle is complete. Thus, each time the cycle is repeated, the likelihood is that the cracking will become wider until the sections of brickwork become virtually independent. With repeated cycles, once the cracking is established, if there is no other complication, it is normal for the incidence of cracking to stabilise, as the building has the articulation it needs to cope with the problem. This is by no means always the case, however, and monitoring of cracks in walls and floors should always be treated seriously. Upheaval caused by growth of tree roots under footings is not a simple vertical shear stress. There is a tendency for the root to also exert lateral forces that attempt to separate sections of brickwork after initial cracking has occurred.
Trees can cause shrinkage and damage
Wall crackingdue to unevenlooting settlement
081203 BTF 18 3pp.indd 2 25/10/12 12:40:49

The normal structural arrangement is that the inner leaf of brickwork in the external walls and at least some of the internal walls (depending on the roof type) comprise the load-bearing structure on which any upper floors, ceilings and the roof are supported. In these cases, it is internally visible cracking that should be the main focus of attention, however there are a few examples of dwellings whose external leaf of masonry plays some supporting role, so this should be checked if there is any doubt. In any case, externally visible cracking is important as a guide to stresses on the structure generally, and it should also be remembered that the external walls must be capable of supporting themselves.
Effects on framed structures Timber or steel framed buildings are less likely to exhibit cracking due to swell/shrink than masonry buildings because of their flexibility. Also, the doming/dishing effects tend to be lower because of the lighter weight of walls. The main risks to framed buildings are encountered because of the isolated pier footings used under walls. Where erosion or saturation causes a footing to fall away, this can double the span which a wall must bridge. This additional stress can create cracking in wall linings, particularly where there is a weak point in the structure caused by a door or window opening. It is, however, unlikely that framed structures will be so stressed as to suffer serious damage without first exhibiting some or all of the above symptoms for a considerable period. The same warning period should apply in the case of upheaval. It should be noted, however, that where framed buildings are supported by strip footings there is only one leaf of brickwork and therefore the externally visible walls are the supporting structure for the building. In this case, the subfloor masonry walls can be expected to behave as full brickwork walls.
Effects on brick veneer structures Because the load-bearing structure of a brick veneer building is the frame that makes up the interior leaf of the external walls plus perhaps the internal walls, depending on the type of roof, the building can be expected to behave as a framed structure, except that the external masonry will behave in a similar way to the external leaf of a full masonry structure.
Water Service and Drainage Where a water service pipe, a sewer or stormwater drainage pipe is in the vicinity of a building, a water leak can cause erosion, swelling or saturation of susceptible soil. Even a minuscule leak can be enough to saturate a clay foundation. A leaking tap near a building can have the same effect. In addition, trenches containing pipes can become watercourses even though backfilled, particularly where broken rubble is used as fill. Water that runs along these trenches can be responsible for serious erosion, interstrata seepage into subfloor areas and saturation. Pipe leakage and trench water flows also encourage tree and shrub roots to the source of water, complicating and exacerbating the problem. Poor roof plumbing can result in large volumes of rainwater being concentrated in a small area of soil: • Incorrect falls in roof guttering may result in overflows, as may
gutters blocked with leaves etc.
• Corroded guttering or downpipes can spill water to ground. • Downpipes not positively connected to a proper stormwater
collection system will direct a concentration of water to soil that is directly adjacent to footings, sometimes causing large-scale problems such as erosion, saturation and migration of water under the building.
Seriousness of Cracking In general, most cracking found in masonry walls is a cosmetic nuisance only and can be kept in repair or even ignored. The table below is a reproduction of Table C1 of AS 2870-2011. AS 2870-2011 also publishes figures relating to cracking in concrete floors, however because wall cracking will usually reach the critical point significantly earlier than cracking in slabs, this table is not reproduced here.
Prevention/Cure
PlumbingWhere building movement is caused by water service, roof plumbing, sewer or stormwater failure, the remedy is to repair the problem. It is prudent, however, to consider also rerouting pipes away from the building where possible, and relocating taps to positions where any leakage will not direct water to the building vicinity. Even where gully traps are present, there is sometimes sufficient spill to create erosion or saturation, particularly in modern installations using smaller diameter PVC fixtures. Indeed, some gully traps are not situated directly under the taps that are installed to charge them, with the result that water from the tap may enter the backfilled trench that houses the sewer piping. If the trench has been poorly backfilled, the water will either pond or f low along the bottom of the trench. As these trenches usually run alongside the footings and can be at a similar depth, it is not hard to see how any water that is thus directed into a trench can easily affect the foundation’s ability to support footings or even gain entry to the subfloor area.
Ground drainage In all soils there is the capacity for water to travel on the surface and below it. Surface water flows can be established by inspection during and after heavy or prolonged rain. If necessary, a grated drain system connected to the stormwater collection system is usually an easy solution. It is, however, sometimes necessary when attempting to prevent water migration that testing be carried out to establish watertable height and subsoil water flows. This subject is referred to in BTF 19 and may properly be regarded as an area for an expert consultant.
Protection of the building perimeter It is essential to remember that the soil that affects footings extends well beyond the actual building line. Watering of garden plants, shrubs and trees causes some of the most serious water problems. For this reason, particularly where problems exist or are likely to occur, it is recommended that an apron of paving be installed around as much of the building perimeter as necessary. This paving should
CLASSIFICATION OF DAMAGE WITH REFERENCE TO WALLS
Description of typical damage and required repairApproximate crack width
limit (see Note 3)Damage category
Hairline cracks <0.1 mm 0
Fine cracks which do not need repair <1 mm 1
Cracks noticeable but easily filled. Doors and windows stick slightly. <5 mm 2
Cracks can be repaired and possibly a small amount of wall will need to be replaced. Doors and windows stick. Service pipes can fracture. Weathertightness often impaired.
5–15 mm (or a number of cracks 3 mm or more in one group)
3
Extensive repair work involving breaking-out and replacing sections of walls, especially over doors and windows. Window and door frames distort. Walls lean or bulge noticeably, some loss of bearing in beams. Service pipes disrupted.
15–25 mm but also depends on number of cracks
4
081203 BTF 18 3pp.indd 3 25/10/12 12:41:09

extend outwards a minimum of 900 mm (more in highly reactive soil) and should have a minimum fall away from the building of 1:60. The finished paving should be no less than 100 mm below brick vent bases. It is prudent to relocate drainage pipes away from this paving, if possible, to avoid complications from future leakage. If this is not practical, earthenware pipes should be replaced by PVC and backfilling should be of the same soil type as the surrounding soil and compacted to the same density. Except in areas where freezing of water is an issue, it is wise to remove taps in the building area and relocate them well away from the building – preferably not uphill from it (see BTF 19). It may be desirable to install a grated drain at the outside edge of the paving on the uphill side of the building. If subsoil drainage is needed this can be installed under the surface drain.
CondensationIn buildings with a subfloor void such as where bearers and joists support flooring, insufficient ventilation creates ideal conditions for condensation, particularly where there is little clearance between the floor and the ground. Condensation adds to the moisture already present in the subfloor and significantly slows the process of drying out. Installation of an adequate subfloor ventilation system, either natural or mechanical, is desirable. Warning: Although this Building Technology File deals with cracking in buildings, it should be said that subfloor moisture can result in the development of other problems, notably:
• Water that is transmitted into masonry, metal or timber building elements causes damage and/or decay to those elements.
• High subfloor humidity and moisture content create an ideal environment for various pests, including termites and spiders.
• Where high moisture levels are transmitted to the flooring and walls, an increase in the dust mite count can ensue within the living areas. Dust mites, as well as dampness in general, can be a health hazard to inhabitants, particularly those who are abnormally susceptible to respiratory ailments.
The gardenThe ideal vegetation layout is to have lawn or plants that require only light watering immediately adjacent to the drainage or paving edge, then more demanding plants, shrubs and trees spread out in that order. Overwatering due to misuse of automatic watering systems is a common cause of saturation and water migration under footings. If it is necessary to use these systems, it is important to remove garden beds to a completely safe distance from buildings.
Existing trees Where a tree is causing a problem of soil drying or there is the existence or threat of upheaval of footings, if the offending roots are subsidiary and their removal will not significantly damage the tree, they should be severed and a concrete or metal barrier placed vertically in the soil to prevent future root growth in the direction of the building. If it is not possible to remove the relevant roots without damage to the tree, an application to remove the tree should be made to the local authority. A prudent plan is to transplant likely offenders before they become a problem.
Information on trees, plants and shrubs State departments overseeing agriculture can give information regarding root patterns, volume of water needed and safe distance from buildings of most species. Botanic gardens are also sources of information. For information on plant roots and drains, see Building Technology File 17.
ExcavationExcavation around footings must be properly engineered. Soil supporting footings can only be safely excavated at an angle that allows the soil under the footing to remain stable. This angle is called the angle of repose (or friction) and varies significantly between soil types and conditions. Removal of soil within the angle of repose will cause subsidence.
RemediationWhere erosion has occurred that has washed away soil adjacent to footings, soil of the same classification should be introduced and compacted to the same density. Where footings have been undermined, augmentation or other specialist work may be required. Remediation of footings and foundations is generally the realm of a specialist consultant. Where isolated footings rise and fall because of swell/shrink effect, the homeowner may be tempted to alleviate floor bounce by filling the gap that has appeared between the bearer and the pier with blocking. The danger here is that when the next swell segment of the cycle occurs, the extra blocking will push the floor up into an accentuated dome and may also cause local shear failure in the soil. If it is necessary to use blocking, it should be by a pair of fine wedges and monitoring should be carried out fortnightly. This BTF was prepared by John Lewer FAIB, MIAMA, Partner, Construction Diagnosis.
The information in this and other issues in the series was derived from various sources and was believed to be correct when published.
The information is advisory. It is provided in good faith and not claimed to be an exhaustive treatment of the relevant subject.
Further professional advice needs to be obtained before taking any action based on the information provided.
Distributed by
CSIRO PUBLISHING PO Box 1139, Collingwood 3066, AustraliaTel (03) 9662 7666 Fax (03) 9662 7555 www.publish.csiro.au
Email: [email protected]
© CSIRO 2003. Unauthorised copying of this Building Technology File is prohibited
Gardens for a reactive site
081203 BTF 18 3pp.indd 4 25/10/12 12:41:26

martensPreliminary Salinity and Geotechnical Assessment:
312 South Street, Marsden Park, NSW.P1505038JR02V01 – December 2015
Page 57
Attachment G - Notes About This Report

mar
tens
co
nsul
ting
engi
neer
s
Subsurface conditions cause more construction problems than any other factor. These notes have been prepared by Martens to help you interpret and understand the limitations of your report. Not all of course, are necessarily relevant to all reports, but are included as general reference.
Engineering Reports - Limitations Geotechnical reports are based on information gained from limited sub-surface site testing and sampling, supplemented by knowledge of local geology and experience. For this reason, they must be regarded as interpretative rather than factual documents, limited to some extent by the scope of information on which they rely.
Engineering Reports – Project Specific Criteria Engineering reports are prepared by qualified personnel and are based on the information obtained, on current engineering standards of interpretation and analysis, and on the basis of your unique project specific requirements as understood by Martens. Project criteria typically include the general nature of the project; its size and configuration; the location of any structures on the site; other site improvements; the presence of underground utilities; and the additional risk imposed by scope-of-service limitations imposed by the Client.
Where the report has been prepared for a specific design proposal (eg. a three storey building), the information and interpretation may not be relative if the design proposal is changed (eg. to a twenty storey building). Your report should not be relied upon if there are changes to the project without first asking Martens to assess how factors that changed subsequent to the date of the report affect the report’s recommendations. Martens will not accept responsibility for problems that may occur due to design changes if they are not consulted.
Engineering Reports – Recommendations Your report is based on the assumption that the site conditions as revealed through selective point sampling are indicative of actual conditions throughout an area. This assumption often cannot be substantiated until project implementation has commenced and therefore your site investigation report recommendations should only be regarded as preliminary.
Only Martens, who prepared the report, are fully familiar with the background information needed to assess whether or not the report’s recommendations are valid and whether or not changes should be considered as the project develops. If another party undertakes the implementation of the recommendations of this report there is a risk that the report will be misinterpreted and Martens cannot be held responsible for such misinterpretation.
Engineering Reports – Use For Tendering Purposes Where information obtained from this investigation is provided for tendering purposes, Martens recommend that all information, including the written report and discussion, be made available. In circumstances where the discussion or comments section is not relevant to the contractual situation, it may be appropriate to prepare a specially edited document. Attention is drawn to the document ‘Guidelines for the Provision of Geotechnical Information in Tender Documents’, published by the Institution of Engineers, Australia.
The Company would be pleased to assist in this regard and/or to make additional report copies available for contract purposes at a nominal charge.
Engineering Reports – Data The report as a whole presents the findings of the site assessment and the report should not be copied in part or altered in any way.
Logs, figures, drawings etc are customarily included in a Martens report and are developed by scientists, engineers or geologists based on their interpretation of field logs (assembled by field personnel) and laboratory evaluation of field samples. These data should not under any circumstances be redrawn for inclusion in other documents or separated from the report in any way.
Engineering Reports – Other Projects To avoid misuse of the information contained in your report it is recommended that you confer with Martens before passing your report on to another party who may not be familiar with the background and the purpose of the report. Your report should not be applied to any project other than that originally specified at the time the report was issued.
Subsurface Conditions - General Every care is taken with the report as it relates to interpretation of subsurface conditions, discussion of geotechnical aspects, relevant standards and recommendations or suggestions for design and construction. However, the Company cannot always anticipate or assume responsibility for:
o Unexpected variations in ground conditions - the potential for will depend partly on test point (eg. excavation or borehole) spacing and sampling frequency which are often limited by project imposed budgetary constraints.
o Changes in guidelines, standards and policy or interpretation of guidelines, standards and
Important Information About Your Report

mar
tens
co
nsul
ting
engi
neer
s
policy by statutory authorities.
o The actions of contractors responding to commercial pressures.
o Actual conditions differing somewhat from those inferred to exist, because no professional, no matter how qualified, can reveal precisely what is hidden by earth, rock and time.
The actual interface between materials may be far more gradual or abrupt than assumed based on the facts obtained. Nothing can be done to change the actual site conditions which exist, but steps can be taken to reduce the impact of unexpected conditions
If these conditions occur, the Company will be pleased to assist with investigation or advice to resolve the matter.
Subsurface Conditions - Changes Natural processes and the activity of man create subsurface conditions. For example, water levels can vary with time, fill may be placed on a site and pollutants may migrate with time. Reports are based on conditions which existed at the time of the subsurface exploration.
Decisions should not be based on a report whose adequacy may have been affected by time. If an extended period of time has elapsed since the report was prepared, consult Martens to be advised how time may have impacted on the project.
Subsurface Conditions - Site Anomalies In the event that conditions encountered on site during construction appear to vary from those that were expected from the information contained in the report, the Company requests that it immediately be notified. Most problems are much more readily resolved at the time when conditions are exposed, rather than at some later stage well after the event.
Report Use By Other Design Professionals To avoid potentially costly misinterpretations when other design professionals develop their plans based on a report, retain Martens to work with other project professionals who are affected by the report. This may involve Martens explaining the report design implications and then reviewing plans and specifications produced to see how they have incorporated the report findings.
Subsurface Conditions - Geoenvironmental Issues Your report generally does not relate to any findings, conclusions, or recommendations about the potential for hazardous or contaminated materials existing at the site unless specifically required to do so as part of the Company’s proposal for works.
Specific sampling guidelines and specialist equipment, techniques and personnel are typically used to perform geoenvironmental or site contamination assessments. Contamination can create major health, safety and environmental risks. If you have no information about the potential for your site to be contaminated or create an environmental hazard, you are advised to contact Martens for information relating to such matters.
Responsibility Geotechnical reporting relies on interpretation of factual information based on professional judgment and opinion and has an inherent level of uncertainty attached to it and is typically far less exact than the design disciplines. This has often resulted in claims being lodged against consultants, which are unfounded.
To help prevent this problem, a number of clauses have been developed for use in contracts, reports and other documents. Responsibility clauses do not transfer appropriate liabilities from Martens to other parties but are included to identify where Martens’ responsibilities begin and end. Their use is intended to help all parties involved to recognize their individual responsibilities. Read all documents from Martens closely and do not hesitate to ask any questions you may have.
Site Inspections Martens will always be pleased to provide engineering inspection services for aspects of work to which this report is related. This could range from a site visit to confirm that conditions exposed are as expected, to full time engineering presence on site. Martens is familiar with a variety of techniques and approaches that can be used to help reduce risks for all parties to a project, from design to construction.

mar
tens
co
nsul
ting
engi
neer
s
Definitions In engineering terms, soil includes every type of uncemented or partially cemented inorganic or organic material found in the ground. In practice, if the material does not exhibit any visible rock properties and can be remoulded or disintegrated by hand in its field condition or in water it is described as a soil. Other materials are described using rock description terms.
The methods of description and classification of soils and rocks used in this report are based on Australian Standard 1726 and the S.A.A Site Investigation Code. In general, descriptions cover the following properties - strength or density, colour, structure, soil or rock type and inclusions.
Particle Size Soil types are described according to the predominating particle size, qualified by the grading of other particles present (eg. sandy clay). Unless otherwise stated, particle size is described in accordance with the following table.
Division Subdivision Size
BOULDERS >200 mm
COBBLES 60 to 200 mm
Coarse 20 to 60 mm
Medium 6 to 20 mm GRAVEL
Fine 2 to 6 mm
Coarse 0.6 to 2.0 mm
Medium 0.2 to 0.6 mm SAND
Fine 0.075 to 0.2 mm
SILT 0.002 to 0.075 mm
CLAY < 0.002 mm
Plasticity Properties Plasticity properties can be assessed either in the field by tactile properties, or by laboratory procedures.
Moisture Condition
Dry Looks and feels dry. Cohesive and cemented soils are hard, friable or powdery. Uncemented granular soils run freely through hands.
Moist Soil feels cool and damp and is darkened in colour. Cohesive soils can be moulded. Granular soils tend to cohere.
Wet As for moist but with free water forming on hands when handled.
Consistency of Cohesive Soils Cohesive soils refer to predominantly clay materials.
Term Cu
(kPa) Approx SPT “N” Field Guide
Very Soft <12 2 A finger can be pushed well
into the soil with little effort.
Soft 12 - 25 2 to 4 A finger can be pushed into the soil to about 25mm depth.
Firm 25 - 50 4 – 8 The soil can be indented
about 5mm with the thumb, but not penetrated.
Stiff 50 - 100 8 – 15 The surface of the soil can be indented with the thumb, but
not penetrated.
Very Stiff 100 - 200 15 – 30
The surface of the soil can be marked, but not indented
with thumb pressure.
Hard > 200 > 30 The surface of the soil can be
marked only with the thumbnail.
Friable - Crumbles or powders when scraped by thumbnail
Density of Granular Soils Non-cohesive soils are classified on the basis of relative density, generally from the results of standard penetration test (SPT) or Dutch cone penetrometer tests (CPT) as below:
Relative Density % SPT ‘N’ Value
(blows/300mm)
CPT Cone Value
(qc Mpa)
Very loose < 15 < 5 < 2
Loose 15 – 35 5 - 10 2 -5
Medium dense 35 – 65 10 - 30 5 - 15
Dense 65- 85 30 - 50 15 - 25
Very dense > 85 > 50 > 25
Minor Components Minor components in soils may be present and readily detectable, but have little bearing on general geotechnical classification. Terms include:
Term Assessment Proportion of Minor component In:
Trace of
Presence just detectable by feel or eye, but soil properties little or no different to general properties of primary component.
Coarse grained soils: < 5 %
Fine grained soils: < 15 %
With some
Presence easily detectable by feel or
eye, soil properties little different to general
properties of primary component.
Coarse grained soils: 5 – 12 %
Fine grained soils: 15 – 30 %
Explanation of Terms (1 of 3)

mar
tens
co
nsul
ting
engi
neer
s
Soil Agricultural Classification Scheme In some situations, such as where soils are to be used for effluent disposal purposes, soils are often more appropriately classified in terms of traditional agricultural classification schemes. Where a Martens report provides agricultural classifications, these are undertaken in accordance with descriptions by Northcote, K.H. (1979) The factual key for the recognition of Australian Soils,Rellim Technical Publications, NSW, p 26 - 28.
Symbol Field Texture Grade Behaviour of moist bolus Ribbon length Clay content (%)
S Sand Coherence nil to very slight; cannot be moulded; single grains adhere to fingers 0 mm < 5
LS Loamy sand Slight coherence; discolours fingers with dark organic stain 6.35 mm 5
CLS Clayey sand Slight coherence; sticky when wet; many sand
grains stick to fingers; discolours fingers with clay stain
6.35mm - 1.3cm 5 - 10
SL Sandy loam Bolus just coherent but very sandy to touch;
dominant sand grains are of medium size and are readily visible
1.3 - 2.5 10 - 15
FSL Fine sandy loam Bolus coherent; fine sand can be felt and heard 1.3 - 2.5 10 - 20
SCL- Light sandy clay loam Bolus strongly coherent but sandy to touch,
sand grains dominantly medium size and easily visible
2.0 15 - 20
L Loam
Bolus coherent and rather spongy; smooth feel when manipulated but no obvious sandiness or
silkiness; may be somewhat greasy to the touch if much organic matter present
2.5 25
Lfsy Loam, fine sandy Bolus coherent and slightly spongy; fine sand can be felt and heard when manipulated 2.5 25
SiL Silt loam Coherent bolus, very smooth to silky when manipulated 2.5 25 + > 25 silt
SCL Sandy clay loam Strongly coherent bolus sandy to touch; medium size sand grains visible in a finer matrix 2.5 - 3.8 20 - 30
CL Clay loam Coherent plastic bolus; smooth to manipulate 3.8 - 5.0 30 - 35
SiCL Silty clay loam Coherent smooth bolus; plastic and silky to touch 3.8 - 5.0 30- 35 + > 25 silt
FSCL Fine sandy clay loam Coherent bolus; fine sand can be felt and heard 3.8 - 5.0 30 - 35
SC Sandy clay Plastic bolus; fine to medium sized sands can be seen, felt or heard in a clayey matrix 5.0 - 7.5 35 - 40
SiC Silty clay Plastic bolus; smooth and silky 5.0 - 7.5 35 - 40 + > 25 silt
LC Light clay Plastic bolus; smooth to touch; slight resistance to shearing 5.0 - 7.5 35 - 40
LMC Light medium clay Plastic bolus; smooth to touch, slightly greater resistance to shearing than LC 7.5 40 - 45
MC Medium clay Smooth plastic bolus, handles like plasticine
and can be moulded into rods without fracture, some resistance to shearing
> 7.5 45 - 55
HC Heavy clay Smooth plastic bolus; handles like stiff
plasticine; can be moulded into rods without fracture; firm resistance to shearing
> 7.5 > 50
Explanation of Terms (2 of 3)

mar
tens
co
nsul
ting
engi
neer
s
Symbols for Soil and Rock
SOIL
COBBLES /BOULDERS
GRAVEL (GP or GW)
SILTY GRAVEL (GM)
CLAYEY GRAVEL (GC)
SAND (SP or SW)
SILTY SAND (SM)
CLAYEY SAND (SC)
SILT (ML or MH)
CLAY (CL or CI)
ALLUVIUM
FILL
TALUS
TOPSOIL
SEDIMENTARY ROCK
BOULDERCONGLOMERATE
CONGLOMERATE
CLAYSTONE
CONGLOMERATESANDSTONE
SANDSTONE,QUARTZITE
SHALE
SILTSTONE
LAMINITE
MUDSTONE
COAL
LIMESTONE
TUFF
IGNEOUS ROCK
GRANITE
DOLERITE /BASALT
IGNEOUS ROCK
SLATE, PHYLLITESCHIST
GNEISS
Unified Soil Classification Scheme (USCS)
FIELD IDENTIFICATION PROCEDURES(Excluding particles larger than 63 mm and basing fractions on estimated mass) USCS Primary Name
Wide range in grain size and substantial amounts of all intermediate particle sizes. GW Gravel
CLE
AN
G
RAV
ELS
(Litt
le o
r no
fines
)
Predominantly one size or a range of sizes with more intermediate sizes missing GP Gravel
Non-plastic fines (for identification procedures see ML below) GM Silty Gravel GRA
VEL
S M
ore
than
hal
f of c
oars
e fra
ctio
n is
larg
er th
an 2
.0 m
m.
GRA
VEL
S W
ITH F
INES
(A
ppre
ciab
le
amou
nt o
f fin
es)
Plastic fines (for identification procedures see CL below) GC Clayey Gravel
Wide range in grain sizes and substantial amounts of intermediate sizes missing. SW Sand
CLE
AN
SA
ND
S (L
ittle
or n
o fin
es)
Predominantly one size or a range of sizes with some intermediate sizes missing SP Sand
Non-plastic fines (for identification procedures see ML below) SM Silty Sand
CO
ARS
E G
RAIN
ED S
OILS
M
ore
than
50
% o
f mat
eria
l less
tha
n 63
mm
is la
rger
tha
n 0.
075
mm
SAN
DS
Mor
e th
an h
alf o
f coa
rse
fract
ion
is sm
alle
r tha
n 2.
0 m
m
SAN
DS
WITH
FI
NES
(App
reci
able
am
ount
of
fines
)
Plastic fines (for identification procedures see CL below) SC Clayey Sand
IDENTIFICATION PROCEDURES ON FRACTIONS < 0.2 MM
DRY STRENGTH (Crushing
Characteristics) DILATANCY TOUGHNESS DESCRIPTION USCS Primary Name
None to Low Quick to Slow None Inorganic silts and very fine sands, rock flour, silty or
clayey fine sands with slight plasticity ML Silt
Medium to High None Medium Inorganic clays of low to medium plasticity, gravely
clays, sandy clays, silty clays, lean clays CL Clay
Low to Medium
Slow to Very Slow Low Organic slits and organic silty clays of low plasticity OL Organic Silt
Low to Medium
Slow to Very Slow
Low to Medium
Inorganic silts, micaceous or diatomaceous fine sandy or silty soils, elastic silts MH Silt
High None High Inorganic clays of high plasticity, fat clays CH Clay
FIN
E G
RAIN
ED S
OIL
S M
ore
than
50
% o
f mat
eria
l less
than
63
mm
is
sma
ller t
han
0.07
5 m
m
(A 0
.075
mm
par
ticle
is a
bout
the
smal
lest
pa
rticl
e vi
sible
to th
e na
ked
eye
)
Medium to High None Low to
Medium Organic clays of medium to high plasticity OH Organic Silt
HIGHLY ORGANIC
SOILS Readily identified by colour, odour, spongy feel and frequently by fibrous texture Pt Peat
Low Plasticity – Liquid Limit WL < 35 % Medium Plasticity – Liquid limit WL 35 to 60 % High Plasticity - Liquid limit WL > 60 %
Explanation of Terms (3 of 3)

mar
tens
co
nsul
ting
engi
neer
s
Definitions Descriptive terms used for Rock by Martens are given below and include rock substance, rock defects and rock mass.
Rock Substance In geotechnical engineering terms, rock substance is any naturally occurring aggregate of minerals and organic matter which cannot, unless extremely weathered, be disintegrated or remoulded by hand in air or water. Other material is described using soil descriptive terms. Rock substance is effectively homogeneous and may be isotropic or anisotropic.
Rock Defect Discontinuity or break in the continuity of a substance or substances.
Rock Mass Any body of material which is not effectively homogeneous. It can consist of two or more substances without defects, or one or more substances with one or more defects.
Degree of Weathering Rock weathering is defined as the degree in rock structure and grain property decline and can be readily determined in the field.
Term Symbol Definition
Residual Soil Rs Soil derived from the weathering of rock. The mass structure and substance fabric are no longer evident. There is a large change in volume but the soil has not been significantly transported.
Extremely weathered EW
Rock substance affected by weathering to the extent that the rock exhibits soil properties - ie. it can be remoulded and can be classified according to the Unified Classification System, but the texture of the original rock is still evident.
Highly weathered HW
Rock substance affected by weathering to the extent that limonite staining or bleaching affects the whole of the rock substance and other signs of chemical or physical decomposition are evident. Porosity and strength may be increased or decrease compared to the fresh rock usually as a result of iron leaching or deposition. The colour and strength of the original rock substance is no longer recognisable.
Moderately weathered MW Rock substance affected by weathering to the extent that staining extends throughout the whole of the rock
substance and the original colour of the fresh rock is no longer recognisable.
Slightly weathered SW Rock substance affected by weathering to the extent that partial staining or discolouration of the rock
substance usually by limonite has taken place. The colour and texture of the fresh rock is recognisable.
Fresh Fr Rock substance unaffected by weathering
Rock Strength Rock strength is defined by the Point Load Strength Index (Is 50) and refers to the strength of the rock substance is the direction normal to the bedding. The test procedure is described by the International Society of Rock Mechanics.
Term Is (50) MPa Field Guide Symbol
Extremely weak < 0.03 Easily remoulded by hand to a material with soil properties. EW
Very weak 0.03 - 0.1 May be crumbled in the hand. Sandstone is ‘sugary’ and friable. VW
Weak 0.1 - 0.3 A piece of core 150mm long x 50mm diameter may be broken by hand and easily scored with a knife. Sharp edges of core may be friable and break during handling. W
Medium strong 0.3 - 1 A piece of core 150mm long x 50mm diameter can be broken by hand with considerable difficulty. Readily scored with a knife. MS
Strong 1 - 3 A piece of core 150mm long x 50mm diameter cannot be broken by unaided hands, can be slightly scratched or scored with a knife. S
Very Strong 3 - 10 A piece of core 150mm long x 50mm diameter may be broken readily with hand held hammer. Cannot be scratched with pen knife. VS
Extremely strong > 10 A piece of core 150mm long x 50mm diameter is difficult to break with hand held hammer. Rings when struck with a hammer. ES
Explanation of Terms (1 of 2)

mar
tens
co
nsul
ting
engi
neer
s
Degree of Fracturing This classification applies to diamond drill cores and refers to the spacing of all types of natural fractures along which the core is discontinuous. These include bedding plane partings, joints and other rock defects, but excludes fractures such as drilling breaks.
Term Description
Fragmented The core is comprised primarily of fragments of length less than 20mm, and mostly of width less than core diameter.
Highly fractured Core lengths are generally less than 20mm-40mm with occasional fragments.
Fractured Core lengths are mainly 30mm-100mm with occasional shorter and longer sections.
Slightly fractured Core lengths are generally 300mm-1000mm with occasional longer sections and occasional sections of 100mm-300mm.
Unbroken The core does not contain any fractures.
Explanation of Terms (2 of 2)

mar
tens
co
nsul
ting
engi
neer
s
Sampling Sampling is carried out during drilling or excavation to allow engineering examination (and laboratory testing where required) of the soil or rock.
Disturbed samples taken during drilling provide information on colour, type, inclusions and, depending upon the degree of disturbance, some information on strength and structure.
Undisturbed samples may be taken by pushing a thin-walled sample tube into the soils and withdrawing a soil sample in a relatively undisturbed state. Such samples yield information on structure and strength, and are necessary for laboratory determination of shear strength and compressibility. Undisturbed sampling is generally effective only in cohesive soils. Other sampling methods may be used. Details of the type and method of sampling are given in the report.
Drilling Methods The following is a brief summary of drilling methods currently adopted by the Company and some comments on their use and application.
Hand Excavation – in some situations, excavation using hand tools such as mattock and spade may be required due to limited site access or shallow soil profiles.
Hand Auger - the hole is advanced by pushing and rotating either a sand or clay auger generally 75-100mm in diameter into the ground. The depth of penetration is usually limited to the length of the auger pole, however extender pieces can be added to lengthen this.
Test Pits - these are excavated with a backhoe or a tracked excavator, allowing close examination of the in-situ soils if it is safe to descend into the pit. The depth of penetration is limited to about 3m for a backhoe and up to 6m for an excavator. A potential disadvantage is the disturbance caused by the excavation.
Large Diameter Auger (eg. Pengo) - the hole is advanced by a rotating plate or short spiral auger, generally 300mm or larger in diameter. The cuttings are returned to the surface at intervals (generally of not more than 0.5m) and are disturbed but usually unchanged in moisture content. Identification of soil strata is generally much more reliable than with continuous spiral flight augers, and is usually supplemented by occasional undisturbed tube sampling.
Continuous Sample Drilling - the hole is advanced by pushing a 100mm diameter socket into the ground and withdrawing it at intervals to extrude the sample. This is the most reliable method of drilling in soils, since moisture content is unchanged and soil structure, strength etc. is only marginally affected.
Continuous Spiral Flight Augers - the hole is advanced using 90 - 115 mm diameter continuous spiral flight augers which are withdrawn at intervals to allow sampling or in-situ testing. This is a relatively economical means of drilling in clays and in sands above the water table. Samples are returned to the surface or, or may be collected after withdrawal of the auger flights, but they are very disturbed and may be contaminated. Information from the drilling (as distinct from specific sampling by SPTs or undisturbed samples) is of relatively lower reliability, due to remoulding, contamination or softening of samples by ground water.
Non-core Rotary Drilling - the hole is advanced by a rotary bit, with water being pumped down the drill rods and
returned up the annulus, carrying the drill cuttings. Only major changes in stratification can be determined from the cuttings, together with some information from ‘feel’ and rate of penetration.
Rotary Mud Drilling - similar to rotary drilling, but using drilling mud as a circulating fluid. The mud tends to mask the cuttings and reliable identification is again only possible from separate intact sampling (eg. from SPT).
Continuous Core Drilling - a continuous core sample is obtained using a diamond tipped core barrel, usually 50mm internal diameter. Provided full core recovery is achieved (which is not always possible in very weak rocks and granular soils), this technique provides a very reliable (but relatively expensive) method of investigation.
Standard Penetration Tests Standard penetration tests are used mainly in non-cohesive soils, but occasionally also in cohesive soils as a means of determining density or strength and also of obtaining a relatively undisturbed sample. The test procedure is described in AS 1289 Methods of Testing Soils for Engineering Purposes - Test F3.1.
The test is carried out in a borehole by driving a 50mm diameter split sample tube under the impact of a 63 kg hammer with a free fall of 760mm. It is normal for the tube to be driven in three successive 150 mm increments and the ‘N’ value is taken as the number of blows for the last 300mm. In dense sands, very hard clays or weak rock, the full 450mm penetration may not be practicable and the test is discontinued.
The test results are reported in the following form:
(i) In the case where full penetration is obtained with successive blow counts for each 150mm of say 4, 6 and 7 blows:
as 4, 6, 7 N = 13 (ii) In a case where the test is discontinued short of full penetration, say after 15 blows for the first 150mm and 30 blows for the next 40mm
as 15, 30/40 mm.
The results of the tests can be related empirically to the engineering properties of the soil. Occasionally, the test method is used to obtain samples in 50mm diameter thin walled sample tubes in clays. In such circumstances, the test results are shown on the borelogs in brackets.
CONE PENETROMETER TESTING AND INTERPRETATION Cone penetrometer testing (sometimes referred to as Dutch Cone - abbreviated as CPT) described in this report has been carried out using an electrical friction cone penetrometer. The test is described in AS 1289 - Test F4.1.
In the test, a 35mm diameter rod with a cone tipped end is pushed continuously into the soil, the reaction being provided by a specially designed truck or rig which is fitted with an hydraulic ram system. Measurements are made of the end bearing resistance on the cone and the friction resistance on separate 130mm long sleeve, immediately behind the cone. Tranducers in the tip of the assembly are connected by electrical wires passing through the centre of the push rods to an amplifier and recorder unit mounted on the control truck.
As penetration occurs (at a rate of approximately 20mm per second) the information is output on continuous chart
Explanation of Terms (1 of 2)

mar
tens
co
nsul
ting
engi
neer
s
recorders. The plotted results given in this report have been traced from the original records.
The information provided on the charts comprises: Cone resistance - the actual end bearing force divided by the cross sectional area of the cone - expressed in MPA. Sleeve friction - the frictional force of the sleeve divided by the surface area - expressed in kPa. Friction ratio - the ratio of sleeve friction to cone resistance - expressed in percent.
There are two scales available for measurement of cone resistance. The lower (A) scale (0 - 5 Mpa) is used in very soft soils where increased sensitivity is required and is shown in the graphs as a dotted line. The main (B) scale (0 - 50 Mpa) is less sensitive and is shown as a full line.
The ratios of the sleeve resistance to cone resistance will vary with the type of soil encountered, with higher relative friction in clays than in sands. Friction ratios of 1%-2% are commonly encountered in sands and very soft clays rising to 4%-10% in stiff clays.
In sands, the relationship between cone resistance and SPT value is commonly in the range:
qc (Mpa) = (0.4 to 0.6) N (blows/300mm)
In clays, the relationship between undrained shear strength and cone resistance is commonly in the range:
qc = (12 to 18) cu
Interpretation of CPT values can also be made to allow estimation of modulus or compressibility values to allow calculation of foundation settlements.
Inferred stratification as shown on the attached reports is assessed from the cone and friction traces and from experience and information from nearby boreholes etc.This information is presented for general guidance, but must be regarded as being to some extent interpretive. The test method provides a continuous profile of engineering properties, and where precise information on soil classification is required, direct drilling and sampling may be preferable.
DYNAMIC CONE (HAND) PENETROMETERS Hand penetrometer tests are carried out by driving a rod into the ground with a falling weight hammer and measuring the blows for successive 150mm increments of penetration. Normally, there is a depth limitation of 1.2m but this may be extended in certain conditions by the use of extension rods. Two relatively similar tests are used.
Perth sand penetrometer - a 16 mm diameter flat ended rod is driven with a 9kg hammer, dropping 600mm (AS 1289 - Test F 3.3). This test was developed for testing the density of sands (originating in Perth) and is mainly used in granular soils and filling. Cone penetrometer (sometimes known as the Scala Penetrometer) - a 16mm rod with a 20mm diameter cone end is driven with a 9kg hammer dropping 510mm (AS 1289 - Test F 3.2). The test was developed initially for pavement sub-grade investigations, with correlations of the test results with California bearing ratio published by various Road Authorities.
LABORATORY TESTING Laboratory testing is carried out in accordance with AS 1289 Methods of Testing Soil for Engineering Purposes. Details of the test procedure used are given on the individual report forms.
TEST PIT / BORE LOGS The test pit / bore log(s) presented herein are an engineering and/or geological interpretation of the sub-surface conditions and their reliability will depend to some extent on frequency of sampling and the method of excavation / drilling. Ideally, continuous undisturbed sampling or excavation / core drilling will provide the most reliable assessment, but this is not always practicable, or possible to justify on economic grounds. In any case, the boreholes represent only a very small sample of the total subsurface profile.
Interpretation of the information and its application to design and construction should therefore take into account the spacing of boreholes, the frequency of sampling and the possibility of other than ‘straight line’ variation between the boreholes.
GROUND WATER Where ground water levels are measured in boreholes, there are several potential problems:
In low permeability soils, ground water although present, may enter the hole slowly, or perhaps not at all during the time it is left open. A localised perched water table may lead to an erroneous indication of the true water table. Water table levels will vary from time to time with seasons or recent prior weather changes. They may not be the same at the time of construction as are indicated in the report. The use of water or mud as a drilling fluid will mask any ground water inflow. Water has to be blown out of the hole and drilling mud must first be washed out of the hole if water observations are to be made.
More reliable measurements can be made by installing standpipes which are read at intervals over several days, or perhaps weeks for low permeability soils. Piezometers sealed in a particular stratum, may be advisable in low permeability soils or where there may be interference from a perched water table.
Explanation of Terms (2 of 2)