Embed Size (px)
Citation preview

Preliminary Review of Reductions inFatal and Serious Casualty Crashes
in Victoria duringlate 1996 and early 1997
by
Kathy DiamantopoulouSanjeev Narayan
Milena Shtifelman
MONASH UNIVERSITYACCIDENT RESEARCH CENTRE
February 1998
Report No. 135

ii MONASH UNIVERSITY ACCIDENT RESEARCH CENTRE

MONASH UNIVERSITY ACCIDENT RESEARCH CENTREREPORT DOCUMENTATION PAGE
Pagesix+26
ISBN0732614333
Date
February 1998
Report No.135
Title and sub-titlePreliminary Review of Reductions in Fatal and Serious Casualty Crashes in Victoria during late 1996 andearly 1997
Type of Report & Period CoveredGENERAL, 1991-1997
Author(s)Kathy DiamantopoulouSanjeev NarayanMilena Shtifelman
Sponsoring Organisation(s)This project was funded through the Centre's baseline research program for which grants were received from:Royal Automobile Club of Victoria (RACV) Ltd Roads Corporation (VicRoads)Department of Justice Transport Accident Commission
Abstract:
An on-going system of data gathering and analysis to monitor and evaluate countermeasures was establishedduring 1995. The data collected by the system, including number of random breath tests, number of speedrelated traffic infringement notices, television publicity levels associated with various themes (ie. drinkdriving, speed, concentration, fatigue, seat belts), unemployment rates, weather data, alcohol sales and fuelsales, was used to review the apparent reduction in fatal and serious casualty crashes that occurred in Victoriaduring late 1996 and early 1997.
A reduction in fatal crashes occurred in Victoria during September 1996 to June 1997, with the reductionbeing primarily in rural areas. Country Victoria experienced larger reductions in fatal crashes thanMelbourne during the December 1996, March 1997 and June 1997 quarters relative to the average of thecorresponding quarters of the previous five years. In parallel, a reduction in serious casualty crashes occurredin Victoria, commencing about September 1996, but was relatively smaller than the fatal crash reduction. Forrural areas the serious casualty crash reduction may have begun earlier - about June 1996 - but for Melbournea decrease was not evident until November 1996.
A reduction in the number of vehicle kilometres travelled in Victoria was found for July 1996-June 1997.This may have contributed to the crash reduction. However, when the number of fatal crashes and thenumber of serious casualty crashes were adjusted by the amount of travel in Victoria, there was still evidenceof reductions during late 1996 and early 1997 for rural areas and for Victoria as a whole, but less so forMelbourne. This suggests that some factor other than a reduction in exposure (ie. vehicle travel) iscontributing to the fatal and serious casualty crash reductions.
In addition to the decreased vehicle travel and decreased crash rates, a substantial reduction in rainfall was
found for both Melbourne and country Victoria during September 1996-June 1997 when compared to thesame period a year earlier. There was also a small increase in average daily sunshine hours duringSeptember 1996-March 1997, with the increase being greater in rural areas than in Melbourne. Thesechanges may also have contributed to the crash reductions.
In view of the exploratory nature of this preliminary study, further research involving statistical modelling aswell as the collection and analysis of a further six months crash and explanatory data (ie. for the period JulyDecember 1997) is needed to determine the contribution and significance of the above factors in the reduction
in crashes that occurred during late 1996 and early 1997.
Key Words: (IRRD except when marked*)Fatal crash, serious casualty crash, vehicle travel, crash rate, rainfall, sunshine hours, countermeasures·
Reproduction of this page is authorised MonashUniversityAccidentResearchCentre,WellingtonRoad,Clayton,Victoria,3168, Australia.
Telephone:+61 399054371, Fax: +61399054363
REDUCTIONSINFATAL& SERIOUSCASUALTYCRASHESINVICTORIADURINGLATE1996 & EARLY1997 iii

iv MONASH UNIVERSITY ACCIDENT RESEARCH CENTRE

Contents
EXECUTIVE SUMMARY vii1. mTRODUCTION 12. REDUCTIONS IN ROAD TRAUMA IN VICTORIA 3
2.1 FATAL CRASHES 32.2 SERIOUS CASUALTY CRASHES 5
3. EXPLANATORY FACTORS 93.1 VEHICLE KILOMETRES TRAVELLED IN VICTORIA 9
3.1.1 Fatal Crash Rates 113.1.2 Serious Casualty Crash Rates 13
3.2 RAINFALL AND SUNSHINE HOURS IN VICTORIA 163.2.1 Average Daily Rainfall 163.2.2 Average Number of Daily SunshineHours 18
4. SUMMARY 214.1 FATAL CRASHES 214.2 SERIOUS CASUALTY CRASHES 214.3 FACTORS EXPLAINING THE CRASH REDUCTIONS 21
4.3.1 Vehic1eKilometresof Travel.. 22
4.3.2 Average Daily Rainfall and SunshineHours 224.3.3 Other Factors 22
5. FURTHER RESEARCH 236. CONCLUSION 237. REFERENCES 25
REDUCTIONS IN FATAL & SERIOUS CASUALTY CRASHES IN VICTORIA DURING LATE 1996 & EARLY 1997 v

vi MONASH UNIVERSITY ACCIDENT RESEARCH CENTRE

EXECUTIVE SUMMARY
An on-going system of data gathering and analysis to monitor and evaluate countermeasureswas established during 1995. The data collected by the system, including number of randombreath tests, number of speed-related traffic infringement notices, television publicity levelsassociated with various themes (ie. drink-driving, speed, concentration, fatigue, seat belts),unemployment rates, weather data, alcohol sales and fuel sales, was used to review theapparent reduction in fatal and serious casualty crashes that occurred in Victoria during late1996 and early 1997.
A reduction in fatal crashes occurred in Victoria during September 1996 to June 1997, withthe reduction being primarily in rural areas. Country Victoria experienced larger reductionsin fatal crashes than Melbourne during the December 1996, March 1997 and June 1997quarters relative to the average of the corresponding quarters of the previous five years.
In parallel, a reduction in serious casualty crashes occurred in Victoria, commencing aboutSeptember 1996, but was relatively smaller than the fatal crash reduction. For rural areas thereduction may have begun earlier - about June 1996 - but for Melbourne a decrease was notevident until November 1996. In addition, for rural areas, the percentage reductions inserious casualty crashes were larger than the corresponding fatal crash reductions during theDecember 1996, March 1997 and June 1997 quarters. For Melbourne, however, smallincreases occurred during the March 1997 and June 1997 quarters relative to the average ofthe corresponding quarters of the previous five years.
A reduction in the number of vehicle kilometres travelled in Victoria was found for July 1996June 1997. This may have contributed to the crash reduction. However, when the number offatal crashes and the number of serious casualty crashes were adjusted by the amount of travelin Victoria, there was still evidence of reductions during late 1996 and early 1997 for ruralareas and for Victoria as a whole, but less so for Melbourne. This suggests that some factorother than a reduction in exposure (ie. vehicle travel) is contributing to the fatal and seriouscasualty crash reductions.
In addition to the decreased vehicle travel and decreased crash rates, a substantial reduction
in rainfall was found for both Melbourne and country Victoria during September 1996-June1997 when compared to the same period a year earlier. There was also a small increase inaverage daily sunshine hours during September 1996-March 1997, with the increase beinggreater in rural areas than in Melbourne. These changes may also have contributed to thecrash reductions.
In view of the exploratory nature of this preliminary study, further research involvingstatistical modelling as well as the collection and analysis of a further six months crash andexplanatory data (ie. for the period July-December 1997) is needed to determine thecontribution and significance of the above factors in the reduction in crashes that occurredduring late 1996 and early 1997.
REDUCTIONS IN FATAL & SERIOUS CASUALTY CRASHES IN VICTORIA DURING LATE 1996 & EARLY 1997 vii

viii MONASH UNIVERSITY ACCIDENT RESEARCH CENTRE
1. INTRODUCTION
An on-going system of data gathering and analysis to monitor and evaluatecountermeasures was established during 1995. Monitoring includes systematic recordingof dates of implementation, levels of activity, available data on road user perceptions andbehaviour, and other operational measures. Crash data is obtained regularly for Victoriaand from another State (New South Wales) to provide a comparison in the case ofevaluations of Victoria-wide countermeasures. A documentation of the system developedto monitor and evaluate countermeasures can be found in Gantzer et al (1995).
The data used to monitor the system includes Police operational data (eg. number ofrandom breath tests, number of speed-related traffic infringement notices, drink-driving,speed, concentration, fatigue and seat belt television publicity measures); economicindicators (eg. unemployment rate); social factors (eg. alcohol sales, fuel sales) andenvironmental factors (eg. monthly rainfall, average daily sunshine hours). Data (up toJune 1997) for these factors has been collected and maintained in a database.
The data collected by the system was used to review the apparent reduction in Victorianfatal crashes that occurred during late 1996 and early 1997. Serious casualty crashes forthis period were analysed in conjunction with the above factors to explain the reduction.The preliminary fmdings of the initial exploratory analysis are summarised in this report.
REDUCTIONS IN FATAL & SERIOUS CASUALTY CRASHES IN VICTORIA DURING LATE 1996 & EARLY 1997 1

2 MONASH UNIVERSITY ACCIDENT RESEARCH CENTRE

2. REDUCTIONS IN ROAD TRAUMA IN VICTORIA
2.1 FATAL CRASHES
Crash data for January 1991 to June 1997 was obtained from the VicRoads-enhanceddatabase of Police-reported accidents. Figure 2.1 gives the monthly number of fatalcrashes in Victoria as a whole, as well as for Melbourne and country Victoria for January1991-June 1997, whilst Figure 2.2 gives the corresponding monthly fatal data expressed as12-month moving totals to smooth out random fluctuations apparent in the former graph.
There appears to have been a progressive reduction in the 12-month moving totals fromabout September 1996 to June 1997 (Figure 2.2). This reduction has occurred for bothMelbourne and country Victoria during the same period - although the decrease was notas steep for the Melbourne region. Figure 2.2 suggests the reduction in fatal crashes wasprimarily in rural areas.
Figure 2.1: Number of FATAL Crashes per month for Victoria, Melbourne &Countrv Victoria. January 1991-June 1997
60
~50
III~ 40::I
oii;f 30
'0..••.a
§ 20Z
10
o
-- Melbourne ...... Country Victoria -)(- Victoria ]
REDUCTIONS IN FATAL & SERIOUS CASUALTY CRASHES IN VICTORIA DURING LATE 1996 & EARLY 1997 3

Figure 2.2: Number of FATAL Crashes per month, expressed as 12-MONTHMOVING TOTALS,for Victoria, Melbourne & Country Victoria, December 1991
June 1997
' - -- .
.....
~OT ~l~_ ~_~••O\..,.~ ••••~. 350 tCl
.~ 300oE
E 250o
E .•N 200 r··.;...·c••Gl
'5 150l!!(J
~ 100u.
50
o
-- Melbourne . -- .. -Country Victoria ~-Victoria
Table 2.1 displays the percentage change in fatal crash frequencies for the December1996, March 1997 and June 1997 quarters, relative to the average of the previous fiveyears' corresponding quarters, to show the magnitude of the drop in fatal crashes duringOctober 1996-June 1997.
Table 2.1: Percentage change in FATAL crashesfor the December 96, March 97 &June 97 quarters relative to the average of the corresponding quarters of the previous
five years, for Victoria, Melbourne & Country Victoria
Number ofFatal CrashesQuarter
IMelbourne ICountry IVictoriaVictoriaDec. 1991-95 average
49.647.296.8
Mar. 1992-96 average
49.649.699.2
Jun. 1992-96
4 MONASH UNIVERSITY ACCIDENT RESEARCH CENTRE

For all Victoria, a 20.5% reduction in fatal crashes occurred for the December 1996
quarter relative to the previous five years' December quarters. Smaller, but stillsubstantial reductions occurred for the March 1997 quarter (17.3% reduction) and for theJune 1997 quarter (12.1 % reduction). Melbourne and country Victoria experiencedreductions as well, but Melbourne had relatively smaller decreases than rural areas duringall three quarters. As can be seen from the numbers in Table 2.1 the reductions in actualcrash frequencies were also greater in rural areas.
2.2 SERIOUS CASUALTY CRASHES
To investigate whether the reduction in fatal crashes was also evident for crashes involvingserious injuries, the monthly trends in serious casualty crashes (ie. crashes in which at leastone person was killed or seriously injured) were explored.
Figure 2.3 presents the number of serious casualty crashes per month for Victoria,Melbourne and country Victoria that occurred during January 1991-June 1997, whilstFigure 2.4 expresses this information as 12-month moving totals.
Figure 2.3: Number of SERIOUS CASUALTY Crashes per month for Victoria,Melbourne & Countrv Victoria. January 1991-June 1997
100
600 t~x x
500 x x lxX Xx x x:: x X·x x-x x X x x \ x x
~ tX" II\)~ A j "\ j \JV\ x IIV\<\,)1\.,-, 'V"~ V'V, i\ jV\() 400 ~ \ xxi x.x \! V \t~ x •. x-x>cIII::IenIII()en 300::Io'cCII
III
~ 200CII.aE::IZ
-- MelbourneHHh. Country Victoria -x- Victoria
For Victoria, a relatively smaller reduction in annual serious casualty crash trends occurredcompared to the annual fatal crash trends, and appeared to commence about September1996 (Figure 2.4). This reduction was also evident for country Victoria but may havebegun earlier - about June 1996 - in rural areas, but for Melbourne a decrease did notoccur until about November 1996.
REDUCTIONS IN FATAL & SERIOUS CASUALTY CRASHES IN VICTORIA DURING LATE 1996 & EARLY 1997 5

The rural changes appear more consistent over time, with Figure 2.4 suggesting asignificant change between the metropolitan and rural trends from 1995 onwards.
Figure 2.4: Number of SERIOUS CASUALTY Crashes per month, expressed as 12MONTH MOVING TOTALS, for Victoria, Melbourne & Country Victoria,
December 1991-June 1997
~----------------:I 3,000.cIII••o
f 2,000 r·· .... h •••••• , " ' ••••••••••••••••••••••••• " •••••••••• ' •••••••••••••••III••oIII
.g 1,000GlIII
.•~~ .
.- ....
0 -N III Ni ~~~~~l ~~i~~i~iii~i~~il~;ti ~ s;; ~
•••¥
~ .to ~
••••. ::J ::J1j~"~§::J1j¥ ~§ •• IS. §C
lL cC ..,cC 0 lL cC .., cC 0 C lL cC ..,~ 0 ClL cC .., cC 0 elL.., cC 0 ClL cC ..,
-- Melbourne
...... Country Victoria-x-Victoria
Table 2.2 gives the percentage change in serious casualty crash frequencies for theSeptember 1996, December 1996, March 1997 and June 1997 quarters relative to theaverage of the previous five years' corresponding quarters.
For all Victoria, the percentage reductions in serious casualty crash frequencies wererelatively smaller than the corresponding fatal crash frequencies given in Table 2.1 for theDecember 1996, March 1997 and June 1997 quarters (ie. about half the size). However,for country Victoria the percentage reductions in serious casualty crashes were relativelylarge, and were larger than the corresponding fatal crash reductions during the December1996, March 1997 and June 1997 quarters. There was also a 22% reduction in seriouscasualty crashes during the September 1996 quarter relative to the previous five years forrural areas. For Melbourne, only a marginal 1% reduction occurred during the December1996 quarter, with small increases occurring during the March 1997 (4%) and June 1997(7%) quarters.
6 MONASH UNIVERSITY ACCIDENT RESEARCH CENTRE

Table 2.2: Percentage change in SERIOUS CASUALTY crashes for the September 96,December 96, March 97 & June 97 quarters, relative to the average of the
corresponding quarters of the previous five years,for Victoria, Melbourne & Country Victoria
Number of
Serious Casualty CrashesQuarter
IMelbourne ICountry IVictoriaVictoriaSep.1991-95 I
843.8I370.41--'l,214.2
avera eDec. 1991-95
913.4470.61,384.0avera e Mar. 1992-96
830.2480.01,310.2avera e Jun. 1992-96
904.6410.21,314.8 %change in serious casualty crashesrelative to average of previous 5 years'
uarters
Melbourne I Country I VictoriaVictoria
REDUCTIONSINFATAL& SERIOUSCASUALTYCRASHESINVICTORIADURINGLATE1996 & EARLY1997 7

8 MONASH UNIVERSITY ACCIDENT RESEARCH CENTRE

3. EXPLANATORY FACTORS
A range of potential factors that may explain the reduction that occurred in fatal andserious casualty crashes during late 1996 and early 1997 in Victoria were investigated.These factors included:
• the monthly unemployment rate for Victoria• the monthly number of "Booze bus" Random Breath Tests (RBTs)• the monthly number of speed-camera Traffic Infringement Notices (TINs)• the number of vehicle kilometres travelled per month in Victoria• the amount of alcohol sold per month in Victoria• television publicity levels associated with various themes (ie. drink-driving,
speed, concentration, fatigue, seat belts)• the average daily number of sunshine hours per month in Victoria• the average daily rainfall per month in Victoria.
For the period under consideration, September 1996-June 1997, only vehicle kilometrestravelled, monthly average daily rainfall and monthly average daily sunshine hours showedany significantly different patterns from earlier years. It was decided that changes in thesefactors may potentially explain the reduction in fatal and serious injury crashes, so monthlytrends in these factors were explored in the next sections.
3.1 VEHICLE KILOMETRES TRA VELLED IN VICTORIA
Total fuel sales can be used as a proxy for vehicle travel in studies which require somemeasure of exposure to risk, however this measure does not take into account changingefficiencies in its usage which affects total travel from a given quantity of fuel. It wouldbe better to use an absolute measure of total vehicle travel. Newstead (1995) developed amethod to estimate total vehicle travel in Victoria by combining monthly fuel sales withtravel estimates given by the ABS Surveys of Motor Vehicle Usage. Because total fuelsales are only given at a statewide level, total vehicle travel estimates used in the analysiswere only available for Victoria as a whole, and not for Melbourne and country Victoriaseparately.
Figure 3.1 presents the monthly number of vehicle kilometres travelled in Victoria duringJanuary 1991-June 1997, whilst Figure 3.2 shows the monthly vehicle kilometres travelledexpressed as 12-month moving totals. Beginning from about June 1996 there appears tobe a decrease in the number of kilometres travelled in the second half of 1996, with a
slight increase occurring in January 1997, before a further decline until June 1997. Thus areduction in the amount of vehicle travel in Victoria in late 1996 and early 1997 couldpartially explain the reduction in the number of fatal and serious casualty crashes thatoccurred during the same period.
REDUCTIONS IN FATAL & SERIOUS CASUALTY CRASHES IN VICTORIA DURING LATE 1996 & EARLY 1997 9

4,000,000
3,500,0003,000,000
'tl.!!l 2,500,000
'" ~ml!!';i2,000,000
E .S!52Gl
1,500,000U :cGl>1,000,000
500,000
Figure 3.1: Vehicle kilometres travelled per month in Victoria,January 1991-June 1997
Figure 3.2: Vehicle kilometres travelled per month in Victoria, expressed as 12MONTH MOVING TOTALS, January 1991-June 1997
45,000,000
40,000,000'tl
35,000,000.!!
~~30,000,000m l!!';iE25,000,000
.S! 52Gl20,000,000U
:cGl>15,000,000
10,000,0005,000,000
0Cii
'"'" '"'"'"'"'"!*!*lil!Cl.•.
it.•.It>It> It>It>It>It>.•.i.•.!~.•.•..lii•..i 'l' 'l''& 3:~~ 'l'en
~ii'&ten
~ 'l' en
~ 'l':il :il
.:.:il ~.:.
~il.li. <: .•.<:::J t; .•.<:
.•.<: <:
oC .:j::J U
of::J
of::J
.¥ 0 of.¥ 0of::J
.¥ 0 of::JQ oC 0QoC...,oC 0QoC..., Q QoC...,
oC...,
Month
10 MONASH UNIVERSITY ACCIDENT RESEARCH CENTRE

If the reduction in vehicle travel fully explained the reduction in fatal crashes duringSeptember 1996-June 1997, then it would be expected that the monthly fatal crash rate(ie. the number of fatal crashes per million kilometres of travel) during that period shouldremain relatively stable. The next sections examine the fatal and serious casualty crashrates for all Victoria, Melbourne and country Victoria.
3.1.1 Fatal Crash Rates
The ratio of the number of fatal crashes per month to the number of kilometres of vehicletravel (in millions) was calculated to give a monthly fatal crash rate. Figure 3.3 displaysthis information for all Victoria, as well as for Melbourne and country Victoria. ForVictoria there appears to be a downward trend in the monthly fatal crash rates fromSeptember 1996 onwards. Country Victoria also shows a reduction during this period.However, for Melbourne, a trend is less obvious because of the random monthlyfluctuations. To smooth out these fluctuations, the fatal crash rates were expressed as 12month moving totals, that is, a ratio of the 12-month moving total of fatal crashes to the12-month moving total of vehicle kilometres was calculated for each month of the series.The "12-month moving total" fatal crash rates are shown in Figure 3.4 for all Victoria,Melbourne and for country Victoria.
Figure 3.3: Monthly number of FATAL crashes per million kilometres of vehicletravel in Victorial, for Melbourne, Country Victoria & Victoria,
January 1991-June 199718
16 x
E 14.;0:
CII
U
~ 12 Nc~ 10E..CII
Cl. 8•••••~••l! 6oii:f 4
2
q. !,.. ~. ..,'"
-- Melbourne ...... Country Victoria -- Victoria ]
1 In Figure 3.3, only the Victoria crash rates have been calculated with the correct denominator. TheMelbourne & country Victoria crash rates used the vehicle kilometres travelled in Victoria as a whole.
REDUCTIONS IN FATAL & SERIOUS CASUALTY CRASHES IN VICTORIA DURING LATE 1996 & EARLY 1997 11
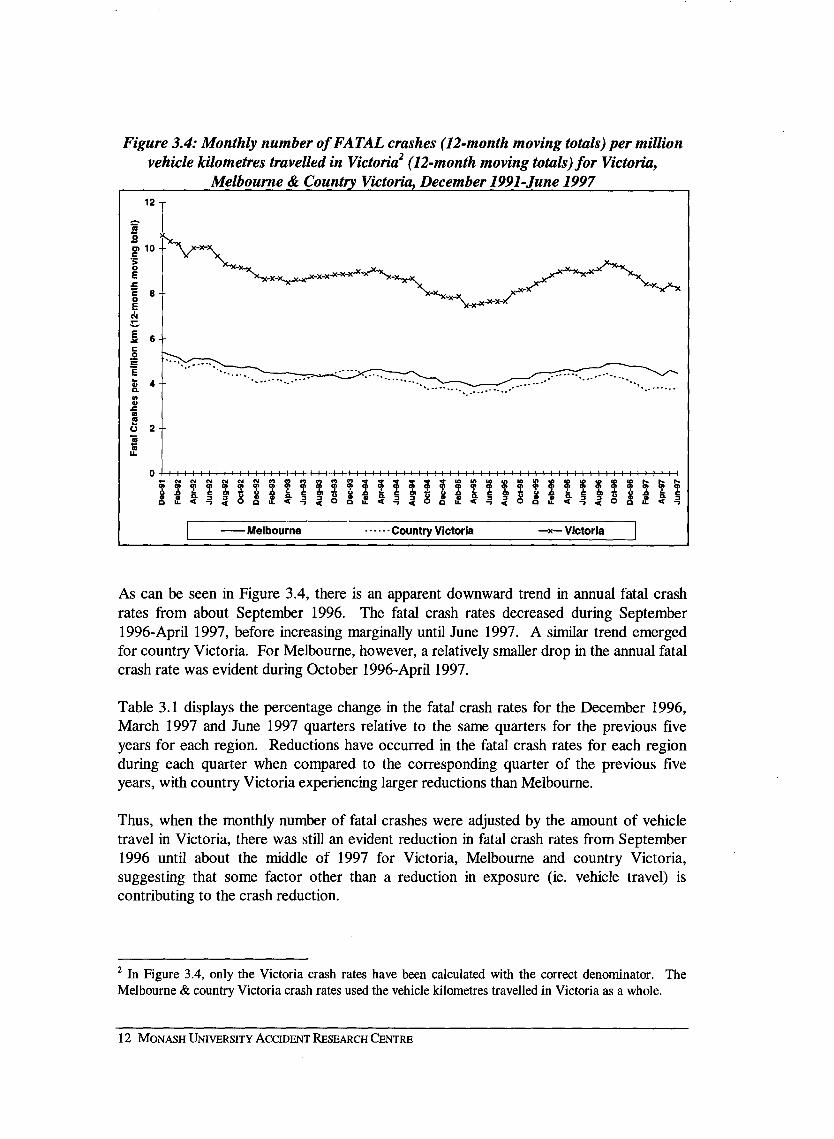
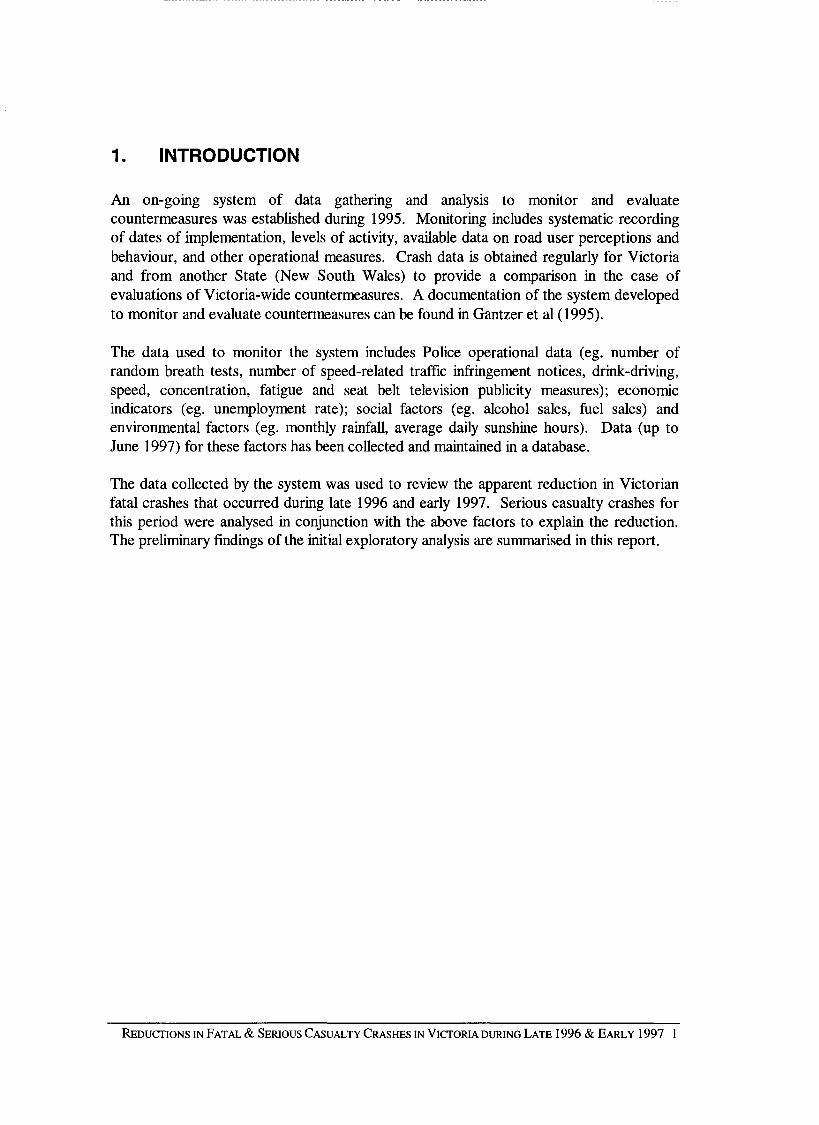
Figure 3.4: Monthly number of FATAL crashes (12-month moving totals) per millionvehicle kilometres travelled in Victoria2 (12-month moving totals)for Victoria,
Melbourne & Countrv Victoria. December 1991-June 1997
~ 6c~'sa; 4a.••GI
.c••l!o 2
SIf
'"
0 -..................Ilil •••i ~..•.•.~.•.
if. ; ;•••••••••••• ••••••;:l:•••
~ fi;•..•..'l' ~!'l''& t~IS. ~
'l'~ 'l' ~'" '"'& t'"IS. ~ 1~¥
<: ¥<:
~ ~¥••...::s~ 0 c -'l~ 0••...::s::s U ~:.~ 0c -'l~ 0 c -'lQILC..., Q QILC...,C 0 QIL QIL
-- Melbourne
...... Country Victoria-x-Victoria
As can be seen in Figure 3.4, there is an apparent downward trend in annual fatal crashrates from about September 1996. The fatal crash rates decreased during September1996-April 1997, before increasing marginally until June 1997. A similar trend emergedfor country Victoria. For Melbourne, however, a relatively smaller drop in the annual fatalcrash rate was evident during October 1996-April 1997.
Table 3.1 displays the percentage change in the fatal crash rates for the December 1996,March 1997 and June 1997 quarters relative to the same quarters for the previous fiveyears for each region. Reductions have occurred in the fatal crash rates for each regionduring each quarter when compared to the corresponding quarter of the previous fiveyears, with country Victoria experiencing larger reductions than Melbourne.
Thus, when the monthly number of fatal crashes were adjusted by the amount of vehicletravel in Victoria, there was still an evident reduction in fatal crash rates from September1996 until about the middle of 1997 for Victoria, Melbourne and country Victoria,suggesting that some factor other than a reduction in exposure (ie. vehicle travel) iscontributing to the crash reduction.
2 In Figure 3.4, only the Victoria crash rates have been calculated with the correct denominator, TheMelbourne & country Victoria crash rates used the vehicle kilometres travelled in Victoria as a whole.
12 MONASH UNIVERSITY ACCIDENT RESEARCH CENTRE
Table 3.1: Percentage change in FATAL crash rates for the December 96, March 97 &June 97 quarters relative to the average of the corresponding quarters of the previous
five years, for Victoria, Melbourne & Country Victoria
FatalCrash ratesQuarter
IMelbourne ICountryIVictoriaVictoriaDec. 1991-95 I
4.58I4.35I8.93
average I4.65
I4.67
I9.32
Mar. 1992-96
average I4.49
I4.12
I8.61
Jun. 1992-96
3.1.2 Serious Casualty Crash Rates
To investigate whether a reduction was also evident for crash rates involving seriousinjuries as well as fatalities, the ratio of the number of serious casualty crashes to thenumber of kilometres of vehicle travel was determined for each region. Figure 3.5presents the serious casualty crash rates during January 1991-June 1997 for Victoria,Melbourne and country Victoria.
For each region, a reduction in the serious casualty crash rate was evident during June1996-February 1997 (Figure 3.5). However, during March 1997 there was a substantialpeak in the serious casualty crash rate. The March peaks (and other monthly fluctuations)were smoothed out when the data was expressed as 12-month moving totals (Figure 3.6).A reduction in the 12-month moving total serious casualty crash rates was not evidentuntil November 1996 for Melbourne, but for country Victoria the reduction commencedearlier - about July 1996 - and was also larger than the Melbourne decrease. This trendwas also found for the annual fatal crash rates presented earlier.
REDUCTIONS IN FATAL & SERIOUS CASUALTY CRASHES IN VICTORIA DURING LATE 1996 & EARLY 1997 13

Figure 3.5: Monthly number of SERIOUS CASUALTY crashes permillion kilometres of vehicle travel in Victoria3, for
Victoria. Melbourne & Countrv Victoria. January 1991-June 1997
§J!.!!
~ 120c
.S!
~ 100
8-j 80
5~ 60••"::u 40••
5~ 20
" ,, ,..... \.- ...
,',, ,.- ,~ -,
'" .~."
-- Melbourne ...... Country Victoria -x- Victoria
0~~l~i~~~i~~i II~t ~~It i~~~iII~~~J i i~~ ~ ~ 0 ~ ~ c 0 ~ ~ c 0 ~ ~ c 0 ~ ~ c 0 ~ ~-- Melbourne
- ... -. Country Victoria-x- Victoria]
............-- - --- ..................................•......................
.•.............•.. - ...
Figure 3.6: Monthly number of SERIOUS CASUALTY crashes (12-month movingtotals) per million vehicle kilometres of travel in Victoria3 (12-month moving totals)
for Victoria, Melbourne & Country Victoria, December 1991-June 1997
140 T'Ne ..••.
. ·..••-x-oc-><-oc~-x...x-x_><-oc .. ."....x-x...x-x•••..X-x-x....-O<"""x-><-x-*o<-OC-x...x-><-x...,..,....x-x-x..<-x_x.".-><__ x_x...x.".-x-x~----· ~...x-x-x..,.
so~ 120c~E
~ 100oE
t!E 80...c~E 60i•••.c:I 40(;!;••
:: 20(,)••"o1:~
3 In Figures 3.5 & 3.6, only the Victoria crash rates have been calculated with the correct denominator,The Melbourne & country Victoria crash rates used the vehicle kilometres travelled in Victoria as awhole.
14 MONASH UNIVERSITY ACCIDENT RESEARCH CENTRE

Table 3.2 gives the percentage change in serious casualty crash rates for the September1996, December 1996, March 1997 and June 1997 quarters relative to the same quartersof the previous five years. Reductions occurred during each quarter for country Victoria.The reductions were larger than the corresponding fatal crash rate reductions shown inTable 3.1 for rural areas. However, for Melbourne a small reduction (1.4%) occurredonly during the December 1996 quarter. Increases occurred during the September 1996,March 1997 and June 1997 quarters.
Table 3.2: Percentage change in SERIOUS CASUALTY crash rates for the September96, December 96, March 97 & June 97 quarters relative to the average of the
corresponding quarters of the previous five years,for Victoria, Melbourne & Country Victoria
Serious CasualtyI
%change in serious casualty crash ratesCrash rates
relative to average of previous 5 years'uartersQuarter
IMelbourne ICountry VictoriaMelbourneCountryIVictoriaVictoria
Victoria
Sep. 1991-95 I80.1I35.3 115.4
avera e Dec. 1991-9584.043.4I127.4
avera e Mar. 1992-9677.945.1I123.0
avera e Jun. 1992-9685.5I37.4I119.9
Hence, when the number of serious casualty crashes was adjusted by the amount ofvehicle travel in Victoria, there was still a reduction in annual serious casualty crash ratesduring late 1996 and early 1997 for country Victoria and for Victoria as a whole (as wasapparent from Figure 3.6), but less so for Melbourne.
Therefore there may be another underlying factor or factors leading to the reduction infatal crashes (and to serious casualty crashes) in Victoria apart from the reduction in thekilometres of vehicle travel, because the fatal crash rates (and to a lesser extent the seriouscasualty crash rates) showed a reduction during September 1996-June 1997 for Victoriaas a whole, as well as for country Victoria and to a lesser degree for Melbourne.
REDUCTIONS IN FATAL & SERIOUS CASUALTY CRASHES IN VICTORIA DURING LATE 1996 & EARLY 1997 15

3.2 RAINFALL AND SUNSHINEHOURS IN VICTORIA
A number of previous studies have found strong links between environmental factors andcrash frequencies; however it should be noted that these links were found in countriesother than Australia (Fridstrom et aI, 1995). For Victorian road trauma, rainfall andsunshine were considered appropriate explanatory factors in modelling road crashes.Environmental data was obtained from the Bureau of Meteorology National ClimateCentre in Melbourne. For this study, daily average rainfall and daily sunshine hours wereaggregated across individual weather stations to give monthly average rainfall andsunshine hours for Melbourne and country Victoria.
3.2.1 Average Daily Rainfall
Figure 3.7 shows trends in the average daily rainfall in millimetres per month forMelbourne and country Victoria during January 1991-June 1997. There was aconsiderable amount of random fluctuation per month present, so 12-month moving totalswere calculated for the series. The monthly trends in the 12-month moving totals areshown in Figure 3.8. These graphs show that there was a substantial reduction in rainfallduring September 1996-June 1997 in both Melbourne and country Victoria, whereas forthe same period a year earlier the average daily rainfall increased.
Figure 3.7: Average Daily Rainfall per month in Melbourne & Country Victoria,Januan 1991-June 1997
5
4
EE.5
! 3c76a:~~&2I!~Cl:
o
-- Melbourne
16 MONASH UNIVERSITY ACCIDENT RESEARCH CENTRE
.....\~
••••• h Country Victoria
I I]

Figure 3.8: 12-MONTH MOVING TOTAL of Average Daily Rainfall per month inMelbourne & Country Victoria. December 1991-June 1997
35
30
~:::- 25•••c:_ 0- -iiClc.5 20- >III 0~E~:5o S 15Gl ECl.l!NGl::::'
~ 10
5
o
...' ..... :"\
: " \ / '.,
.",.", ."......
-- Melbourne ••• h •• Country Victoria
Table 3.3 gives the percentage change in average daily rainfall for the December 1996,March 1997 and June 1997 quarters relative to the corresponding quarters of the previousfive years. For country Victoria there was an 11.8% reduction in rainfall during theDecember 1996 quarter compared to the corresponding quarters of the previous five yearson average. Even larger reductions were found for the March 1997 (28.3%) and June1997 (35.0%) quarters. Melbourne experienced relatively larger reductions in rainfall thanrural areas, particularly during the December 1996 (a 54.7% reduction) and March 1997quarters (a 37.1 % reduction).
The trends found in Figures 3.7 and 3.8 and in Table 3.3 suggest that the reduction inrainfall during September 1996-June 1997 may have led to a reduction in crashes becauseof safer roads. Conversely, however, the lower rainfall may also lead to more speedingby drivers because of their perception of roads being safer during dry weather conditions.This could then lead to crashes which are more severe in injury.
REDUCTIONS IN FATAL & SERIOUS CASUALTY CRASHES IN VICTORIA DURING LATE 1996 & EARLY 1997 17
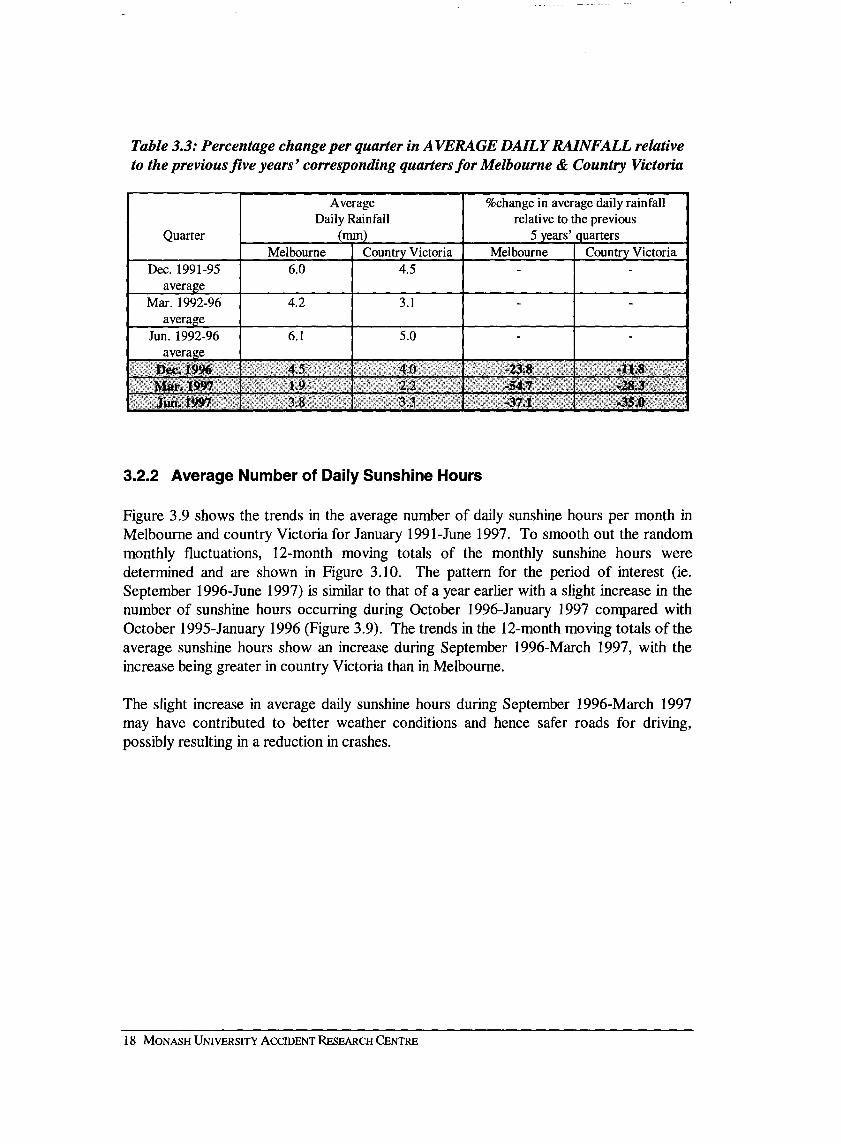
Table 3.3: Percentage change per quarter in AVERAGE DAILY RAINFALL relativeto the previous five years' corresponding quarters for Melbourne & Country Victoria
%change in average daily rainfallrelative to the previous
5 years' quartersMelbourne I Countrv Victoria
3.1
AverageDaily Rainfall
(mm).Country Victoria
4.5
4.2
Melbourne
6.0
Quarter
Dec. 1991-95
averageMar. 1992-96
averageJun. 1992-96 6.1 5.0
3.2.2 Average Number of Daily Sunshine Hours
Figure 3.9 shows the trends in the average number of daily sunshine hours per month inMelbourne and country Victoria for January 1991-June 1997. To smooth out the randommonthly fluctuations, 12-month moving totals of the monthly sunshine hours weredetermined and are shown in Figure 3.10. The pattern for the period of interest (ie.September 1996-June 1997) is similar to that of a year earlier with a slight increase in thenumber of sunshine hours occurring during October 1996-January 1997 compared withOctober 1995-January 1996 (Figure 3.9). The trends in the 12-month moving totals of theaverage sunshine hours show an increase during September 1996-March 1997, with theincrease being greater in country Victoria than in Melbourne.
The slight increase in average daily sunshine hours during September 1996-March 1997may have contributed to better weather conditions and hence safer roads for driving,possibly resulting in a reduction in crashes.
18 MONASH UNIVERSITY ACCIDENT RESEARCH CENTRE

Figure 3.9: Average Number of Sunshine Hours per month in Melbourne & CountryVictoria. January 1991-June 1997
12
10 ".
l!!
::I0 SJ:GIC:cfI)c::IIII 6
'0 ciZGIDI 4••l»>cc
2
o
ill ~ iiI I I~I I iiI ~ I 1 I I I II I J ~ I ~ I I ; ~ I ! I I ~ ~ I
-- Melbourne Country Victoria ]
Figure 3.10: 12-MONTH MOVING TOTAL of Average Number of Sunshine Hourser month in Melbourne & Countrv Victoria. December 1991-June 1997
100
90sor···
-......--.- -.
l!!s=-
70J:.l!! GI 0
c" 60.- DI
~ CfI) .-c >::I 0III E 50-~ 0 ••·co 0 40Z EGI •DIN•....... ~ 30GI
~20
10
o
....•............,' ~..•.••..•.......
"~... - .... -. ." .
-- Melbourne ....... Country Victoria
REDUCTIONS IN FATAL & SERIOUS CASUALTY CRASHES IN VICTORIA DURING LATE 1996 & EARLY 1997 19

20 MONASH UNIVERSITY ACCIDENT RESEARCH CENTRE

4. SUMMARY
An on-going system of data gathering and analysis to monitor and evaluatecountermeasures was established during 1995. The data collected by the system, includingnumber of random breath tests, number of speed-related traffic infringement notices,television publicity levels associated with various themes (ie. drink-driving, speed,concentration, fatigue, seat belts), unemployment rates, weather data, alcohol sales andfuel sales, was used to review the apparent reduction in fatal and serious casualty crashesthat occurred in Victoria during late 1996 and early 1997.
4.1 FATAL CRASHES
A reduction in fatal crashes occurred in Victoria during September 1996 to June 1997,with the reduction being primarily in rural areas. Country Victoria experienced largerreductions in fatal crashes than Melbourne during the December 1996, March 1997 andJune 1997 quarters relative to the average of the corresponding quarters of the previousfive years.
4.2 SERIOUS CASUALTY CRASHES
A reduction in serious casualty crashes occurred in Victoria, commencing aboutSeptember 1996, but was relatively smaller than the fatal crash reduction. For rural areasthe reduction may have begun earlier - about June 1996 - but for Melbourne a decreasewas not evident until November 1996.
In addition, for rural areas, the percentage reductions in serious casualty crashes werelarger than the corresponding fatal crash reductions during the December 1996, March1997 and June 1997 quarters. For Melbourne, however, small increases occurred duringthe March 1997 and June 1997 quarters relative to the average of the correspondingquarters of the previous five years.
4.3 FACTORS EXPLAINING THE CRASH REDUCTIONS
A range of potential explanatory factors that may explain the reduction that occurred infatal and serious casualty crashes during September 1996-June 1997 were investigated.For this period the only explanatory factors that showed any significantly different patternsfrom earlier years were vehicle kilometres travelled, monthly average daily rainfall andmonthly average daily sunshine hours. Changes in these factors were investigated toexplain the fatal and serious casualty crash reductions.
REDUCTIONS IN FATAL & SERIOUS CASUALTY CRASHES IN VICTORIA DURING LATE 1996 & EARLY 1997 21

4.3.1 Vehicle Kilometres of Travel
A reduction in the number of vehicle kilometres travelled in Victoria was found for July1996-June 1997. If the reduction in vehicle travel could explain the reduction in fatal andserious casualty crashes during September 1996-June 1997 then it would be expected thatthe monthly fatal and monthly serious casualty crash rates would remain relatively stableduring that period.
Reductions were found in the fatal crash rates for both Melbourne and country Victoriaduring the December 1996, March 1997 and June 1997 quarters in comparison with thecorresponding quarters of the previous five years, on average. Rural areas experiencedlarger reductions than Melbourne. Similar patterns were found in the serious casualty
, crash rate trends.
Hence when the number of fatal crashes and the number of serious casualty crashes wereadjusted by the amount of travel in Victoria, there was still evidence of reductions duringlate 1996 and early 1997 for rural areas and for Victoria as a whole, but less so forMelbourne. This suggests that some factor other than a reduction in exposure (ie. vehicletravel) is contributing to the fatal and serious casualty crash reductions.
4.3.2 Average Daily Rainfall and Sunshine Hours
For both Melbourne and country Victoria there were substantial reductions in rainfallduring September 1996-June 1997, whereas for the same period a year earlier the averagedaily rainfall increased. For rural areas of Victoria, reductions in rainfall (in excess of12%) were found during the December 1996, March 1997 and June 1997 quarters incomparison with the corresponding quarters of the previous five years on average.Melbourne experienced larger reductions in rainfall than rural areas (at least 24%) for eachquarter. There was also a slight increase in average daily sunshine hours duringSeptember 1996-March 1997, with the increase being greater in rural areas than inMelbourne.
Thus, the reduction in rainfall and the increase in sunshine hours may have led to areduction in crashes because of relatively safer roads. Conversely, the lower rainfall mayalso lead to more speeding by drivers because of their perception of roads being saferduring dry weather conditions. This could then lead to crashes which are more severe ininjury.
4.3.3 Other Factors
Other explanatory factors, not available in the database used to monitor and evaluatecountermeasures, may have influenced the crash frequencies. Such factors could includethe transfer of vehicle travel to minor roads in rural areas of Victoria (Cameron et aI,
22 MONASH UNIVERSITY ACCIDENT RESEARCH CENTRE

1997) and change in Police operations accordingly. In addition, changes in the behaviourof drivers over time may be altering the impact of the number of traffic infringementnotices issued for speeding offences detected by speed cameras.
5. FURTHER RESEARCH
To fully explain the reduction in fatal and serious casualty crashes that occurred duringlate 1996 and early 1997 in Victoria, the contribution of each explanatory factor (ie.decreased vehicle travel, decreased rainfall and decreased crash rates) needs to beconsidered. In addition, changes in driver travel patterns and behaviour need to beinvestigated.
Other possibilities would be to investigate if greater crash reductions occurred duringcertain times of the week than others (ie. high alcohol hours versus low alcohol hours), ormore for particular road user groups than others. Explanatory information and crash datashould also be obtained for the July-December 1997 period to examine whether thereduction in crashes found during September 1996-June 1997 was evident throughout allof 1997.
The analysis in this preliminary review has been of an exploratory nature. The furtherwork described above would be undertaken using more powerful statistical methods suchas Interrupted Time Series analysis. This type of analysis would include the fitting ofcovariates in time series models of influential factors, and would consider changes in crashfrequencies after a particular intervention period.
6. CONCLUSION
A reduction in fatal crashes occurred in Victoria during September 1996 to June 1997,with the reduction being primarily in rural areas. A reduction in serious casualty crasheswas also found for Victoria, commencing about September 1996. For rural areas thisreduction may have begun earlier, about June 1996, but for Melbourne a decrease was notevident until November 1996.
Possible factors that could have contributed to the reduction in fatal and serious casualtycrashes were decreased vehicle travel, decreased rainfall and decreased crash rates.However, because of the exploratory nature of this preliminary review, further researchinvolving statistical modelling is needed to determine the contribution and significance ofthese factors in the reduction in crashes that occurred during late 1996 and early 1997.
REDUCTIONS IN FATAL & SERIOUS CASUALTY CRASHES IN VICTORIA DURING LATE 1996 & EARLY 1997 23

7. REFERENCES
Cameron, M., Diamantopoulou, K., Mullan, N., Dyte, D. & Gantzer, S. (1997).Evaluation of the Country Random Breath Testing and Publicity Program in Victoria1993-1994, Report No. 126, Monash University Accident Research Centre, Victoria.
Fridstrom, L., lfver, J., lngebrigtsen, S., Kulmala, R. & Thomsen, L.K. (1995)."Measuring the Contribution of Randomness, Exposure, Weather and Daylight to theVariation in Road Accident Counts", Accident Analysis and Prevention, Volume 27, No1, pp 1-20, 1995.
Gantzer, S., Cameron, M., Newstead, S. & Carr, D. (1995) "Establishment of a Systemto Monitor and Evaluate Countermeasures ", Monash University Accident ResearchCentre, Clayton, Victoria.
Newstead, S. (1995). "Estimation of Vehicle Travel in Victoria ", Monash UniversityAccident Research Centre, Research Note.
REDUCTIONS IN FATAL & SERIOUS CASUALTY CRASHES IN VICTORIA DURING LATE 1996 & EARLY 1997 25

26 MONASH UNIVERSITY ACCIDENT RESEARCH CENTRE


![[Investigation Report No: /2016] Serious Marine Casualty · [Investigation Report No: /2016] Serious Marine Casualty M/V “SEVEN SEAS”, ... report available to interested parties,](https://img.pdfslide.us/doc/110x75/5ac6fa937f8b9a5c558e4cd8/investigation-report-no-2016-serious-marine-investigation-report-no-2016.jpg)