Embed Size (px)
Citation preview
Fatal and Serious Injury Trend Update
May 7, 2021
Last Updated: 4/29/2021
Fatal and Serious Injury Trend Update
2
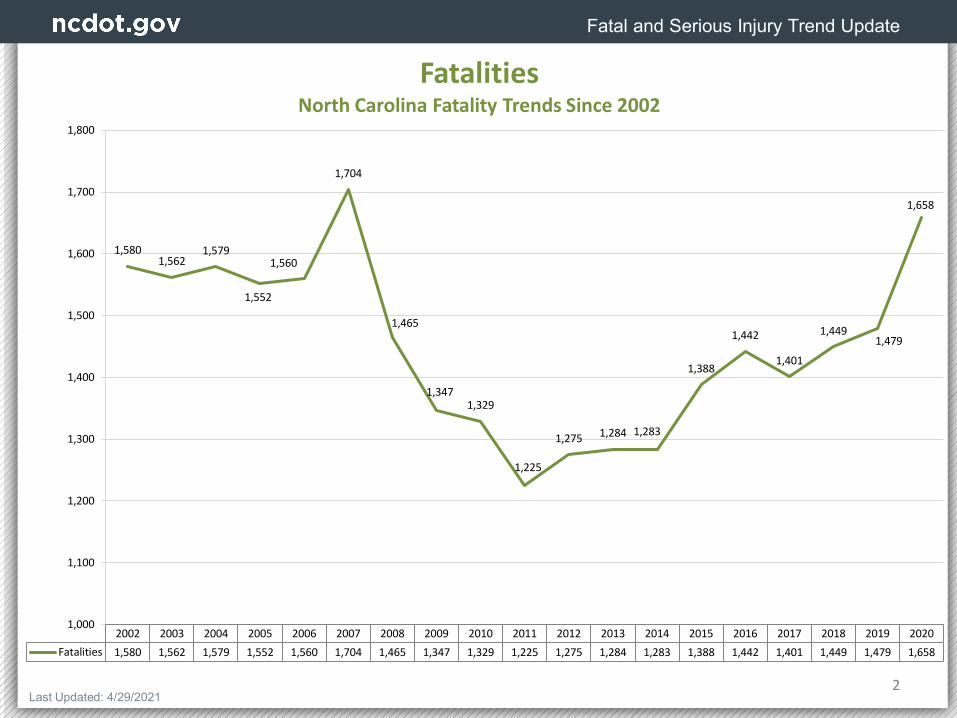
2002 2003 2004 2005 2006 2007 2008 2009 2010 2011 2012 2013 2014 2015 2016 2017 2018 2019 2020Fatalities 1,580 1,562 1,579 1,552 1,560 1,704 1,465 1,347 1,329 1,225 1,275 1,284 1,283 1,388 1,442 1,401 1,449 1,479 1,658
1,5801,562
1,579
1,552
1,560
1,704
1,465
1,3471,329
1,225
1,275 1,284 1,283
1,388
1,442
1,401
1,4491,479
1,658
1,000
1,100
1,200
1,300
1,400
1,500
1,600
1,700
1,800
FatalitiesNorth Carolina Fatality Trends Since 2002
Fatal and Serious Injury Trend Update
3
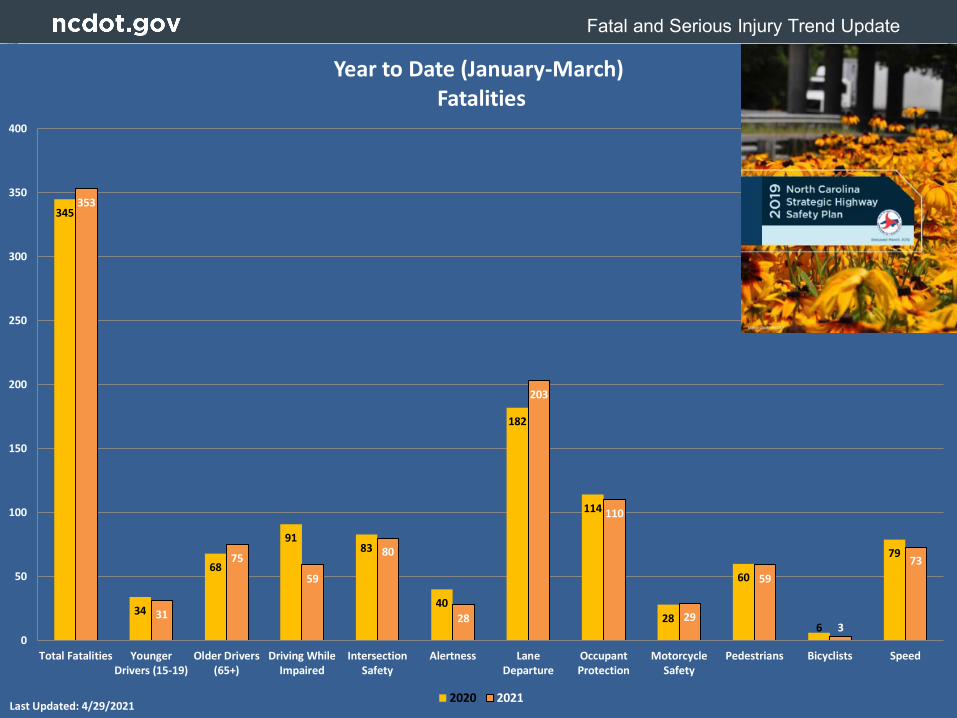
345
34
68
9183
40
182
114
28
60
6
79
353
31
75
59
80
28
203
110
29
59
3
73
0
50
100
150
200
250
300
350
400
Total Fatalities YoungerDrivers (15-19)
Older Drivers(65+)
Driving WhileImpaired
IntersectionSafety
Alertness LaneDeparture
OccupantProtection
MotorcycleSafety
Pedestrians Bicyclists Speed
Year to Date (January-March)Fatalities
2020 2021Last Updated: 4/29/2021

COVID Safety Data Trends
4
Traffic Volume Trends
-45%
-40%
-35%
-30%
-25%
-20%
-15%
-10%
-5%
0%
5%
10%AP R IL M AY JUNE JUL Y AUG UST SEP TEM B ER OCTOB ER
Perc
ent C
hang
e Fr
om P
re-S
hutd
own
Base
line
Statewide Traffic Volumes
Statewide Travel (Permanent Counters) Urban Travel (from Signal Detectors)
COVID Safety Data Trends
5
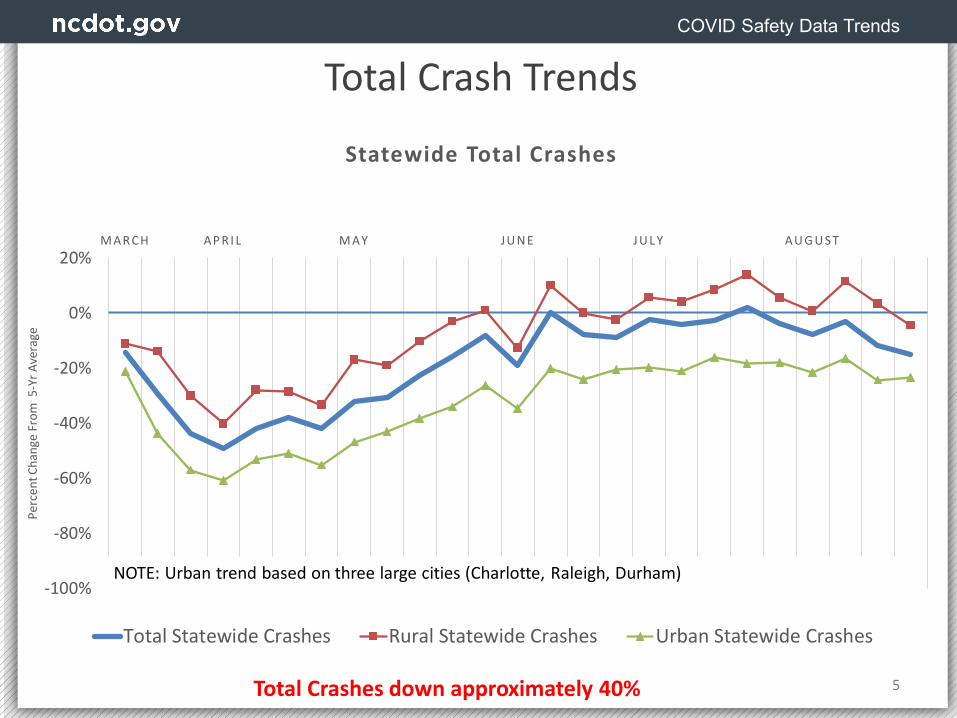
Total Crash Trends
-100%
-80%
-60%
-40%
-20%
0%
20%M AR CH AP R I L M AY JU N E JU L Y AU G U ST
Perc
ent C
hang
e Fr
om 5
-Yr A
vera
ge
Statewide Total Crashes
Total Statewide Crashes Rural Statewide Crashes Urban Statewide Crashes
NOTE: Urban trend based on three large cities (Charlotte, Raleigh, Durham)
Total Crashes down approximately 40%

COVID Safety Data Trends
6
Reported Crashes by Year(2005-2020)
Total Crashes down approximately 14% (2019 to 2020)
233,980
316,955
271,887
0
50,000
100,000
150,000
200,000
250,000
300,000
350,000
2005 2006 2007 2008 2009 2010 2011 2012 2013 2014 2015 2016 2017 2018 2019 2020
Repo
rted
Cra
shes
Year
COVID Safety Data Trends
7
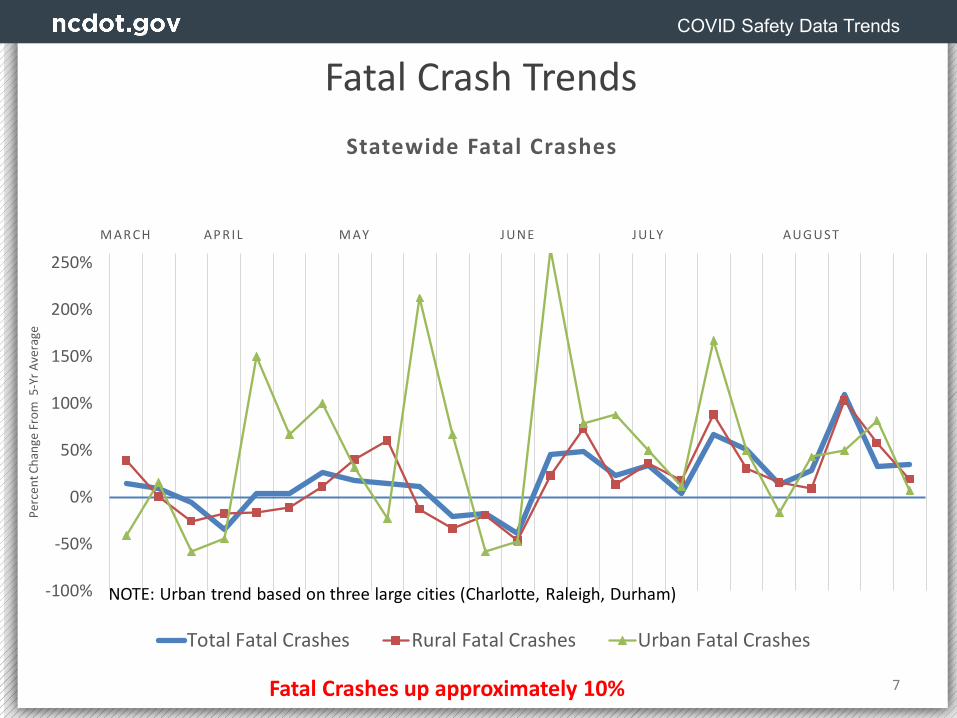
Fatal Crash Trends
-100%
-50%
0%
50%
100%
150%
200%
250%M AR CH AP R IL M AY JUNE JUL Y AUG UST
Perc
ent C
hang
e Fr
om 5
-Yr A
vera
ge
Statewide Fatal Crashes
Total Fatal Crashes Rural Fatal Crashes Urban Fatal Crashes
NOTE: Urban trend based on three large cities (Charlotte, Raleigh, Durham)
Fatal Crashes up approximately 10%
COVID Safety Data Trends
8
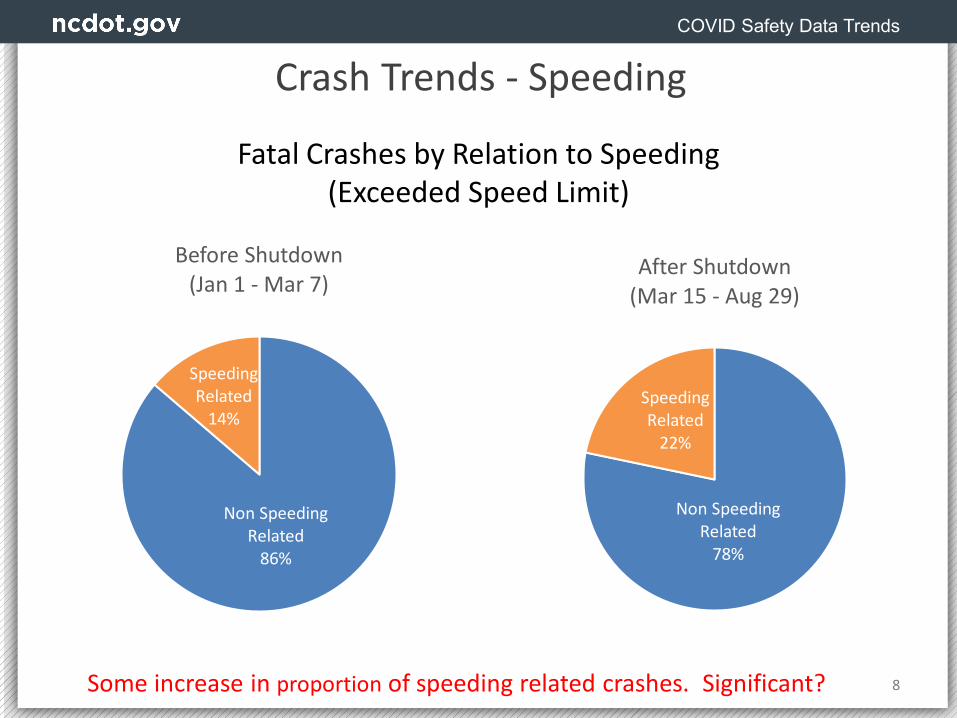
Crash Trends - Speeding
Fatal Crashes by Relation to Speeding (Exceeded Speed Limit)
Some increase in proportion of speeding related crashes. Significant?
Non Speeding Related
86%
Speeding Related
14%
Before Shutdown(Jan 1 - Mar 7)
Non Speeding Related
78%
Speeding Related
22%
After Shutdown(Mar 15 - Aug 29)

COVID Safety Data Trends
9
COVID Safety Data Trends - Summary• Significant reductions in total crashes (≈40%)
• Some increase in fatal crashes (≈10%)
• Much more analysis to come!!
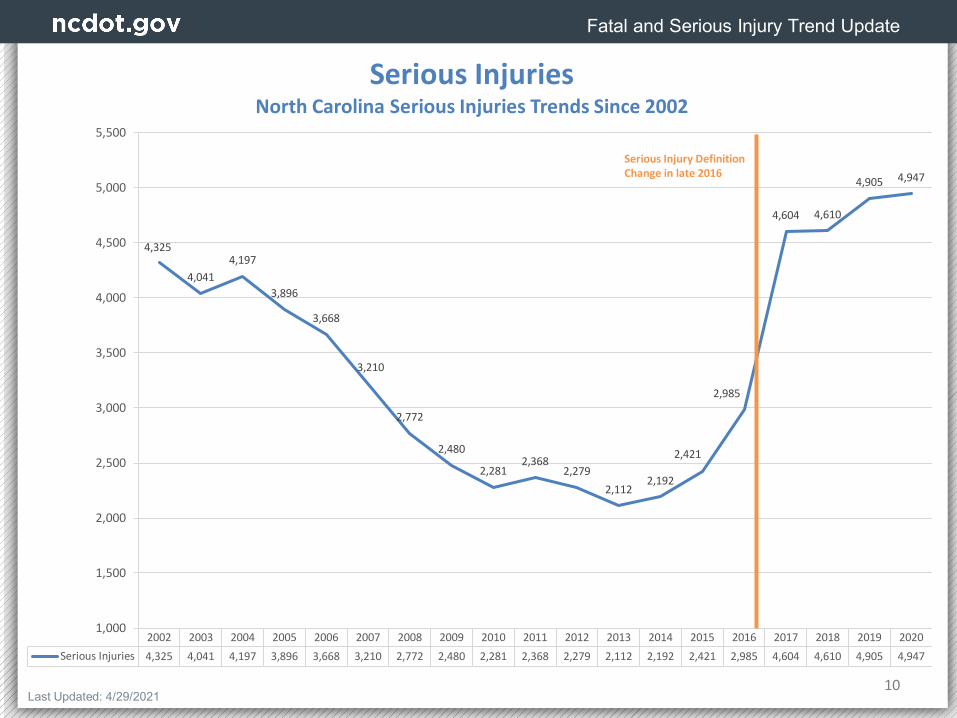
2002 2003 2004 2005 2006 2007 2008 2009 2010 2011 2012 2013 2014 2015 2016 2017 2018 2019 2020Serious Injuries 4,325 4,041 4,197 3,896 3,668 3,210 2,772 2,480 2,281 2,368 2,279 2,112 2,192 2,421 2,985 4,604 4,610 4,905 4,947
4,325
4,0414,197
3,896
3,668
3,210
2,772
2,480
2,2812,368
2,2792,112
2,192
2,421
2,985
4,604 4,610
4,905 4,947
1,000
1,500
2,000
2,500
3,000
3,500
4,000
4,500
5,000
5,500
Serious InjuriesNorth Carolina Serious Injuries Trends Since 2002
Fatal and Serious Injury Trend Update
10Last Updated: 4/29/2021
Serious Injury Definition Change in late 2016

Fatal and Serious Injury Trend Update
11
1,070
131154
260294
183
597
236
73 71 11
158
959
106134
195
255
137
579
214
8958 11
153
0
200
400
600
800
1,000
1,200
Total SeriousInjuries
YoungerDrivers (15-19)
Older Drivers(65+)
Driving WhileImpaired
IntersectionSafety
Alertness LaneDeparture
OccupantProtection
MotorcycleSafety
Pedestrians Bicyclists Speed
Year to Date (January-March)Serious Injuries
2020 2021Last Updated: 4/29/2021