Embed Size (px)
Citation preview
Preliminary Results
Year ending 31 December 2005
David Mann – ChairmanBarbara Merry - Chief Executive
Jamie MacDiarmid - Finance DirectorAdrian Walker - Active Underwriter
March 2006
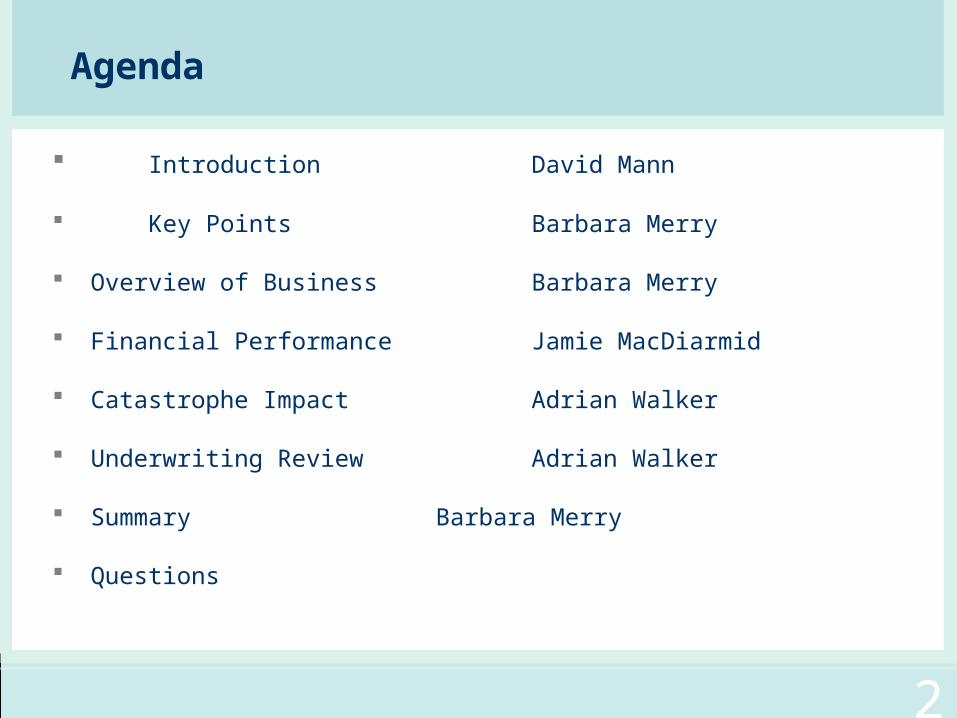
Agenda
Introduction David Mann
Key Points Barbara Merry
Overview of Business Barbara Merry
Financial Performance Jamie MacDiarmid
Catastrophe Impact Adrian Walker
Underwriting Review Adrian Walker
Summary Barbara Merry
Questions
2
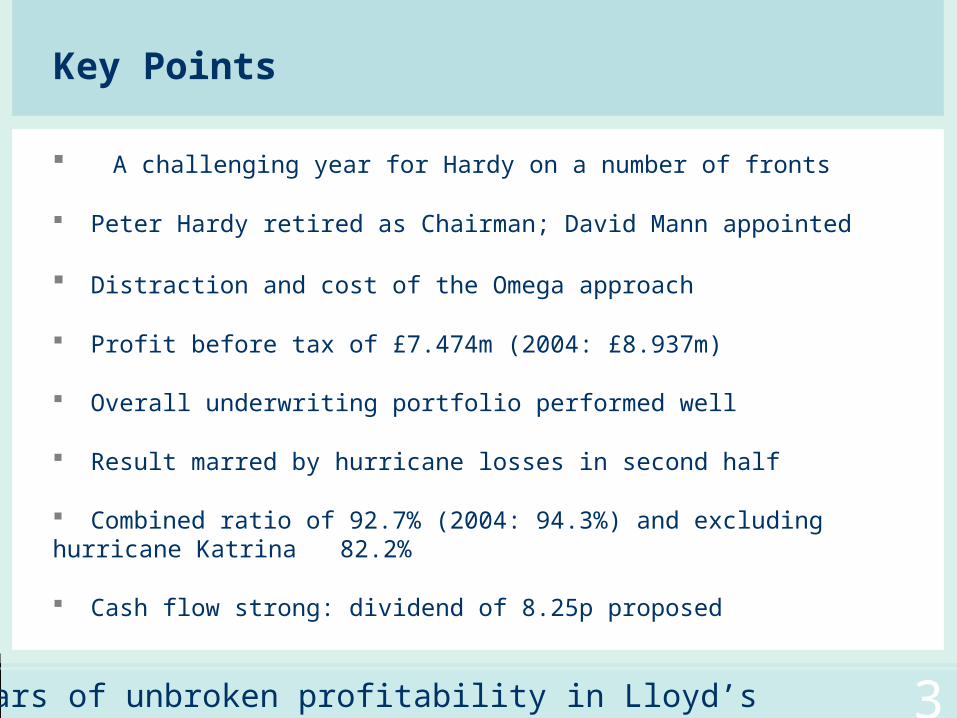
Key Points
A challenging year for Hardy on a number of fronts
Peter Hardy retired as Chairman; David Mann appointed
Distraction and cost of the Omega approach
Profit before tax of £7.474m (2004: £8.937m)
Overall underwriting portfolio performed well
Result marred by hurricane losses in second half
Combined ratio of 92.7% (2004: 94.3%) and excluding hurricane Katrina 82.2%
Cash flow strong: dividend of 8.25p proposed
29 years of unbroken profitability in Lloyd’s 3

Overview of Business
4
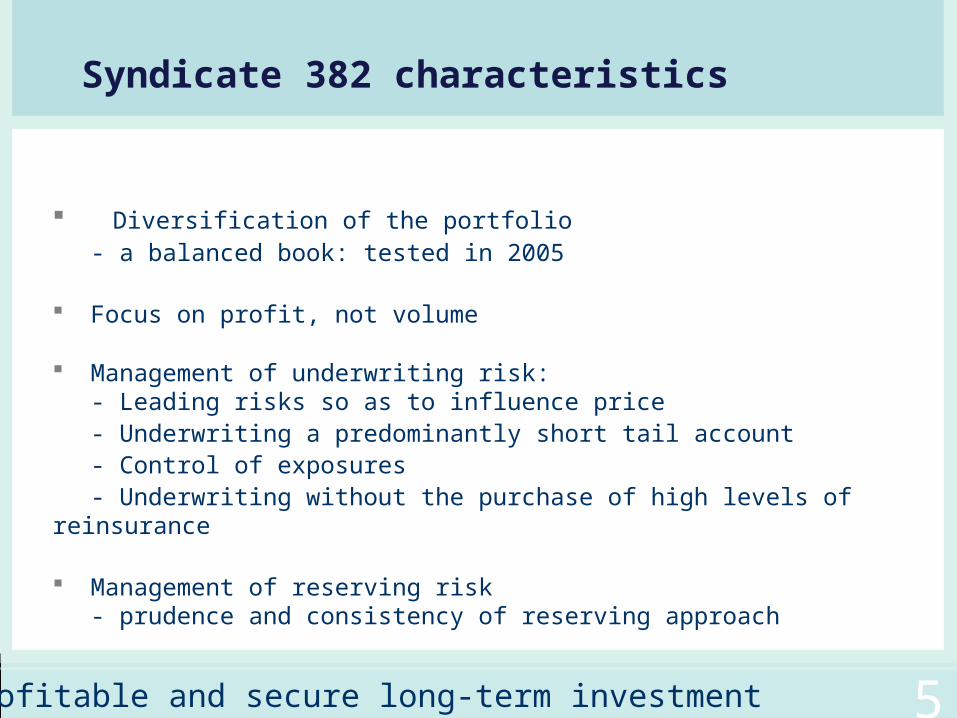
Syndicate 382 characteristics
a profitable and secure long-term investment 5
Diversification of the portfolio - a balanced book: tested in 2005
Focus on profit, not volume
Management of underwriting risk:- Leading risks so as to influence price- Underwriting a predominantly short tail account- Control of exposures- Underwriting without the purchase of high levels of reinsurance
Management of reserving risk - prudence and consistency of reserving approach
66first class security
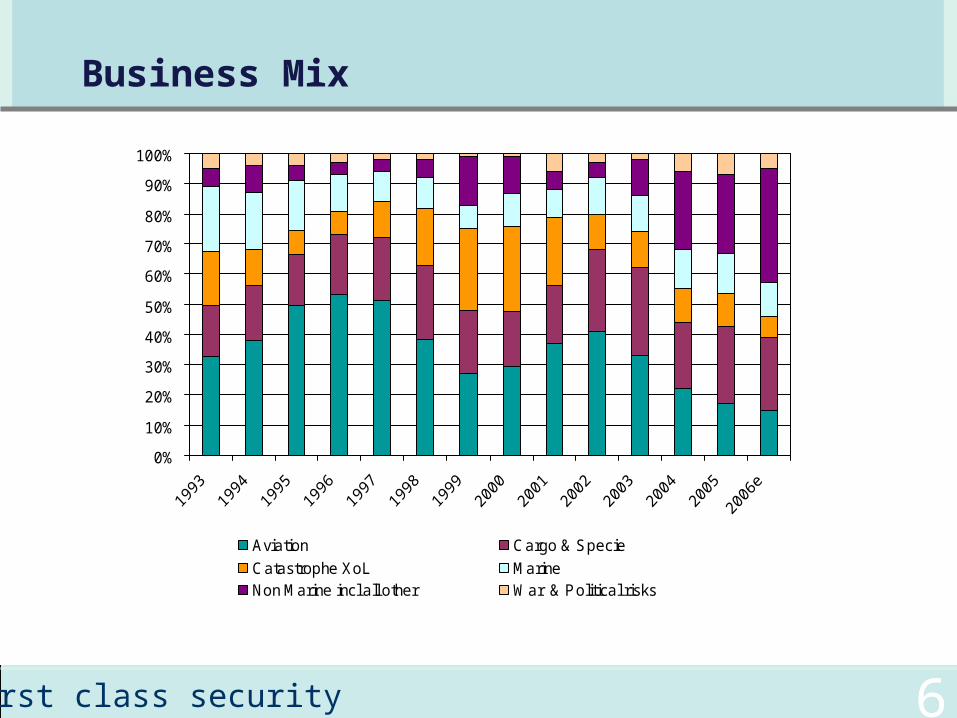
Business Mix
0%
10%
20%
30%
40%
50%
60%
70%
80%
90%
100%
Aviation Cargo & Specie
Catastrophe XoL MarineNon Marine incl all other War & Political risks
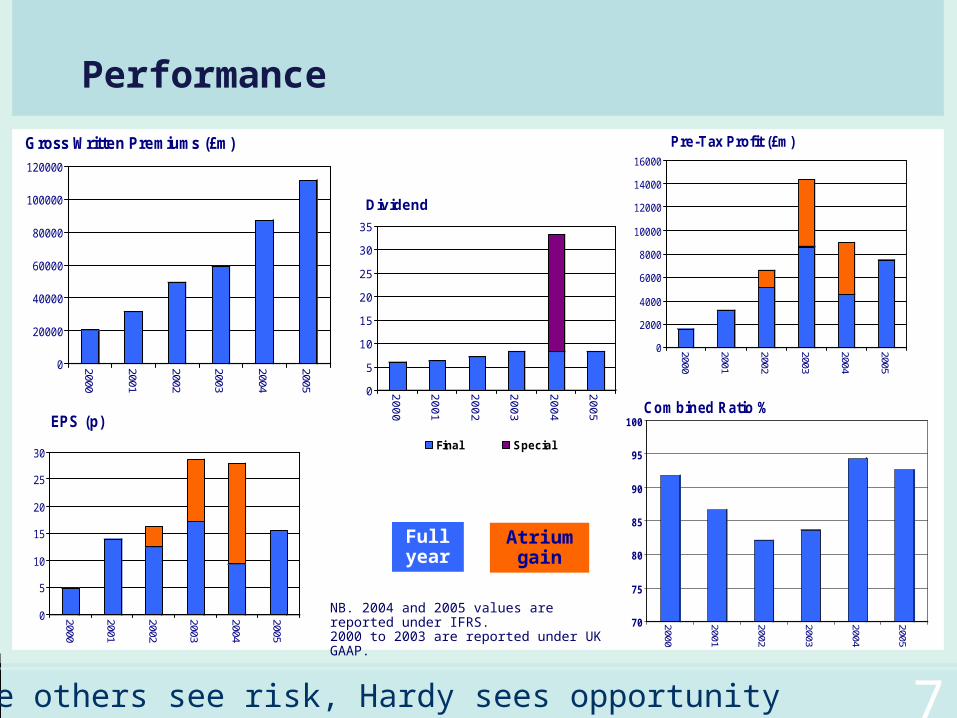
Performance
0
2000
4000
6000
8000
10000
12000
14000
16000
2000
2001
2002
2003
2004
2005
Pre-Tax Profit (£m)
Full year
Atrium gain
NB. 2004 and 2005 values are reported under IFRS. 2000 to 2003 are reported under UK GAAP.
0
20000
40000
60000
80000
100000
120000
2000
2001
2002
2003
2004
2005
Gross Written Premiums (£m)
0
5
10
15
20
25
30
35
20
00
20
01
20
02
20
03
20
04
20
05
Dividend
Final Special
70
75
80
85
90
95
100
2000
2001
2002
2003
2004
2005
Com bined Ratio %
0
5
10
15
20
25
30
2000
2001
2002
2003
2004
2005
EPS (p)
where others see risk, Hardy sees opportunity 7
Financial Performance
8
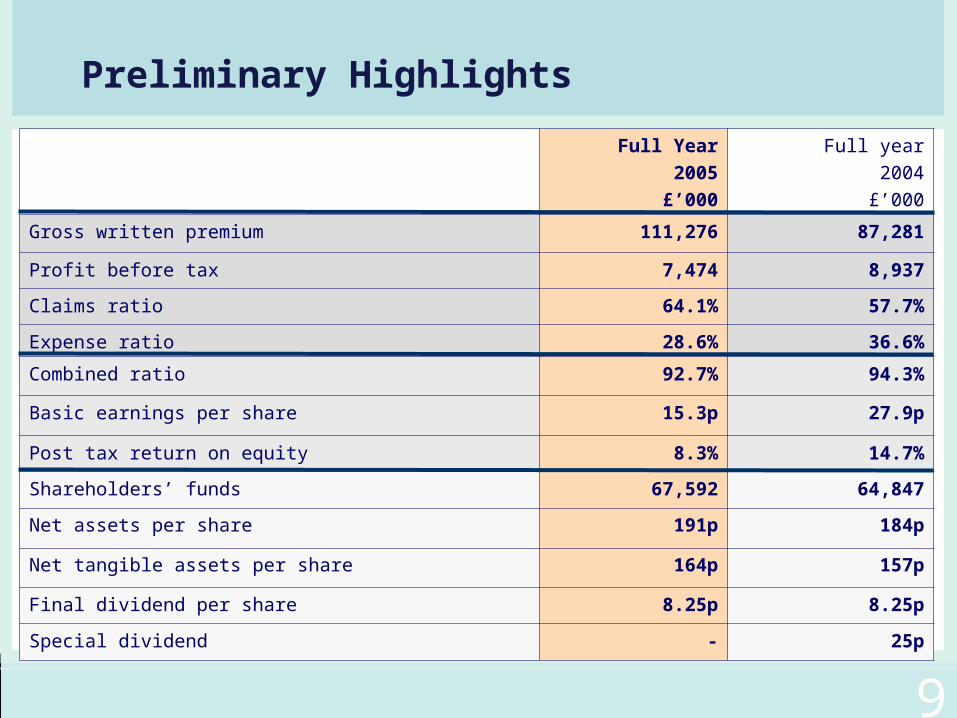
Preliminary Highlights
Full Year
2005
£’000
Full year
2004
£’000
Gross written premium 111,276 87,281
Profit before tax 7,474 8,937
Claims ratio 64.1% 57.7%
Expense ratio 28.6% 36.6%
Combined ratio 92.7% 94.3%
Basic earnings per share 15.3p 27.9p
Post tax return on equity 8.3% 14.7%
Shareholders’ funds 67,592 64,847
Net assets per share 191p 184p
Net tangible assets per share 164p 157p
Final dividend per share 8.25p 8.25p
Special dividend - 25p
9
Full Year 2005
£’000
Full Year2004£’000
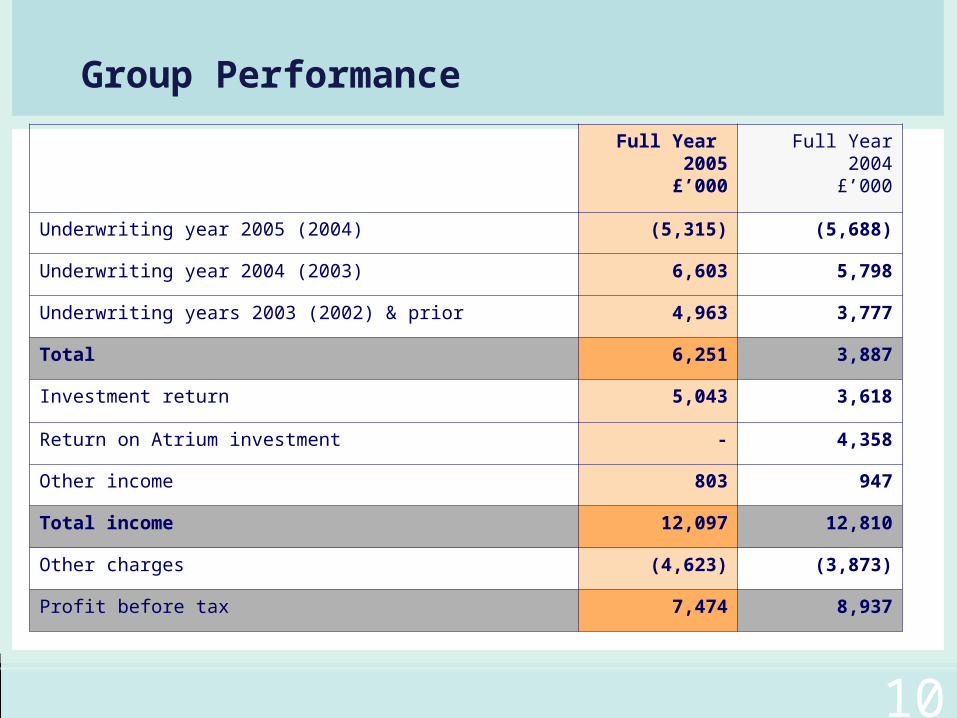
Underwriting year 2005 (2004) (5,315) (5,688)
Underwriting year 2004 (2003) 6,603 5,798
Underwriting years 2003 (2002) & prior 4,963 3,777
Total 6,251 3,887
Investment return 5,043 3,618
Return on Atrium investment - 4,358
Other income 803 947
Total income 12,097 12,810
Other charges (4,623) (3,873)
Profit before tax 7,474 8,937
Group Performance
10
31 December 2005
£’000
31 December 2004
£’000
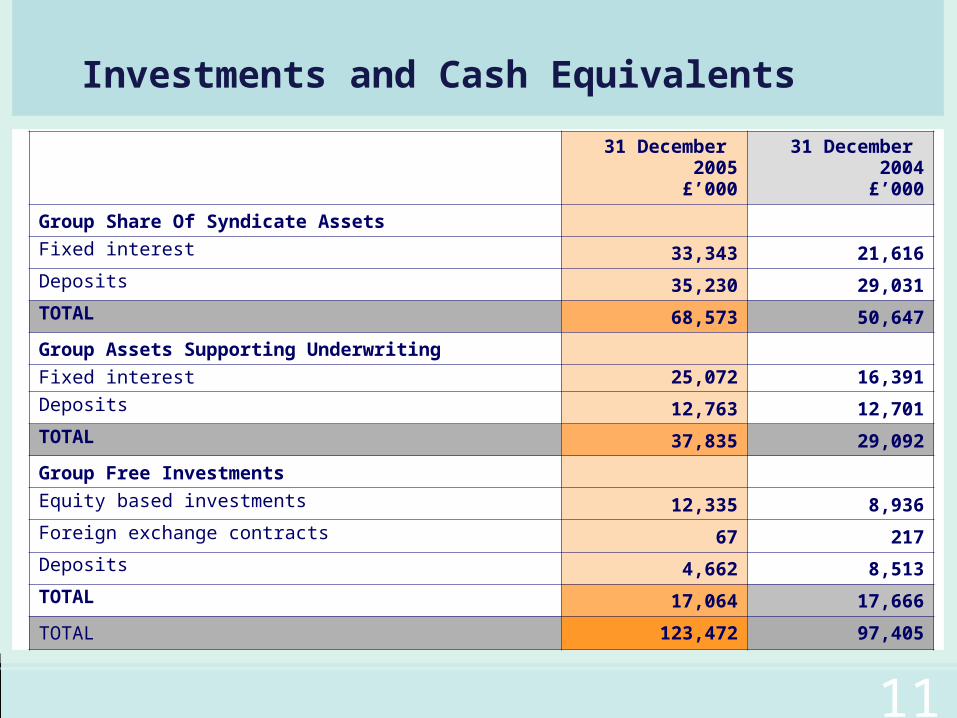
Group Share Of Syndicate Assets
Fixed interest 33,343 21,616
Deposits 35,230 29,031
TOTAL 68,573 50,647
Group Assets Supporting Underwriting
Fixed interest 25,072 16,391
Deposits 12,763 12,701
TOTAL 37,835 29,092
Group Free Investments
Equity based investments 12,335 8,936
Foreign exchange contracts 67 217
Deposits 4,662 8,513
TOTAL 17,064 17,666
TOTAL 123,472 97,405
Investments and Cash Equivalents
11

2005 Catastrophe Impact
12
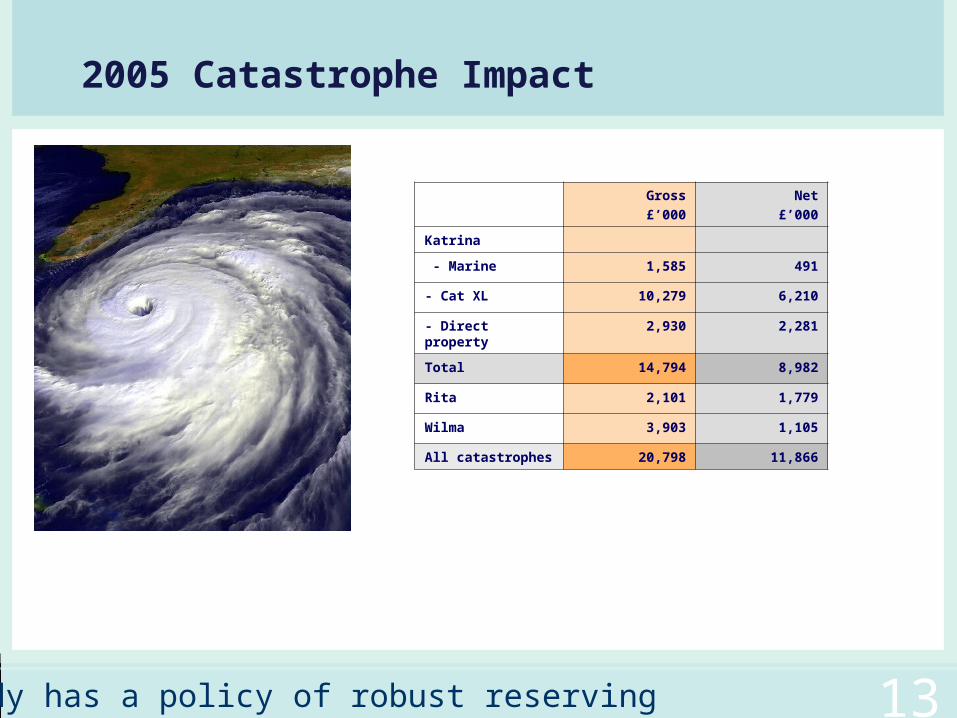
2005 Catastrophe Impact
Hardy has a policy of robust reserving 13
Gross
£’000
Net
£’000
Katrina
- Marine 1,585 491
- Cat XL 10,279 6,210
- Direct property 2,930 2,281
Total 14,794 8,982
Rita 2,101 1,779
Wilma 3,903 1,105
All catastrophes 20,798 11,866
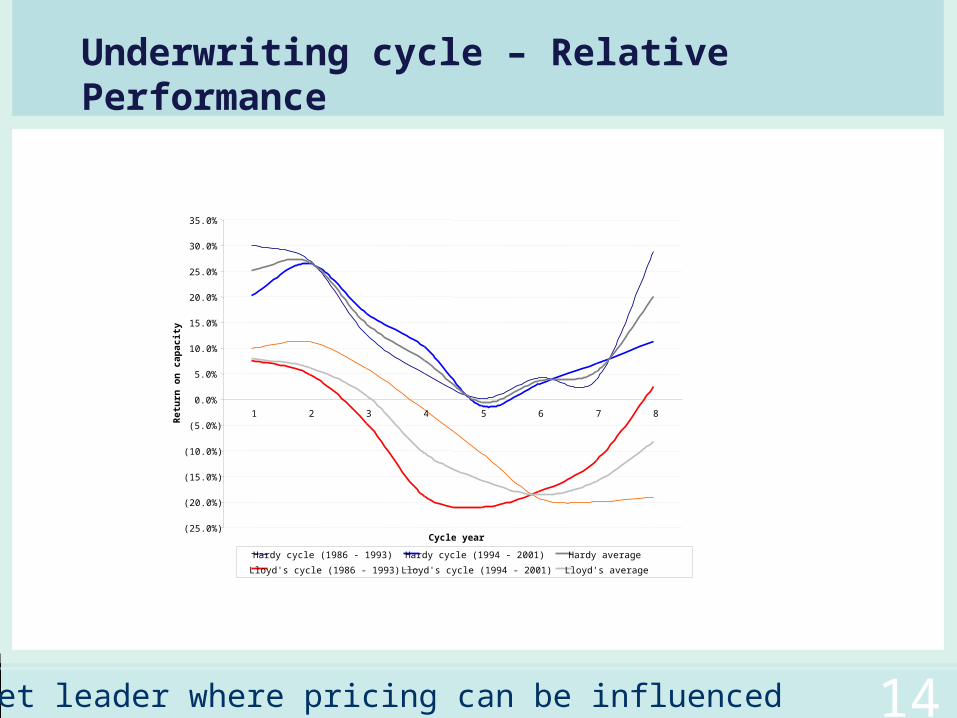
Underwriting cycle – Relative Performance
market leader where pricing can be influenced 14
(25.0%)
(20.0%)
(15.0%)
(10.0%)
(5.0%)
0.0%
5.0%
10.0%
15.0%
20.0%
25.0%
30.0%
35.0%
1 2 3 4 5 6 7 8
Cycle year
Ret
urn
on
cap
acit
y
Hardy cycle (1986 - 1993) Hardy cycle (1994 - 2001) Hardy average
Lloyd's cycle (1986 - 1993) Lloyd's cycle (1994 - 2001) Lloyd's average
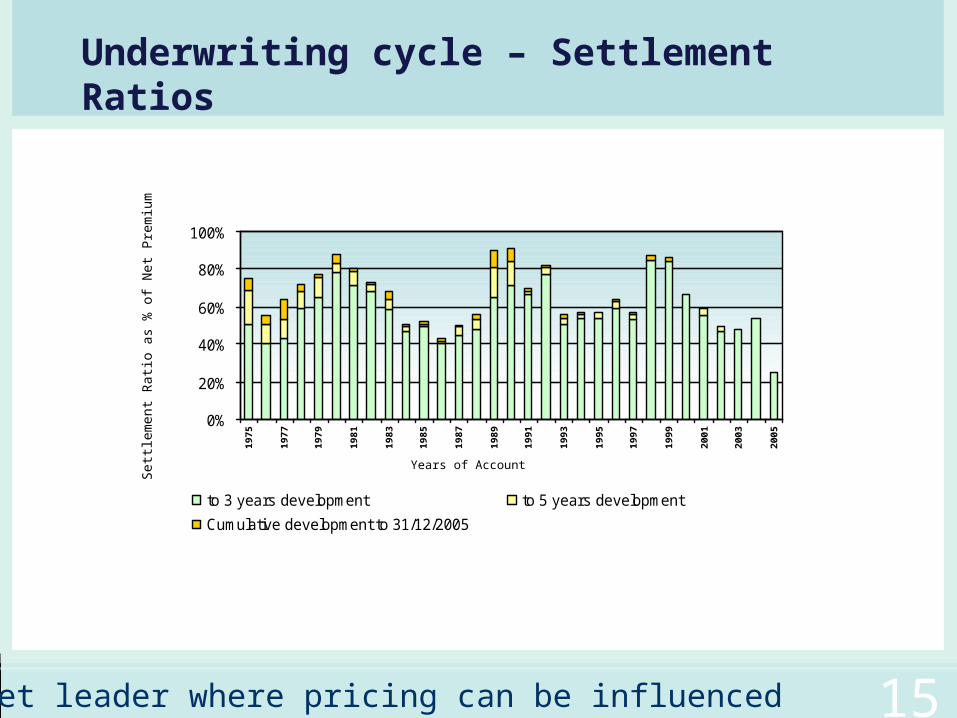
Underwriting cycle – Settlement Ratios
market leader where pricing can be influenced 15
0%
20%
40%
60%
80%
100%1
97
5
19
77
19
79
19
81
19
83
19
85
19
87
19
89
19
91
19
93
19
95
19
97
19
99
20
01
20
03
20
05
to 3 years development to 5 years development
Cumulative development to 31/12/2005
Set
tlem
ent R
atio
as
% o
f Net
Pre
miu
m
Years of Account

Underwriting Overview
16
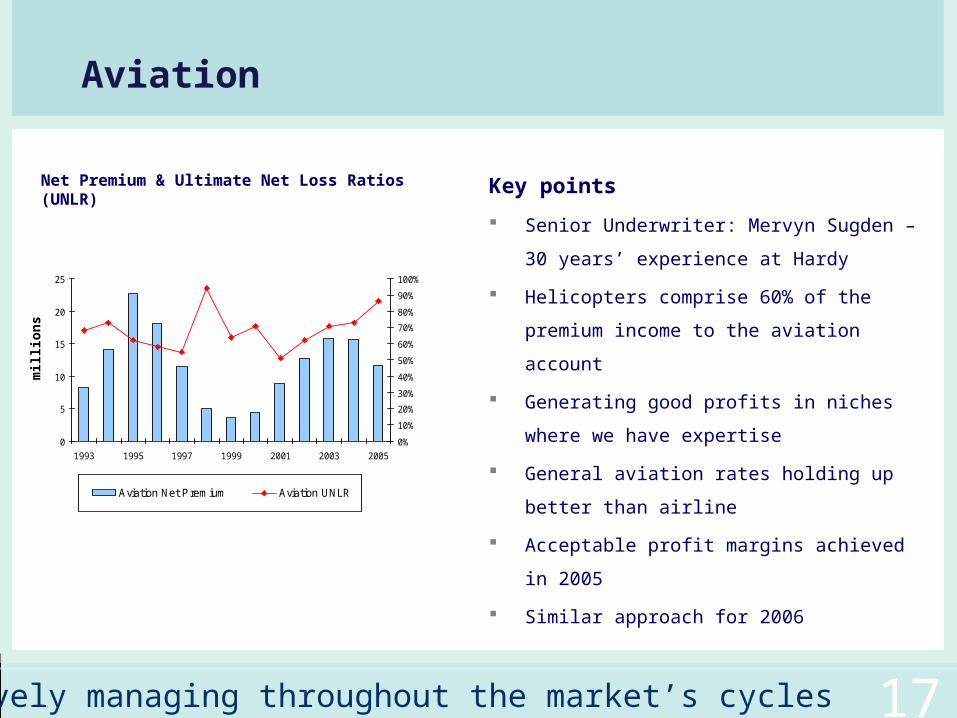
Key points
Senior Underwriter: Mervyn Sugden – 30 years’
experience at Hardy
Helicopters comprise 60% of the premium
income to the aviation account
Generating good profits in niches where we
have expertise
General aviation rates holding up better than
airline
Acceptable profit margins achieved in 2005
Similar approach for 2006
actively managing throughout the market’s cycles
Aviation
17
0
5
10
15
20
25
1993 1995 1997 1999 2001 2003 2005
0%
10%
20%
30%
40%
50%
60%
70%
80%
90%
100%
Aviation Net Premium Aviation UNLR
mill
ion
s
Net Premium & Ultimate Net Loss Ratios (UNLR)
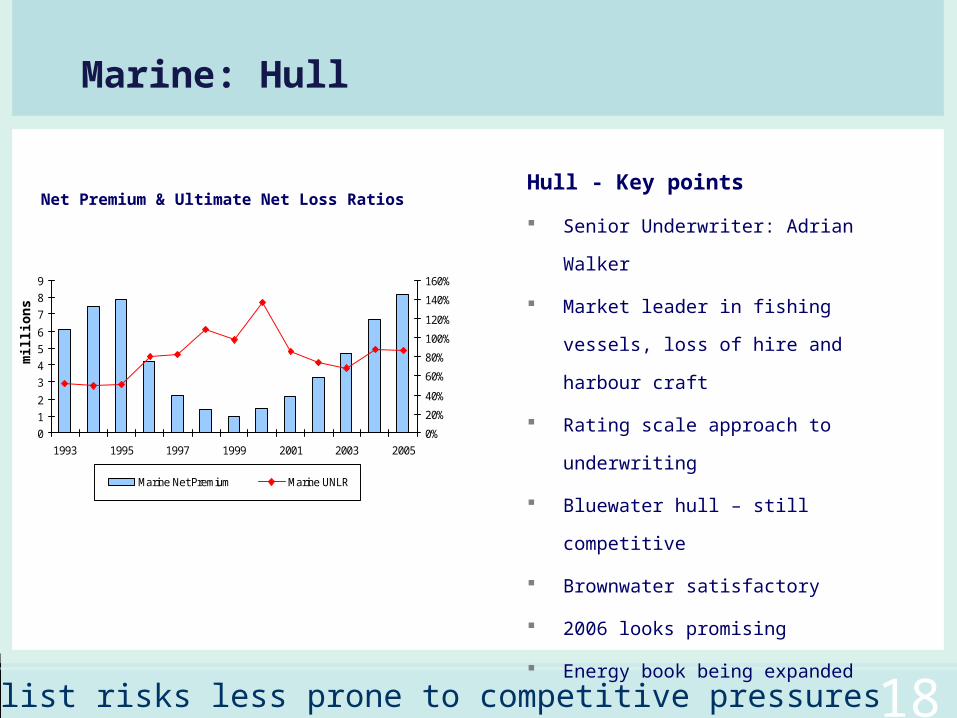
Hull - Key points
Senior Underwriter: Adrian Walker
Market leader in fishing vessels, loss of hire
and harbour craft
Rating scale approach to underwriting
Bluewater hull – still competitive
Brownwater satisfactory
2006 looks promising
Energy book being expanded
specialist risks less prone to competitive pressures 18
0
1
2
3
4
5
6
7
8
9
1993 1995 1997 1999 2001 2003 2005
0%
20%
40%
60%
80%
100%
120%
140%
160%
Marine Net Premium Marine UNLR
Marine: Hull
Net Premium & Ultimate Net Loss Ratios
mill
ion
s
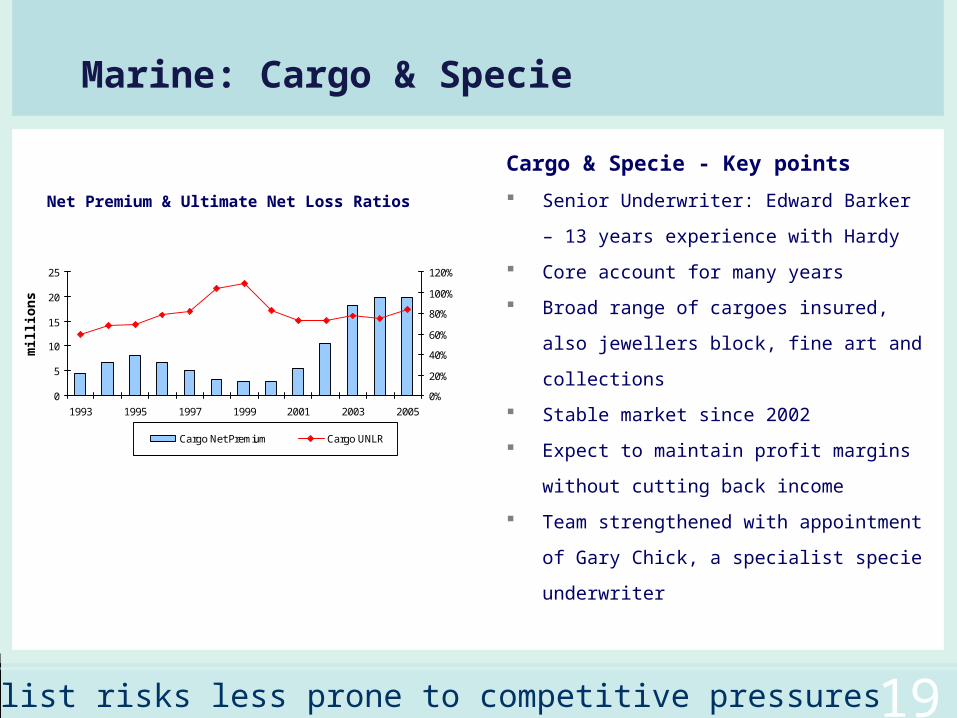
Net Premium & Ultimate Net Loss Ratios
Cargo & Specie - Key points
Senior Underwriter: Edward Barker – 13 years
experience with Hardy
Core account for many years
Broad range of cargoes insured, also jewellers
block, fine art and collections
Stable market since 2002
Expect to maintain profit margins without
cutting back income
Team strengthened with appointment of Gary
Chick, a specialist specie underwriter
specialist risks less prone to competitive pressures 19
Marine: Cargo & Specie
0
5
10
15
20
25
1993 1995 1997 1999 2001 2003 2005
0%
20%
40%
60%
80%
100%
120%
Cargo Net Premium Cargo UNLR
mill
ion
s
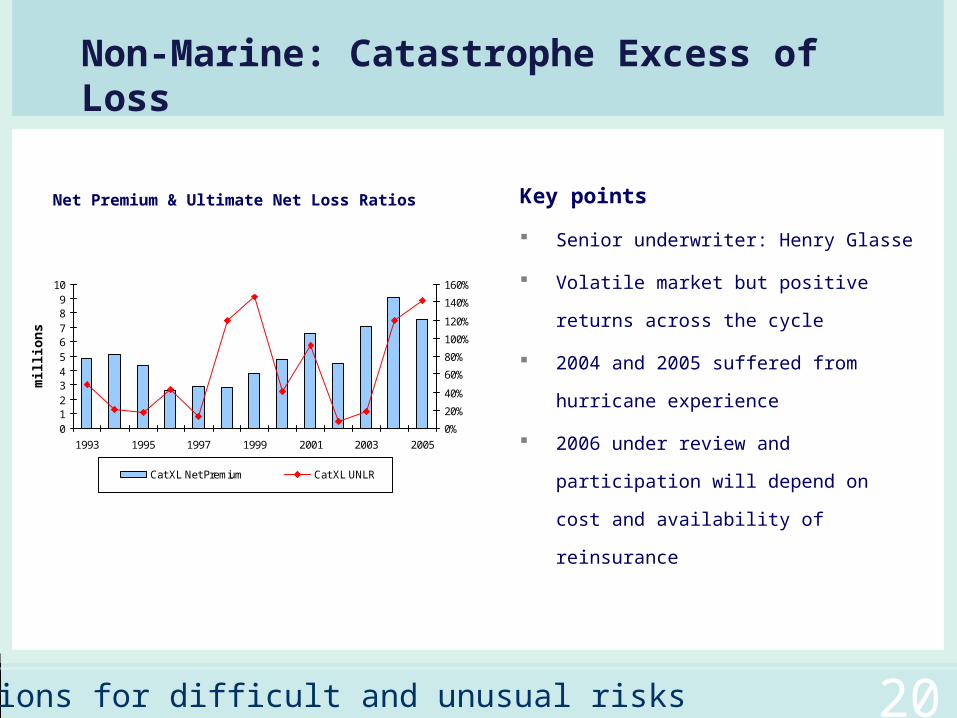
Net Premium & Ultimate Net Loss Ratios Key points
Senior underwriter: Henry Glasse
Volatile market but positive returns across
the cycle
2004 and 2005 suffered from hurricane
experience
2006 under review and participation will
depend on cost and availability of
reinsurance
Non-Marine: Catastrophe Excess of Loss
20
0123456789
10
1993 1995 1997 1999 2001 2003 2005
0%
20%
40%
60%
80%
100%
120%
140%
160%
Cat XL Net Premium Cat XL UNLR
mill
ion
s
solutions for difficult and unusual risks
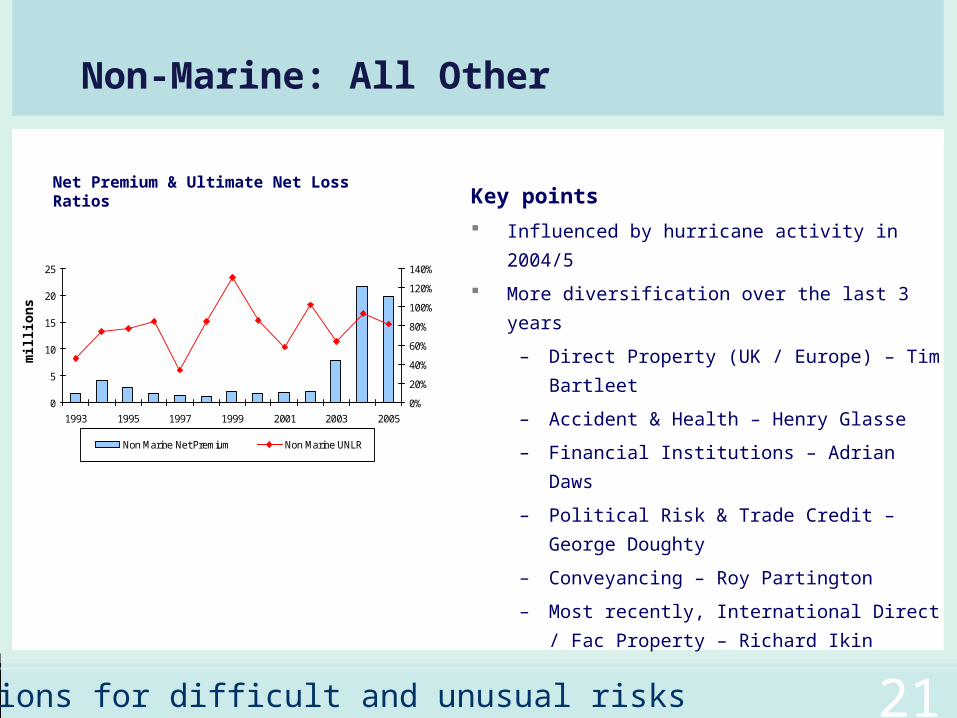
Key points
Influenced by hurricane activity in 2004/5
More diversification over the last 3 years
– Direct Property (UK / Europe) – Tim Bartleet
– Accident & Health – Henry Glasse
– Financial Institutions – Adrian Daws
– Political Risk & Trade Credit – George Doughty
– Conveyancing – Roy Partington
– Most recently, International Direct / Fac
Property – Richard Ikin
Non-Marine: All Other
21
0
5
10
15
20
25
1993 1995 1997 1999 2001 2003 2005
0%
20%
40%
60%
80%
100%
120%
140%
Non Marine Net Premium Non Marine UNLR
mill
ion
s
solutions for difficult and unusual risks
Net Premium & Ultimate Net Loss Ratios
Summary
22

2006 underwriting capacity £110m: if market changes, we will write more
Operational review completed following appointment of new Chairman
Continue to seek new niche lines to strengthen business and diversify underwriting
portfolio - international direct and facultative property account recently added
Will now also work on improving the efficiency of the existing book of business
Line sizes will be increased where we have a strong market footprint
Market is competitive but not irrational in pricing terms so opportunities for
managed growth exist
Hardy’s balance sheet is strong and will support growth
Summary
experts in pricing risk with focus on profit not volume 23
Executive directors
Non-executive directors
Strong reserves
Business led by Hardy
Appendices
24
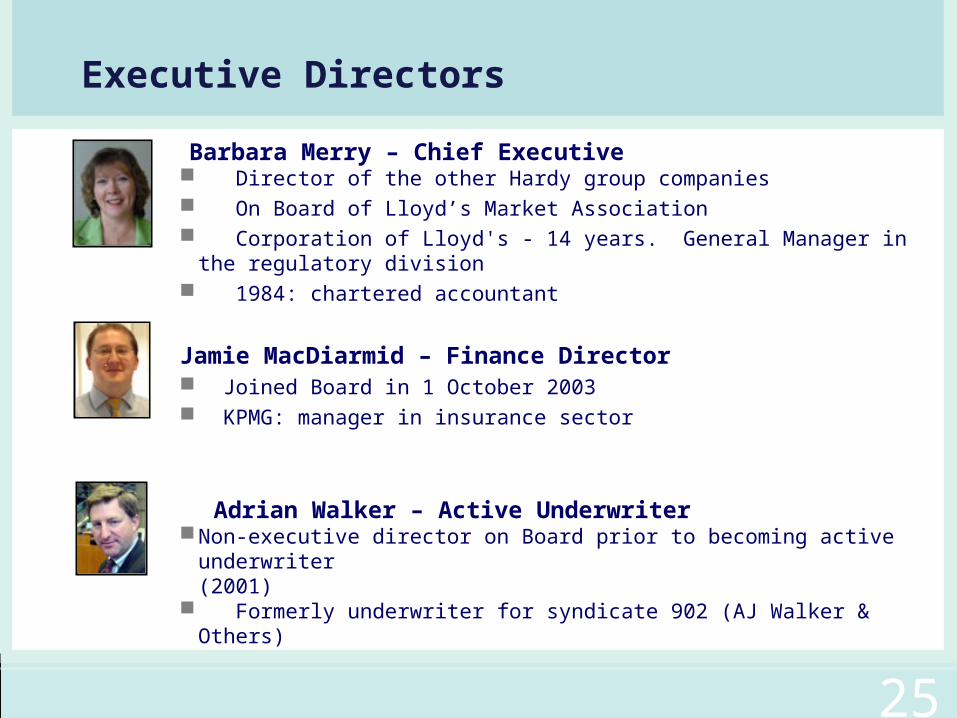
Barbara Merry – Chief Executive Director of the other Hardy group companies On Board of Lloyd’s Market Association Corporation of Lloyd's - 14 years. General Manager in the regulatory division 1984: chartered accountant
Jamie MacDiarmid – Finance Director Joined Board in 1 October 2003 KPMG: manager in insurance sector
Adrian Walker – Active UnderwriterNon-executive director on Board prior to becoming active underwriter
(2001) Formerly underwriter for syndicate 902 (AJ Walker & Others)
Executive Directors
25
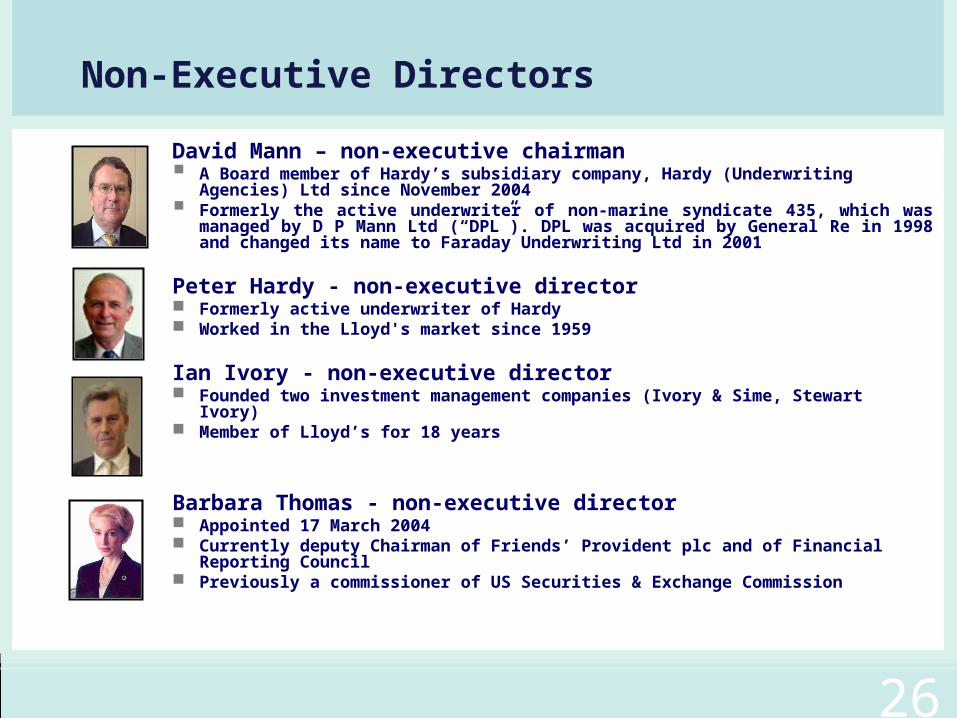
David Mann – non-executive chairman A Board member of Hardy’s subsidiary company, Hardy (Underwriting Agencies)
Ltd since November 2004 Formerly the active underwriter of non-marine syndicate 435, which was managed
by D P Mann Ltd (“DPL”). DPL was acquired by General Re in 1998 and changed its name to Faraday Underwriting Ltd in 2001
Peter Hardy - non-executive director Formerly active underwriter of Hardy Worked in the Lloyd's market since 1959
Ian Ivory - non-executive director Founded two investment management companies (Ivory & Sime, Stewart Ivory) Member of Lloyd’s for 18 years
Barbara Thomas - non-executive director Appointed 17 March 2004 Currently deputy Chairman of Friends’ Provident plc and of Financial Reporting
Council Previously a commissioner of US Securities & Exchange Commission
Non-Executive Directors
26
Strong Reserves
27
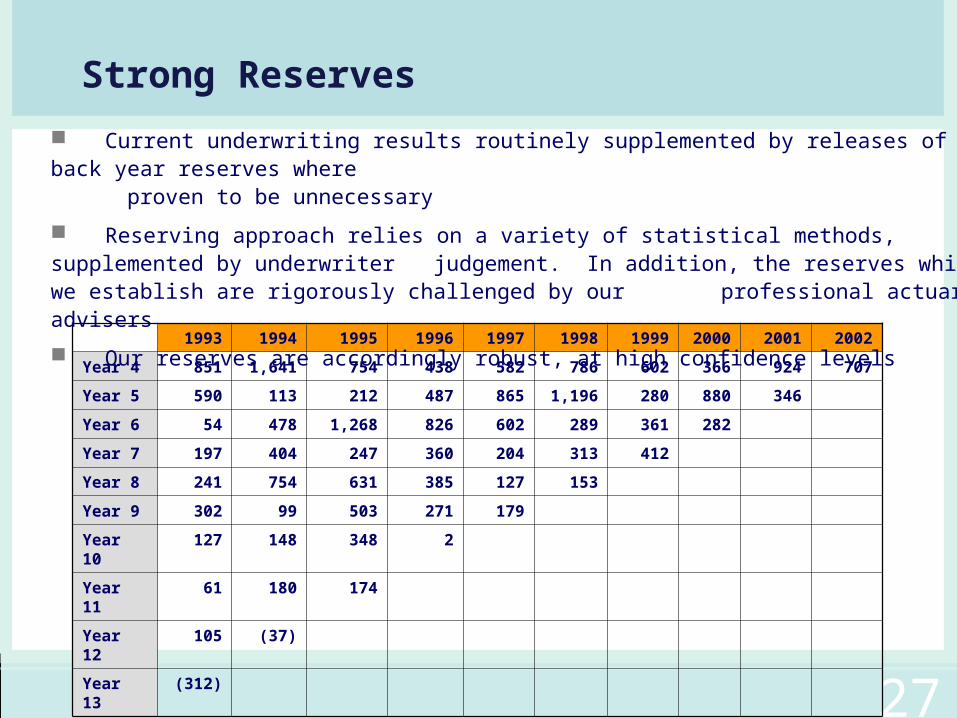
1993 1994 1995 1996 1997 1998 1999 2000 2001 2002
Year 4 851 1,641 754 438 582 786 602 366 924 707
Year 5 590 113 212 487 865 1,196 280 880 346
Year 6 54 478 1,268 826 602 289 361 282
Year 7 197 404 247 360 204 313 412
Year 8 241 754 631 385 127 153
Year 9 302 99 503 271 179
Year 10 127 148 348 2
Year 11 61 180 174
Year 12 105 (37)
Year 13 (312)
Current underwriting results routinely supplemented by releases of back year reserves where proven to be unnecessary
Reserving approach relies on a variety of statistical methods, supplemented by underwriter judgement. In addition, the reserves which we establish are rigorously challenged by our professional actuarial advisers
Our reserves are accordingly robust, at high confidence levels
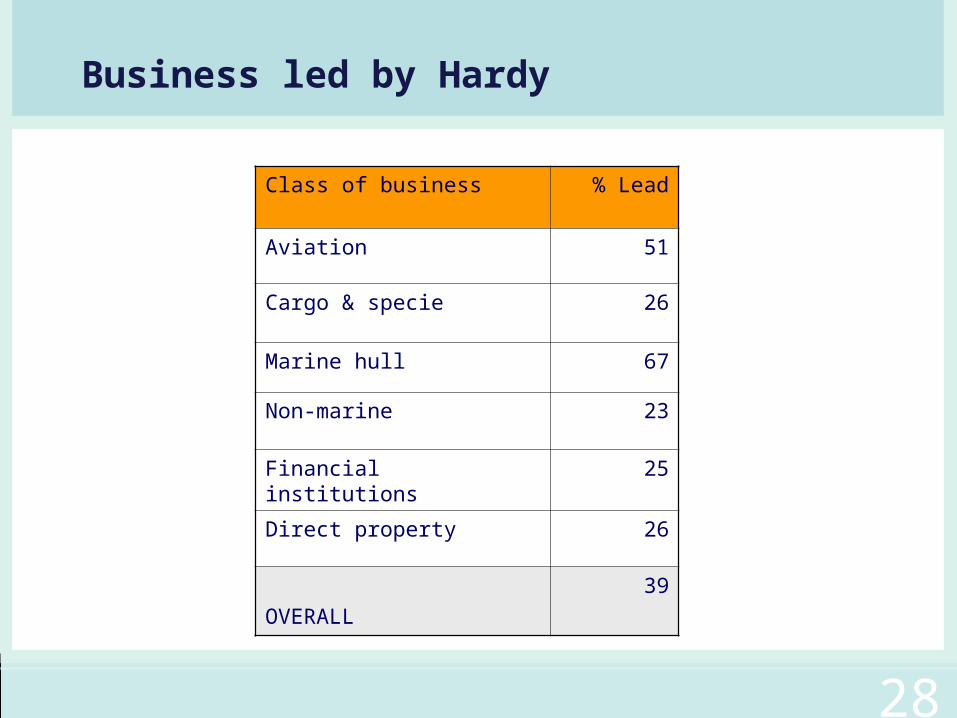
Class of business % Lead
Aviation 51
Cargo & specie 26
Marine hull 67
Non-marine 23
Financial institutions 25
Direct property 26
OVERALL
39
Business led by Hardy
28