Embed Size (px)
Citation preview
150
Preliminary geochemical analysis of surface and groundwater in Cripple Creek, a tributary to Otsego Lake, Otsego Co., New York
Andrew R. Fetterman* and Bryan Burgin**
INTRODUCTION
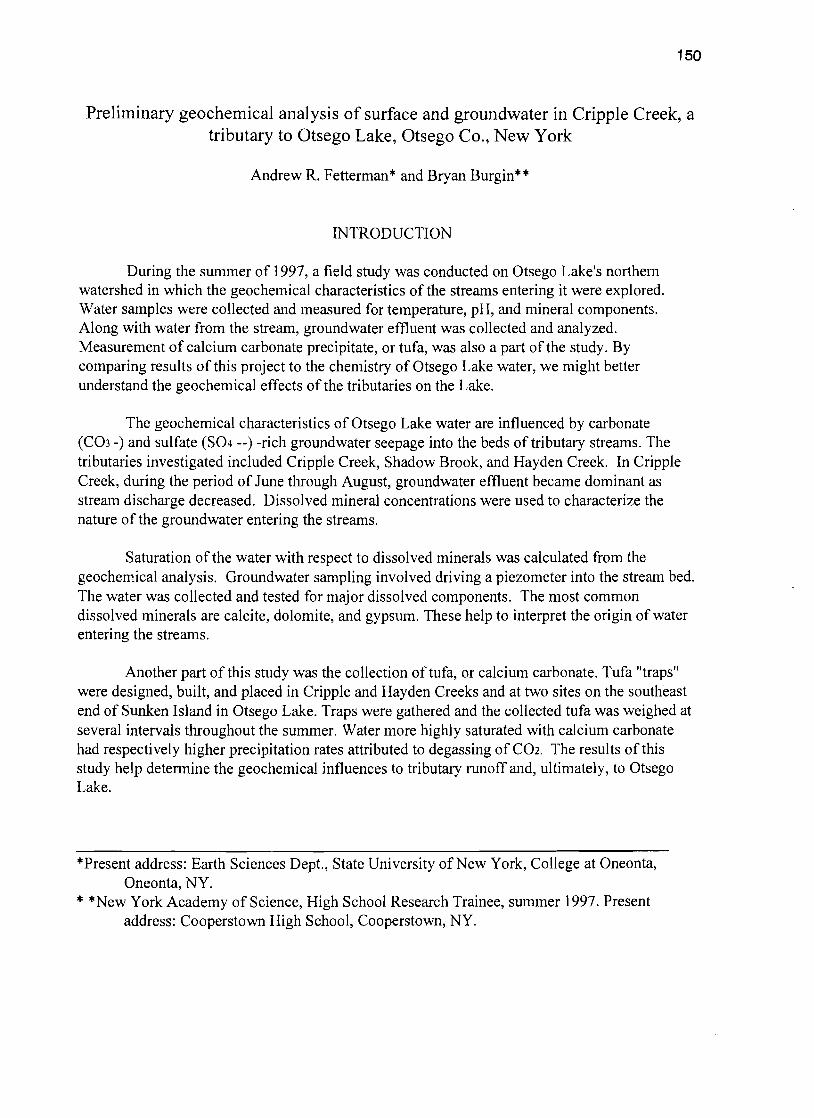
During the summer of 1997, a field study was conducted on Otsego Lake's northern watershed in which the geochemical characteristics of the streams entering it were explored. Water samples were collected and measured for temperature, pH, and mineral components. Along with water from the stream, groundwater effluent was collected and analyzed. Measurement of calcium carbonate precipitate, or tufa, was also a part of the study. By comparing results of this project to the chemistry of Otsego Lake water, we might better understand the geochemical effects of the tributaries on the Lake.
The geochemical characteristics of Otsego Lake water are influenced by carbonate (C03 -) and sulfate (S04 --) -rich groundwater seepage into the beds of tributary streams. The tributaries investigated included Cripple Creek, Shadow Brook, and Hayden Creek. In Cripple Creek, during the period of June through August, groundwater effluent became dominant as stream discharge decreased. Dissolved mineral concentrations were used to characterize the nature of the groundwater entering the streams.
Saturation of the water with respect to dissolved minerals was calculated from the geochemical analysis. Groundwater sampling involved driving a piezometer into the stream bed. The water was collected and tested for major dissolved components. The most common dissolved minerals are calcite, dolomite, and gypsum. These help to interpret the origin of water entering the streams.
Another part of this study was the collection oftufa, or calcium carbonate. Tufa "traps" were designed, built, and placed in Cripple and Hayden Creeks and at two sites on the southeast end of Sunken Island in Otsego Lake. Traps were gathered and the collected tufa was weighed at several intervals throughout the summer. Water more highly saturated with calcium carbonate had respectively higher precipitation rates attributed to degassing of C02. The results of this study help detennine the geochemical influences to tributary runoff and, ultimately, to Otsego Lake.
*Present address: Earth Sciences Dept., State University of New York, College at Oneonta, Oneonta, NY.
* *New York Academy of Science, High School Research Trainee, summer 1997. Present address: Cooperstown High School, Cooperstown, NY.
151
NATURE OF STUDYAREA
Physiography The study area is located in central New York State in the eastern Allegheny Plateau
physiographic province. The Allegheny Plateau consists of clastic sedimentary rocks deposited during the Paleozoic Era that have since been uplifted. The bedrock in the study area has a regional dip of 1 degree to the southwest. The plateau is dissected by dendritic steam valleys that were modified during Wisconsinan glaciation (Rickard and Zenger, 1964).
During the onslaught of Quaternary glacial processes,. valleys were deepened and then partially filled with large accumulations of unconsolidated materials. Due to the nature of glaciation of the area, some deposits are composed mostly of distal materials (drift carried along through valley ice tongues extending south from the Mohawk Valley Glaciers) yet others are of local origin (Fleisher, 1991). Otsego Lake exists within a glacially over-deepened through-valley with its long axis sUb-parallel to valley walls.
Bedrock Geology The Allegheny Plateau consists of middle Paleozoic sedimentary rocks including shales,
sandstones and limestones. The bedrock of the Otsego Lake basin is composed of early to middle Devonian rocks. There is a trend from north to south of carbonate-rich to carbonate-poor rocks in the drainage basin. Refer to Pijnenburg (1991) or Komorowski (1994) for a generalized geologic map of the watershed and other surrounding areas. General stratigraphy of the area local to Otsego Lakes is as follows (from older to younger and north to south): Onondaga Limestone, Union Springs Shale, Chittenengo Shale, Otsego Shale, Sollsville Sandstone, Panther Mt. Formation, and Cooperstown Shale (Rickard and Zenger, 1964).
Unconsolidated Sediments Overburden in the study area is comprised of glacial drift deposited during the mid-to-Iate
Wisconsinan deglaciation (Fleisher, 1991). In the northern section of the study area, glaciofluvial and prog1acio-Iacustrine deposits are found on valley floors and along lower valley walls adjacent to and within stream beds. These sediments include a steel-gray, carbonate-poor (8.4%) (Yuretich, 1982), paleo-lacustrine clay which indicate a previous lake stand 17 meters (-55 ft) above present lake level (Fleisher, 1997). Yuretich recognized steel-gray clay deposits underneath (down to 0.3 meters below) present lake sediments from short cores along the western shore and in other parts of the basin and recognized the presence of similar clays in the northern tributary basins.
Seismic profiles of the lake sediments ( Fleisher et al., 1992; Halfman and Fetterman, 1998) and short sediment cores of the lake bottom (Yuretich, 1982) have revealed rhythmic, sedimentary packages of clays and fine sediments mantling coarse, gravely sediments around Sunken Island to thicknesses greater than 25 m. Throughout the lake organic-rich calcareous marls cover practically all parts of the lake bottom. Geochemical evidence, described below, suggests the deposition of these calcareous marls is controlled by solubility relationships.
Carbonate-rich sediments mantle carbonate bedrock in the northern portions of the lake valley (Komorowski, 1994; Stein, 1997). In the Shadow Brook basin, stream water is in direct
'152
contact with the Onondaga Limestone in addition to carbonate rich glacial drift. Incised tributaries in the southern portions of Otsego Lake basin are in contact primarily with carbonatepoor bedrock, having less contact with glacial material.
METHODS
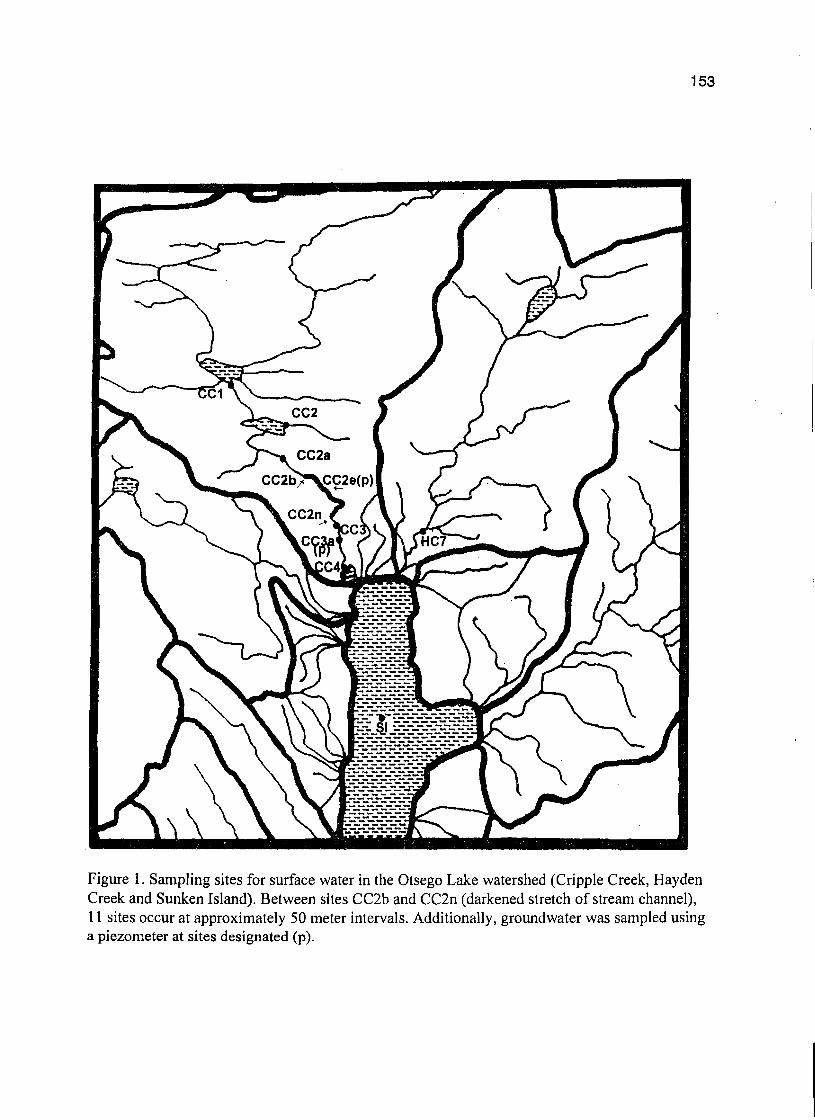
Water collection sites on the Otsego Lake drainage basin were established prior to this study (Heavy, 1995) (see location map, Figure 1). Sites CC2a through CC2n and CC3a were added to increase distribution of sampling sites. Sites CC2b through CC2n (excluding CC3d) were located between sites CC2a and CC3 at approximately 50 meter intervals. Successive site locations downstream from a numbered site are designated by letters. For example, site CC2a is the next site located downstream from the original site CC2. Spring sites are appropriately labeled with the prefix "sp" and peizometer samples are assigned the prefix ''p''. Sites not labeled with prefixes represent locations where stream water samples were taken.
The site "Spring Hole" (CC2e), located between CC2d and CC2f, is a small pond (-50 meters across) with temperatures ranging between 7°_16° C in August and has a silty-sand, granular marl bottom. Water temperature was used to locate effluent springs, although this physical property is limited to summer conditions when surface water is notably warmer than groundwater. During warm summer days and low-flow periods, cold groundwater seeps can easily be located by feeling with the palm and fingers in addition to a hand held thermometer.
Piezometers were used to locate and collect groundwater effluent into streams. These were made from iron water pipe from 1 3/4 to 2 inches (4.5-5.0 em) in diameter and about six feet (2 m) in length. Holes 1/4 inch (0.7 cm) in diameter were drilled every 1 inch (2.5 cm) on the lower 12 inches (30 cm) of the pipe and the end was refined into a point and welded. The top was capped with a removable lid and the pipe was driven approximately 3 feet (1 m) into the stream bed, sometimes further, depending on the underlying material. Piezometers were placed and monitored at 2 sites on Cripple Creek including the "Spring Hole"(CC2ep), and site CC3ap. A Nalgene hand pump was used to remove water from within the pipe. Collection of water from the pipes included pumping the water for 15 minutes or until water temperature stabilized within the pipe. A water sample was then collected and pH and temperature were recorded. Both the water from these pipes and from the stream sites themselves were sampled weekly throughout the summer.
Temperature and pH were measured at eachsite using a Beckman 200 pH meter. The samples were labeled, chilled on ice, and taken back to the lab and analyzed for alkalinity, chloride, calcium, magnesium, and sulfate (APHA, 1989). Alkalinity was determined by titration using 0.02 normal HCl following appropriate endpoint pH values. Chloride was determined by mercuric nitrate titration. Calcium was determined by titrimetric, EDTA method. Magnesium was calculated from total hardness titrimetric, EDTA method. Sulfate was determined from the turbidimetric method using a "Milton-Roy" 501 spectrophotometer.
Chemical data were entered into SI (Saturation Index), a computer program designed for determining saturation equilibria of dissolved minerals and for aqueous-chemical modeling
153
Figure 1. Sampling sites for surface water in the Otsego Lake watershed (Cripple Creek, Hayden Creek and Sunken Island). Between sites CC2b and CC2n (darkened stretch of stream channel), 11 sites occur at approximately 50 meter intervals. Additionally, groundwater was sampled using a piezometer at sites designated (P).
154
(Palmer, 1994). Saturation Index is calculated using the formula (2in)10g(IAPIK) where n is the number of ions produced by any dissolved mineral and the ion activity product (lAP) is divided by the solubility product (K). A positive value reflects supersaturation while a negative value is undersaturated with respect to the equilibria of the dissolved mineral. The SI program calculates saturation equilibria of aragonite, calcite, dolomite, and gypsum. PC02 (equilibrium partial pressure of C02) was also calculated.
Tufa collection was another aspect of this project. Tufa traps were placed at various sites along Cripple Creek (CCSH, CC3D, Hayden Creek (HC7), and at two sites on the southeastern side of Sunken Island in Otsego Lake (SISE3m, SISE12m). Traps in Otsego Lake were suspended 0.5 meters from the lake bottom in 3 meters and in 12 meters of water. The traps were constructed from a plastic photo film canister with four "windows" cut out to allow water flow through the trap. Each was fitted with either a copper or glass slide, the intended medium on which calcium carbonate (tufa) would precipitate. The pre-measured copper and glass slides were dried at 125 0 for 6 hours, cooled in a desecator, and weighed. One of each was placed in a prepared and labeled canister and a string was tied to prevent the slide from falling out. Six copper-glass pairs were anchored at the sites and pairs were collected at one-, two-, and four-week intervals during the summer. The remainder of the pairs will be collected at two-, six-, and twelve-month intervals during the next year for additional study. The collected slides were dried at 1250 C to 1400 C for approximately 24 hours and the slides were then weighed and recorded to establish accumulation rates in gramsimeter2iday.
Data from the July and August sampling were used for graphs and comparisons to illustrate dissolved mineral components in the water during base flow conditions of tributary runoff (Albright, 1996).
RESULTS
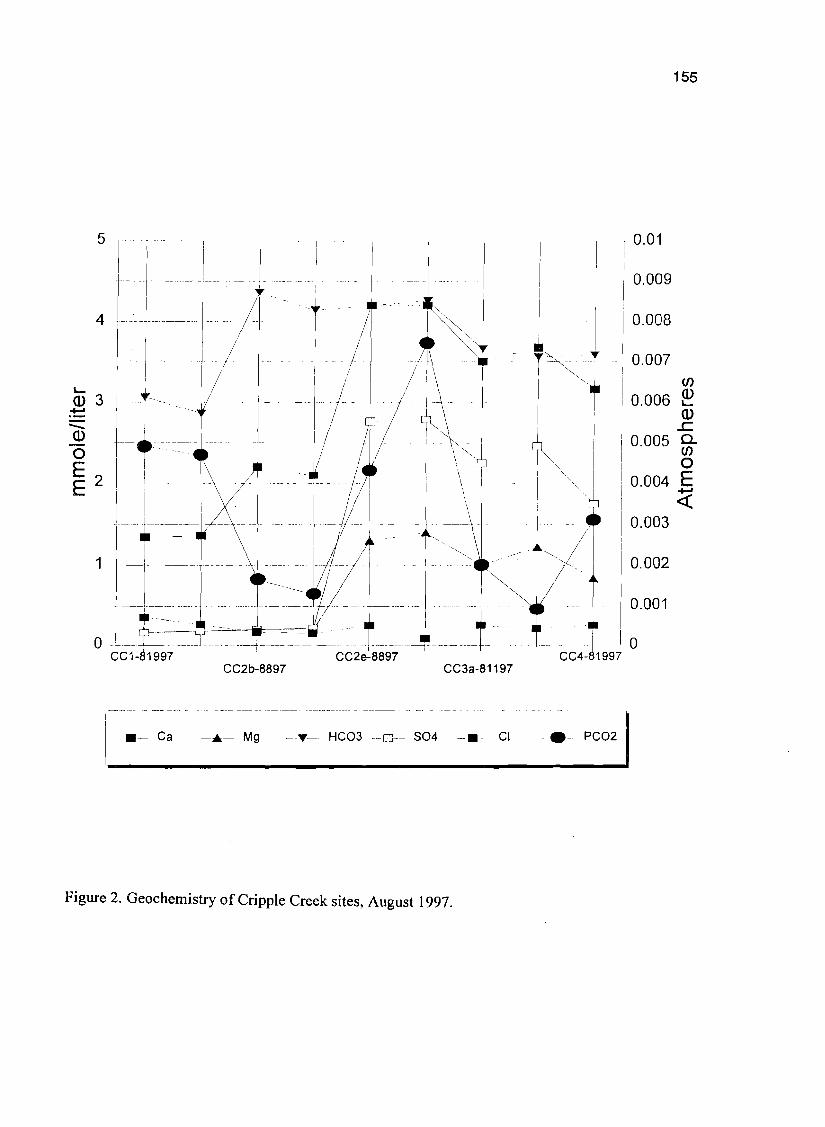
Several different types of water were observed during this study. These are characterized by the dissolved chemical components and physical properties of the water which vary from site to site. One prominent water type is the groundwater entering the stream from bottom sediments. Figure 2 and Figure 3 display data from the two piezometer samples CC3ap-81 197 and CC2ep8897. A common characteristic between the sites that is not shown on the graphs is the high PC02 (partial pressure of carbon dioxide), with CC3ap-81197 at 0.0182 atmospheres and CC2ep-8897 at 0.0126 atmospheres (Table 1). Dissolved C02 of the piezometer samples is. approximately 100 times greater for the stream samples at those same sites. A distinguishing characteristic that these samples have in common is the concentration of sulfate (S04--). Groundwater effluent at site CC2ep (344 mg S04iL) carries approximately 12 times the sulfate than does CC3ap (31mg S04iL).
Another water type was from a spring at CC2msp (Figure 4), which is low in PC02 (.00156) but high in HC03-. This was probably redirected stream water due to its similarities in S04 concentration to adjacent stream water at site CC2m (Figure 5). The water chemistry data from three other sites on Cripple Creek illustrate an important relationship between ground and
155
5 f-.. .. ...... .... .. I 1
41- j---1 /t ··l· •.• ~,±i 1 I
11- -II ... ·1 /1\ ' .. f"<T
~3-j~cY- 11'( I It1 /
I
1-_f _ --\_ 1/]·--r~:\ ... +)1....
-l ...·~.· .... ._t=_~ ... --1 .... ... ·······I·~·· ..
o 1_?----=-: -=~==-~I-- -t-------------T- .- -- I
i 0.01
0.009
0.008
0.007 en
0.006 ~ a>
...c 0.005 g-
O 0.004 E
4: 0.003
0.002
0.001
0CC1-~1997 CC2e-8897 CC4-81997
CC2b-8897 CC3a-81197
1----------- I
-A- Mg -T- HC03 --0-- 504 -- _- CI1-_- Ca -e· PC021
Figure 2. Geochemistry of Cripple Creek sites, August 1997.
156
1.0. Old 10" 00" Choppotd Slc.r 1I1,,.g I!ll~ol tlllYJl' pcen , M,/CI T~p oH Co M HC03 104 C,
bpl-6697 D6f06f97
...trip.
strum 0283
{Vn)lol
0\3\
('.P/It)
-0. \8~ -2152 'm
0000339 0.00272
millat 0.1;15
IIII.,.C
'<1.1 838
ppm
29.9
ppm
2.45
,pm
." ppm
IUe:
pom , f-C1.72B91
CCJ!lp.12B91
elll·72BST
,luJm.728
~1..12m728
D6W.tlB91
C2.p..88il
C21-6891
CC20l-88!11
CC2d-8697
CC2b-6't197
C3111p-E111'1
cc3dp.12e
d,'·728
¢C351-4'-88
0:::3)-8891
kx:;JSH-889
k:clK-8891
oeJl-81191
oc3(lNJI'
0712111'91
01128/91
01128191
01128197
071'29/97
08108/97
08108191
OBI09191
09108191
OBf08/97
08108/97
08/11191
HayMnC
rlppl.
rlppl.
SUr;Qn I
&J... " I
rip I,
rlppl,
'Ipp~
Grippi,
,IpplOl
rlppl,
Cripple
0752
0.169
o Bll
0193
0.228
0.01
OOJ o 3~5
0501
0101
0.91ll
0015
"'" 0013
o lies 06<18
0074
.(l,U]
-0126
0.19'
0451
-0.054
0766
-008
0-443
-0293
0.601
0.091
-0411
-0571
-02B5
0019
0.328
-0158
0371
-0495
-2.218
·',6<19
·1.\73
~ .. ...2 318
.1959
-0.794
~" -0.837
-0792
-2074
.1818
0,00153
o 0\411
0.00185
0.000303
0,001 '4
O.0251ii1
0,0124
I) 007~7
0.00432
0.0101
000156
I) 0182
000859
0.010\
o or " o OOJ!i3
0004'4
0.00953
o 017lJ
0.0172
00171
0.0181
00072'
0,009117
023' 0,154
0363
00368
00851
con e 2115 o.,:t::I
0,3\)9
0.381
e 0997
1],0937
'" " 1IiUl
23.1
11,5
13.3
" " '" 10.2
'" "
'" 1.26
.05
",.01
7.0<1
" J.~5
lf19
".". 1.11$
62.52
1251
'08.2
"3.29 <IS. 1
1222
1184
168,3
16i :I
Ifill:!'
811.11I
1293
8.75
11.66
23.11
0.91 ,.. "" 31.511
3402
:1158
38118.. 1.29
2135
3392
235.5
1098
13•. r 3~S 3
251.~
251111
:1582
258.7
'55 :1355
2235
3001
191.4
'''.3 111.04
'" 3442
3409
3318
371 3
22.8'
JI28
'" , " • " " no! ,
"00 IHOI , , "'0',,,
lOS
" , 00'
72S1
" •, .,
CCJIII-tl1191
h::;7.t11191
,ln3m--811
,lu l 3ni111
C2.~15111
C21.,ll1591
C2b-81587
1-66111·
oc30ST~1
co:JSI-P.. I
!ooJJ-a159
~-8'59
08/11/97
08(11191
06/11197
08/11197
OS1l5/91
08!!5191
011/15/97
oelO6197
,Ippll
><0 oC
~nhnl
SUril.n I
".,''''''','''''''
slr.am
01142
0.151
0.851
0.91
-0.014
0.083
01111
o S31
0594
"'"0.105
0.lS4
-0111
-0013
0.821
0.488
0.5f15
0.3211
0.418
0.'
-0 32~
-O.21S
0.44;
o 2111
-0.974
·2238
.<.533
.<.512
-O,1811
-080.
·-2.051
-24211
0.002
OOQIHI
I) 000234
O.000:xJ3
o DUll
0.0115
0.0013
000092
00142
0.~O2
0.00355
0.003'51
0.0181
0.011T
0"''' 0.00422
0286
0.133
0.11
o 14!
0.31 I
0.318
00952
0.131
20.1
'" ,,, 21.8 ,
10
". "
1,1111
818
." 8.13
7.11I
1.24
."
."
I ~O.:I
8012
31.68
38.48
180.4
116.4
84.11....
:14.3
4.Bll
3.88 ,.. 3402
34.02
,U8
"
223:1
IBl8
1122
l13.5
25111
2623
2S25
IS! 3
269.2
2141 ,n
15IP
'" '3811
2481
'" CI·ll~91·
C2a-68iH cc2.S-889
01115197
OM>l5191 ,'''''''
II~am
..I).1211
1.199
..1).211
1.055
-0.459
0.184
-3.159
-2,413
0.00303
0.00033
0.00342
0.004511
0.191
0.12
24.1
24.5
1.81
81
38.11
6343
.. ,. 1232
181.1
,. 15.4
C2a.1391
C2a·lI1j81
cc3-52997·
C25·139
C25715
01r'03191
09/1Sf97
OS129lil
,''''''' (IWI
11 •• m
o 14S
0.314
, 00'
08
0169
01152
0.0:15
~0S8
03311
-2.3511
·243IJ
-2021
0.000882
000201
0.000!l08
000.. 411
0.0045
o 005i1'i
00348
0169
00!5J1
22.1
23.1
13.1
." 7.111
11.45
52,1.. , 1309
".. '"
148.11
151 ~
202.6
". '"
28111
'" , " ccl~1l81'
ce3.71091"
GCJ·115117·
~106191
01/10197
01tt519r
slr.am rlppll
rl~1I
10' o 9311
(1,592
0941
0185
0"'411
0.SS2
OlliS
03211'
.1,925
.1.3~5
.1202
0.0005-15
000122
OOO~4
0~15
0.01
0.0114
0101
0.252
0285
'" IS.3
'" " '75
... 72.05
'05 113.8
1604
1ll.1
.. 1918
22811
22011
3"S
122' 11:)1
· " "co;:::l·1391·
C2n-71091 ecJ!I·7t09
07103191
01110191
rlpp,*
,Ippl.
0844
0,932
o.ss-e 0182
0" 0813
.1.J911
-, '" 0.00113
0,00133
00011'11
0.0104
0.0923
0,25
19.'
" '05."
10.
10' " 11I.S
2184
22~ 4
100.9
In e
, "CC21'n1p-71097
C2m-ll091
!=Jbsp.l1
'=3bsl·710
07/10191
01110/97
b.p<
cc3bll'
0999
09Nl
07411
01118
0319
0825
_1~6
.I:t02
0.00156
0001:14
000951
a Oft)!;
0.0999
0229
IS.3
'" '"., 1122
t!22
.. '"
2'55
230 IJ '" ,f2911
55
"Cll·n097
CJI!l-71091
0-1109
003d·ll09
01ll0/91
01ll0/91 """"" """" I DIG
o 811il
0861
\lell
0694
0491
.12113
.1345
0.00111
000186
OIlIOS
00'
0229
0221 ",I9.IJ
."eo, 112.2
IOS.8
15.t!
". 2282
22U
1311
123.1 " "C3a·711197
C3111p-12291
C3D-719
CJDP122
07118191
0712U97
ripp/4
rl~
0.182
-0"
MJe
~'"
0.431
-0,681
.1.I11J
.1819
0.002'52
00358
00114
0,0101 " 0.181 "..., ,,,
." 120 2
", '" "
23O.11
3:H1.1
113 I
32 T4 · '" 3.·722Iill
elk.ll1lill
CJlA172
C3E.l11
01(22197
07117lil ,''''''' """"
0.155
0"
0.e<Xi
0114
0422
0.!S3
·l.l3
.1.08
0.00251
0.00213
00122
001:1
0.234
0.281
IT.I
'" '" 8.01
1289
13\.6 " 22.4
24S 2
23"
IIS,I
~Ui II
, '.00 1
C2/·12297 C3F_122 01122191 ""... 0.'" o 551il 0"' .1 Co! 1 o0025~ 0.i)121 0.212 21.8 1.02 '30 • 16.1 2'5.5 211.& 8501
C21·1:!291
C2b-72297
C3Gtl·72
C3h11122
01l'l2lil
07122197
_,lppI.
".08'
C,"'!2
0.12l
0265
0.S1I4
0.I1l4
.1,08;
.' 000238
0,00731
0013
0.01~1l
0.265
0.325
21.1I
," 78• ,.. 13H
148.'
,IT... 2418
251.3
3037
2452
, 10,)1
·71591'
004·1J91·
C2h-722;1
CYL·115111'
1-!i2!t91
flx!1-3597
OI.7IS87
f--6t'N1-8111
H;2·11511
H;;l·l1'T
1-C3·1IUl
C3HsI·72
01115197
01mm
07121191
01115/97
05120/91
OllfOl!l!S1
01l15li1
0l511lli1
01l15lil
0711111'91
01(161'91
""... ""... rlppl.
y," Co 51 ..,,"
",••m
II.,."..,_bo, ~"o.nC
1-tI,o."C
f--IIIl'dI" C
0.13
""0812
0.29'5
-0"" 0.012
.Q tlI2
o 5~4
" "" 0.211
-O.OU
0.212
0.725
0153
~30'
-0.1"
-01141
0.401
'" 0.383 0.1;];
-Ot41
4).1:11
0.511
..1),025
-0551
-0528
.1.007
O.OU
0.128
0,175
0.021
.1.313
01418
-1038
--2.188
.2.909
--2.1~
--2524
-24SI
-2115
-2.615
·2.l79
om 000554
O.oo2n 0.00115
o ooonl
0000315
0,0051 I
0000453
0.0011"
0.00\111
0.00411
00097
O,~2
o OIJ5
0.00338
0.00211il
00023
o 00:t34
o OOo(llI
000"" 0.OO4C4
0.00573
0.0181
00...
0.258
0.191
0259 0_
0.24'
0.11'
0.'" 0.185
0.281
is Ii
22.1
",.. " '"
11,4.. 30' ,.. 21.3
1.JI
US
".." '.25 .,. '"., 1.12
",., ,...
... '" "..",
21.22
25.1'0.. , 46.8
:l1l,41
44.88...
". 81
217 ..,",'"' " :).31 ., ".,
tin
2168
2452
1159
" ." H.f12
ltO,lOJ,
"" 18111
12211
81.1
221 ~.. 11.1
10111
IS 00(
". " II sa
:is 7
" "•.,••
" · • " ,,"
f<:J·lliH
1--«:".11Sll
H::4-11Iill
1-CS_71591
071l~lil
OU151ll1
07l19lC11
071lSlil
'" oC
'" "C 1-tI"""C
_"C
0511
06115
Ofll3
O.Hl
0431
0431
""0.1 III
-0.056
0'" 0.131
.0.111
·2.t81
-2.'81
.....n2
...2.:H3
o 002111
O,~!'i
0.00125
0.00551
0,0051:t
000'" 0.0053
0005..
0.1).413
0,241il
00308
0.141
","."....
7.17,. '.IT
1.lil
nl' a4.1
84,13
IiU
, .., " ..,
... "" llill.'
,... '" ,.,"., '"
" ",""H:;:1!-116111
h:7-521Iill
01ltS/t7
OS121~1
~,o.t\C
,t'tam
0.1I12
1.241
0.41 ,,.. 0.21il5
0.1I12
·U3 ...2.187
D.OO3I11
O~41
0."'" 0,00835
0.1ll1
0.OC12
2'.1
14.2 '".., 81.3
11 02
,.. ". 114.1
2245 '" 1.11 "15.6
h:1-88Iill
1-C1·71S1I7
DtI'Oet91
07l1Slil
I/.am f-ia-,.cRt\C
.,1114
0,581
1.017
0.42
0112
0"" ~'" ·HJ5
0""""'
0""'"
0.",",
0_
0.103
0'" ". '81
.52 ,.. 10.44
US
..... "".'" 11I31
,IT 17
30
!-Cl·7l17
i-C7-12397
07/11liT
01(23197
HlaydtnC
~'fMn C
0.$11
0.2se "" 0.147 "" ..I).OU
-2.1715
..2.237
ooem O.OOJOI
000037
O.()()I511 0'" 02111
,n 1,3
,,, 7.77
157,:13
'" " 1.1 ""llill11 '" :It.!I
,n
"1-C8·71591 01/15191 HtrdlnC "" 0.142 ..1).311 -2.104 0.0103 0.0103 0,0131 11.2 " 11114 '" 3:1U 17.4 " H:;1l-1391 07fOJm Trlb 10 0'" OSH 001 -2101 00(:315 0."'" o 08S2 10' 1.113 1162 •• 3t'.-4 17.1 " rrcl.52'e91
m:;1-68117
0512:91'91
06fOl!ll91
'I~.m
j".rn
0 ..
"" ""0114 .. 00" 0421
-2,41J
-2$415
0.000>9
000326$
0.0041
O~11il
o OJII
0.081111
12.1
'" ."." 50'
41.39 0" 2.45
14! 4
lSO.1 ".
11.23 •
" tr.ICI.11S91
J:t4SPB2Q91 01/15li7
oenofil
_0 F\rmHill
01114
~".
0,1I2el
-3.:231
0311
~."
-2225
--2.~1
O.OOO~lJ3
0.0111
000843
000139
0.0B3~
01'. ". 11.1
'.31
" 15.4
". " 1.' ".. 41.48 "'" '" " ,
00', I'H'STfl2091
W·715.,
08mli7
01115191
f\Jmt1!1 ........ ,_. -31:28
-0,011 ~." -0 '52
".21il'S
-O.3eS
-3.t71
--2S17
00801
o 01($1il
0.oooe~7
0"'"
00" 0.1151
IU
21.5 " '" ...
12.1
0 ...
'" "" 240.3 ".. S8:l.71111 01f\9lil "" 0.7" 0.31-4 ~."" 0.001'5 O,ooel' 0.0744 2!1-1 1.14 115,36 ,.. 22114 1181 , 583·11517
583·1111
07115/87
01/1'197 -,-, 0,13e
0.111
-0.005
0.833
-0.23
D.ltJ
~,()4li
~'"
O,Olill
0.004"
0.00142
0.008.
O.I~
D.0l502 " ". '" ,... 71.8
1•. :M '".. 211.!
2233
27.7
". ",n ,bot-&l!l11
5&4.11517
oe~lil
07/15"1
tr•• rn-, !.IJI
00"
'.m -0.11.
0,SS7
-0.3)111 -2.1"
-2.121
0.000611
0.00i1'
0,00811
o0080i
0_
C.IS)
22.1l
"" "" "',
Ill. I
82.'
,... •• "",.IU
1114.. , " " 5&4-11111
b45.eUI
01lUlli7
~~m
-, '~om
0.'4'
l.0!1 or" 0.112
0.221
0.421
~.IOI
4.214
0.00.78
00001I>I
0.00$64
0.00113
0_
0.!)!5l
24.4
". "'" I",
lUe
14.4'
... 1.9-4
217.2
213.5
,,, 15.4. " 14.15
18
"14.15
S34 &-1117
$84.571517
'tJII!I-S2Hl
07/18191
01l1S~1
OSMm
_I-, I..rn
0.472
0.207
0'"
D.:t21
0.'" 0.101
-0.038
..(l.127
0.31
...2.011
~.,
~'"
0.003"'-3 0.0Q.421
0.00011'
000lJ>
0.005&1
0.«>0
O.O:iOI
0.118
0.Ol111
13.1... ,.. n7
U:I... 11,34 ..., 71.51
,.. ., ,., 21 Ll
181.4
201,4
". ""16.1
S1E~I"7
51SE-818I'
SlSEI21T'.1U
SSE3m1n
!llSP.1I97
SlSP7151ill
pl-62tt7
~.1I.1
MKtt1l4.1
152tlll
pl,"lill
TPI·115.1
'O'!'C1-88V1
wo3-8e11il7
08/1lillil
Delllil'"
01f221'il
01/22""
07tt91'il
01l!51tl
OSr2lilfil
OSMl'il
Dt/OlJli7
01llSlil
O!lfOfll1
0!l1OB~7
......0, ,aJth ••
9J""nl
.....0' "'...... L Sl""r L
I".m -",_0' ul C~I
wu.etl
W"ICIII .. ,...m .....",
0._
0.122
0.'"
0.214
-0308
-0338
0 ....
0.1'1
0.1"
0.811
0.4"
0.1"
0.142 ,,.,,
O.lin
0.4S8
Q.:ll2
0.131
-C.5-44
-0'" 0.113
o,enl
0031
O~SJ
0,344
O.O~lI
-0001
O.II~
O.lSS
0.14'
~.I82
-0,111
..(l.1I11
.,0.114
0.138
-O.lilS
-0.315
.1.154
-00..
-053
-0.381
0.1I2lS
~."" ~."'" ~ ....
-2.44
-2,21
';.115
-2.424 ~,.. .:1.4"2
·un ~'" -:l.51e
-:l.H' --2.51'
D.OOIJ.4DI
O.OOIJ.4ote
0."""" 0.DOOliI4
00187
OOITa
00Cl0e!' 0._
0.0005"
0.000311
0._
0;00"32
0.00146
0.00lmi3
0,0041
00041' 0.00-415
0.00><3
0.001II
O.OOUI
0.0050<
0.00302
0."""
0.003St o01lOJll
0,00lS1~
000<0'
000"28
0,.04
0.1)8
0.104
0.15
0.111
0.11
0.0311
0.OS14
0.'
000J82
0.107
OOJ111
O.QllIOl
0.11I'
,,. 11.1
13.1
n.' I
'.1 12.1
'.11 ..... lD,2
lU .1.1
11.1
"
1.47..,." 1.07 , '.01
I.' '.11
1.1' ..... ""1,'. ,.. 1.14
.... n.' ..... 10.'
85023
49.11
41,12 ..... U.~ .... 44.5:1
&0. It
.. ,.. ,. ... "... ,., ,..,
1.11 ... 0-01 .... ... ll.45
"
IJ1I.\
131 I
140.3
11'.3 >SO., 2SU IH.4
1121
1.11
131 •
131.'
115.2 UIil.:t
'"
III 01
11I.Ot
.u " .. I',M
11.1
II,lli
" " ... ... I.'
11.31
12.11
·•.... · n , ,..... •..
U,. "
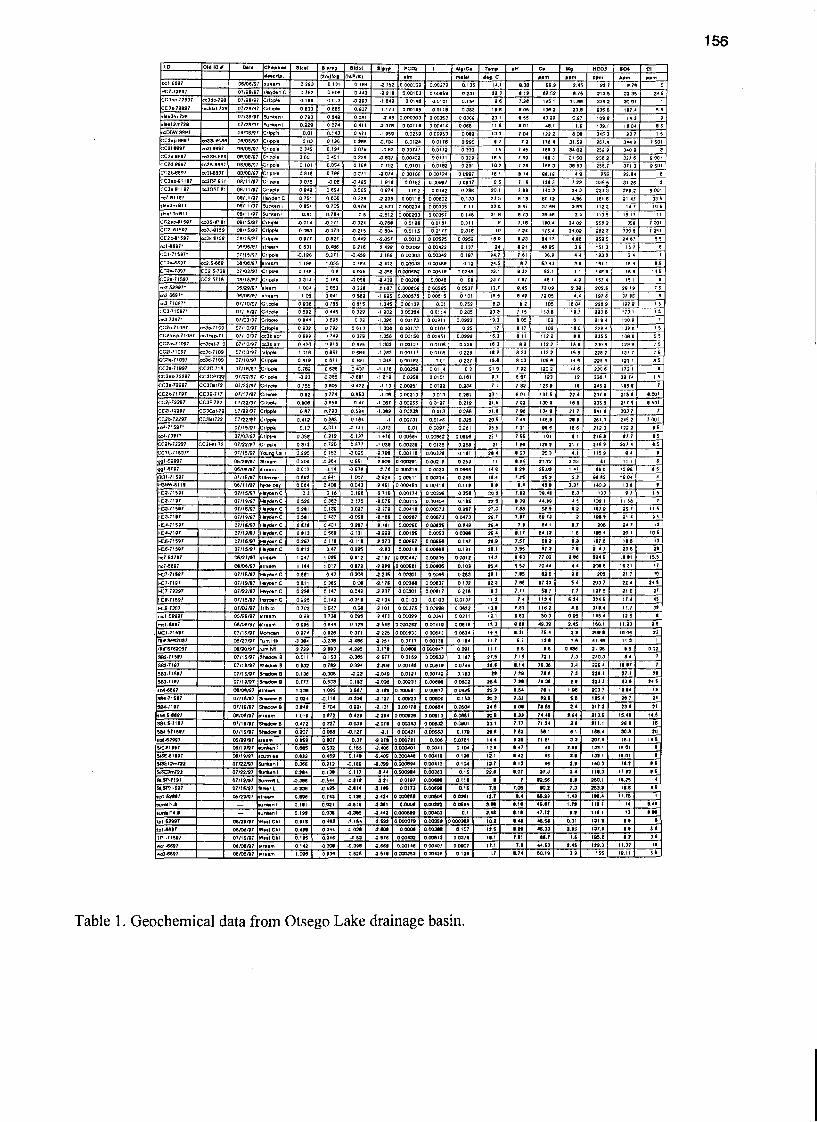
Table 1. Geochemical data from Otsego Lake drainage basin.
157
3.5 ~r--------------------------..,.350
3 ·�--------·-----1
2.5 1-------------1 1------------- . 300
2 ~
1.5 -1----------------1
~ 1 ~I------------l "0 l: 0.5 J--------------I
l: Sical . Siarag o a ~l--J-"""'---j5 -0.5· -----------
'lU -1 ~1-___r-_,--------_1(J)
-1.5·
-2·
-2.5 ~
-3
I---------------~--. 250
1---------------- . 200 ~ Sidol Sigyp ~ ,-----.- ::::
E~ ------- 150
. 100
·50
-3.5 L-L_L_---l==:::L__L--.JL_-L_..L_----" --J. 0 Ca Mg HC03 S04 CI
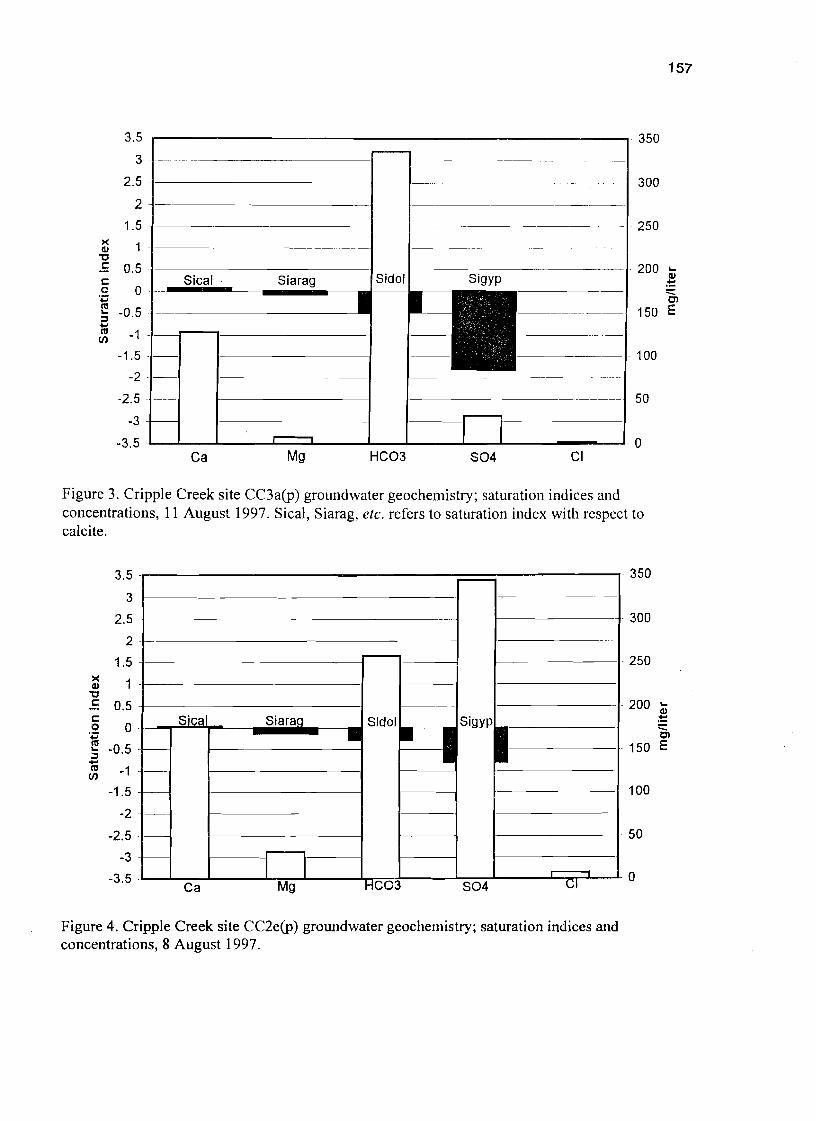
Figure 3. Cripple Creek site CC3a(p) groundwater geochemistry; saturation indices and concentrations, 11 August 1997. Sical, Siarag, etc. refers to saturation index with respect to calcite.
9
c-----~-
Sical Siaraa Sidol
ISigyp
I:• •I---
-
f---
1-
-
I----
I I r----l
350
3
3.5
3002.5
2
250
~ 1
1.5
"0
-~l: 0.5 200 dl
l: ~o a j ~
150 E5 -0.5
'lU -1(J)
100-1.5
-2
50-2.5
-3
a-3.5 Ca M HC03 S04 \,;1
Figure 4. Cripple Creek site CC2e(p) groundwater geochemistry; saturation indices and concentrations, 8 August 1997.
3.5
3
2.5 2 - - --
~
1.5
1 Sical Slarag
~ :;:; l:! ~ .... IIIen
O~ .•==..= -0.5
-1
-1.5
-2
-2.5
-3
MgCa -3.5 -LL.-L_---C==~_...J...
158
350
300
250
Sidol 200 ~
~
Cl 150 E
100
50
_ __L_ _____l_ __.L__c::=:=:::L___.J 0 HC03 804 CI
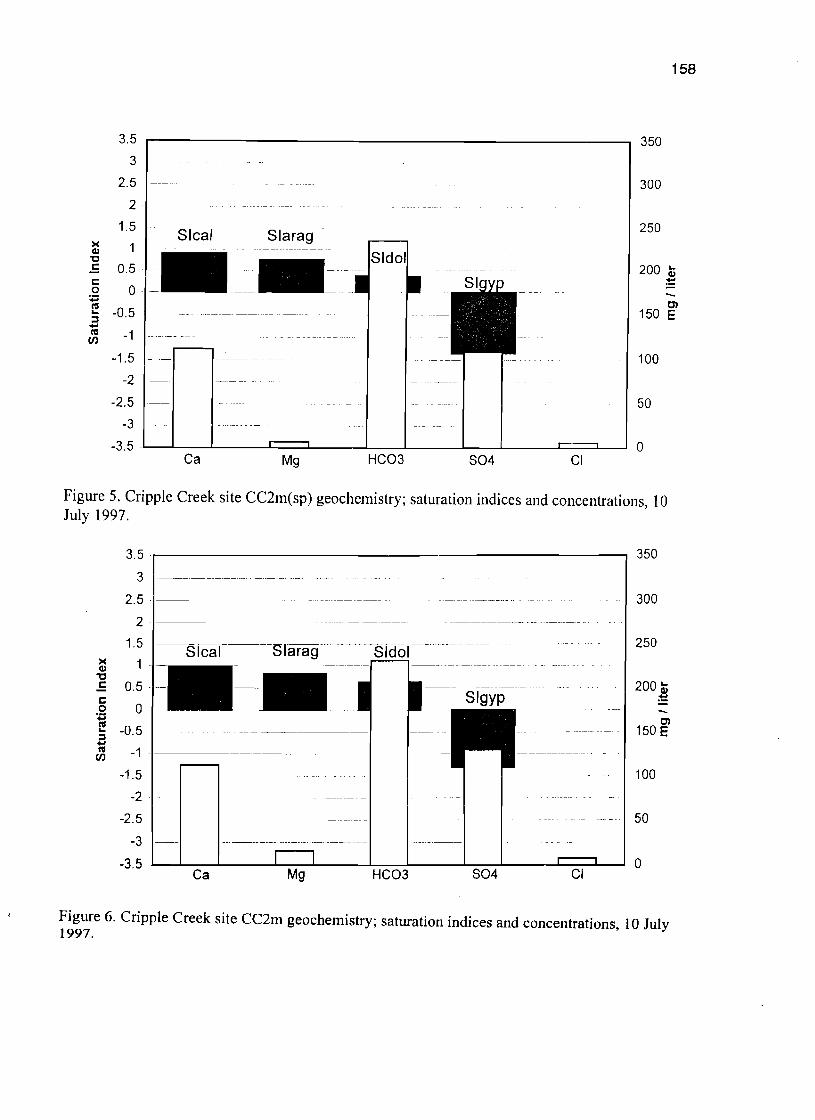
Figure 5. Cripple Creek site CC2m(sp) geochemistry; saturation indices and concentrations, 10 July 1997.
3.5 -r------------------------, 350 3 -- - -- - - ~---- ...._. _..-.-
2.5 --- 300 2 -I------------------·--·--~--~ ------ ----
1.5 -S-fear ----Slarag --------Sfdol---- 250
~ o~ .--..= :;:;
l:! -0.5 -1-------------1 ~ .... fa en -1 -1
-1.5
- _
-2
-2.5
-3
200 ;---------~;g-yp-~
Cl 150 E
- - --- ------ 100
50
-3. 5 L...L-..L----l---:-:---L--~:_;::_;!--__l...;8;;0"4~-----L~--L..----J 0 Ca HC03 CI
Figure 6. Cripple Creek site CC2m geochemistry; saturation indices and concentrations, 10 July 1997.
159
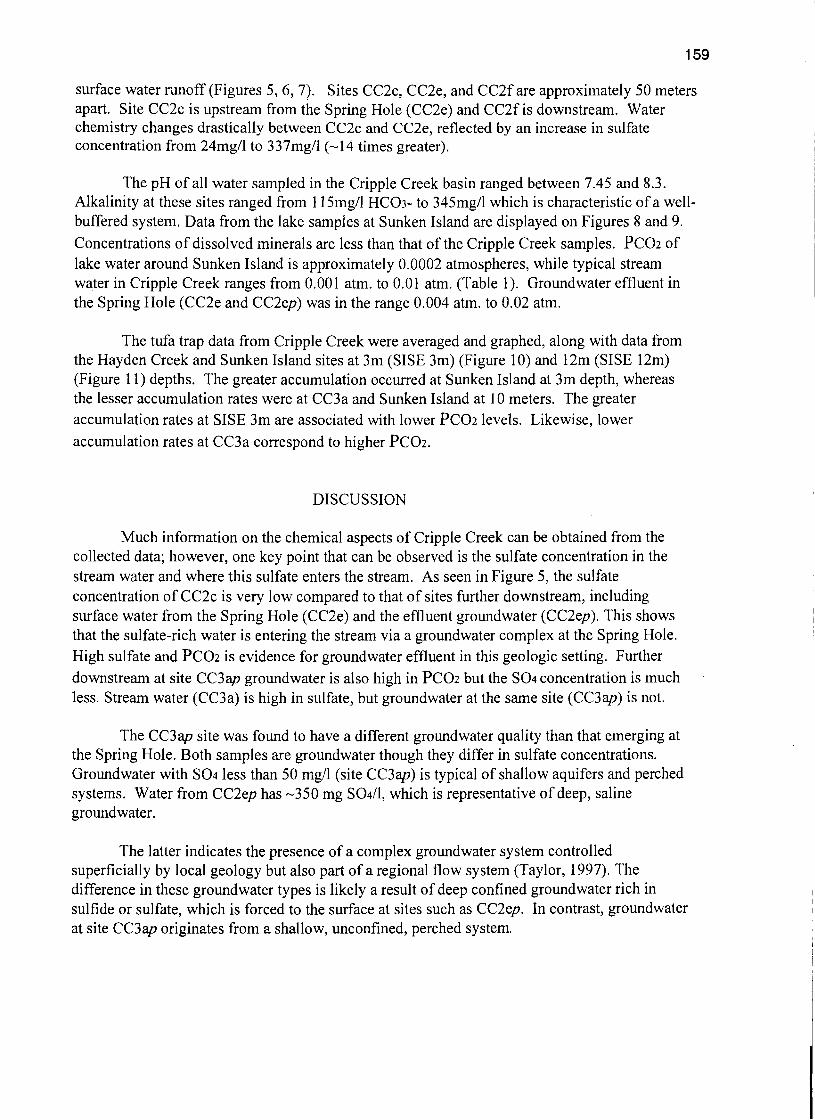
surface water runoff (Figures 5, 6, 7). Sites CC2c, CC2e, and CC2f are approximately 50 meters apart. Site CC2c is upstream from the Spring Hole (CC2e) and CC2fis downstream. Water chemistry changes drastically between CC2c and CC2e, reflected by an increase in sulfate concentration from 24mg/l to 337mg/l (~14 times greater).
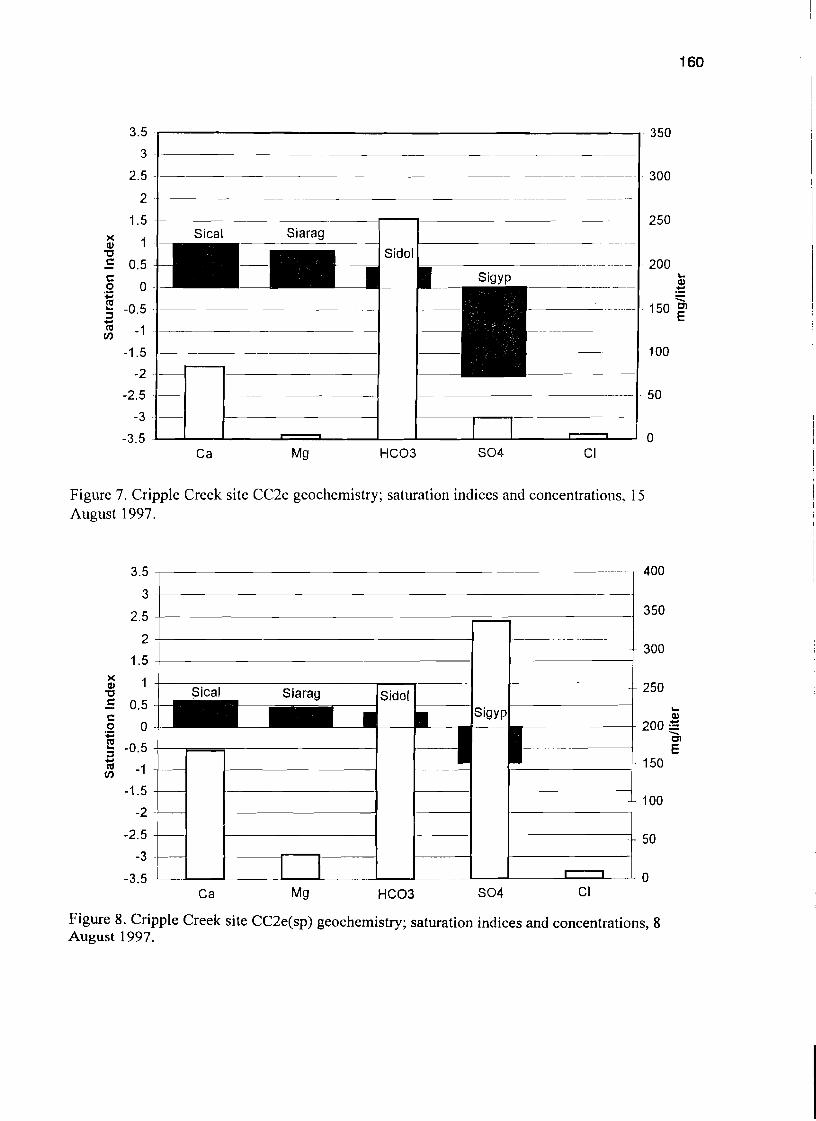
The pH of all water sampled in the Cripple Creek basin ranged between 7.45 and 8.3. Alkalinity at these sites ranged from 115mg/l HC03- to 345mg/l which is characteristic ofa wellbuffered system. Data from the lake samples at Sunken Island are displayed on Figures 8 and 9.
Concentrations of dissolved minerals are less than that of the Cripple Creek samples. PCOz of lake water around Sunken Island is approximately 0.0002 atmospheres, while typical stream water in Cripple Creek ranges from 0.001 atm. to 0.01 atm. (Table 1). Groundwater effluent in the Spring Hole (CC2e and CC2ep) was in the range 0.004 atm. to 0.02 atm.
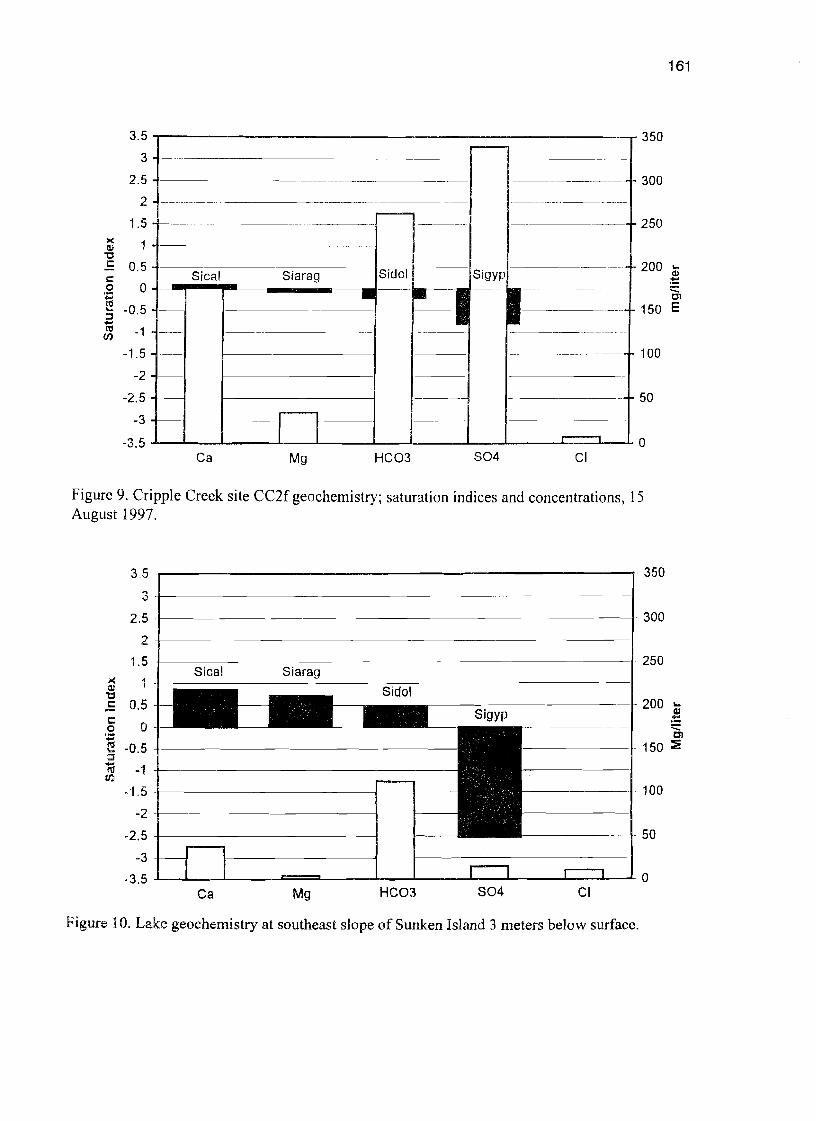
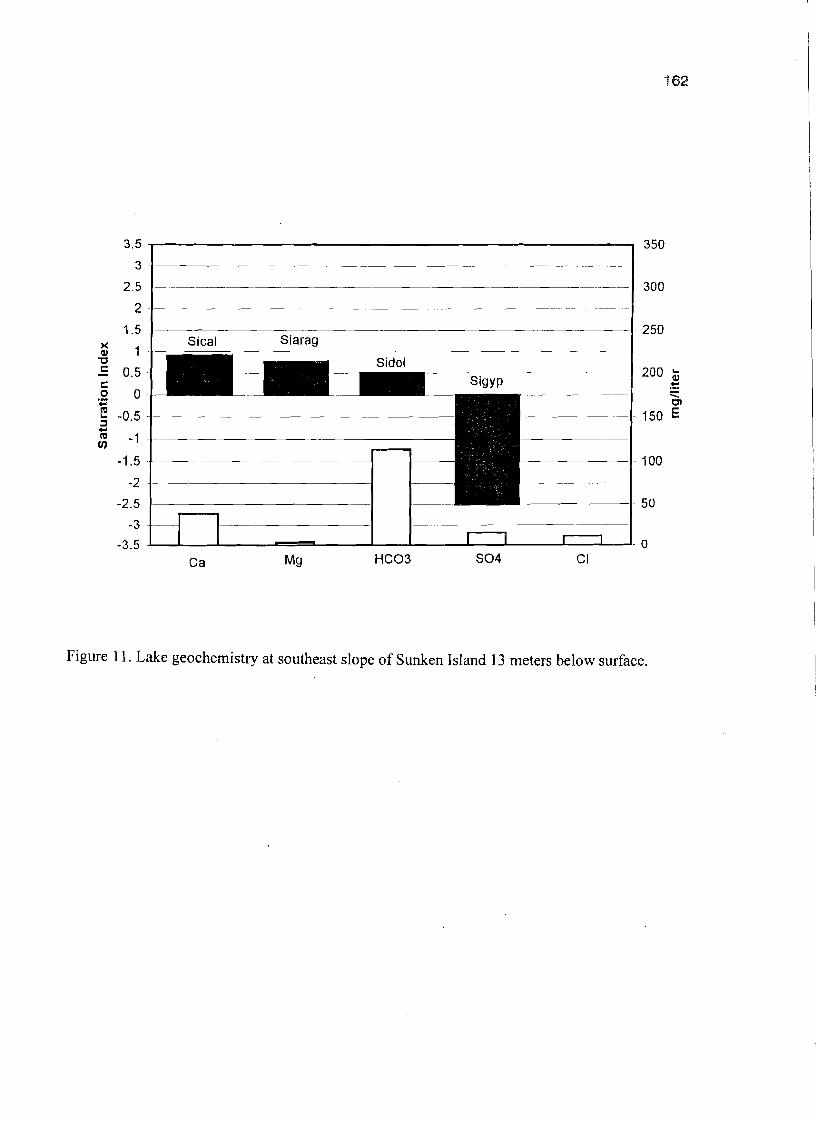
The tufa trap data from Cripple Creek were averaged and graphed, along with data from the Hayden Creek and Sunken Island sites at 3m (SISE 3m) (Figure 10) and 12m (SISE 12m) (Figure 11) depths. The greater accumulation occurred at Sunken Island at 3m depth, whereas the lesser accumulation rates were at CC3a and Sunken Island at 10 meters. The greater accumulation rates at SISE 3m are associated with lower PCOz levels. Likewise, lower
accumulation rates at CC3a correspond to higher PCOz.
DISCUSSION
Much information on the chemical aspects of Cripple Creek can be obtained from the collected data; however, one key point that can be observed is the sulfate concentration in the stream water and where this sulfate enters the stream. As seen in Figure 5, the sulfate concentration of CC2c is very low compared to that of sites further downstream, including surface water from the Spring Hole (CC2e) and the effluent groundwater (CC2ep). This shows that the sulfate-rich water is entering the stream via a groundwater complex at the Spring Hole. High sulfate and PCOz is evidence for groundwater effluent in this geologic setting. Further
downstream at site CC3ap groundwater is also high in PCOz but the S04 concentration is much less. Stream water (CC3a) is high in sulfate, but groundwater at the same site (CC3ap) is not.
The CC3ap site was found to have a different groundwater quality than that emerging at the Spring Hole. Both samples are groundwater though they differ in sulfate concentrations. Groundwater with S041ess than 50 mg/l (site CC3ap) is typical of shallow aquifers and perched systems. Water from CC2ep has ~350 mg S0411, which is representative of deep, saline groundwater.
The latter indicates the presence of a complex groundwater system controlled superficially by local geology but also part of a regional flow system (Taylor, 1997). The difference in these groundwater types is likely a result of deep confined groundwater rich in sulfide or sulfate, which is forced to the surface at sites such as CC2ep. In contrast, groundwater at site CC3ap originates from a shallow, unconfined, perched system.
-----
160
3.5
.
Sical Siarag Sidol
-
- -----
-
350 3 .
2.5 300
2
---_._- - .
--_ ... ~-
-
2501.5 )( QJ 1
"t:I c: 2000.5 ...c: QJ0 0 ;t:
'';:; :::::: ~ 150 OJ-0.5::::l E I1l - -1rn
100
-2
-2.5
-1.5
- - 50
-3
-3.5 ·0 Ca Mg HC03 S04 CI
Figure 7. Cripple Creek site CC2c geochemistry; saturation indices and concentrations, 15 August 1997.
3.5 I
400
2~J 350
.. 300 1.5
)( 1QJ Sical 250"t:I c: 0.5 ... c: QJ 0 0 200 ~ +:: -OJ ~ -0.5 E::::l- 150I1l -1rn
-1.5 100
-2
-2.5 50 -3
-3.5 a CI
Figure 8. Cripple Creek site CC2e(sp) geochemistry; saturation indices and concentrations, 8 August 1997.
Ca Mg HC03 S04
------
----------
161
3.5 .,---------------------------r 350
!----------i--------------
1 .
-f---S-j-ca-,-----s-;a-ra-g---- SidOII--- Sigyp
1 ------1 -3 -I- ---n
-3.5 .L---L_--L__--J_--JL...-_---IL....----IL-__L....-_'--__.L.-..-----._.L.---L. a Ca Mg HC03 S04 CI
Figure 9. Cripple Creek site CC2f geochemistry; saturation indices and concentrations, 15 August 1997.
3.5 ....--------------------------,- 350
3
--------- ------------f- 3002.5
2
1.5 +------------- ------------------1- 250 Sical Siarag
l< 1w "'C I:: 0.5 200 ... I: ~ 0 0 --OJ'';:;
~ -0.5 :::3
1ii -1 tn
0'1.5
-2
-2.5
-3 l.-----1_j. 0-3.5
Ca Mg HC03 804 CI
f-------J- 100
-------1- 150 :E
1-------50
.L.......L_--L__-==:L...-_---I._--I...__-I-_........__
-
Figure 10. Lake geochemistry at southeast slope of Sunken Island 3 meters below surface.
3
2.5
2
1.5 )( Q)
"'C I:: 0.5 I:: 0 a+:: ra -0.5... ;:, +J ra -1(f)
-1.5
-2
-2.5
1--------
~I-I-----~= 1---------
300
250
200 ~ .~ :::: OJ
150 E
100
50
--~
------- -
---
162
350 3.5
3
2.5 300
2
1.5 - 250 Sical Siarag)(
Q) 1 "C c: 200 ...0.5 Q)c: ~ 0 0 :::::: ';; Cl ~ - 150 E-0.5:3 rti -1(f)
-1.5 - 100
-2
-2.5 - 50
-3 -3.5 -0
Mg HC03 804 CICa
Figure 11. Lake geochemistry at southeast slope of Sunken Island 13 meters below surface.
163
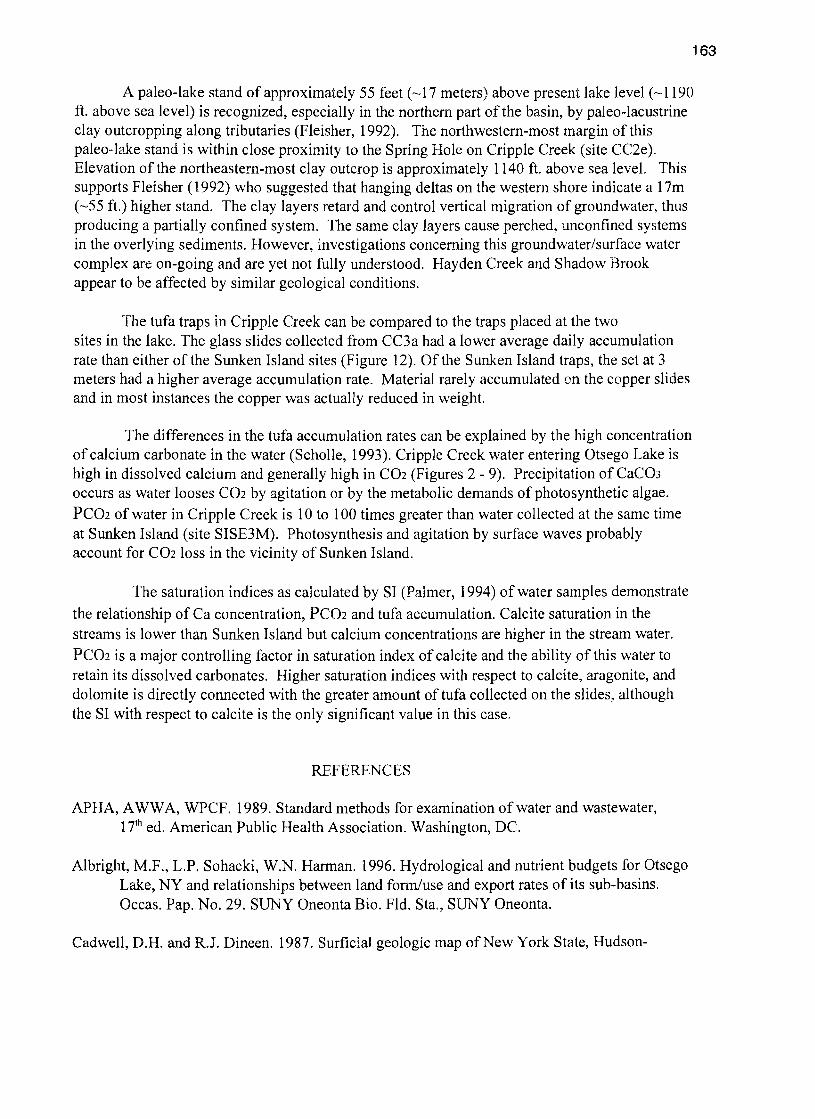
A paleo-lake stand of approximately 55 feet (~17 meters) above present lake level (~1190
ft. above sea level) is recognized, especially in the northern part of the basin, by paleo-lacustrine clay outcropping along tributaries (Fleisher, 1992). The northwestern-most margin of this paleo-lake stand is within close proximity to the Spring Hole on Cripple Creek (site CC2e). Elevation of the northeastern-most clay outcrop is approximately 1140 f1. above sea level. This supports Fleisher (1992) who suggested that hanging deltas on the western shore indicate a 17m (~55 f1.) higher stand. The clay layers retard and control vertical migration of groundwater, thus producing a partially confined system. The same clay layers cause perched, unconfined systems in the overlying sediments. However, investigations concerning this groundwater/surface water complex are on-going and are yet not fully understood. Hayden Creek and Shadow Brook appear to be affected by similar geological conditions.
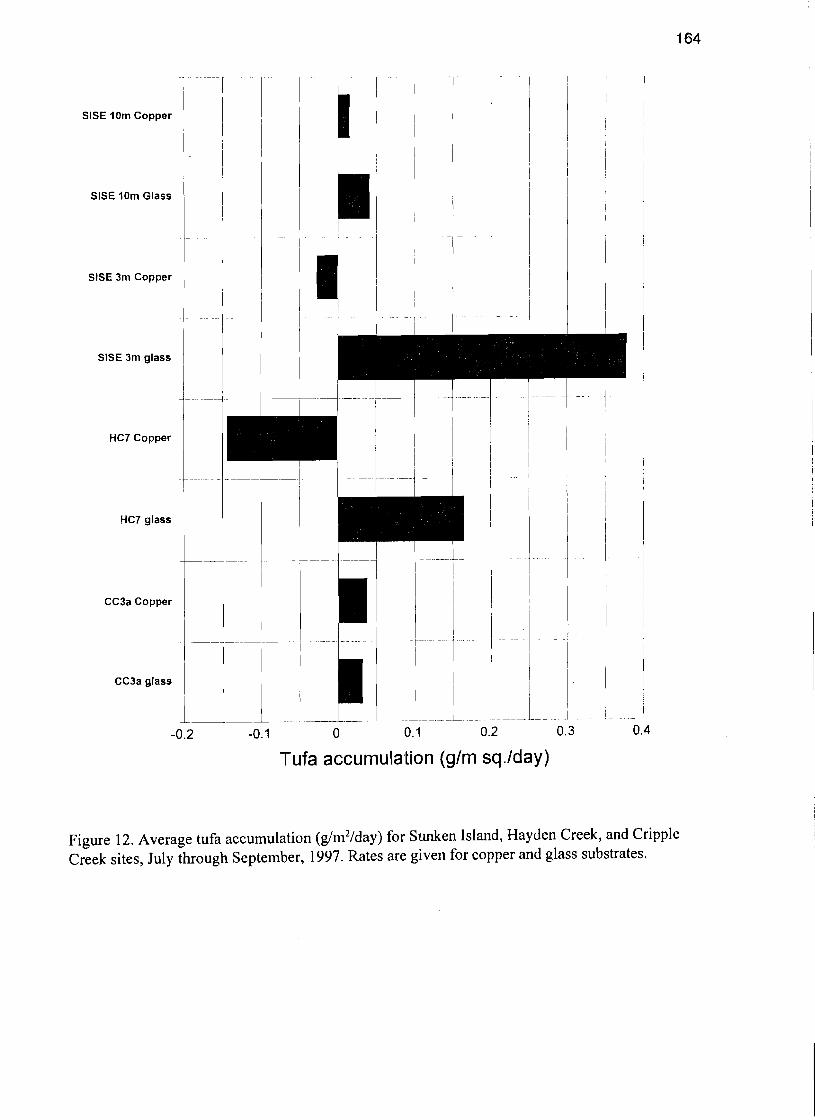
The tufa traps in Cripple Creek can be compared to the traps placed at the two sites in the lake. The glass slides collected from CC3a had a lower average daily accumulation rate than either of the Sunken Island sites (Figure 12). Of the Sunken Island traps, the set at 3 meters had a higher average accumulation rate. Material rarely accumulated on the copper slides and in most instances the copper was actually reduced in weight.
The differences in the tufa accumulation rates can be explained by the high concentration of calcium carbonate in the water (Scholle, 1993). Cripple Creek water entering Otsego Lake is high in dissolved calcium and generally high in C02 (Figures 2 - 9). Precipitation of CaC03 occurs as water looses C02 by agitation or by the metabolic demands of photosynthetic algae. PC02 of water in Cripple Creek is 10 to 100 times greater than water collected at the same time at Sunken Island (site SISE3M). Photosynthesis and agitation by surface waves probably account for C02 loss in the vicinity of Sunken Island.
The saturation indices as calculated by SI (Palmer, 1994) of water samples demonstrate
the relationship of Ca concentration, PC02 and tufa accumulation. Calcite saturation in the streams is lower than Sunken Island but calcium concentrations are higher in the stream water. PC02 is a major controlling factor in saturation index of calcite and the ability of this water to retain its dissolved carbonates. Higher saturation indices with respect to calcite, aragonite, and dolomite is directly connected with the greater amount of tufa collected on the slides, although the SI with respect to calcite is the only significant value in this case.
REFERENCES
APHA, AWWA, WPCF. 1989. Standard methods for examination of water and wastewater, 17th ed. American Public Health Association. Washington, DC.
Albright, M.F., L.P. Sohacki, W.N. Harman. 1996. Hydrological and nutrient budgets for Otsego Lake, NY and relationships between land form/use and export rates of its sub-basins. Occas. Pap. No. 29. SUNY Oneonta Bio. Fld. Sta., SUNY Oneonta.
Cadwell, D.H. and R.J. Dineen. 1987. Surficial geologic map of New York State, Hudson
164
---+--c----+--·----+
-1----+-- j---+-----I-
1 I
SISE 10m Copper
I
I SISE 10m Glass
SISE 3m Copper
SISE 3m glass
HC7 Copper
HC7 glass
I Ii CC3a Copper ' I i
I I I i -- ----f- ··1- i.
I I \ [I ,!I
CC3a glass I I
l~_ .L__l l_J __ .J __ ..L__ J L._ -0.2 -0.1 0 0.1 0.2 0.3 0.4
Tufa accumulation (g/m sq.lday)
Figure 12. Average tufa accumulation (g/m2/day) for Sunken Island, Hayden Creek, and Cripple Creek sites, July through September, 1997. Rates are given for copper and glass substrates.
165
Mohawk sheet: Albany, New York State Museum - Geological Survey, Map and Chart series no. 40.
Drever, J.I. 1982. The geochemistry of natural waters. Prentice-Hall, Inc., Englewood Cliffs, N.J.
Fleisher, P.J. 1991. Active and stagnant ice retreat: Deglaciation of Central New York. in Ebert, James R. (ed.) Field Trip Guidebook: 63th Annual Meeting NYSGA, SUNY College at Oneonta, p. 307-24.
Fleisher, P. J., H. T. Mullins, and R.F. Yuretich. 1992. Subsurface stratigraphy of Otsego Lake, New York: Implications for deglaciation of the Northwestern Appalachian Plateau. Northeastern Geology: v. 14, no. 4, p. 203-217.
Fleisher, P.J. 1997. Personal communication. SUNY College at Oneonta, Oneonta, NY.
Halfman, J.D., and Fetterman, AR. 1998. Preliminary analysis of high-resolution (2-12 kHz) .reflection seismic profiles from Otsego Lake. New York. Abstracts and Programs, GSA NE Regional Meeting.
Heavy, K.F. 1995. Water quality monitoring in the Otsego Lake watershed. In 28th Ann. Rept. SUNY Oneonta Bio. Fld. Sta.,SUNY Oneonta.
Komorowski, S. 1994. Quantitative analyses of periphyton biomass and identification of periphyton taxa in the tributaries of Otsego Lake, N. Y. in relation to selected environmental parameters. Occas. Pap. No.26, SUNY Oneonta Bio. Fld. Sta., SUNY Oneonta.
Palmer, AN. 1994. Saturation index program 3.0 (IBM PC). Dept. Of Earth Sciences, State University of New York, Oneonta, NY.
Pijnenburg, M. 1991. A hydrogeophysical investigation of the Otsego Lake watershed. Unpublished Masters Thesis. S.U.N.Y. College at Oneonta, Oneonta, NY.
Rickard, L.V. and D.H. Zenger. 1964. Stratigraphy and paleontology of the Richfield Springs and Cooperstown Quadrangles, New York: New York State Museum and Science Service, Bulletin 396, 101p.
Scholle, P.A, D.G. Bebout, and C.H. Moore. 1993. Carbonate depositional environments. American Association of Petroleum Geologists, Tulsa.
Stein, E. 1997. Personal Communication, Cooperstown, NY.
Yuretich, R.F. 1982. Sedimentary and geochemical evolution of Otsego Lake. in Harman, W. N. (ed.) 14th Ann. Rept. , 19'81. SUNY Oneonta Bio. Fld. Sta., SUNY Oneonta. p.91-1 08.