Embed Size (px)
Citation preview

Appen Limited Appendix 4E Preliminary final report
1. Company details Name of entity: Appen Limited ABN: 60 138 878 298 Reporting period: For the year ended 31 December 2017 Previous period: For the year ended 31 December 2016
2. Results for announcement to the market $'000 Revenues from ordinary activities up 50.1% to 166,571 Profit from ordinary activities after tax attributable to the owners of Appen Limited
up
36.2%
to
14,282
Profit for the year attributable to the owners of Appen Limited up 36.2% to 14,282 Dividends
Amount per
security
Franked amount per
security Cents Cents Interim dividend for the year ended 31 December 2017 3.0 3.0 Final dividend for the year ended 31 December 2016 3.0 3.0 Dividend declared On 21 February 2018, the Company declared a final dividend for the year ended 31 December 2017 of 3.0 cents per share, fully franked. The dividend is to be paid out of the profits reserve. The record date for determining entitlements to the dividend is 27 February 2018. The financial effect of these dividends has not been brought to account in the financial statements for the period ended 31 December 2017 and will be recognised in subsequent financial reports. Comments The profit for the Group after providing for income tax amounted to $14,282,000 (31 December 2016: $10,489,000). Refer to the 'Review of Operations' section in the Directors' report attached for further explanation of the results.
3. Net tangible assets
Reporting
period Previous
period Cents Cents Net tangible assets per ordinary security (21.59) 21.47
For
per
sona
l use
onl
y

Appen Limited Appendix 4E Preliminary final report
4. Control gained over entities Name of entities (or group of entities) Leapforce, Inc. and RaterLabs, Inc. Date control gained 7 December 2017 $'000 Contribution of such entities to the reporting entity's profit/(loss) from ordinary activities before income tax during the period (where material)
934
Profit/(loss) from ordinary activities before income tax of the controlled entity (or group of entities) for the whole of the previous period (where material)
-
5. Loss of control over entities Not applicable.
6. Dividends Current period
Amount per
security
Franked amount per
security Cents Cents Interim dividend for the year ended 31 December 2017 3.0 3.0 Final dividend for the year ended 31 December 2016 3.0 3.0 Dividend declared On 21 February 2018, the Company declared a final dividend for the year ended 31 December 2017 of 3.0 cents per share, fully franked. The dividend is to be paid out of the profits reserve. The record date for determining entitlements to the dividend is 27 February 2018. The financial effect of these dividends has not been brought to account in the financial statements for the period ended 31 December 2017 and will be recognised in subsequent financial reports. Previous period
Amount per
security
Franked amount per
security Cents Cents Interim dividend for the year ended 31 December 2016 2.0 2.0 Final dividend for the year ended 31 December 2015 3.0 3.0
7. Dividend reinvestment plans Not applicable.
8. Details of associates and joint venture entities Not applicable.
For
per
sona
l use
onl
y

Appen Limited Appendix 4E Preliminary final report
9. Foreign entities Details of origin of accounting standards used in compiling the report: Not applicable.
10. Audit qualification or review Details of audit/review dispute or qualification (if any): The financial statements have been audited and an unqualified opinion has been issued.
11. Attachments Details of attachments (if any): The Annual Report of Appen Limited for the year ended 31 December 2017 is attached.
12. Signed
Signed ___________________________ Date: 21 February 2018 Mark Brayan Managing Director Sydney
For
per
sona
l use
onl
y

Appen Limited
ABN 60 138 878 298
Annual Report - 31 December 2017
For
per
sona
l use
onl
y

Appen Limited Contents 31 December 2017
1
Corporate directory 2
Chairman's report 3
Chief Executive Officer's report 5
Directors' report 6
Auditor's independence declaration 22
Consolidated statement of profit or loss and other comprehensive income 23
Consolidated statement of financial position 24
Consolidated statement of changes in equity 25
Consolidated statement of cash flows 26
Notes to the consolidated financial statements 27
Directors' declaration 67
Independent auditor's report to the members of Appen Limited 68
Shareholder information 73
For
per
sona
l use
onl
y
Appen Limited Corporate directory 31 December 2017
2
Directors Christopher Charles Vonwiller - Chairman Mark Ronald Brayan - Managing Director and Chief Executive Officer Stephen John Hasker Robin Jane Low William Robert Pulver Deena Robyn Shiff Company secretary Leanne Ralph Registered office and principal place of business
Level 6
9 Help Street Chatswood NSW 2067 Telephone: (02) 9468 6300 Share register Link Market Services Limited Level 12 680 George Street Sydney NSW 2000 Telephone: 1300 554 474 Facsimile: (02) 9287 0303 Auditor KPMG Tower Three International Towers Sydney 300 Barangaroo Avenue Sydney NSW 2000 Solicitors Norton Rose Fulbright Australia Level 18, Grosvenor Place 225 George Street Sydney NSW 2000 Stock exchange listing Appen Limited shares are listed on the Australian Securities Exchange (ASX code:
APX) Website www.appen.com Corporate Governance Statement https://appen.com/investors/corporate-governance/.
For
per
sona
l use
onl
y

Appen Limited Chairman's report 31 December 2017
3
Dear Shareholders Appen enjoyed another successful year in 2017. We have maintained a record of growth and profitability since our company commenced in 1996, but by any measure 2017 was truly outstanding. The headlines for the year are set out below.
• Full year revenue was $166.6 million, 50% up on the revenue in FY2016 of $111.0 million • The Underlying EBITDA (excluding the Leapforce transaction cost) was $28.1 million, an increase of 62% on
FY2016. After transaction costs of $5.9 million, the Statutory EBITDA was $22.2 million. • Our Underlying EBITDA margins continued to improve, from 15.5% in 2016 to 16.9% in 2017 • The Underlying Net Profit After Tax (NPAT) reached $19.7 million, 86% up on the FY2016 NPAT of $10.6 million.
Statutory NPAT (after transaction costs) was $14.3 million. • We have maintained a strong balance sheet, with end-year cash of $24.0 million
After considering Appen’s financial results, ongoing investments for growth, cash balances and projected cash flow, the directors have declared a final dividend for FY2017 of 3.0 cents per share. This dividend will be paid on 21 March 2018. Business environment Appen’s business environment is exciting. Artificial Intelligence is increasingly a theme in business, consumer and government applications, and is characterised by heavy levels of research, product investment and innovation. Alongside the well-known technology giants, we are witnessing the adoption of AI by many new enterprises and industries. A common thread in all of this is the need for data in various forms, and generally the more data the better. We are experiencing demand for newer forms of data, beyond the traditional voice and text. Image and video are now important modalities. The pace of our industry is accelerating and is influenced by strong leadership in the USA and China. New competitors are emerging and there is global demand for skilled personnel. Outlook We are actively seeking attractive growth opportunities for Appen. Our challenge is to maintain cost-competitiveness and to move quickly and with agility. Cost and performance pressures from major customers are unrelenting, but our scale will work favourably for us. The recent acquisition of Leapforce improves our operational performance and places Appen as one of the largest global data providers. We have expanded our global crowd workforce to over 1 million, and we are improving the level of automation in our operations. We are taking steps to further strengthen our resources in technology. As AI applications expand into more industries, another imperative for the company is business development to expand into those verticals where we can gain competitive advantage. This will provide growth and customer diversity. Clearly the automotive sector is well-advanced in adoption of AI and we have an established position here. We are moving to build our position in other industries. During 2017 we invested in new facilities for the processing of large volumes of secure data, and this will open doors to new customers. Employees The rate of growth in Appen has naturally placed a heavy workload on our company’s leadership and staff. I am pleased to report that they have responded magnificently to this challenge, as demonstrated by the financial results. It is important to note however that the global demand for well-credentialed people in the disciplines related to AI is intense, and therefore we need to be competitive to recruit and retain talent. The board has sought to implement reward structures which are globally competitive but at the same time ensure that long term incentives are closely aligned with shareholder wealth creation. I place on record the board’s appreciation for the exceptional contributions of Mark Brayan and his global team through 2017. Their sustained efforts have been outstanding and underpin our success. With the Leapforce acquisition, I am pleased to note that Daren Jackson and his team have further strengthened our human resources. I acknowledge also the global on-demand crowd-based workforce, which now includes the Leapforce crowd and makes Appen one of the largest and best resourced providers of data in our industry. We could not function without this resource, and the board is appreciative of their efforts.
For
per
sona
l use
onl
y

Appen Limited Chairman's report 31 December 2017
4
Our board is active and engaged and collegiate. Among our directors we have a strong depth in industry knowledge, corporate governance, and strategic and operational experience. I value the contributions of my fellow directors. Finally, I record my appreciation for your support and trust as shareholders. At all times, we are conscious of our obligations to you and our ongoing responsibilities for the future performance of our company. Sincerely
Chris Vonwiller
For
per
sona
l use
onl
y

Appen Limited Chief Executive Officer's report 31 December 2017
5
Dear Shareholders, 2017 has been another tremendous year for Appen. We delivered another year of high growth in revenue and earnings, we provided quality data and services to our customers, we added talented staff and crowd-based workers and improved our strong position in the accelerating markets of machine learning and artificial intelligence (AI). The year’s performance was predominantly due to the growing demand for data for machine learning and AI from our longstanding customers, along with continuing effective execution that saw EBITDA margins rise year on year. 2017 was made more notable though, through some key achievements:
• The acquisition of Leapforce in December 2017 established us as the leader in our space. We welcomed Daren Jackson and his talented team to Appen along with their customers, technology and crowd of seasoned workers. The combination of Appen and Leapforce gives us bulk, scale and cost advantage to stay ahead of our competitors and continue to deliver for our customers. Leapforce’s technology gives us a foundation for greater automation, efficiency and scalability.
• The investment in our secure data annotation facility is paying off. The facility is live and active with large scale customer projects. The facility, along with our security-accredited UK business acquired in 2016, gives us a competitive advantage in the growing need for secure work on highly confidential projects and/or confidential data.
• We secured a number of new projects and acquired several new customers in 2017, some with the potential to achieve significant scale. These add to our business and improve customer and project distribution.
• The increasing breadth of AI applications and the need for a great variety of data is providing opportunities for us in multiple data formats; text, audio, image and video. We’ve projects ongoing in these modalities that should grow substantially and other opportunities in the pipeline that will make us a richer and more capable business.
The AI market is incredibly buoyant. McKinsey estimate investment in AI of between $26BN to $39BN across many verticals. This drives the need for high quality data and requires our focus on two strategic imperatives in 2018:
• The ongoing development of productivity-enabling technologies that automate our operations for the seamless, highly scalable and rapid delivery of large volumes of quality, fit-for-purpose data off a low cost base to our customers. The integration of our core and acquired Leapforce technologies underpins this work, along with further investments in engineering to ensure scalability and cement our competitive advantage.
• Further investments in sales and marketing to deepen penetration in our core customer cohort and grow into new verticals. We’re well established in the technology market and have a strong presence in the automotive and government markets. Other verticals, such as financial services, retail, media and health care are investing in AI and will require high volumes of quality data.
Our achievements in 2017 were only possible with the dedication and hard work of our talented and growing team. Our 374 full time staff grew by almost 200 during the year, enabling us to deliver on customer requirements and grow our capabilities for the future. Appen’s crowd of contract workers was bolstered by the addition of Leapforce’s crowd and now numbers in excess of 1 million, giving us extraordinary scale and competitive advantage and enabling our participation in more opportunities. We appreciate your support, along with the support of our customers, and thank our talented team and crowd for everything they do for us. It’s a privilege to be working with them. Thank you for your continued support. Sincerely
Mark Brayan Managing Director and Chief Executive Officer
For
per
sona
l use
onl
y

Appen Limited Directors' report 31 December 2017
6
The directors present their report, together with the financial statements, on the consolidated entity (referred to hereafter as the 'Group') consisting of Appen Limited (referred to hereafter as the 'Company' or 'parent entity') and the entities it controlled at the end of, or during, the year ended 31 December 2017. Directors The following persons were directors of Appen Limited during the whole of the financial year and up to the date of this report, unless otherwise stated: Christopher Charles Vonwiller – Chairman Mark Ronald Brayan Stephen John Hasker Robin Jane Low William Robert Pulver Deena Robyn Shiff Principal activities During the financial year the principal continuing activities of the Group consisted of the provision of quality data solutions and services for machine learning and artificial intelligence applications for global technology companies, auto manufacturers and government agencies. Appen operates through two operating divisions: ● Content Relevance which provides annotated data used in search technology (embedded in web, e-commerce and
social engagement) for improving relevance and accuracy of search results and ad placements; and
● Language Resources which provides annotated data used in speech recognisers, machine translation, speech synthesisers, image recognisers and other machine-learning technologies resulting in more engaging and fluent devices including internet-connected devices, in-car automotive systems and speech-enabled consumer electronics.
Supporting both divisions is a global on-demand crowd workforce providing customers with very flexible in-country linguistic and cultural expertise in support of 140 global markets. Appen was founded in 1996 and listed on the Australian Securities Exchange on 7 January 2015. Dividends Dividends paid during the financial year, to the shareholders of Appen Limited, were as follows: Group 2017 2016 $'000 $'000 Final dividend paid out of the profits reserve for the year ended 31 December 2016 of 3.0 cents per ordinary share (2016: 31 December 2015 of 3.0 cents)
2,928
2,909
Interim dividend paid out of the profits reserve for the year ended 31 December 2017 of 3.0 cents per ordinary share (2016: 31 December 2016 of 2.0 cents)
2,933
1,942
5,861 4,851
Dividend declared On 21 February 2018, the Company declared a final dividend for the year ended 31 December 2017 of 3.0 cents per share, fully franked. The dividend is to be paid out of the profits reserve. The record date for determining entitlements to the dividend is 27 February 2018. The financial effect of these dividends has not been brought to account in the financial statements for the period ended 31 December 2017 and will be recognised in subsequent financial reports.
For
per
sona
l use
onl
y

Appen Limited Directors' report 31 December 2017
7
Review of operations The profit for the Group after providing for income tax amounted to $14,282k (31 December 2016: $10,489k). Financial performance
2017
2016
Percentage change
Percentage change
constant currency
$'000 $'000 % % Language resources 40,397 37,727 7% 11% Content relevance 126,160 73,216 72% 78% Other 14 60 Total revenue from principal activities 166,571 111,003 50% 55% Underlying net profit after tax (NPAT) 19,749 10,620 86% 87% Transaction costs (net of tax) 5,467 131 Statutory NPAT 14,282 10,489 36% 51% Add tax 6,093 5,542 Add net interest expense/(income) 3 (2) EBIT* 20,378 16,029 27% 36% Depreciation and amortisation 1,863 1,153 Statutory EBITDA** 22,241 17,182 29% 38% Add non-recurring items Transaction costs 5,877 131 Underlying EBITDA 28,118 17,313 62% 73% Statutory diluted earnings per share (cents) 14.36 10.53 Underlying diluted earnings per share (cents) 19.86 10.95 % Statutory EBITDA/Sales 13.4% 15.5% % Underlying EBITDA/Sales 16.9% 15.6% % Segment Profit/Sales: Language Resources 30.1% 39.3% Content Relevance 17.6% 14.4% * EBIT is defined as earnings before tax and interest ** EBITDA is EBIT before depreciation and amortisation Total revenue for the financial year ended 31 December 2017 was $166,571k compared to 2016 revenue of $111,003k. The drivers behind this change in revenue were: ● The Language Resources division recorded a 7% (constant currency: 11%) increase in revenue over the prior year,
driven mainly by increased volumes across the technology sector; and ● The Content Relevance division delivered a 72% (constant currency: 78%) increase in revenue over the prior year.
This was largely driven by significant increases in scope and volume from major customers as well as revenue from new customers. This includes $6,008k revenue from Leapforce.
The Company reported statutory EBITDA of $22,241k representing a 29% (constant currency: 38%) increase over 2016, including $1,532k from Leapforce. This result included transaction costs of $5,877k relating to the Leapforce acquisition. Excluding these transaction costs, underlying EBITDA was $28,118k, representing a 62% (constant currency: 73%) increase over the prior year. This was driven by the significant revenue increase, gross margin improvement and operating cost efficiency through scalability and continued globalisation of operations. Operating expenses (expenses excluding services purchased, depreciation, impairment, transaction costs and finance costs) for 2017 comprised 24% of revenue as compared to 28% in 2016.
For
per
sona
l use
onl
y

Appen Limited Directors' report 31 December 2017
8
The Language Resources division return on sales decreased to 30.1% as compared to 39.3% in the prior year, due to conclusion of a significant project in the second half, change in the mix of speech data requirements (with comparatively lower levels of higher margin data collection) and investment in people and operational expenses to support future secure processing applications. The Content Relevance division return of 17.6% was significantly higher than the 2016 return of 14.4%, due to improved gross margin management, operating scale efficiencies and economies and a small contribution from Leapforce operations. The impact of foreign exchange on the translation of revenue and EBITDA resulted in real growth being higher than reported growth. Growth over the prior year in constant currency amounted to an additional 5% on top of reported revenue and an additional 11% on top of reported underlying EBITDA. Significant changes in the state of affairs There were no other significant changes in the state of affairs of the Group during the financial year, other than the Leapforce acquisition on 7 December 2017 and related equity and debt raisings. Matters subsequent to the end of the financial year Apart from the dividend declared as discussed above, no other matter or circumstance has arisen since 31 December 2017 that has significantly affected, or may significantly affect the Group's operations, the results of those operations, or the Group's state of affairs in future financial years. Likely developments and expected results of operations The Group will continue to pursue its strategy to grow profitability in Content Relevance and Language Resources across a wider customer base. Environmental regulation The Group is not subject to any significant environmental regulation under Australian Commonwealth or State Law. The Board believes that the Group has adequate systems in place for the management of its environmental requirements and is not aware of any breach of those environmental requirements as they may apply to the Group during the period covered by this report. Information on directors Name: Christopher Charles Vonwiller Title: Non-Executive Chairman Age: 75 Qualifications: BSc, BE (Hons), MBA, FIE (Aust.), FTSE Experience and expertise: Chris is the Non-Executive Chairman of Appen having formerly served as Appen
CEO from 1999-2010. Prior to joining Appen, Chris served for 20 years in senior executive positions with the Australian telecommunications carrier Telstra Corporation Limited, playing a leading role in the development and deployment of innovative internet services, multimedia, and pay television. Chris is a former Chairman of the Warren Centre for Advanced Engineering at The University of Sydney. Chris holds degrees in science and engineering, with honours, from The University of Sydney and an MBA from Macquarie University. He was elected a Fellow of the Australian Academy of Technological Sciences and Engineering in 2007.
Special responsibilities: Chairman of the board Interests in shares: 13,060,083 ordinary shares (indirectly) Interests in options: None Interests in rights: None
For
per
sona
l use
onl
y
Appen Limited Directors' report 31 December 2017
9
Name: Mark Ronald Brayan Title: Managing Director and Chief Executive Officer Age: 54 Qualifications: MBA, BSurv (Hons) Experience and expertise: Mark joined Appen in July 2015 as CEO and is responsible for the company’s
leadership, strategy and culture. Mark has over twenty-five years’ experience in technology and services. Prior to joining Appen, Mark was CEO of MST Global, a provider of technology solutions to the resources sector. Before that he was the CEO of Integrated Research Limited (ASX:IRI), an international software company listed on the Australian Stock exchange. Mark was also COO of the HR outsourcing company Talent2 (ASX:TWO) and CEO of Concept Systems (ASX:CSI) before its merger with Talent2. Mark has an MBA from the Australian Graduate School of Management and Bachelor of Surveying with 1st Class Honours from the University of NSW.
Special responsibilities: None Interests in shares: 194,908 ordinary shares (directly/indirectly) Interests in options: None Interests in rights: 297,733 performance rights Name: William Robert Pulver Title: Non-Executive Director Age: 58 Qualifications: BCom (Marketing) Experience and expertise: William (Bill) Pulver has been a non-executive director of Appen since 31 January
2013. Bill was the CEO of the Australian Rugby Union from 2013-2018 having formerly served as Appen CEO from 2010-2012. Previously he was the President and CEO of NetRatings, Inc., a NASDAQ-listed company (NTRT), specializing in Internet media and market research. Prior to this Bill held leadership roles at ACNielsen with eRatings.com, Pacific region and Australia. Bill holds a Bachelor of Commerce degree, with a major in marketing, from the University of New South Wales, Australia.
Special responsibilities: Chairman of Nominations and Remuneration Committee Interests in shares: 1,800,495 ordinary shares (indirectly) Interests in options: None Interests in rights: None Name: Robin Jane Low Title: Independent Non-Executive Director Age: 56 Qualifications: BCom, FCA, GAICD Experience and expertise: Robin Low has been a non-executive director of Appen since 30 October 2014. Her
other directorships include AUB Group Limited (AUB), CSG Limited (CSV), IPH Limited (IPH), Australian Reinsurance Pool Corporation and she is the deputy chairman of the Auditing and Assurance Standards Board. Previously Robin had a 28 year career at PricewaterhouseCoopers where she was a partner specialising in assurance and risk, mainly in financial services. Robin is also involved with not-for-profit organizations and serves on the boards of Public Education Foundation, Primary Ethics and Sydney Medical School Foundation. Robin has a Bachelor of Commerce from the University of New South Wales and is a Fellow of the Institute of Chartered Accountants.
Other current directorships: Director of AUB Group Limited (ASX: AUB), CSG Limited (ASX: CSV) and IPH Limited (ASX: IPH)
Special responsibilities: Chairman of the Audit and Risk Committee Interests in shares: 172,743 ordinary shares (indirectly) Interests in options: None Interests in rights: None
For
per
sona
l use
onl
y

Appen Limited Directors' report 31 December 2017
10
Name: Stephen John Hasker Title: Non-Executive Director Age: 48 Qualifications: B.Com, MBA, MIA, ACAA Experience and expertise: Steve Hasker has been a non-executive director of Appen since 7 April 2015. Steve is
Chief Executive Officer of Creative Artists Agency Global, based in Los Angeles where he oversees CAA’s commercial activities. Prior to joining CAA in January 2018, Steve was Global President and COO of Nielsen, based in New York, responsible for Nielsen’s commercial and product activities across all of its media and consumer businesses. Prior to joining Nielsen in 2009, he was a partner at McKinsey & Company’s Global Media, Entertainment and Information practice in New York. Before joining McKinsey, Steve spent five years in several financial roles in the U.S., Russia and Australia. Steve holds an undergraduate economics degree from the University of Melbourne and has an MBA and a master’s in international affairs, both with honours, from Columbia University. He is also a non-executive director of Global Eagle, and is a member of the Australia and NZ Institute of Chartered Accountants.
Special responsibilities: None Interests in shares: 50,000 ordinary shares Interests in options: None Interests in rights: None Name: Deena Robyn Shiff Title: Non-Executive Director Age: 63 Qualifications: B.Sc. (Econ); B.A. (Law) Experience and expertise: Deena Shiff has been a Non-Executive Director since May 2015. Deena has enjoyed
a distinguished business career covering senior roles in the legal profession and in corporate positions. She was a partner in the leading law firm Mallesons Stephen Jaques before rejoining Telstra Corporation where she rose to Group Managing Director. She holds several other non-executive director roles, including Chairman of BAI Communications and director on the board of Infrastructure Australia. She was previously a director of the Citadel Group Limited (ASX:CGL). Deena holds a degree in law from Cambridge University and a degree in economics from the London School of Economics, both with honours. She is a Fellow of the Australian Institute of Company Directors.
Special responsibilities: None Interests in shares: 50,229 ordinary shares (indirectly) Interests in options: None Interests in rights: None Company secretary Leanne Ralph was appointed as Company Secretary on 18 December 2014. Leanne brings a wealth of experience in company secretarial activities, holding the position of Company Secretary for a number of ASX listed companies. Leanne is a fellow of the Governance Institute of Australia and a graduate member of the Australian Institute of Company Directors. Meetings of directors The number of meetings of the Company's Board of Directors ('the Board') and of each Board committee held during the year ended 31 December 2017, and the number of meetings attended by each director were:
Full Board Audit and Risk Management
Committee Nomination and
Remuneration Committee Attended Held Attended Held Attended Held Christopher Vonwiller 15 15 4 4 - - William Pulver 12 15 - - 1 1 Mark Brayan 15 15 - - - - Deena Shiff 15 15 4 4 - - Stephen Hasker 12 15 - - 1 1 Robin Low 15 15 4 4 1 1 Held: represents the number of meetings held during the time the director held office or was a member of the relevant committee.
For
per
sona
l use
onl
y

Appen Limited Directors' report 31 December 2017
11
Remuneration report (audited) This report outlines the remuneration arrangements in place for key management personnel (‘KMP’) of the Company, in connection with the management of the affairs of the entity and its subsidiaries, during the year to 31 December 2017 (‘Remuneration Report’). KMP have authority and responsibility for planning, directing and controlling the activities of the Company and the consolidated entity, including Directors of the Company and other executives. KMP comprise the Directors of the Company and executives of the Company and the consolidated entity. This Remuneration Report has been audited and an opinion provided as required by section 308(3C) of the Corporations Act 2001 (Cth). The Remuneration Report is set out under the following main headings: 1 Remuneration Philosophy – Governance & Principles 2 Nomination and Remuneration Committee 3 Audit and Risk Management Committee 4 Non-Executive Director Remuneration and Shareholding 5 Executive Remuneration 6 Executive Shareholdings The figures are in Australian Dollars unless otherwise noted. Details of key management personnel for 2017 C Vonwiller Non-Executive Chairman S Hasker Independent Non-Executive Director R Low Independent Non-Executive Director W Pulver Independent Non-Executive Director D Shiff Independent Non-Executive Director And the following persons: M Brayan Managing Director and Chief Executive Officer K Levine Chief Financial Officer P Hall Senior Vice-President, Language Resources T Garves Senior Vice-President, Content Relevance 1. Remuneration Philosophy – Governance & Principles The Company’s objective is to provide the maximum benefit to shareholders. The Board believes that the Company will achieve this objective by retaining a high quality Board and executive team remunerated fairly and appropriately. The Company’s remuneration philosophy is to ensure that the level and composition of remuneration is both competitive and reasonable. Remuneration should be linked to performance and appropriate for the results delivered. The Company’s policies are designed to attract and maintain talented and motivated Directors and employees, thereby raising the level of performance of the Company and enhancing shareholder value. The Company’s remuneration policy is to: ● implement remuneration structures designed to attract and retain high quality directors and be globally competitive
and continually benchmarked to attract, retain and motivate senior executives with the expertise to enhance the performance and growth of the Company and create value for shareholders;
● ensure that: ● executive directors and senior executives are encouraged to pursue the growth and success of the Company
(both in the short-term and over the longer term), without taking undue risks; and ● non-executive directors’ remuneration is consistent with their obligation to bring an independent judgement to
matters before the Board; ● review the employment conditions of Appen’s employees on an ongoing basis to ensure the Company remains
competitive in terms of remuneration and other incentives; and ● review employee incentive plans from time to time with a view to further aligning management and employees’
interests with those of the Company and shareholders.
For
per
sona
l use
onl
y

Appen Limited Directors' report 31 December 2017
12
In accordance with best practice corporate governance, the structure of Non-Executive Director and executive remuneration is separate and distinct. 2. Nomination and Remuneration Committee The Board has established a Nomination and Remuneration Committee, which provides advice, recommendations and assistance to the Board in relation to compensation arrangements for Directors and executives. The Nomination and Remuneration Committee assesses the appropriateness of the nature and amount of emoluments of officers on a periodic basis by reference to relevant employment market conditions, with the overall objective of ensuring maximum shareholder benefit from the retention of a high quality Board and executive team. It is intended that any schemes or other structures chosen will be optimal for the recipient without creating undue cost for the Company. The members of the Nomination and Remuneration Committee during the reporting period were: William Pulver, Committee Chairman; Robin Low; and Stephen Hasker. The number of meetings of the Nomination and Remuneration Committee held during the reporting period, and attendance by the Nomination and Remuneration Committee members, is set out in the ‘Meetings of directors’ section of the Directors’ Report. Further information about the Nomination and Remuneration Committee is set out in the Company’s Corporate Governance Statement, which is available at https://appen.com/investors/corporate-governance/. 3. Audit and Risk Management Committee The Board has established an Audit and Risk Management Committee to assist the Board in fulfilling its statutory, corporate governance, risk management and compliance practices and responsibilities. The Audit and Risk Management Committee monitors and reviews the integrity of the Company’s internal financial reporting and external financial statements, the effectiveness of internal financial controls, the independence, objectivity and performance of external auditors; and the policies on risk oversight and management, and makes recommendations to the Board in relation to the appointment of external auditors and approving the remuneration and terms of their engagement. The members of the Audit and Risk Management Committee during the reporting period were: Robin Low, Committee Chairman; Chris Vonwiller and Deena Shiff. The number of meetings of the Audit and Risk Committee held during the reporting period, and attendance by the Nomination and Remuneration Committee members, is set out in the ‘Meetings of directors’ section of the Directors’ Report. Further information about the Audit and Risk Management Committee is set out in the Company’s Corporate Governance Statement, which is available at https://appen.com/investors/corporate-governance/.
For
per
sona
l use
onl
y

Appen Limited Directors' report 31 December 2017
13
4. Non-Executive Director Remuneration and Shareholdings Remuneration Non-Executive Directors are remunerated by way of Board and Committee fees that were set prior to the Company’s listing on the ASX. The current fee structure for Non-Executive Directors (effective 1 July 2017) is as follows: Role Fee * Board Chairman $105,000 Non-Executive Director $70,000 Audit and Risk Committee Chairman $15,000 Nomination and Remuneration Committee Chairman $12,500 * All fees are inclusive of statutory superannuation. The Non-Executive Directors are remunerated from the maximum aggregate amount approved by shareholders. The current fee pool limit of $450,000 was approved by shareholders prior to the Company’s listing on ASX. Details of fees paid to directors in 2016 and 2017 are outlined below: Amounts paid to Non-Executive Directors 2017 2016 Super- Super- Fees annuation Total Fees annuation Total Director $ $ $ $ $ $ C Vonwiller 60,750 33,000 93,750 67,500 22,500 90,000 W Pulver 63,356 6,019 69,375 59,361 5,639 65,000 R Low 67,352 6,398 73,750 63,927 6,073 70,000 J Samuel* 9,167 - 9,167 50,417 - 50,417 D Shiff 53,653 5,097 58,750 50,228 4,772 55,000 S Hasker 58,750 - 58,750 55,000 - 55,000 313,028 50,514 363,542 346,433 38,984 385,417 * Jeremy Samuel resigned as Non-Executive Director on 29 November 2016. He waived his entitlement to directors’
fees until the end of 31 December 2015. The amount of aggregate remuneration sought to be approved by shareholders and the manner in which it is apportioned among Directors will be reviewed annually. The Board seeks to set aggregate Director remuneration at a level that provides the Company with the ability to attract and retain Directors of the highest calibre, while incurring a cost that is acceptable to shareholders. The Board will consider fees paid to Non-Executive Directors of comparable companies when undertaking the annual review, as well as any additional time commitment of Directors who serve on one or more Committees, and any other assistance to the Company in respect of specific projects or transactions. The remuneration packages of Non-Executive Directors are fee-based. Non-executive Directors do not participate in the schemes designed for the remuneration of executives, or performance-based schemes or awards such as options or bonus payments. Non-executive Directors are not entitled to any retirement benefits other than statutory superannuation. Non-Executive Director Shareholdings The Company does not currently have a formal minimum shareholding requirement for Non-Executive Directors, however Non-Executive Directors are encouraged by the Board to hold shares purchased on-market in accordance with the Company’s Securities Dealing Policy. The Board considers that by holding shares in the Company, Directors align themselves with the interests of the shareholders as a whole.
For
per
sona
l use
onl
y

Appen Limited Directors' report 31 December 2017
14
As the date of this Remuneration Report the Directors held the following shareholdings in the Company: Number of shares Purchased Sold 1 January during during 31 December Director 2017 the year the year 2017 C Vonwiller 13,060,083 - - 13,060,083 W Pulver 2,300,266 229 (500,000) 1,800,266 M Brayan 194,450 458 - 194,908 R Low 165,014 7,729 - 172,743 D Shiff 50,000 229 - 50,229 S Hasker 50,000 - - 50,000 15,819,813 8,645 (500,000) 15,328,229 5. Executive Remuneration The Company aims to reward executives with a level and mix of remuneration commensurate with their position and responsibilities within the Company so as to: ● reward executives by reference to both company and individual performance; ● align the interests of executives with those of shareholders; ● encourage retention of executives and other employees; ● link reward with the strategic goals and performance of the Company; and ● ensure total remuneration is competitive by market standards. In considering the Group’s performance and benefits for shareholder wealth, the Remuneration and Nomination Committee considered the following metrics over the last five years: 2017 2016 2015 2014 2013 $’000 $’000 $’000 $’000 $’000 Net profit after tax 14,282 10,489 8,308 1,616 1,585.Underlying net profit after tax * 19,749 10,620 8,308 1,616 1,585 Underlying EBITDA ** 28,118 17,312 13,822 6,674 6,999 Dividends 5,861 4,851 1,155 1,188 724 Basic earnings per share - cents per share 14.55 10.81 8.67 2.15 2.15 Basic underlying earnings per share – cents per share *
20.12
10.95
8.67
2.15
2.15
* Before transaction costs (tax adjusted) ** Earnings before interest, tax, depreciation, amortisation, change in fair value of contingent consideration, transaction
costs and excise tax refund. Executive remuneration comprises of: ● fixed remuneration; ● short term incentives; and ● long term incentives through equity based compensation. Service Contracts Remuneration and other terms of employment for KMP are formalised in service contracts. All executive KMP service contracts provide for immediate termination in the event of serious misconduct. Details of other key terms are summarised below:
Executive
Role
Contract Term Annual Salary
Review Notice Period by either
party M Brayan Managing Director No fixed term 1 March 6 months K Levine CFO No fixed term 1 March 3 months P Hall SVP, Language Resources No fixed term 1 March 13 weeks T Garves SVP, Content Relevance No fixed term 1 March 90 days
For
per
sona
l use
onl
y

Appen Limited Directors' report 31 December 2017
15
Fixed Remuneration Fixed remuneration consists of base pay, superannuation and other non-monetary benefits and is designed to reward for: ● the scope of the executive’s role; ● the executive’s skills, experience and qualifications; and ● individual performance. Executives are offered a competitive base pay. Reference is made to industry benchmarks to ensure that the base pay is set to reflect the market for a comparable role. Base pay is reviewed annually by reference to both the individual’s and the consolidated entity’s performance, and alignment with market remuneration levels. There are no guaranteed base pay increases included in any executive contracts. Short Term Incentives Executive service contracts recognise the potential for the award of short term incentives linked to specific performance criteria. The Company operates an executive bonus plan that entitles certain executives of the Company to a cash bonus ranging from 0% to 150% of a target bonus, which is typically a percentage of the relevant executive’s annual salary. Key performance measures for payment of a bonus and the typical percentage weighting for each measure are as follows: Performance Measure 2017 Weighting 2016 Weighting Revenue 33% 33% EBITDA 67% 67%
Therefore, if the Company achieves 50% of the revenue target and 100% of the EBITDA target, the overall score for the purposes of the calculation of any bonus (‘Financial Metric’) that may be awarded would be 83.5% of the relevant executive’s on-target bonus. Any actual bonus that may be awarded is calculated on a sliding scale between 0% and 150% - for example: Financial Metric Potential Bonus amount - % of target bonus Below 80% Nil 80% 64% 90% 81% 122.25% or more 150% Using the performance measures and personal performance objectives assessed against key performance indicators (‘KPIs’), the Company ensures variable rewards are only paid when the relevant KMP have met or exceeded their agreed individual work plan objectives, financial metrics have been achieved and value has been created for shareholders. The Board reviews the Financial Metric on an annual basis. Any bonus payment is at the discretion of the Board and is subject to Board approval. Performance and Remuneration Outcomes At the end of the financial year, the Remuneration and Nomination Committee reviewed the performance against each of the metrics to determine a recommended short term incentive (‘STI’) payment for the relevant executive KMPs. This recommendation was subsequently reviewed and approved by the Board. The tables below outline the performance results against these metrics and the final STI payment made to the executives. 2017 Results and STI Payments Target Actual % Actual / Target % Payout * Revenue ** $132,724,000 $160,546,995 121% 146% EBITDA ** $21,401,000 $26,574,323 124% 150% * Payout capped at 150% ** Excludes contribution from Leapforce and transaction costs Weighted average performance payout is 149%
For
per
sona
l use
onl
y
Appen Limited Directors' report 31 December 2017
16
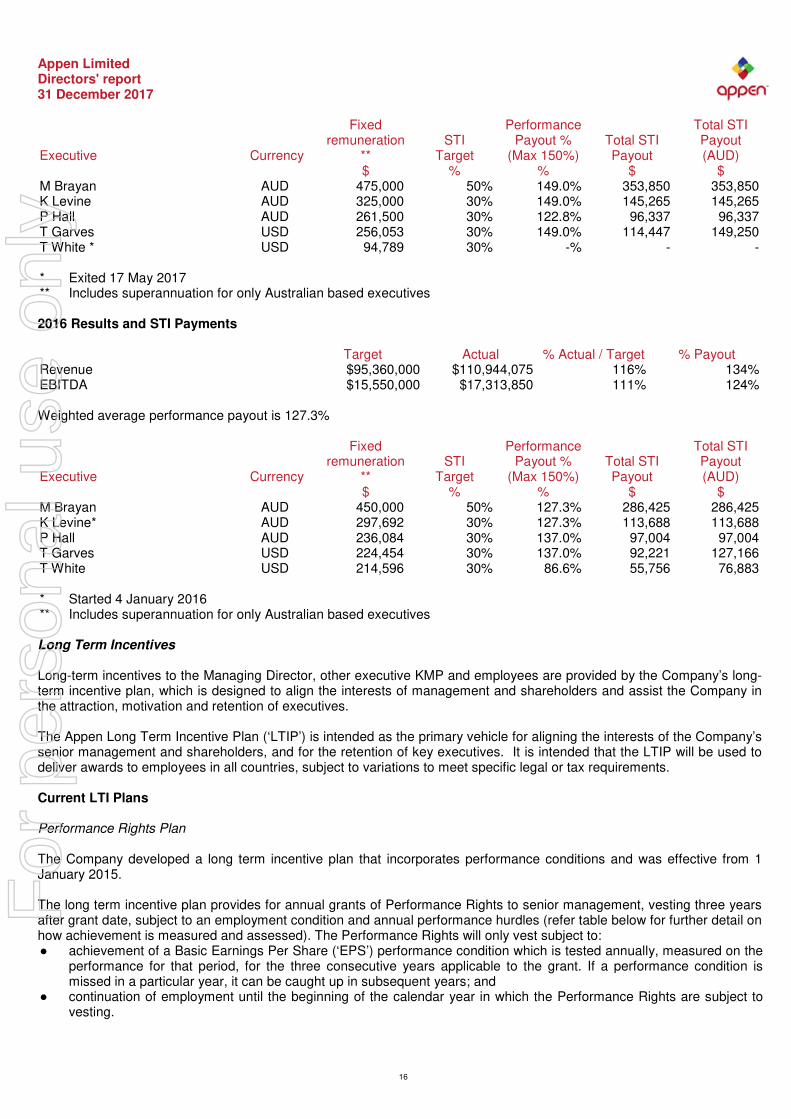
Fixed Performance Total STI remuneration STI Payout % Total STI Payout Executive Currency ** Target (Max 150%) Payout (AUD) $ % % $ $ M Brayan AUD 475,000 50% 149.0% 353,850 353,850 K Levine AUD 325,000 30% 149.0% 145,265 145,265 P Hall AUD 261,500 30% 122.8% 96,337 96,337 T Garves USD 256,053 30% 149.0% 114,447 149,250 T White * USD 94,789 30% -% - -
* Exited 17 May 2017 ** Includes superannuation for only Australian based executives 2016 Results and STI Payments Target Actual % Actual / Target % Payout Revenue $95,360,000 $110,944,075 116% 134% EBITDA $15,550,000 $17,313,850 111% 124% Weighted average performance payout is 127.3% Fixed Performance Total STI remuneration STI Payout % Total STI Payout Executive Currency ** Target (Max 150%) Payout (AUD) $ % % $ $ M Brayan AUD 450,000 50% 127.3% 286,425 286,425 K Levine* AUD 297,692 30% 127.3% 113,688 113,688 P Hall AUD 236,084 30% 137.0% 97,004 97,004 T Garves USD 224,454 30% 137.0% 92,221 127,166 T White USD 214,596 30% 86.6% 55,756 76,883
* Started 4 January 2016 ** Includes superannuation for only Australian based executives Long Term Incentives Long-term incentives to the Managing Director, other executive KMP and employees are provided by the Company’s long-term incentive plan, which is designed to align the interests of management and shareholders and assist the Company in the attraction, motivation and retention of executives. The Appen Long Term Incentive Plan (‘LTIP’) is intended as the primary vehicle for aligning the interests of the Company’s senior management and shareholders, and for the retention of key executives. It is intended that the LTIP will be used to deliver awards to employees in all countries, subject to variations to meet specific legal or tax requirements. Current LTI Plans Performance Rights Plan The Company developed a long term incentive plan that incorporates performance conditions and was effective from 1 January 2015. The long term incentive plan provides for annual grants of Performance Rights to senior management, vesting three years after grant date, subject to an employment condition and annual performance hurdles (refer table below for further detail on how achievement is measured and assessed). The Performance Rights will only vest subject to: ● achievement of a Basic Earnings Per Share (‘EPS’) performance condition which is tested annually, measured on the
performance for that period, for the three consecutive years applicable to the grant. If a performance condition is missed in a particular year, it can be caught up in subsequent years; and
● continuation of employment until the beginning of the calendar year in which the Performance Rights are subject to vesting.
For
per
sona
l use
onl
y
Appen Limited Directors' report 31 December 2017
17
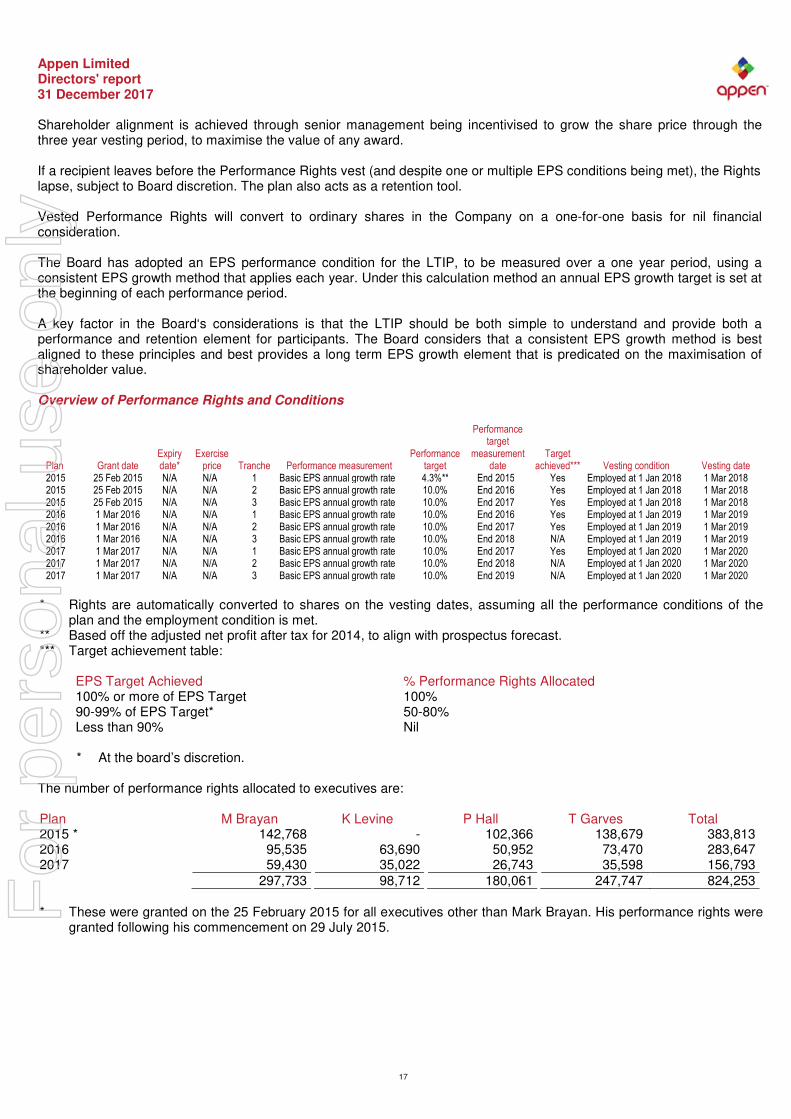
Shareholder alignment is achieved through senior management being incentivised to grow the share price through the three year vesting period, to maximise the value of any award. If a recipient leaves before the Performance Rights vest (and despite one or multiple EPS conditions being met), the Rights lapse, subject to Board discretion. The plan also acts as a retention tool. Vested Performance Rights will convert to ordinary shares in the Company on a one-for-one basis for nil financial consideration. The Board has adopted an EPS performance condition for the LTIP, to be measured over a one year period, using a consistent EPS growth method that applies each year. Under this calculation method an annual EPS growth target is set at the beginning of each performance period. A key factor in the Board‘s considerations is that the LTIP should be both simple to understand and provide both a performance and retention element for participants. The Board considers that a consistent EPS growth method is best aligned to these principles and best provides a long term EPS growth element that is predicated on the maximisation of shareholder value. Overview of Performance Rights and Conditions
Plan Grant date Expiry date*
Exercise price Tranche Performance measurement
Performance target
Performance target
measurement date
Target achieved*** Vesting condition Vesting date
2015 25 Feb 2015 N/A N/A 1 Basic EPS annual growth rate 4.3%** End 2015 Yes Employed at 1 Jan 2018 1 Mar 2018 2015 25 Feb 2015 N/A N/A 2 Basic EPS annual growth rate 10.0% End 2016 Yes Employed at 1 Jan 2018 1 Mar 2018 2015 25 Feb 2015 N/A N/A 3 Basic EPS annual growth rate 10.0% End 2017 Yes Employed at 1 Jan 2018 1 Mar 2018 2016 1 Mar 2016 N/A N/A 1 Basic EPS annual growth rate 10.0% End 2016 Yes Employed at 1 Jan 2019 1 Mar 2019 2016 1 Mar 2016 N/A N/A 2 Basic EPS annual growth rate 10.0% End 2017 Yes Employed at 1 Jan 2019 1 Mar 2019 2016 1 Mar 2016 N/A N/A 3 Basic EPS annual growth rate 10.0% End 2018 N/A Employed at 1 Jan 2019 1 Mar 2019 2017 1 Mar 2017 N/A N/A 1 Basic EPS annual growth rate 10.0% End 2017 Yes Employed at 1 Jan 2020 1 Mar 2020 2017 1 Mar 2017 N/A N/A 2 Basic EPS annual growth rate 10.0% End 2018 N/A Employed at 1 Jan 2020 1 Mar 2020 2017 1 Mar 2017 N/A N/A 3 Basic EPS annual growth rate 10.0% End 2019 N/A Employed at 1 Jan 2020 1 Mar 2020
* Rights are automatically converted to shares on the vesting dates, assuming all the performance conditions of the
plan and the employment condition is met. ** Based off the adjusted net profit after tax for 2014, to align with prospectus forecast. *** Target achievement table:
EPS Target Achieved % Performance Rights Allocated 100% or more of EPS Target 100% 90-99% of EPS Target* 50-80% Less than 90% Nil
* At the board’s discretion. The number of performance rights allocated to executives are: Plan M Brayan K Levine P Hall T Garves Total 2015 * 142,768 - 102,366 138,679 383,813 2016 95,535 63,690 50,952 73,470 283,647 2017 59,430 35,022 26,743 35,598 156,793 297,733 98,712 180,061 247,747 824,253 * These were granted on the 25 February 2015 for all executives other than Mark Brayan. His performance rights were
granted following his commencement on 29 July 2015.
For
per
sona
l use
onl
y
Appen Limited Directors' report 31 December 2017
18
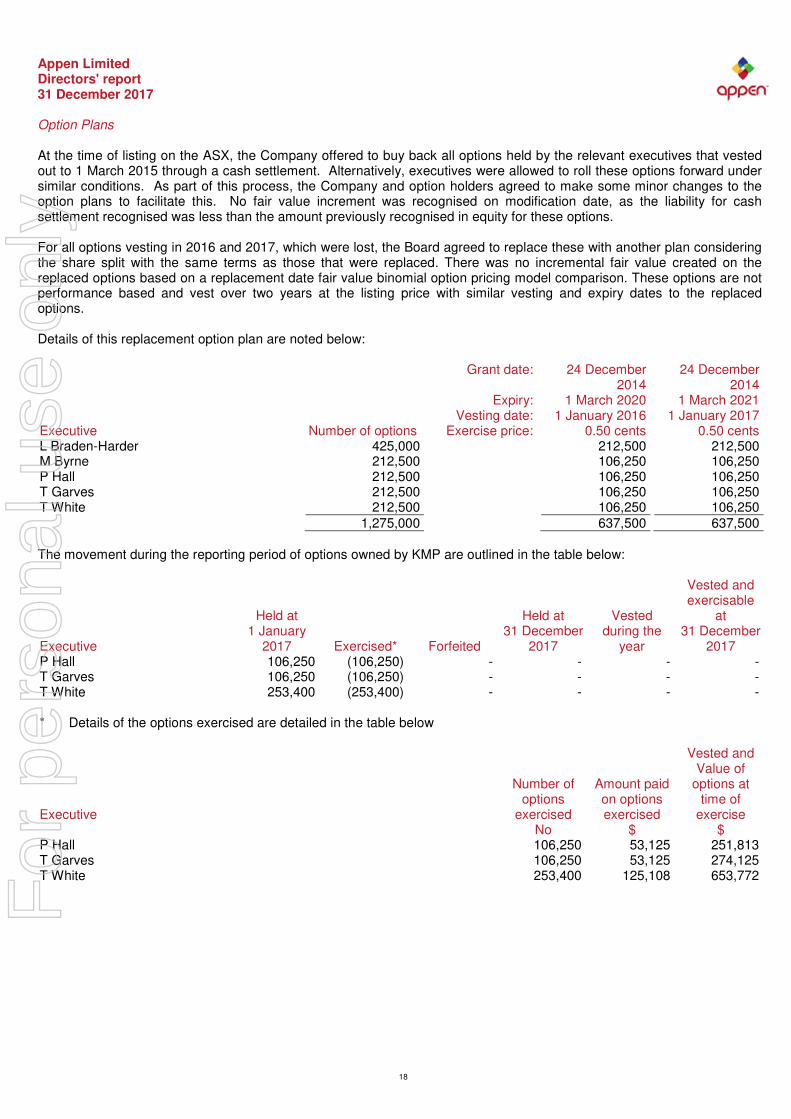
Option Plans At the time of listing on the ASX, the Company offered to buy back all options held by the relevant executives that vested out to 1 March 2015 through a cash settlement. Alternatively, executives were allowed to roll these options forward under similar conditions. As part of this process, the Company and option holders agreed to make some minor changes to the option plans to facilitate this. No fair value increment was recognised on modification date, as the liability for cash settlement recognised was less than the amount previously recognised in equity for these options. For all options vesting in 2016 and 2017, which were lost, the Board agreed to replace these with another plan considering the share split with the same terms as those that were replaced. There was no incremental fair value created on the replaced options based on a replacement date fair value binomial option pricing model comparison. These options are not performance based and vest over two years at the listing price with similar vesting and expiry dates to the replaced options. Details of this replacement option plan are noted below:
Grant date:
24 December 2014
24 December 2014
Expiry: 1 March 2020 1 March 2021 Vesting date: 1 January 2016 1 January 2017 Executive Number of options Exercise price: 0.50 cents 0.50 cents L Braden-Harder 425,000 212,500 212,500 M Byrne 212,500 106,250 106,250 P Hall 212,500 106,250 106,250 T Garves 212,500 106,250 106,250 T White 212,500 106,250 106,250 1,275,000 637,500 637,500 The movement during the reporting period of options owned by KMP are outlined in the table below: Vested and exercisable Held at Held at Vested at 1 January 31 December during the 31 December Executive 2017 Exercised* Forfeited 2017 year 2017 P Hall 106,250 (106,250) - - - - T Garves 106,250 (106,250) - - - - T White 253,400 (253,400) - - - -
* Details of the options exercised are detailed in the table below Vested and Value of Number of Amount paid options at options on options time of Executive exercised exercised exercise No $ $ P Hall 106,250 53,125 251,813 T Garves 106,250 53,125 274,125 T White 253,400 125,108 653,772
For
per
sona
l use
onl
y
Appen Limited Directors' report 31 December 2017
19
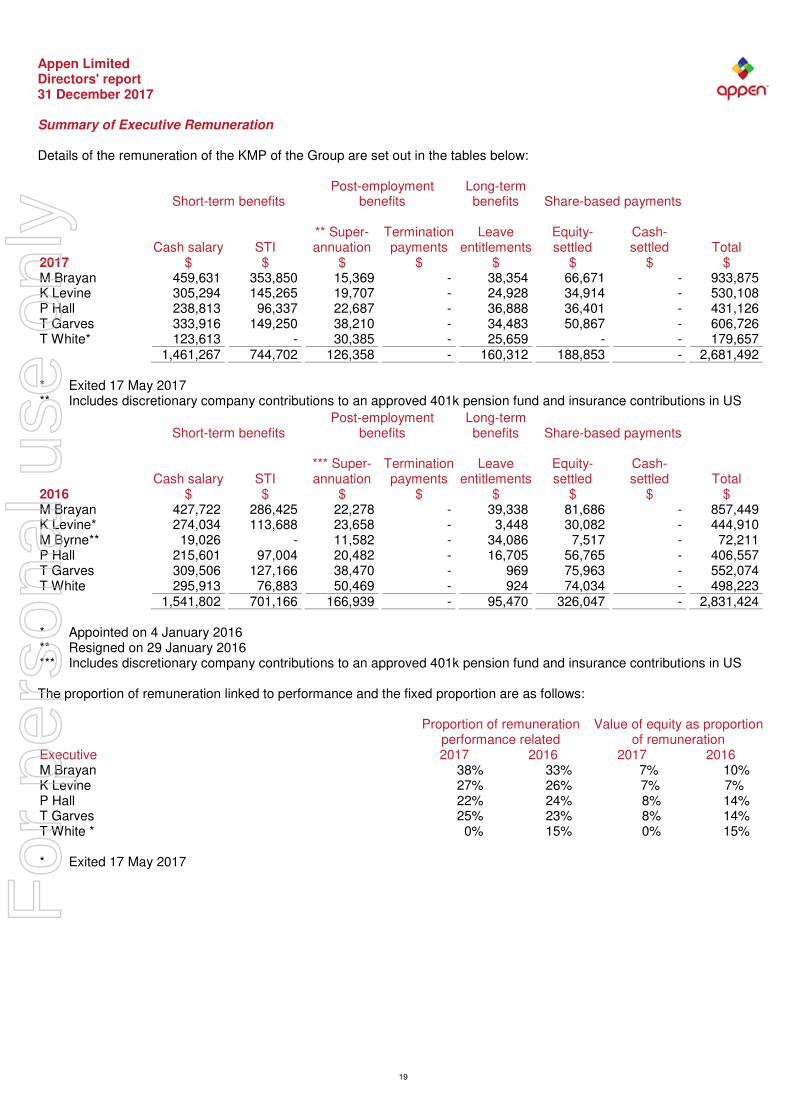
Summary of Executive Remuneration Details of the remuneration of the KMP of the Group are set out in the tables below:
Short-term benefits Post-employment
benefits Long-term benefits
Share-based payments
** Super- Termination Leave Equity- Cash- Cash salary STI annuation payments entitlements settled settled Total 2017 $ $ $ $ $ $ $ $ M Brayan 459,631 353,850 15,369 - 38,354 66,671 - 933,875 K Levine 305,294 145,265 19,707 - 24,928 34,914 - 530,108 P Hall 238,813 96,337 22,687 - 36,888 36,401 - 431,126 T Garves 333,916 149,250 38,210 - 34,483 50,867 - 606,726 T White* 123,613 - 30,385 - 25,659 - - 179,657 1,461,267 744,702 126,358 - 160,312 188,853 - 2,681,492 * Exited 17 May 2017 ** Includes discretionary company contributions to an approved 401k pension fund and insurance contributions in US
Short-term benefits Post-employment
benefits Long-term benefits
Share-based payments
*** Super- Termination Leave Equity- Cash- Cash salary STI annuation payments entitlements settled settled Total 2016 $ $ $ $ $ $ $ $ M Brayan 427,722 286,425 22,278 - 39,338 81,686 - 857,449 K Levine* 274,034 113,688 23,658 - 3,448 30,082 - 444,910 M Byrne** 19,026 - 11,582 - 34,086 7,517 - 72,211 P Hall 215,601 97,004 20,482 - 16,705 56,765 - 406,557 T Garves 309,506 127,166 38,470 - 969 75,963 - 552,074 T White 295,913 76,883 50,469 - 924 74,034 - 498,223 1,541,802 701,166 166,939 - 95,470 326,047 - 2,831,424 * Appointed on 4 January 2016 ** Resigned on 29 January 2016 *** Includes discretionary company contributions to an approved 401k pension fund and insurance contributions in US The proportion of remuneration linked to performance and the fixed proportion are as follows:
Proportion of remuneration
performance related Value of equity as proportion
of remuneration Executive 2017 2016 2017 2016 M Brayan 38% 33% 7% 10% K Levine 27% 26% 7% 7% P Hall 22% 24% 8% 14% T Garves 25% 23% 8% 14% T White * 0% 15% 0% 15% * Exited 17 May 2017
For
per
sona
l use
onl
y

Appen Limited Directors' report 31 December 2017
20
6. Executive Shareholdings The table below outlines the current shares, rights and options held by the executive KMP as at 31 December 2017:
Executive
Number of ordinary shares currently held (direct and indirect)
Security
Plan
Number M Brayan 194,908 Rights 2015 142,768 Rights 2016 95,535 Rights 2017 59,430 K Levine 76,582 Rights 2016 63,690 Rights 2017 35,022 P Hall 212,729 Rights 2015 102,366 Rights 2016 50,952 Rights 2017 26,743 T Garves 12,725 Rights 2015 138,679 Rights 2016 73,470 Rights 2017 35,598 It is company policy that Directors and KMP must not enter into transactions in associated products that operate to limit the economic risk of security holdings in the Company. A copy of the Company’s Securities Dealing Policy is available at https://appen.com/investors/corporate-governance/. Shares under option Unissued ordinary shares of the Company under option at the date of this Remuneration Report are as follows: Exercise Number Expiry date price of options 1 March 2019 $0.494 81,800 1 March 2020 $0.500 13,281 1 March 2021 $0.500 13,281 108,362
Options and rights granted to directors and executives of the Company There were no options or rights granted to the Non-Executive Directors during the year. During or since the end of the financial year, the Company granted rights to the following five, most highly remunerated officers of the Company as part of their remuneration: Number Executive of rights Mark Brayan 59,430 Kevin Levine 35,022 Philip Hall 26,743 Tammy Garves 35,598 156,793
Shares issued on the exercise of options During the year, 653,950 ordinary shares of the Company were issued and fully paid for, on the exercise of options during the year ended 31 December 2017 and up to the date of this Remuneration Report as outlined below (there are no amounts unpaid on the shares issued). Shares issued on the exercise of performance rights During the year, 9,398 ordinary shares of the Company were issued on the exercise of performance rights during the year ended 31 December 2017 and up to the date of this Remuneration Report. This concludes the remuneration report, which has been audited.
For
per
sona
l use
onl
y
Appen Limited Directors' report 31 December 2017
21
Indemnity and insurance of officers The Company has indemnified the current and former directors and executives of the Company and its’ controlled entities for costs incurred, in their capacity as a director or executive, for which they may be held personally liable, except where there is a lack of good faith. During the financial year, the Company paid a premium in respect of a contract to insure the current and former directors and executives of the Company and its controlled entities against a liability to the extent permitted by the Corporations Act 2001. The contract of insurance prohibits disclosure of the nature of liability and the amount of the premium. Executives include all the key management personnel as defined in the remuneration report as well as their direct reports. Indemnity and insurance of auditor The Company has not, during or since the end of the financial year, indemnified or agreed to indemnify the auditor of the Company or any related entity against a liability incurred by the auditor. During the financial year, the Company has not paid a premium in respect of a contract to insure the auditor of the Company or any related entity. Proceedings on behalf of the Company No person has applied to the Court under section 237 of the Corporations Act 2001 for leave to bring proceedings on behalf of the Company, or to intervene in any proceedings to which the Company is a party for the purpose of taking responsibility on behalf of the Company for all or part of those proceedings. Auditor independence and non-audit services The directors received an independence declaration from KPMG as required under section 307C of the Corporations Act 2001. It is set out immediately after the Directors' report. During the year KPMG, the Group’s auditor, has performed certain other services in addition to the audit and review of the financial statements. These relate to transfer pricing, employee share scheme, transaction assistance and taxation services, including US excise services. Details of the amounts paid or payable to the auditor for non-audit services provided during the financial year by the auditor are outlined in note 25 to the financial statements. The directors are satisfied that the provision of non-audit services during the financial year, by the auditor (or by another person or firm on the auditor's behalf), is compatible with the general standard of independence for auditors imposed by the Corporations Act 2001. Auditor KPMG continues in office in accordance with section 327 of the Corporations Act 2001. Rounding of amounts The Company is of a kind referred to in ASIC Corporations (Rounding in Financial/Directors Reports) Instrument 2016/191 (Rounding Instrument), issued by the Australian Securities and Investments Commission, relating to 'rounding-off'. Amounts in this report have been rounded off in accordance with that Corporations Instrument to the nearest thousand dollars, or in certain cases, the nearest dollar. This report is made in accordance with a resolution of directors, pursuant to section 298(2)(a) of the Corporations Act 2001. On behalf of the directors
___________________________ Christopher Vonwiller Director 21 February 2018 Sydney
For
per
sona
l use
onl
y
Lead Auditor’s Independence Declaration under
Section 307C of the Corporations Act 2001
To the Directors of Appen Limited
I declare that, to the best of my knowledge and belief, in relation to the audit of Appen Limited for the
financial year ended 31 December 2017 there have been:
i. no contraventions of the auditor independence requirements as set out in the
Corporations Act 2001 in relation to the audit; and
ii. no contraventions of any applicable code of professional conduct in relation to the audit.
KPMG Tony Nimac
Partner
Sydney
21 February 2018
22
For
per
sona
l use
onl
y
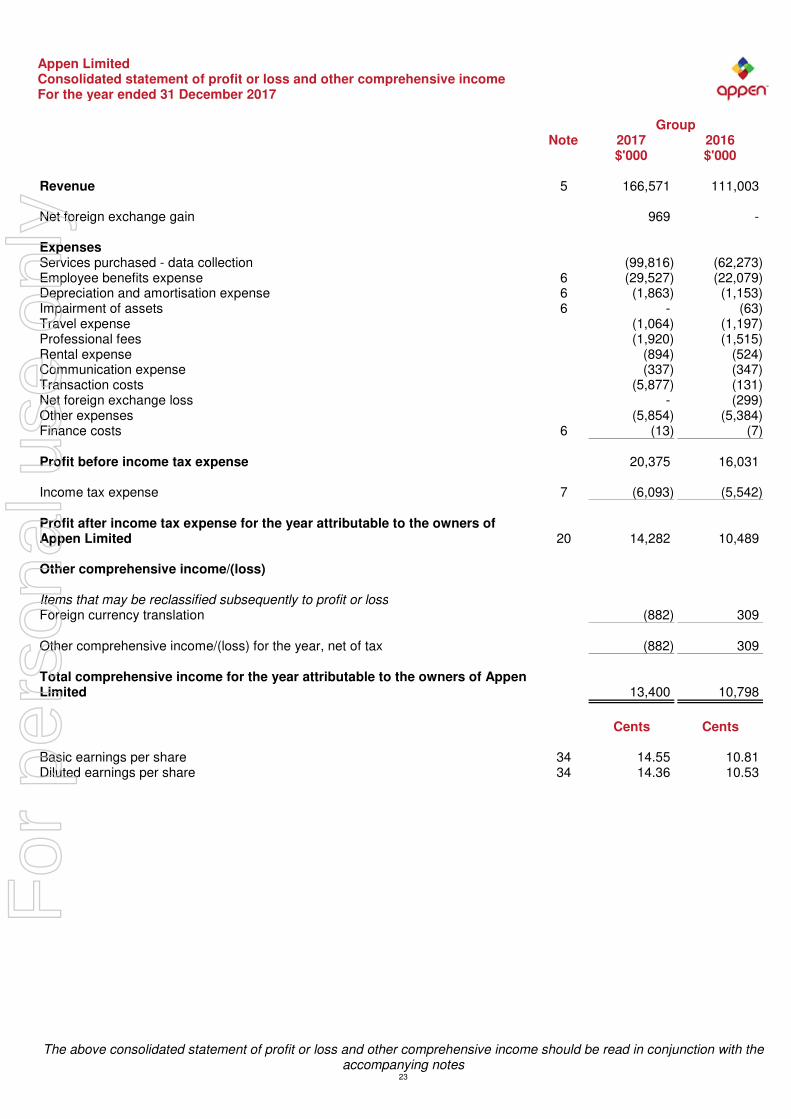
Appen Limited Consolidated statement of profit or loss and other comprehensive income For the year ended 31 December 2017
Group Note 2017 2016 $'000 $'000
The above consolidated statement of profit or loss and other comprehensive income should be read in conjunction with the accompanying notes
23
Revenue 5 166,571 111,003 Net foreign exchange gain 969 - Expenses Services purchased - data collection (99,816) (62,273) Employee benefits expense 6 (29,527) (22,079) Depreciation and amortisation expense 6 (1,863) (1,153) Impairment of assets 6 - (63) Travel expense (1,064) (1,197) Professional fees (1,920) (1,515) Rental expense (894) (524) Communication expense (337) (347) Transaction costs (5,877) (131) Net foreign exchange loss - (299) Other expenses (5,854) (5,384) Finance costs 6 (13) (7) Profit before income tax expense 20,375 16,031 Income tax expense 7 (6,093) (5,542) Profit after income tax expense for the year attributable to the owners of Appen Limited
20
14,282
10,489
Other comprehensive income/(loss) Items that may be reclassified subsequently to profit or loss Foreign currency translation (882) 309 Other comprehensive income/(loss) for the year, net of tax (882) 309 Total comprehensive income for the year attributable to the owners of Appen Limited
13,400
10,798
Cents Cents Basic earnings per share 34 14.55 10.81 Diluted earnings per share 34 14.36 10.53
For
per
sona
l use
onl
y

Appen Limited Consolidated statement of financial position As at 31 December 2017
Group Note 2017 2016 $'000 $'000
The above consolidated statement of financial position should be read in conjunction with the accompanying notes 24
Assets Current assets Cash and cash equivalents 8 24,015 16,471 Trade and other receivables 9 42,908 21,861 Derivative financial instruments 10 123 - Prepayments 1,121 415 Total current assets 68,167 38,747 Non-current assets Property, plant and equipment 1,762 725 Intangibles 11 116,253 14,543 Other non-current assets 1,866 12 Total non-current assets 119,881 15,280 Total assets 188,048 54,027 Liabilities Current liabilities Trade and other payables 12 21,173 12,177 Derivative financial instruments 13 46 199 Income tax 1,303 1,447 Provisions 14 1,151 884 Revenue received in advance 1,237 716 Total current liabilities 24,910 15,423 Non-current liabilities Borrowings 15 67,885 6 Deferred tax 16 1,369 2,778 Provisions 17 473 417 Total non-current liabilities 69,727 3,201 Total liabilities 94,637 18,624 Net assets 93,411 35,403
Equity Issued capital 18 69,569 19,510 Reserves 19 27,712 19,763 Accumulated losses 20 (3,870) (3,870) Total equity 93,411 35,403
For
per
sona
l use
onl
y
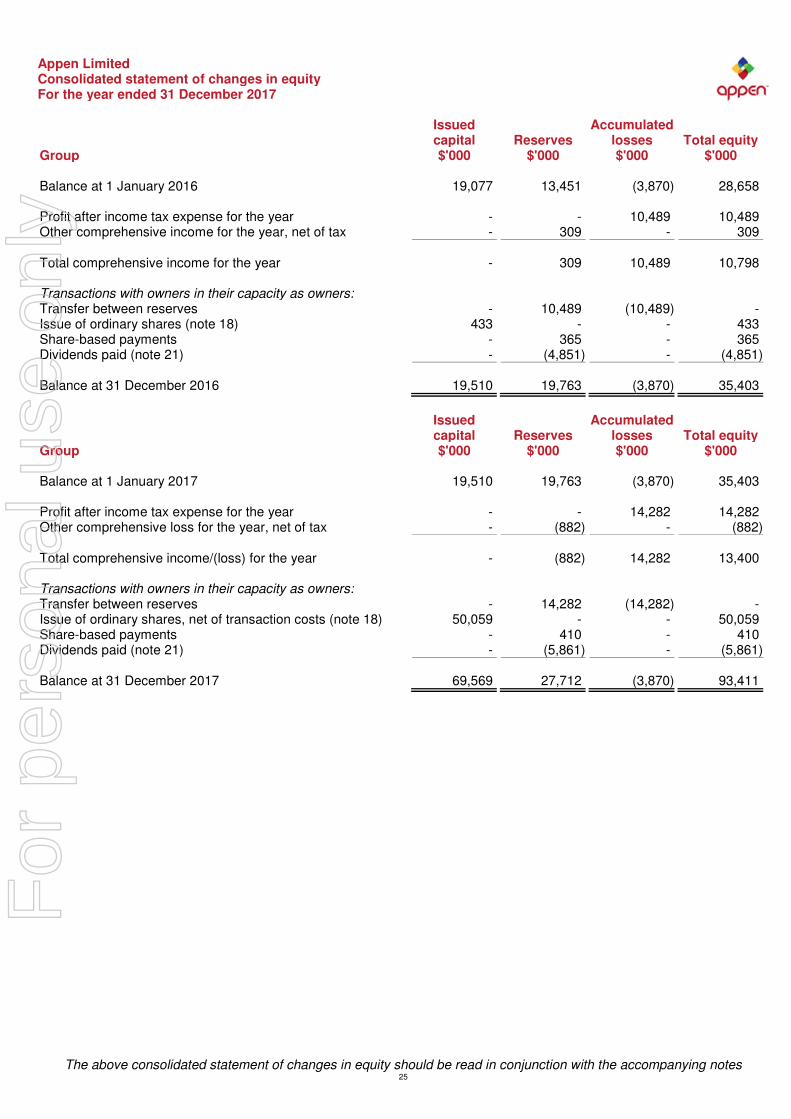
Appen Limited Consolidated statement of changes in equity For the year ended 31 December 2017
The above consolidated statement of changes in equity should be read in conjunction with the accompanying notes 25
Issued Accumulated Total equity capital Reserves losses
Group $'000 $'000 $'000 $'000 Balance at 1 January 2016 19,077 13,451 (3,870) 28,658 Profit after income tax expense for the year - - 10,489 10,489 Other comprehensive income for the year, net of tax - 309 - 309 Total comprehensive income for the year - 309 10,489 10,798 Transactions with owners in their capacity as owners: Transfer between reserves - 10,489 (10,489) - Issue of ordinary shares (note 18) 433 - - 433 Share-based payments - 365 - 365 Dividends paid (note 21) - (4,851) - (4,851) Balance at 31 December 2016 19,510 19,763 (3,870) 35,403
Issued Accumulated
Total equity capital Reserves losses Group $'000 $'000 $'000 $'000 Balance at 1 January 2017 19,510 19,763 (3,870) 35,403 Profit after income tax expense for the year - - 14,282 14,282 Other comprehensive loss for the year, net of tax - (882) - (882) Total comprehensive income/(loss) for the year - (882) 14,282 13,400 Transactions with owners in their capacity as owners: Transfer between reserves - 14,282 (14,282) - Issue of ordinary shares, net of transaction costs (note 18) 50,059 - - 50,059 Share-based payments - 410 - 410 Dividends paid (note 21) - (5,861) - (5,861) Balance at 31 December 2017 69,569 27,712 (3,870) 93,411
For
per
sona
l use
onl
y

Appen Limited Consolidated statement of cash flows For the year ended 31 December 2017
Group Note 2017 2016 $'000 $'000
The above consolidated statement of cash flows should be read in conjunction with the accompanying notes 26
Cash flows from operating activities Receipts from customers (inclusive of GST) 157,706 106,836 Payments to suppliers and employees (inclusive of GST) (136,772) (90,103) 20,934 16,733 Interest received 10 8 Interest paid (13) (7) Income taxes paid (7,547) (4,055) Net cash from operating activities 33 13,384 12,679 Cash flows from investing activities Payments for acquisition 30 (93,127) (2,525) Cash acquired on acquisition 30 4,915 396 Transaction costs paid for acquisition (3,577) - Payments for property, plant and equipment (3,174) (654) Payments for intangibles (2,628) (1,808) Net cash used in investing activities (97,591) (4,591) Cash flows from financing activities Proceeds from issue of shares, net of transaction costs 18 29,428 433 Proceeds from borrowings 69,241 - Dividends paid 21 (5,861) (4,851) Net cash from/(used in) financing activities 92,808 (4,418) Net increase in cash and cash equivalents 8,601 3,670 Cash and cash equivalents at the beginning of the financial year 16,471 12,725 Effects of exchange rate changes on cash and cash equivalents (1,057) 76 Cash and cash equivalents at the end of the financial year 8 24,015 16,471
For
per
sona
l use
onl
y

Appen Limited Notes to the consolidated financial statements 31 December 2017
27
Note 1. General information The financial statements cover Appen Limited as a Group consisting of Appen Limited and the entities it controlled at the end of, or during, the year. The financial statements are presented in Australian dollars, which is Appen Limited's functional and presentation currency. Appen Limited is a listed public company limited by shares, incorporated and domiciled in Australia. Its registered office and principal place of business is: Level 6 9 Help Street Chatswood NSW 2067 The financial statements were authorised for issue, in accordance with a resolution of directors, on 21 February 2018. Note 2. Significant accounting policies The principal accounting policies adopted in the preparation of the financial statements are set out below. These policies have been consistently applied to all the years presented, unless otherwise stated. New or amended Accounting Standards and Interpretations adopted The Group has adopted all of the new or amended Accounting Standards and Interpretations issued by the Australian Accounting Standards Board ('AASB') that are mandatory for the current reporting period. Any new or amended Accounting Standards or Interpretations that are not yet mandatory have not been early adopted. Basis of preparation Statement of compliance These general purpose financial statements have been prepared in accordance with Australian Accounting Standards and Interpretations issued by the Australian Accounting Standards Board ('AASB') and the Corporations Act 2001, as appropriate for for-profit oriented entities. These financial statements also comply with International Financial Reporting Standards as issued by the International Accounting Standards Board ('IASB'). Historical cost convention The financial statements have been prepared under the historical cost convention, except for, where applicable, derivative financial instruments and share-based payments, which are measured at fair value. Critical accounting estimates The preparation of the financial statements requires the use of certain critical accounting estimates. It also requires management to exercise its judgement in the process of applying the Group's accounting policies. The areas involving a higher degree of judgement or complexity, or areas where assumptions and estimates are significant to the financial statements, are disclosed in note 3. Parent entity information In accordance with the Corporations Act 2001, these financial statements present the results of the Group only. Supplementary information about the parent entity is disclosed in note 29. Principles of consolidation The consolidated financial statements incorporate the assets and liabilities of all subsidiaries of Appen Limited ('Company' or 'parent entity') as at 31 December 2017 and the results of all subsidiaries for the year then ended. Appen Limited and its subsidiaries together are referred to in these financial statements as the 'Group'. Subsidiaries are all those entities over which the Group has control. The Group controls an entity when the Group is exposed to, or has rights to, variable returns from its involvement with the entity and has the ability to affect those returns through its power to direct the activities of the entity. Subsidiaries are fully consolidated from the date on which control is transferred to the Group. They are de-consolidated from the date that control ceases.
For
per
sona
l use
onl
y

Appen Limited Notes to the consolidated financial statements 31 December 2017
Note 2. Significant accounting policies (continued)
28
Intercompany transactions, balances and unrealised gains on transactions between entities in the Group are eliminated. Unrealised losses are also eliminated unless the transaction provides evidence of the impairment of the asset transferred. Accounting policies of subsidiaries have been changed where necessary to ensure consistency with the policies adopted by the Group. The acquisition of subsidiaries is accounted for using the acquisition method of accounting. A change in ownership interest, without the loss of control, is accounted for as an equity transaction, where the difference between the consideration transferred and the book value of the share of the non-controlling interest acquired is recognised directly in equity attributable to the parent. Where the Group loses control over a subsidiary, it derecognises the assets including goodwill, liabilities and non-controlling interest in the subsidiary together with any cumulative translation differences recognised in equity. The Group recognises the fair value of the consideration received and the fair value of any investment retained together with any gain or loss in profit or loss. Operating segments Segment results that are reported to the Group's CEO (the Chief Operating Decision Maker ('CODM')) includes items directly attributable to a segment as well as those that can be allocated on a reasonable basis. Unallocated items comprise mainly corporate assets, head office expenses and income tax assets and liabilities. Foreign currency translation The financial statements are presented in Australian dollars, which is Appen Limited's functional and presentation currency. Foreign currency transactions Foreign currency transactions are translated into Australian dollars using the exchange rates prevailing at the dates of the transactions. Foreign exchange gains and losses resulting from the settlement of such transactions and from the translation at financial year-end exchange rates of monetary assets and liabilities denominated in foreign currencies are recognised in profit or loss. Foreign operations The assets and liabilities of foreign operations are translated into Australian dollars using the exchange rates at the reporting date. The revenues and expenses of foreign operations are translated into Australian dollars using the average exchange rates, which approximate the rates at the dates of the transactions, for the period. All resulting foreign exchange differences are recognised in other comprehensive income through the foreign currency reserve in equity. Revenue recognition Revenue is recognised when it is probable that the economic benefit will flow to the Group and the revenue can be reliably measured. Revenue is measured at the fair value of the consideration received or receivable. Services Revenue from services represents the sale of contract service or licence products and database. Revenue is recognised in profit or loss progressively as the projects are completed and validated or approved by the customers. Stage of completion of transactions involving the rendering of services is determined by reference to the services performed to date as a percentage of total services to be performed. No revenue is recognised if there are either significant uncertainties regarding recovery of the consideration due, the costs incurred or to be incurred cannot be measured reliably, there is a risk of disputes on service quality, or there is continuing management involvement with the products. Interest Interest revenue is recognised as interest accrues using the effective interest method. This is a method of calculating the amortised cost of a financial asset and allocating the interest income over the relevant period using the effective interest rate, which is the rate that exactly discounts estimated future cash receipts through the expected life of the financial asset to the net carrying amount of the financial asset. Other revenue Other revenue is recognised when it is received or when the right to receive payment is established.
For
per
sona
l use
onl
y
Appen Limited Notes to the consolidated financial statements 31 December 2017
Note 2. Significant accounting policies (continued)
29
Income tax The income tax expense or benefit for the period is the tax payable on that period's taxable income based on the applicable income tax rate for each jurisdiction, adjusted by the changes in deferred tax assets and liabilities attributable to temporary differences, unused tax losses and the adjustment recognised for prior periods, where applicable. Deferred tax assets and liabilities are recognised for temporary differences at the tax rates expected to be applied when the assets are recovered or liabilities are settled, based on those tax rates that are enacted or substantively enacted, except for: ● When the deferred income tax asset or liability arises from the initial recognition of goodwill or an asset or liability in a
transaction that is not a business combination and that, at the time of the transaction, affects neither the accounting nor taxable profits; or
● When the taxable temporary difference is associated with interests in subsidiaries, associates or joint ventures, and the timing of the reversal can be controlled and it is probable that the temporary difference will not reverse in the foreseeable future.
Deferred tax assets are recognised for deductible temporary differences and unused tax losses only if it is probable that future taxable amounts will be available to utilise those temporary differences and losses. The carrying amount of recognised and unrecognised deferred tax assets are reviewed at each reporting date. Deferred tax assets recognised are reduced to the extent that it is no longer probable that future taxable profits will be available for the carrying amount to be recovered. Previously unrecognised deferred tax assets are recognised to the extent that it is probable that there are future taxable profits available to recover the asset. Deferred tax assets and liabilities are offset only where there is a legally enforceable right to offset current tax assets against current tax liabilities and deferred tax assets against deferred tax liabilities; and they relate to the same taxable authority on either the same taxable entity or different taxable entities which intend to settle simultaneously. Appen Limited (the 'head entity') and its wholly-owned Australian subsidiaries have formed an income tax consolidated group under the tax consolidation regime. The head entity and each subsidiary in the tax consolidated group continue to account for their own current and deferred tax amounts. The tax consolidated group has applied the 'separate taxpayer within group' approach in determining the appropriate amount of taxes to allocate to members of the tax consolidated group. In addition to its own current and deferred tax amounts, the head entity also recognises the current tax liabilities (or assets) and the deferred tax assets arising from unused tax losses and unused tax credits assumed from each subsidiary in the tax consolidated group. Assets or liabilities arising under tax funding agreements with the tax consolidated entities are recognised as amounts receivable from or payable to other entities in the tax consolidated group. The tax funding arrangement ensures that the intercompany charge equals the current tax liability or benefit of each tax consolidated group member, resulting in neither a contribution by the head entity to the subsidiaries nor a distribution by the subsidiaries to the head entity. Current and non-current classification Assets and liabilities are presented in the statement of financial position based on current and non-current classification. An asset is classified as current when: it is either expected to be realised or intended to be sold or consumed in the Group's normal operating cycle; it is held primarily for the purpose of trading; it is expected to be realised within 12 months after the reporting period; or the asset is cash or cash equivalent unless restricted from being exchanged or used to settle a liability for at least 12 months after the reporting period. All other assets are classified as non-current. A liability is classified as current when: it is either expected to be settled in the Group's normal operating cycle; it is held primarily for the purpose of trading; it is due to be settled within 12 months after the reporting period; or there is no unconditional right to defer the settlement of the liability for at least 12 months after the reporting period. All other liabilities are classified as non-current.
For
per
sona
l use
onl
y
Appen Limited Notes to the consolidated financial statements 31 December 2017
Note 2. Significant accounting policies (continued)
30
Cash and cash equivalents Cash and cash equivalents includes cash on hand, deposits held at call with financial institutions, other short-term, highly liquid investments with original maturities of three months or less that are readily convertible to known amounts of cash and which are subject to an insignificant risk of changes in value. Trade and other receivables Trade receivables are initially recognised at fair value and subsequently measured at amortised cost using the effective interest method, less any provision for impairment. Trade receivables are generally due for settlement within 30 days. Collectability of trade receivables is reviewed on an ongoing basis. Debts which are known to be uncollectable are written off by reducing the carrying amount directly. A provision for impairment of trade receivables is raised when there is objective evidence that the Group will not be able to collect all amounts due according to the original terms of the receivables. Significant financial difficulties of the debtor, probability that the debtor will enter bankruptcy or financial reorganisation and default or delinquency in payments (more than 60 days overdue) are considered indicators that the trade receivable may be impaired. The amount of the impairment allowance is the difference between the asset's carrying amount and the present value of estimated future cash flows, discounted at the original effective interest rate. Cash flows relating to short-term receivables are not discounted if the effect of discounting is immaterial. Work-in-progress includes those projects fully completed or significantly completed by year-end, but invoices have been issued after year-end, due to the milestones for invoicing yet to be reached, or customers' approval procedure being delayed. Other receivables are recognised at amortised cost, less any provision for impairment. Derivative financial instruments Derivatives are initially recognised at fair value on the date a derivative contract is entered into and are subsequently remeasured to their fair value at each reporting date. The accounting for subsequent changes in fair value depends on whether the derivative is designated as a hedging instrument, and if so, the nature of the item being hedged. Derivatives are classified as current or non-current depending on the expected period of realisation. Property, plant and equipment Plant and equipment is stated at historical cost less accumulated depreciation and impairment. Historical cost includes expenditure that is directly attributable to the acquisition of the items. Depreciation is calculated on a straight-line basis to write off the net cost of each item of property, plant and equipment (excluding land) over their expected useful lives as follows: Leasehold improvements Over the lease term Fixtures and fittings 3 - 13 years Computer equipment 1 - 4 years Audio equipment 1 - 4 years Make good Over the lease term The residual values, useful lives and depreciation methods are reviewed, and adjusted if appropriate, at each reporting date. Leasehold improvements and plant and equipment under lease are depreciated over the unexpired period of the lease or the estimated useful life of the assets, whichever is shorter. An item of property, plant and equipment is derecognised upon disposal or when there is no future economic benefit to the Group. Gains and losses between the carrying amount and the disposal proceeds are taken to profit or loss. Any revaluation surplus reserve relating to the item disposed of is transferred directly to retained profits. Leases The determination of whether an arrangement is or contains a lease is based on the substance of the arrangement and requires an assessment of whether the fulfilment of the arrangement is dependent on the use of a specific asset or assets and the arrangement conveys a right to use the asset.
For
per
sona
l use
onl
y

Appen Limited Notes to the consolidated financial statements 31 December 2017
Note 2. Significant accounting policies (continued)
31
A distinction is made between finance leases, which effectively transfer from the lessor to the lessee substantially all the risks and benefits incidental to the ownership of leased assets, and operating leases, under which the lessor effectively retains substantially all such risks and benefits. Finance leases are capitalised. A lease asset and liability are established at the fair value of the leased assets, or if lower, the present value of minimum lease payments. Lease payments are allocated between the principal component of the lease liability and the finance costs, so as to achieve a constant rate of interest on the remaining balance of the liability. Leased assets acquired under a finance lease are depreciated over the asset's useful life or over the shorter of the asset's useful life and the lease term if there is no reasonable certainty that the Group will obtain ownership at the end of the lease term. Operating lease payments, net of any incentives received from the lessor, are charged to profit or loss on a straight-line basis over the term of the lease. Intangible assets Intangible assets acquired as part of a business combination, other than goodwill, are initially measured at their fair value at the date of the acquisition. Intangible assets acquired separately are initially recognised at cost. Indefinite life intangible assets are not amortised and are subsequently measured at cost less any impairment. Finite life intangible assets are subsequently measured at cost less amortisation and any impairment. The gains or losses recognised in profit or loss arising from the derecognition of intangible assets are measured as the difference between net disposal proceeds and the carrying amount of the intangible asset. The method of amortisation and useful lives of finite life intangible assets are reviewed annually. Changes in the expected pattern of consumption or useful life are accounted for prospectively by changing the amortisation method or period. Goodwill Goodwill arises on the acquisition of a business. Goodwill is not amortised. Instead, goodwill is tested annually for impairment, or more frequently if events or changes in circumstances indicate that it might be impaired, and is carried at cost less accumulated impairment losses. Impairment losses on goodwill are taken to profit or loss and are not subsequently reversed. Patents Significant costs associated with patents and trademarks are deferred and amortised on a straight-line basis over the period of their expected benefit, being their finite life of 20 years. Internal software Significant costs associated with software are deferred and amortised on a straight-line basis over the period of their expected benefit, being their finite life of between 1 and 7 years. Licence and database Licence and database products are capitalised at the direct costs incurred. The capitalised costs of licence and database products include direct costs of internal staff, services purchased from overseas' field partners, and supporting software acquired from a third party supplier. Licence and database are amortised on a straight-line basis over the period of their expected benefit, being their finite life of 3 years. Contracts Contracts acquired in a business combination are amortised on a straight-line basis over the period of their expected benefit, being their finite life of 5 years. Platform technology development Platform technology development costs are capitalised at the direct costs incurred and amortised on a straight line basis over the period of their expected benefit being their finite life of 3 years. Amortisation starts at the time that the technology is activated and is used by both internal and external customers. The capitalised costs of platform technology include the direct costs of internal staff and any supporting software acquired from a third party.
For
per
sona
l use
onl
y
Appen Limited Notes to the consolidated financial statements 31 December 2017
Note 2. Significant accounting policies (continued)
32
Impairment of non-financial assets Goodwill and other intangible assets that have an indefinite useful life are not subject to amortisation and are tested annually for impairment, or more frequently if events or changes in circumstances indicate that they might be impaired. Other non-financial assets are reviewed for impairment whenever events or changes in circumstances indicate that the carrying amount may not be recoverable. An impairment loss is recognised for the amount by which the asset's carrying amount exceeds its recoverable amount. Recoverable amount is the higher of an asset's fair value less costs of disposal and value-in-use. The value-in-use is the present value of the estimated future cash flows relating to the asset using a pre-tax discount rate specific to the asset or cash-generating unit to which the asset belongs. Assets that do not have independent cash flows are grouped together to form a cash-generating unit. Trade and other payables These amounts represent liabilities for goods and services provided to the Group prior to the end of the financial year and which are unpaid. Due to their short-term nature they are measured at amortised cost and are not discounted. The amounts are unsecured and are usually paid within 30 days of recognition. Borrowings Loans and borrowings are initially recognised at the fair value of the consideration received, net of transaction costs. They are subsequently measured at amortised cost using the effective interest method. Where there is an unconditional right to defer settlement of the liability for at least 12 months after the reporting date, the loans or borrowings are classified as non-current. Finance costs Finance costs attributable to qualifying assets are capitalised as part of the asset. All other finance costs are expensed in the period in which they are incurred. Provisions Provisions are recognised when the Group has a present (legal or constructive) obligation as a result of a past event, it is probable the Group will be required to settle the obligation, and a reliable estimate can be made of the amount of the obligation. The amount recognised as a provision is the best estimate of the consideration required to settle the present obligation at the reporting date, taking into account the risks and uncertainties surrounding the obligation. If the time value of money is material, provisions are discounted using a current pre-tax rate specific to the liability. The increase in the provision resulting from the passage of time is recognised as a finance cost. Employee benefits Short-term employee benefits Liabilities for wages and salaries, including non-monetary benefits, annual leave and long service leave expected to be settled wholly within 12 months of the reporting date are measured at the amounts expected to be paid when the liabilities are settled. Other long-term employee benefits The liability for annual leave and long service leave not expected to be settled within 12 months of the reporting date are measured at the present value of expected future payments to be made in respect of services provided by employees up to the reporting date using the projected unit credit method. Consideration is given to expected future wage and salary levels, experience of employee departures and periods of service. Expected future payments are discounted using market yields at the reporting date on high quality corporate bonds with terms to maturity and currency that match, as closely as possible, the estimated future cash outflows. Share-based payments Equity-settled share-based compensation benefits are provided to employees. Equity-settled transactions are awards of shares, or options over shares, that are provided to employees in exchange for services.
For
per
sona
l use
onl
y
Appen Limited Notes to the consolidated financial statements 31 December 2017
Note 2. Significant accounting policies (continued)
33
The cost of equity-settled transactions is measured at fair value on grant date. Fair value is independently determined using the Binomial option pricing model that takes into account the exercise price, the term of the option, the impact of dilution, the share price at grant date and expected price volatility of the underlying share, the expected dividend yield and the risk free interest rate for the term of the option, together with non-vesting conditions that do not determine whether the Group receives the services that entitle the employees to receive payment. No account is taken of any other vesting conditions. The cost of equity-settled transactions is recognised as an expense with a corresponding increase in equity over the vesting period. The cumulative charge to profit or loss is calculated based on the grant date fair value of the award, the best estimate of the number of awards that are likely to vest and the expired portion of the vesting period. The amount recognised in profit or loss for the period is the cumulative amount calculated at each reporting date less amounts already recognised in previous periods. All changes in the liability are recognised in profit or loss. The ultimate cost of cash-settled transactions is the cash paid to settle the liability. Market conditions are taken into consideration in determining fair value. Therefore, any awards subject to market conditions are considered to vest irrespective of whether or not that market condition has been met, provided all other conditions are satisfied. If equity-settled awards are modified, as a minimum an expense is recognised as if the modification has not been made. An additional expense is recognised, over the remaining vesting period, for any modification that increases the total fair value of the share-based compensation benefit as at the date of modification. If the non-vesting condition is within the control of the Group or employee, the failure to satisfy the condition is treated as a cancellation. If the condition is not within the control of the Group or employee and is not satisfied during the vesting period, any remaining expense for the award is recognised over the remaining vesting period, unless the award is forfeited. If equity-settled awards are cancelled, it is treated as if it has vested on the date of cancellation, and any remaining expense is recognised immediately. If a new replacement award is substituted for the cancelled award, the cancelled and new award is treated as if they were a modification. Fair value measurement When an asset or liability, financial or non-financial, is measured at fair value for recognition or disclosure purposes, the fair value is based on the price that would be received to sell an asset or paid to transfer a liability in an orderly transaction between market participants at the measurement date; and assumes that the transaction will take place either: in the principal market; or in the absence of a principal market, in the most advantageous market. Fair value is measured using the assumptions that market participants would use when pricing the asset or liability, assuming they act in their economic best interests. For non-financial assets, the fair value measurement is based on its highest and best use. Valuation techniques that are appropriate in the circumstances and for which sufficient data are available to measure fair value, are used, maximising the use of relevant observable inputs and minimising the use of unobservable inputs. Assets and liabilities measured at fair value are classified, into three levels, using a fair value hierarchy that reflects the significance of the inputs used in making the measurements. Classifications are reviewed at each reporting date and transfers between levels are determined based on a reassessment of the lowest level of input that is significant to the fair value measurement. For recurring and non-recurring fair value measurements, external valuers may be used when internal expertise is either not available or when the valuation is deemed to be significant. External valuers are selected based on market knowledge and reputation. Where there is a significant change in fair value of an asset or liability from one period to another, an analysis is undertaken, which includes a verification of the major inputs applied in the latest valuation and a comparison, where applicable, with external sources of data. Issued capital Ordinary shares are classified as equity.
For
per
sona
l use
onl
y

Appen Limited Notes to the consolidated financial statements 31 December 2017
Note 2. Significant accounting policies (continued)
34
Incremental costs directly attributable to the issue of new shares or options are shown in equity as a deduction, net of tax, from the proceeds. Dividends Dividends are recognised when declared during the financial year and no longer at the discretion of the Company. Business combinations The acquisition method of accounting is used to account for business combinations regardless of whether equity instruments or other assets are acquired. The consideration transferred is the sum of the acquisition-date fair values of the assets transferred, equity instruments issued or liabilities incurred by the acquirer to former owners of the acquiree and the amount of any non-controlling interest in the acquiree. All acquisition costs are expensed as incurred to profit or loss. On the acquisition of a business, the Group assesses the financial assets acquired and liabilities assumed for appropriate classification and designation in accordance with the contractual terms, economic conditions, the Group's operating or accounting policies and other pertinent conditions in existence at the acquisition-date. Contingent consideration to be transferred by the acquirer is recognised at the acquisition-date fair value. Subsequent changes in the fair value of the contingent consideration classified as an asset or liability is recognised in profit or loss. Contingent consideration classified as equity is not remeasured and its subsequent settlement is accounted for within equity. The difference between the acquisition-date fair value of assets acquired, liabilities assumed and any non-controlling interest in the acquiree and the fair value of the consideration transferred and the fair value of any pre-existing investment in the acquiree is recognised as goodwill. Business combinations are initially accounted for on a provisional basis. The acquirer retrospectively adjusts the provisional amounts recognised and also recognises additional assets or liabilities during the measurement period, based on new information obtained about the facts and circumstances that existed at the acquisition-date. The measurement period ends on either the earlier of (i) 12 months from the date of the acquisition or (ii) when the acquirer receives all the information possible to determine fair value. Earnings per share Basic earnings per share Basic earnings per share is calculated by dividing the profit attributable to the owners of Appen Limited, excluding any costs of servicing equity other than ordinary shares, by the weighted average number of ordinary shares outstanding during the financial year, adjusted for bonus elements in ordinary shares issued during the financial year. Diluted earnings per share Diluted earnings per share adjusts the figures used in the determination of basic earnings per share to take into account the after income tax effect of interest and other financing costs associated with dilutive potential ordinary shares and the weighted average number of shares assumed to have been issued for no consideration in relation to dilutive potential ordinary shares. Goods and Services Tax ('GST') and other similar taxes Revenues, expenses and assets are recognised net of the amount of associated GST, unless the GST incurred is not recoverable from the tax authority. In this case it is recognised as part of the cost of the acquisition of the asset or as part of the expense. Receivables and payables are stated inclusive of the amount of GST receivable or payable. The net amount of GST recoverable from, or payable to, the tax authority is included in other receivables or other payables in the statement of financial position. Cash flows are presented on a gross basis. The GST components of cash flows arising from investing or financing activities which are recoverable from, or payable to the tax authority, are presented as operating cash flows.
For
per
sona
l use
onl
y

Appen Limited Notes to the consolidated financial statements 31 December 2017
Note 2. Significant accounting policies (continued)
35
Commitments and contingencies are disclosed net of the amount of GST recoverable from, or payable to, the tax authority. Rounding of amounts The Company is of a kind referred to in ASIC Corporations (Rounding in Financial/Directors Reports) Instrument 2016/191, issued by the Australian Securities and Investments Commission, relating to 'rounding-off'. Amounts in this report have been rounded off in accordance with that Corporations Instrument to the nearest thousand dollars, or in certain cases, the nearest dollar. New Accounting Standards and Interpretations not yet mandatory or early adopted Australian Accounting Standards and Interpretations that have recently been issued or amended but are not yet mandatory, have not been early adopted by the Group for the annual reporting period ended 31 December 2017. The Group's assessment of the impact of these new or amended Accounting Standards and Interpretations, most relevant to the Group, are set out below. AASB 9 Financial Instruments This standard is applicable to annual reporting periods beginning on or after 1 January 2018. The standard replaces all previous versions of AASB 9 and completes the project to replace IAS 39 'Financial Instruments: Recognition and Measurement'. AASB 9 introduces new classification and measurement models for financial assets. A financial asset shall be measured at amortised cost, if it is held within a business model whose objective is to hold assets in order to collect contractual cash flows, which arise on specified dates and solely comprise principal and interest. All other financial instrument assets are to be classified and measured at fair value through profit or loss unless the entity makes an irrevocable election on initial recognition to present gains and losses on equity instruments (that are not held-for-trading) in other comprehensive income ('OCI'). For financial liabilities, the standard requires the portion of the change in fair value that relates to the entity's own credit risk to be presented in OCI (unless it would create an accounting mismatch). New simpler hedge accounting requirements are intended to more closely align the accounting treatment with the risk management activities of the entity. New impairment requirements will use an 'expected credit loss' ('ECL') model to recognise an allowance. Impairment will be measured under a 12-month ECL method unless the credit risk on a financial instrument has increased significantly since initial recognition in which case the lifetime ECL method is adopted. The standard introduces additional new disclosures. The Group will adopt this standard from 1 January 2018. Management has commenced a project to understand the impact of the new accounting standard. Based on the work performed to date, the management team does not expect the new accounting standard to have a material impact. AASB 15 Revenue from Contracts with Customers This standard is applicable to annual reporting periods beginning on or after 1 January 2018. The standard provides a single standard for revenue recognition. The core principle of the standard is that an entity will recognise revenue to depict the transfer of promised goods or services to customers in an amount that reflects the consideration to which the entity expects to be entitled in exchange for those goods or services. The standard will require: contracts (either written, verbal or implied) to be identified, together with the separate performance obligations within the contract; determine the transaction price, adjusted for the time value of money excluding credit risk; allocation of the transaction price to the separate performance obligations on a basis of relative stand-alone selling price of each distinct good or service, or estimation approach if no distinct observable prices exist; and recognition of revenue when each performance obligation is satisfied. Credit risk will be presented separately as an expense rather than adjusted to revenue. For goods, the performance obligation would be satisfied when the customer obtains control of the goods. For services, the performance obligation is satisfied when the service has been provided, typically for promises to transfer services to customers. For performance obligations satisfied over time, an entity would select an appropriate measure of progress to determine how much revenue should be recognised as the performance obligation is satisfied. Contracts with customers will be presented in an entity's statement of financial position as a contract liability, a contract asset, or a receivable, depending on the relationship between the entity's performance and the customer's payment. Sufficient quantitative and qualitative disclosure is required to enable users to understand the contracts with customers; the significant judgements made in applying the guidance to those contracts; and any assets recognised from the costs to obtain or fulfil a contract with a customer. The Group will adopt this standard from 1 January 2018. Management has commenced a project to understand the impact of the new accounting standard. Based on the work performed to date, the management team does not expect the new accounting standard to have a material impact.
For
per
sona
l use
onl
y

Appen Limited Notes to the consolidated financial statements 31 December 2017
Note 2. Significant accounting policies (continued)
36
AASB 16 Leases This standard is applicable to annual reporting periods beginning on or after 1 January 2019. For lessee accounting, the standard eliminates the ‘operating lease’ and ‘finance lease’ classification required by AASB 117 ‘Leases’. Subject to exceptions, a ‘right-of-use’ asset will be capitalised in the statement of financial position, measured as the present value of the unavoidable future lease payments to be made over the lease term. The exceptions relate to short-term leases of 12 months or less and leases of low-value assets (such as personal computers and office furniture) where an accounting policy choice exists whereby either a ‘right-of-use’ asset is recognised or lease payments are expensed to profit or loss as incurred. A liability corresponding to the capitalised lease will also be recognised, adjusted for lease prepayments, lease incentives received, initial direct costs incurred and an estimate of any future restoration, removal or dismantling costs. Straight-line operating lease expense recognition will be replaced with a depreciation charge for the leased asset (included in operating costs) and an interest expense on the recognised lease liability (included in finance costs). For classification within the statement of cash flows, the lease payments will be separated into both a principal (financing activities) and interest (either operating or financing activities) components. For lessor accounting, the standard does not substantially change how a lessor accounts for leases. The Group will adopt this standard from 1 January 2019. Management has commenced a project to understand the impact of the new accounting standard. Based on the work performed to date, the management team does not expect the new accounting standard to have a material impact. Note 3. Critical accounting judgements, estimates and assumptions The preparation of the financial statements requires management to make judgements, estimates and assumptions that affect the reported amounts in the financial statements. Management continually evaluates its judgements and estimates in relation to assets, liabilities, contingent liabilities, revenue and expenses. Management bases its judgements, estimates and assumptions on historical experience and on other various factors, including expectations of future events, management believes to be reasonable under the circumstances. The resulting accounting judgements and estimates will seldom equal the related actual results. The judgements, estimates and assumptions that have a significant risk of causing a material adjustment to the carrying amounts of assets and liabilities (refer to the respective notes) within the next financial year are discussed below. Share-based payment transactions The Group measures the cost of equity-settled transactions with employees by reference to the fair value of the equity instruments at the date at which they are granted. The fair value of options is determined by using the Binomial model taking into account the terms and conditions upon which the instruments were granted. Performance rights are valued on a discounted dividend stream method. The accounting estimates and assumptions relating to equity-settled share-based payments would have no impact on the carrying amounts of assets and liabilities within the next annual reporting period but may impact profit or loss and equity. Fair value measurement hierarchy The Group is required to classify all assets and liabilities, measured at fair value, using a three level hierarchy, based on the lowest level of input that is significant to the entire fair value measurement, being: Level 1: Quoted prices (unadjusted) in active markets for identical assets or liabilities that the entity can access at the measurement date; Level 2: Inputs other than quoted prices included within Level 1 that are observable for the asset or liability, either directly or indirectly; and Level 3: Unobservable inputs for the asset or liability. Considerable judgement is required to determine what is significant to fair value and therefore which category the asset or liability is placed in can be subjective. The fair value of assets and liabilities classified as level 3 is determined by the use of valuation models. These include discounted cash flow analysis or the use of observable inputs that require significant adjustments based on unobservable inputs. Goodwill and other indefinite life intangible assets The Group tests annually, or more frequently if events or changes in circumstances indicate impairment, whether goodwill and other indefinite life intangible assets have suffered any impairment, in accordance with the accounting policy stated in note 2. The recoverable amounts of cash-generating units have been determined based on value-in-use calculations. These calculations require the use of assumptions, including estimated discount rates based on the current cost of capital and growth rates of the estimated future cash flows.
For
per
sona
l use
onl
y

Appen Limited Notes to the consolidated financial statements 31 December 2017
Note 3. Critical accounting judgements, estimates and assumptions (continued)
37
Estimation of useful lives of assets The Group determines the estimated useful lives and related depreciation and amortisation charges for its property, plant and equipment and finite life intangible assets. The useful lives could change significantly as a result of technical innovations or some other event. The depreciation and amortisation charge will increase where the useful lives are less than previously estimated lives, or technically obsolete or non-strategic assets that have been abandoned or sold will be written off or written down. Impairment of non-financial assets other than goodwill and other indefinite life intangible assets The Group assesses impairment of non-financial assets other than goodwill and other indefinite life intangible assets at each reporting date by evaluating conditions specific to the Group and to the particular asset that may lead to impairment. If an impairment trigger exists, the recoverable amount of the asset is determined. This involves fair value less costs of disposal or value-in-use calculations, which incorporate a number of key estimates and assumptions. Income tax The Group is subject to income taxes in the jurisdictions in which it operates. Significant judgement is required in determining the provision for income tax. There are many transactions and calculations undertaken during the ordinary course of business for which the ultimate tax determination is uncertain. The Group recognises liabilities for anticipated tax audit issues based on the Group's current understanding of the tax law. Where the final tax outcome of these matters is different from the carrying amounts, such differences will impact the current and deferred tax provisions in the period in which such determination is made. Note 4. Operating segments Identification of reportable operating segments The Group is organised into two operating segments based on differences in products and services provided: Content Relevance and Language Resources. These operating segments are based on the internal reports that are reviewed and used by the Group's Chief Executive Officer ('CEO'), who is identified as the Chief Operating Decision Maker, in assessing performance and in determining the allocation of resources. There is no aggregation of operating segments. The CEO reviews a set of financial reports which covers EBITDA (earnings before interest, tax, depreciation and amortisation), revenue and operating segment reports on a monthly basis. The accounting policies adopted for internal reporting to the CEO are consistent with those adopted in the financial statements. Types of products and services The principal products and services of each of these operating segments are as follows: Content Relevance Content Relevance provides annotated data used in search technology (embedded in web,
e-commerce and social engagement) for improving relevance and accuracy of search results.
Language Resources Language Resources provides data used in speech recognisers, machine translation, speech synthesisers and other machine-learning technologies resulting in more engaging and fluent devices including internet-connected devices, in-car automotive systems and speech-enabled consumer electronics.
Intersegment transactions Intersegment transactions were made at market rates. Intersegment transactions are eliminated on consolidation. Intersegment receivables, payables and loans Intersegment loans are initially recognised at the consideration received. Intersegment loans receivable and loans payable that earn or incur non-market interest are not adjusted to fair value based on market interest rates. Intersegment loans are eliminated on consolidation. Major customers During the year ended 31 December 2017 approximately 86% (2016: 83%) of the Group's external revenue was derived from sales to five major customers.
For
per
sona
l use
onl
y

Appen Limited Notes to the consolidated financial statements 31 December 2017
Note 4. Operating segments (continued)
38
Operating segment information Content Language Other Relevance Resources segments Total Group - 2017 $'000 $'000 $'000 $'000 Revenue Services revenue 126,160 40,397 - 166,557 Interest - - 10 10 Other income - - 4 4 Total revenue 126,160 40,397 14 166,571 Segment result 22,147 12,176 (256) 34,067 Corporate overhead (6,886)Foreign exchange 937 Transaction costs (5,877)Depreciation and amortisation * (1,863)Interest (3)Profit before income tax expense 20,375 Income tax expense (6,093)Profit after income tax expense 14,282 * Amortisation expense includes AUD$572,719 for the disposal of ERP system purchased in March 2014, since there is
no probable future economic benefits. Content Language Other Relevance Resources segments Total Group - 2016 $'000 $'000 $'000 $'000 Revenue Services revenue 73,216 37,727 - 110,943 Interest - - 8 8 Other income - - 52 52 Total revenue 73,216 37,727 60 111,003 Segment result 10,528 14,846 (1,621) 23,753 Corporate overhead (6,139)Foreign exchange (300)Transaction costs (131)Depreciation and amortisation (1,153)Interest 1 Profit before income tax expense 16,031 Income tax expense (5,542)Profit after income tax expense 10,489 Geographical information
Services revenue Geographical non-current
assets 2017 2016 2017 2016 $'000 $'000 $'000 $'000 Australia 40,393 34,233 1,106 666 US 126,164 76,710 114,035 12,169 Others - - 4,740 2,445 166,557 110,943 119,881 15,280
For
per
sona
l use
onl
y

Appen Limited Notes to the consolidated financial statements 31 December 2017
39
Note 5. Revenue Group 2017 2016 $'000 $'000 Sales revenue Services revenue 166,557 110,943 Other revenue Interest 10 8 Rent 4 52 14 60 Revenue 166,571 111,003
Note 6. Expenses Group 2017 2016 $'000 $'000 Profit before income tax includes the following specific expenses: Depreciation Leasehold improvements 120 104 Fixtures and fittings 43 9 Computer equipment 207 220 Audio equipment 17 20 Make good 5 16 Total depreciation 392 369 Amortisation Patents and formation costs 2 3 Internal software and platform development 472 536 Licence, database and project development * 930 136 Contracts 67 109 Total amortisation 1,471 784 Total depreciation and amortisation 1,863 1,153 Impairment Receivables - 63 Finance costs Interest and finance charges paid/payable 13 7 Employee benefits expense Defined contribution superannuation expense 1,194 1,028 Share-based payments expense 410 365 Employee benefits expense 27,923 20,686 Total employee benefits expense 29,527 22,079 * Amortisation expense includes $572,719 for the disposal of ERP system purchased in March 2014, since there is no
probable future economic benefits.
For
per
sona
l use
onl
y

Appen Limited Notes to the consolidated financial statements 31 December 2017
40
Note 7. Income tax expense Group 2017 2016 $'000 $'000 Income tax expense Current tax 7,502 4,260 Deferred tax - origination and reversal of temporary differences (1,409) 1,282 Aggregate income tax expense 6,093 5,542
Deferred tax included in income tax expense comprises: Increase/(decrease) in deferred tax liabilities (note 16) (1,409) 1,282 Numerical reconciliation of income tax expense and tax at the statutory rate Profit before income tax expense 20,375 16,031 Tax at the statutory tax rate of 30% 6,113 4,809 Tax effect amounts which are not deductible/(taxable) in calculating taxable income:
Non-deductible expenses 113 149 6,226 4,958 Difference in overseas tax rates (133) 584 Income tax expense 6,093 5,542
Note 8. Current assets - cash and cash equivalents Group 2017 2016 $'000 $'000 Cash on hand 3 4 Cash at bank 24,012 16,341 Cash on deposit - 126 24,015 16,471
Note 9. Current assets - trade and other receivables Group 2017 2016 $'000 $'000 Trade receivables 30,923 14,360 Less: Provision for impairment of receivables (75) (81) 30,848 14,279 Other receivables 5,228 229 Work in progress 6,540 7,184 GST receivable 292 169 42,908 21,861
The GST receivable in 2017 includes the net of GST/VAT receivable and payable amounts. Refer to note 12 for the change.
For
per
sona
l use
onl
y

Appen Limited Notes to the consolidated financial statements 31 December 2017
Note 9. Current assets - trade and other receivables (continued)
41
Impairment of receivables The Group has recognised a loss of $nil (2016: $63,000) in profit or loss in respect of impairment of receivables for the year ended 31 December 2017. The ageing of the impaired receivables provided for above are as follows: Group 2017 2016 $'000 $'000 0 to 3 months overdue - 81 Over 6 months overdue 75 - 75 81
Movements in the provision for impairment of receivables are as follows: Group 2017 2016 $'000 $'000 Opening balance 81 34 Additional provisions recognised - 63 Foreign currency revaluation on opening balance (6) - Receivables written off during the year as uncollectable - (16) Closing balance 75 81
Past due but not impaired Customers with balances past due but without provision for impairment of receivables amount to $3,793,000 as at 31 December 2017 ($2,149,000 as at 31 December 2016). The Group did not consider a credit risk on the aggregate balances after reviewing credit terms of customers based on recent collection. The ageing of the past due but not impaired receivables are as follows: Group 2017 2016 $'000 $'000 0 to 3 months overdue 3,701 2,137 3 to 6 months overdue 60 12 Over 6 months overdue 32 - 3,793 2,149
Note 10. Current assets - derivative financial instruments Group 2017 2016 $'000 $'000 Forward foreign exchange contracts - cash flow hedges 123 -
Refer to note 23 for further information on fair value measurement.
For
per
sona
l use
onl
y
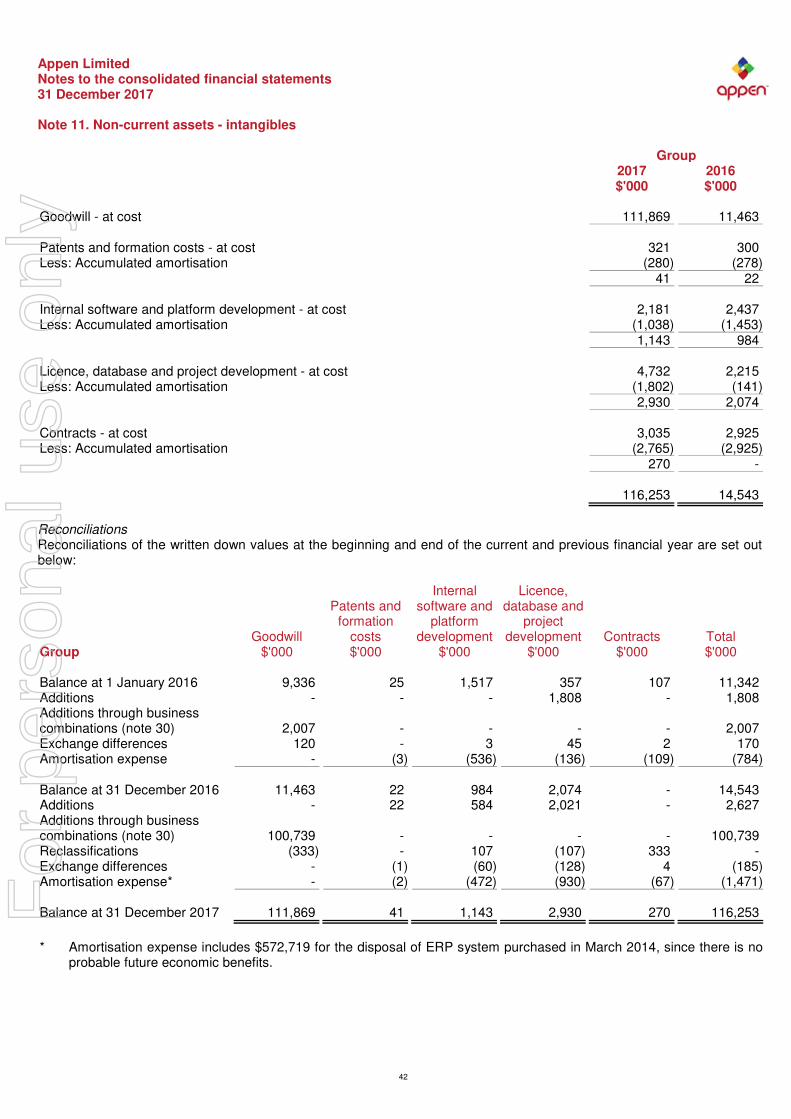
Appen Limited Notes to the consolidated financial statements 31 December 2017
42
Note 11. Non-current assets - intangibles Group 2017 2016 $'000 $'000 Goodwill - at cost 111,869 11,463 Patents and formation costs - at cost 321 300 Less: Accumulated amortisation (280) (278) 41 22 Internal software and platform development - at cost 2,181 2,437 Less: Accumulated amortisation (1,038) (1,453) 1,143 984 Licence, database and project development - at cost 4,732 2,215 Less: Accumulated amortisation (1,802) (141) 2,930 2,074 Contracts - at cost 3,035 2,925 Less: Accumulated amortisation (2,765) (2,925) 270 - 116,253 14,543
Reconciliations Reconciliations of the written down values at the beginning and end of the current and previous financial year are set out below:
Patents and
formation
Internal software and
platform
Licence, database and
project
Goodwill costs development development Contracts Total Group $'000 $'000 $'000 $'000 $'000 $'000 Balance at 1 January 2016 9,336 25 1,517 357 107 11,342 Additions - - - 1,808 - 1,808 Additions through business combinations (note 30)
2,007
-
-
-
-
2,007
Exchange differences 120 - 3 45 2 170 Amortisation expense - (3) (536) (136) (109) (784) Balance at 31 December 2016 11,463 22 984 2,074 - 14,543 Additions - 22 584 2,021 - 2,627 Additions through business combinations (note 30)
100,739
-
-
-
-
100,739
Reclassifications (333) - 107 (107) 333 - Exchange differences - (1) (60) (128) 4 (185) Amortisation expense* - (2) (472) (930) (67) (1,471) Balance at 31 December 2017 111,869 41 1,143 2,930 270 116,253
* Amortisation expense includes $572,719 for the disposal of ERP system purchased in March 2014, since there is no
probable future economic benefits.
For
per
sona
l use
onl
y

Appen Limited Notes to the consolidated financial statements 31 December 2017
Note 11. Non-current assets - intangibles (continued)
43
Impairment of intangible assets Goodwill relates to the acquisition of Butler Hill, Inc., Leapforce, Inc. and Raterlabs, Inc. in the United States, and Mendip Media Group Limited 'MMG') in the United Kingdom. The recoverable amount of this business, at balance date, was estimated based on its value in use. Butler Hill, Inc. Value in use for the cash-generating unit ('CGU') was determined by discounting the future cashflows to be generated from the Content Relevance division and is based on the following key assumptions: - Cashflows were projected based on forecast operating results over a 5 year period. - Average annual revenue growth rates of 8% for 2018 to 2022 were used for revenue projections. This growth was referenced against the average annual historical growth rates over the past 4 years and the long-term growth rate of the industry. All future years of the model use a constant rate of 3%; and - A pre-tax discount of 22% based on the weighted average cost of capital. Leapforce, Inc. and Raterlabs, Inc. Leapforce and Raterlabs were acquired on 7 December 2017. As provisional accounting is being applied, the value in use calculation will be performed once all values have been finalised. Mendip Media Group Limited Value in use for the CGU was determined by discounting the future cash flows to be generated from the Language Resources division and is based on the following key assumptions: - Cashflows were projected based on forecast operating results over a 5 year period. - Average annual revenue growth rates of 6% for 2018 to 2022 were used for revenue projections. This growth was referenced against average annual historical growth rates over the past 4 years and the long-term growth rate of the industry. All future years of the model use a constant rate of 3%; and - A pre-tax discount of 22% based on the weighted average cost of capital. Note 12. Current liabilities - trade and other payables Group 2017 2016 $'000 $'000 Trade payables 9,240 5,842 VAT payable - 131 Other payables and accrued expenses 11,933 6,204 21,173 12,177
Refer to note 22 for further information on financial instruments. The GST/VAT payable has been included in GST receivable to disclose the net of GST/VAT receivable and payable amounts effected in 2017. Refer to note 9 for the change. F
or p
erso
nal u
se o
nly
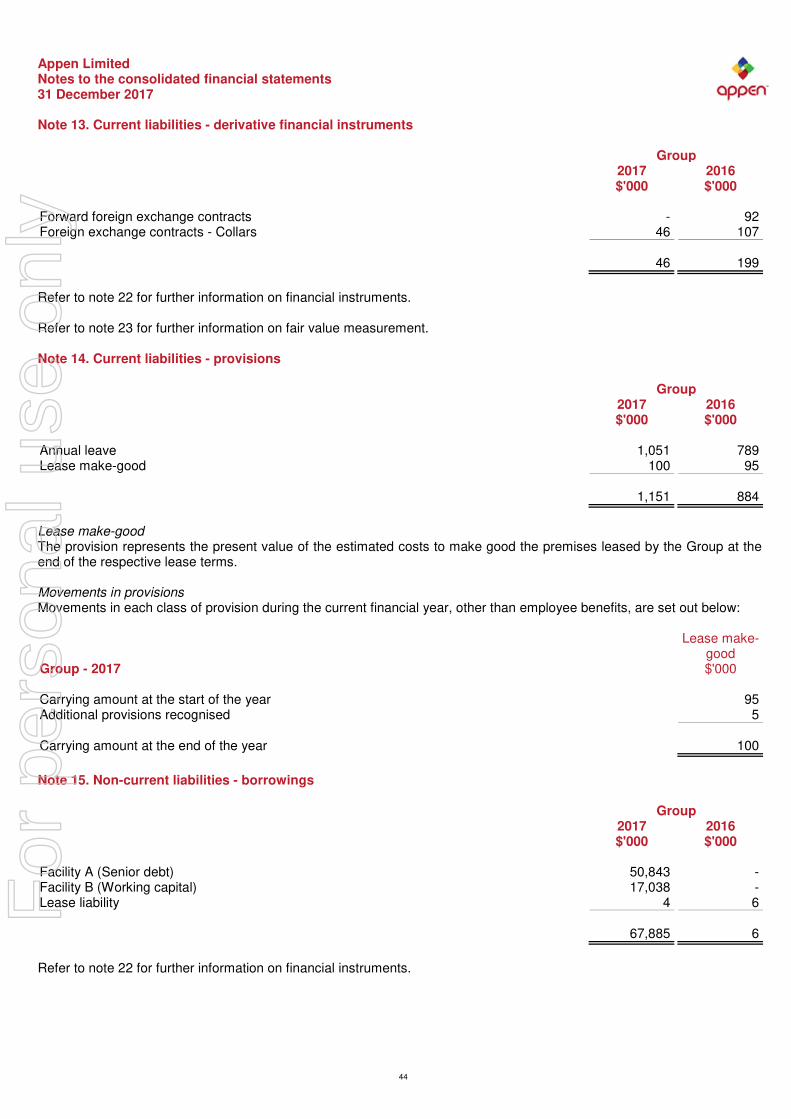
Appen Limited Notes to the consolidated financial statements 31 December 2017
44
Note 13. Current liabilities - derivative financial instruments Group 2017 2016 $'000 $'000 Forward foreign exchange contracts - 92 Foreign exchange contracts - Collars 46 107 46 199
Refer to note 22 for further information on financial instruments. Refer to note 23 for further information on fair value measurement. Note 14. Current liabilities - provisions Group 2017 2016 $'000 $'000 Annual leave 1,051 789 Lease make-good 100 95 1,151 884
Lease make-good The provision represents the present value of the estimated costs to make good the premises leased by the Group at the end of the respective lease terms. Movements in provisions Movements in each class of provision during the current financial year, other than employee benefits, are set out below: Lease make- good Group - 2017 $'000 Carrying amount at the start of the year 95 Additional provisions recognised 5 Carrying amount at the end of the year 100
Note 15. Non-current liabilities - borrowings Group 2017 2016 $'000 $'000 Facility A (Senior debt) 50,843 - Facility B (Working capital) 17,038 - Lease liability 4 6 67,885 6
Refer to note 22 for further information on financial instruments.
For
per
sona
l use
onl
y

Appen Limited Notes to the consolidated financial statements 31 December 2017
Note 15. Non-current liabilities - borrowings (continued)
45
Facility A The facility was established in December 2017 with a limit of US$40 million. This facility has a three year term with a bullet repayment at the end of the term and is not subject to annual review. Mandatory prepayment of 7.5% of the outstanding principal balance of the facility is required if certain metrics are triggered, measured at each six monthly reporting period ending on or after 30 June 2018. The facility was used to fund the Leapforce acquisition and is fully drawn. This facility attracts interest at a margin over bank reference rates, based on the net leverage ratio. The value disclosed above is net of borrowing costs of $394,000. Facility B The facility was established in December 2017 with a limit of A$20 million. This facility has a three year term and is not subject to annual review. Technically, each drawing under this facility is required to be rolled over at the end of its interest period and available for automatic re-draw if no default is existing. This facility is repayable at the end of the term. The facility is used to fund working capital in connection with the Leapforce acquisition and general working capital requirements. This facility attracts interest at a margin over bank reference rates, based on the net leverage ratio. Total secured liabilities The total secured liabilities (current and non-current) are as follows: Group 2017 2016 $'000 $'000 Facility A (Senior debt) 50,843 - Facility B (Working capital) 17,038 - Lease liability 4 6 67,885 6
Assets pledged as security The bank loans are secured by a fixed charge over the assets of the Group. The lease liabilities are effectively secured as the rights to the leased assets, recognised in the statement of financial position, revert to the lessor in the event of default. Financing arrangements Unrestricted access was available at the reporting date to the following lines of credit: Group 2017 2016 $'000 $'000 Total facilities
Facility A (Senior debt) 51,237 - Facility B (Working capital) 20,000 -
71,237 - Used at the reporting date
Facility A (Senior debt) 51,237 - Facility B (Working capital) 17,038 -
68,275 - Unused at the reporting date
Facility A (Senior debt) - - Facility B (Working capital) 2,962 -
2,962 - * Balance excludes borrowing cost of $394,000.
For
per
sona
l use
onl
y

Appen Limited Notes to the consolidated financial statements 31 December 2017
46
Note 16. Non-current liabilities - deferred tax Group 2017 2016 $'000 $'000 Deferred tax liability comprises temporary differences attributable to: Amounts recognised in profit or loss:
Platform development costs 298 403 Impairment of receivables (20) (30) Property, plant and equipment 62 (60) Intangible assets 929 1,537 Employee benefits (893) (963) Accrued expenses (955) (260) Work-in-progress 1,962 2,155 Foreign currency revaluation and other expense (14) (4)
Deferred tax liability 1,369 2,778
Movements: Opening balance 2,778 1,496 Charged/(credited) to profit or loss (note 7) (1,409) 1,282 Closing balance 1,369 2,778
The Corporate Federal tax rate for company registered in United States will change to 21% effective from 1 January 2018. The deferred tax reported has been computed with the new Federal tax rate. Note 17. Non-current liabilities - provisions Group 2017 2016 $'000 $'000 Long service leave 473 417
Note 18. Equity - issued capital Group 2017 2016 2017 2016 Shares Shares $'000 $'000 Ordinary shares - fully paid 105,804,907 97,180,407 69,569 19,510
For
per
sona
l use
onl
y

Appen Limited Notes to the consolidated financial statements 31 December 2017
Note 18. Equity - issued capital (continued)
47
Movements in ordinary share capital Details Date Shares Issue price $'000 Balance 1 January 2016 96,280,001 19,077 Issue of shares on exercise of options 1 March 2016 51,125 $0.412 21 Issue of shares on exercise of options 1 March 2016 112,475 $0.432 49 Issue of shares on exercise of options 1 March 2016 112,475 $0.489 55 Issue of shares on exercise of options 1 March 2016 51,125 $0.494 26 Issue of shares on exercise of options 1 March 2016 358,593 $0.500 179 Issue of shares on exercise of options 16 March 2016 26,563 $0.500 13 Issue of shares on exercise of options 8 June 2016 106,250 $0.500 53 Issue of shares on exercise of options 10 November 2016 40,900 $0.412 17 Issue of shares on exercise of options 10 November 2016 40,900 $0.494 20 Balance 31 December 2016 97,180,407 19,510 Issue of shares on exercise of options 1 March 2017 318,750 $0.500 159 Issue of shares on exercise of options 1 March 2017 20,450 $0.489 10 Issue of shares on exercise of options 1 March 2017 20,450 $0.432 9 Issue of shares on exercise of options 3 March 2017 53,125 $0.500 27 Issue of shares on exercise of options 9 March 2017 106,250 $0.500 53 Issue of shares on exercise of performance rights 10 April 2017 9,398 - Issue of shares on exercise of options 16 June 2017 53,125 $0.500 27 Issue of shares on exercise of options 8 November 2017 40,900 $0.412 17 Issue of shares on exercise of options 22 November 2017 40,900 $0.412 17 Issue of shares as consideration of acquisition of Leapforce, Inc and RaterLabs, Inc.
6 December 2017
4,310,345
$5.800
25,000
Issue of shares as consideration of acquisition of Leapforce, Inc and RaterLabs, Inc.
7 December 2017
2,787,826
$7.400
20,630
Shares issued under Share Purchase plan 21 December 2017 862,981 $5.800 5,005 Share issue transaction costs (895) Balance 31 December 2017 105,804,907 69,569
Ordinary shares Ordinary shares entitle the holder to participate in dividends and the proceeds on the winding up of the Company in proportion to the number of and amounts paid on the shares held. The fully paid ordinary shares have no par value and the Company does not have a limited amount of authorised capital. On a show of hands every member present at a meeting in person or by proxy shall have one vote and upon a poll each share shall have one vote. Share buy-back There is no current on-market share buy-back. Capital risk management The Group's objectives when managing capital is to safeguard its ability to continue as a going concern, so that it can provide returns for shareholders and benefits for other stakeholders and to maintain an optimum capital structure to reduce the cost of capital. Capital is regarded as total equity, as recognised in the statement of financial position, plus net debt. Net debt is calculated as total borrowings less cash and cash equivalents. In order to maintain or adjust the capital structure, the Group may adjust the amount of dividends paid to shareholders, return capital to shareholders, issue new shares or sell assets to reduce debt.
For
per
sona
l use
onl
y

Appen Limited Notes to the consolidated financial statements 31 December 2017
Note 18. Equity - issued capital (continued)
48
The Group would raise capital when an opportunity to invest in a business or company was seen as value adding relative to the current Company's share price at the time of the investment. The capital risk management policy remains unchanged from the 31 December 2016 Annual Report. Note 19. Equity - reserves Group 2017 2016 $'000 $'000 Common control reserve (1,416) (1,416) Foreign currency translation reserve 2,790 3,672 Share-based payments reserve 1,979 1,569 Profits reserve 22,500 14,079 Other reserves 1,859 1,859 27,712 19,763
Common control reserve The reserve represents the difference between the consideration transferred by the Company for the acquisition of commonly controlled entities and the existing book value of those entities immediately prior to the acquisition. Foreign currency translation reserve The reserve is used to recognise exchange differences arising from translation of the financial statements of foreign operations to Australian dollars. Share-based payments reserve The reserve is used to recognise the value of equity benefits provided to employees and directors as part of their remuneration, and other parties as part of their compensation for services. Profits reserve The Profits reserve represents current year profits transferred to a reserve to preserve the characteristic as a profit and not appropriate against prior year accumulated losses. Such profits are available to enable payment of franked dividends in the future should the directors declare so by resolution. Other reserves This reserve represents the equity settled portion of contingent consideration together with any capital raising expenses that are allocated to equity, in connection with the acquisition of Butler Hill, Inc.
For
per
sona
l use
onl
y
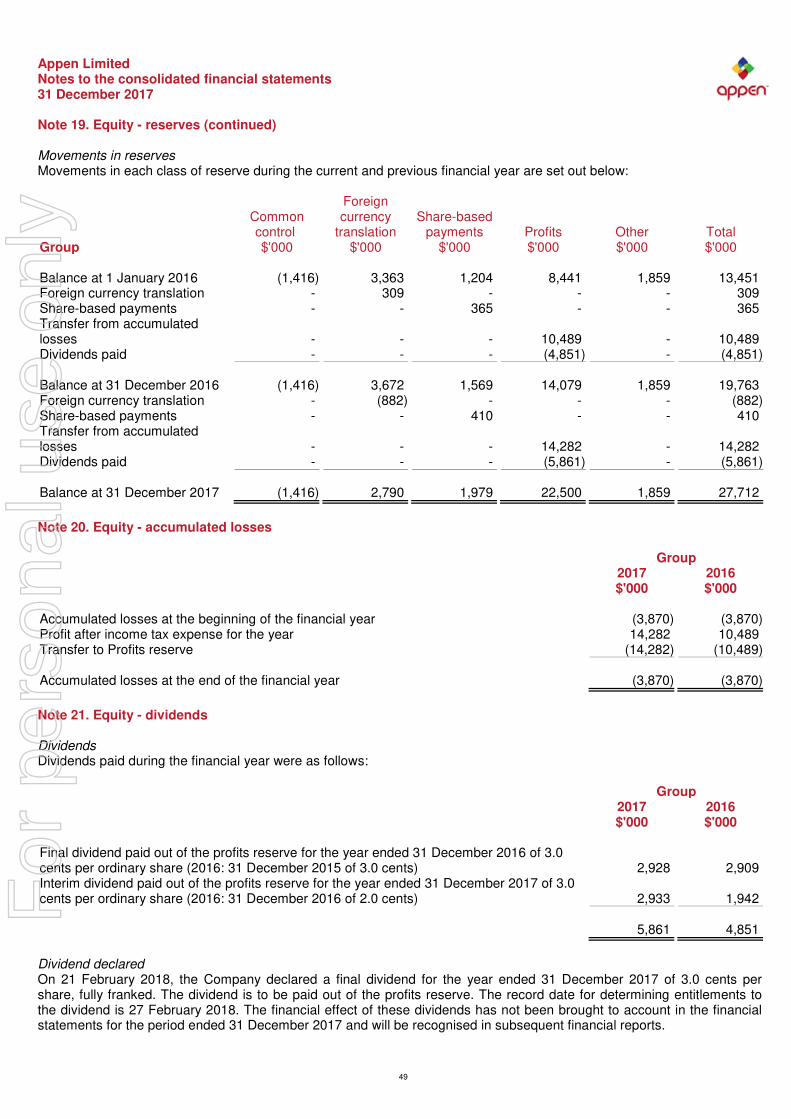
Appen Limited Notes to the consolidated financial statements 31 December 2017
Note 19. Equity - reserves (continued)
49
Movements in reserves Movements in each class of reserve during the current and previous financial year are set out below:
Common Foreign
currency
Share-based
control translation payments Profits Other Total Group $'000 $'000 $'000 $'000 $'000 $'000 Balance at 1 January 2016 (1,416) 3,363 1,204 8,441 1,859 13,451 Foreign currency translation - 309 - - - 309 Share-based payments - - 365 - - 365 Transfer from accumulated losses
-
-
-
10,489
-
10,489
Dividends paid - - - (4,851) - (4,851) Balance at 31 December 2016 (1,416) 3,672 1,569 14,079 1,859 19,763 Foreign currency translation - (882) - - - (882) Share-based payments - - 410 - - 410 Transfer from accumulated losses
-
-
-
14,282
-
14,282
Dividends paid - - - (5,861) - (5,861) Balance at 31 December 2017 (1,416) 2,790 1,979 22,500 1,859 27,712
Note 20. Equity - accumulated losses Group 2017 2016 $'000 $'000 Accumulated losses at the beginning of the financial year (3,870) (3,870) Profit after income tax expense for the year 14,282 10,489 Transfer to Profits reserve (14,282) (10,489) Accumulated losses at the end of the financial year (3,870) (3,870)
Note 21. Equity - dividends Dividends Dividends paid during the financial year were as follows: Group 2017 2016 $'000 $'000 Final dividend paid out of the profits reserve for the year ended 31 December 2016 of 3.0 cents per ordinary share (2016: 31 December 2015 of 3.0 cents)
2,928
2,909
Interim dividend paid out of the profits reserve for the year ended 31 December 2017 of 3.0 cents per ordinary share (2016: 31 December 2016 of 2.0 cents)
2,933
1,942
5,861 4,851
Dividend declared On 21 February 2018, the Company declared a final dividend for the year ended 31 December 2017 of 3.0 cents per share, fully franked. The dividend is to be paid out of the profits reserve. The record date for determining entitlements to the dividend is 27 February 2018. The financial effect of these dividends has not been brought to account in the financial statements for the period ended 31 December 2017 and will be recognised in subsequent financial reports.
For
per
sona
l use
onl
y

Appen Limited Notes to the consolidated financial statements 31 December 2017
Note 21. Equity - dividends (continued)
50
Franking credits Group 2017 2016 $'000 $'000 Franking credits available for subsequent financial years based on a tax rate of 30% 3,446 2,461
The above amounts represent the balance of the franking account as at the end of the financial year, adjusted for: ● franking credits that will arise from the payment of the amount of the provision for income tax at the reporting date ● franking debits that will arise from the payment of dividends recognised as a liability at the reporting date ● franking credits that will arise from the receipt of dividends recognised as receivables at the reporting date Note 22. Financial instruments Financial risk management objectives The Group's activities expose it to a variety of financial risks: market risk (including foreign currency risk, price risk and interest rate risk), credit risk and liquidity risk. The Group's overall risk management program focuses on the unpredictability of financial markets and seeks to minimise potential adverse effects on the financial performance of the Group. The Group uses derivative financial instruments such as forward foreign exchange contracts to hedge certain foreign currency risk exposures. Derivatives are exclusively used for hedging purposes, i.e. not as trading or other speculative instruments. The Group uses different methods to measure different types of risk to which it is exposed. These methods include sensitivity analysis in the case of interest rate, foreign exchange and other price risks, ageing analysis for credit risk and beta analysis in respect of investment portfolios to determine market risk. Risk management is carried out by senior finance executives ('finance') under policies approved by the Board of Directors ('the Board'). These policies include identification and analysis of the risk exposure of the Group and appropriate procedures, controls and risk limits. Finance identifies, evaluates and hedges financial risks within the Group's operating units. Finance reports to the Board on a monthly basis. Market risk Foreign currency risk The Group undertakes certain transactions denominated in foreign currency and is exposed to foreign currency risk through foreign exchange rate fluctuations. Foreign exchange risk arises from future commercial transactions and recognised financial assets and financial liabilities denominated in a currency that is not the entity's functional currency. The risk is measured using sensitivity analysis and cash flow forecasting. In order to protect against exchange rate movements, the Group has entered into forward foreign exchange contracts. These contracts are hedging highly probable forecast cash flows for the ensuing financial year. Appen’s policy is to hedge at least 80% of its US denominated revenues generated by its Language Resources division for the subsequent 12 months. The maturity, settlement amounts and the average contractual exchange rates of the Group's outstanding forward foreign exchange contracts and foreign exchange - collars at the reporting date were as follows: Sell Australian dollars Average exchange rates 2017 2016 2017 2016 $'000 $'000 Sell United States dollars Foreign exchange forward contract maturity: 0 - 3 months 7,180 1,580 0.7591 0.7592 3 - 6 months 3,247 395 0.7700 0.7450
For
per
sona
l use
onl
y

Appen Limited Notes to the consolidated financial statements 31 December 2017
Note 22. Financial instruments (continued)
51
Buy Australian dollars Average exchange rates 2017 2016 2017 2016 $'000 $'000 Sell United States dollars Foreign exchange option contract maturity: 0 - 3 months 1,300 4,683 0.7690 0.7474 3 - 6 months 3,247 2,043 0.7687 0.7342 The average exchange rates and reporting date exchange rates applied were as follows:
Average exchange rates Reporting date exchange
rates 2017 2016 2017 2016 Australian dollars United States Dollars 0.7692 0.7422 0.7809 0.7202 European Economic and Monetary Union Euro 0.5930 0.6729 0.5787 0.6844 United Kingdom Pound Sterling 0.6773 0.5536 0.6517 0.5840 Hong Kong Dollars 5.9946 5.7603 6.0994 5.5846 Philippine Pesos 39.8340 35.3549 39.0305 35.7238 The carrying amount of the Group's foreign currency denominated financial assets and financial liabilities at the reporting date were as follows: Assets Liabilities 2017 2016 2017 2016 Group $'000 $'000 $'000 $'000 United States Dollars 47,283 27,411 58,431 5,754 European Economic and Monetary Union Euro 1,313 427 - - United Kingdom Pound Sterling 351 700 81 156 Hong Kong Dollars 1 1 - - Philippine Pesos 913 1,330 177 3 49,861 29,869 58,689 5,913
The Group had net liabilities denominated in foreign currencies of $8,828,000 (assets $49,861,000 less liabilities $58,689,000) as at 31 December 2017 (2016: net assets of $23,956,000 (assets $29,869,000 less liabilities $5,913,000)). Based on this exposure, had the Australian dollar weakened by 5% or strengthened by 5% (2016: weakened by 5% or strengthened by 5%) against these foreign currencies with all other variables held constant, the Group's profit before tax for the year based on the assets dominated in foreign currency, excluding the translation difference for consolidated reporting purpose, and the Group's equity would have been lower or higher by the following: AUD strengthened AUD weakened
Group - 2017
% change
Effect on profit before
tax
Effect on
equity
% change
Effect on profit before
tax
Effect on
equity United States Dollars 5% 2,343 (1,929) 5% (2,343) 1,929 European Economic and Monetary Union Euro
5%
(66)
-
5%
66
-
United Kingdom Pound Sterling 5% (10) (11) 5% 10 11 Hong Kong Dollars 5% (3) (8) 5% 3 8 Philippine Pesos 5% - (37) 5% - 37 2,264 (1,985) (2,264) 1,985
For
per
sona
l use
onl
y

Appen Limited Notes to the consolidated financial statements 31 December 2017
Note 22. Financial instruments (continued)
52
AUD strengthened AUD weakened
Group - 2016
% change
Effect on profit before
tax
Effect on
equity
% change
Effect on profit before
tax
Effect on
equity United States Dollars 5% (43) (1,040) 5% 43 1,040 European Economic and Monetary Union Euro
5%
(21)
-
5%
21
-
United Kingdom Pound Sterling 5% - (27) 5% - 27 Hong Kong Dollars 5% - - 5% - - Philippine Pesos 5% - (66) 5% - 66 (64) (1,133) 64 1,133
The percentage change is the expected overall volatility of the significant currencies, which is based on management's assessment of reasonable possible fluctuations taking into consideration movements over the last 12 months each year and the spot rate at each reporting date. (2016: numbers have been restated due to change in methodology) Price risk The Group is not exposed to any significant price risk. Interest rate risk The Group's main interest rate risk arises from long-term borrowings. Borrowings issued at variable rates expose the Group to interest rate risk. As at the reporting date, the Group had the following variable rate borrowings: 2017 2016
Weighted average
interest rate
Balance
Weighted average
interest rate
Balance Group % $'000 % $'000 Facility A 3.67% 51,237 - - Facility B 3.71% 17,038 - - Net exposure to cash flow interest rate risk 68,275 -
An analysis by remaining contractual maturities in shown in 'liquidity and interest rate risk management' below. For the Group the net exposure to interest rate risk totalled $68,275 (2016: $nil). Cash flow sensitivity analysis for variable-rate instruments A reasonable possible change of 100 base points in interest rates at the reporting date would have increased or decreased equity and profit or loss by the amounts below. This analysis assumes that all other variables, in particular foreign currency exchange rates, remain constant Basis points increase Basis points decrease
Group - 2017
Basis points
change
Effect on profit before
tax
Effect on
equity
Basis points
change
Effect on profit before
tax
Effect on
equity Facility A 100 (512) (512) 100 512 512 Facility B 100 (170) (170) 100 170 170 (682) (682) 682 682
The Group is not exposed to any significant interest rate risk at 31 December 2016.
For
per
sona
l use
onl
y

Appen Limited Notes to the consolidated financial statements 31 December 2017
Note 22. Financial instruments (continued)
53
Credit risk Credit risk refers to the risk that a counterparty will default on its contractual obligations resulting in financial loss to the Group. The Group has a strict code of credit, including obtaining agency credit information, confirming references and setting appropriate credit limits. The Group obtains guarantees where appropriate to mitigate credit risk. The maximum exposure to credit risk at the reporting date to recognised financial assets is the carrying amount, net of any provisions for impairment of those assets, as disclosed in the statement of financial position and notes to the financial statements. The Group does not hold any collateral. Liquidity risk Liquidity risk requires the Group to maintain sufficient liquid assets (mainly cash and cash equivalents) and available borrowing facilities to be able to pay debts as and when they become due and payable. The Group manages liquidity risk by maintaining adequate cash reserves and available borrowing facilities by continuously monitoring actual and forecast cash flows and matching the maturity profiles of financial assets and liabilities. Financing arrangements Unused borrowing facilities at the reporting date: Group 2017 2016 $'000 $'000 Facility B (Working capital) 2,962 - Remaining contractual maturities The following tables detail the Group's remaining contractual maturity for its financial instrument liabilities. The tables have been drawn up based on the undiscounted cash flows of financial liabilities based on the earliest date on which the financial liabilities are required to be paid. The tables include both interest and principal cash flows disclosed as remaining contractual maturities and therefore these totals may differ from their carrying amount in the statement of financial position.
Weighted average
interest rate
1 year or less
Between 1 and 2 years
Between 2 and 5 years
Over 5 years
Remaining contractual maturities
Group - 2017 % $'000 $'000 $'000 $'000 $'000 Non-derivatives Non-interest bearing Trade payables - 9,240 - - - 9,240 Other payables - 681 - - - 681 Interest-bearing - variable Facility A - Senior debt - 999 999 52,237 - 54,235 Facility B - Working capital - 332 332 17,370 - 18,034 Lease liability - - 4 - - 4 Total non-derivatives 11,252 1,335 69,607 - 82,194 Derivatives Foreign exchange contracts - Collars
-
46
-
-
-
46
Total derivatives 46 - - - 46 F
or p
erso
nal u
se o
nly

Appen Limited Notes to the consolidated financial statements 31 December 2017
Note 22. Financial instruments (continued)
54
Weighted average
interest rate
1 year or less
Between 1 and 2 years
Between 2 and 5 years
Over 5 years
Remaining contractual maturities
Group - 2016 % $'000 $'000 $'000 $'000 $'000 Non-derivatives Non-interest bearing Trade payables - 5,842 - - - 5,842 Other payables - 545 - - - 545 Interest-bearing - variable Lease liability - - 6 - - 6 Total non-derivatives 6,387 6 - - 6,393 Derivatives Forward foreign exchange contracts net settled
-
92
-
-
-
92
Foreign exchange contracts - Collars
-
107
-
-
-
107
Total derivatives 199 - - - 199 The cash flows in the maturity analysis above are not expected to occur significantly earlier than contractually disclosed above. Note 23. Fair value measurement Fair value hierarchy The following tables detail the Group's assets and liabilities, measured or disclosed at fair value, using a three level hierarchy, based on the lowest level of input that is significant to the entire fair value measurement, being: Level 1: Quoted prices (unadjusted) in active markets for identical assets or liabilities that the entity can access at the measurement date Level 2: Inputs other than quoted prices included within Level 1 that are observable for the asset or liability, either directly or indirectly Level 3: Unobservable inputs for the asset or liability Level 1 Level 2 Level 3 Total Group - 2017 $'000 $'000 $'000 $'000 Assets Forward foreign exchange contracts - 123 - 123 Total assets - 123 - 123 Liabilities Foreign exchange contracts - Collars - 46 - 46 Total liabilities - 46 - 46 Level 1 Level 2 Level 3 Total Group - 2016 $'000 $'000 $'000 $'000 Liabilities Forward foreign exchange contracts - 92 - 92 Foreign exchange contracts - Collars - 107 - 107 Total liabilities - 199 - 199 There were no transfers between levels during the financial year. The carrying amounts of trade and other receivables and trade and other payables are assumed to approximate their fair values due to their short-term nature.
For
per
sona
l use
onl
y

Appen Limited Notes to the consolidated financial statements 31 December 2017
Note 23. Fair value measurement (continued)
55
Valuation techniques for fair value measurements categorised within level 2 Derivative financial instruments have been valued using quoted market rates. This valuation technique maximises the use of observable market data where it is available and relies as little as possible on entity specific estimates. Note 24. Key management personnel disclosures Compensation The aggregate compensation made to directors and other members of key management personnel of the Group is set out below: Group 2017 2016 $ $ Short-term employee benefits 2,518,996 2,589,402 Post-employment benefits 176,873 205,924 Long-term benefits 160,312 95,470 Share-based payments 188,852 326,046 3,045,033 3,216,842
Note 25. Remuneration of auditors During the financial year the following fees were paid or payable for services provided by KPMG, the auditor of the Company, and its network firms: Group 2017 2016 $ $ Audit services - KPMG Audit or review of the financial statements 212,534 150,000 Other services - KPMG Taxation and compliance services - Australia 72,514 256,375 Other services 153,750 7,500 226,264 263,875 438,798 413,875
Audit services - network firms Audit or review of the financial statements 33,197 14,548 Other services - network firms Taxation and compliance services - USA 85,793 69,480 Other services 42,561 - 128,354 69,480 161,551 84,028
For
per
sona
l use
onl
y
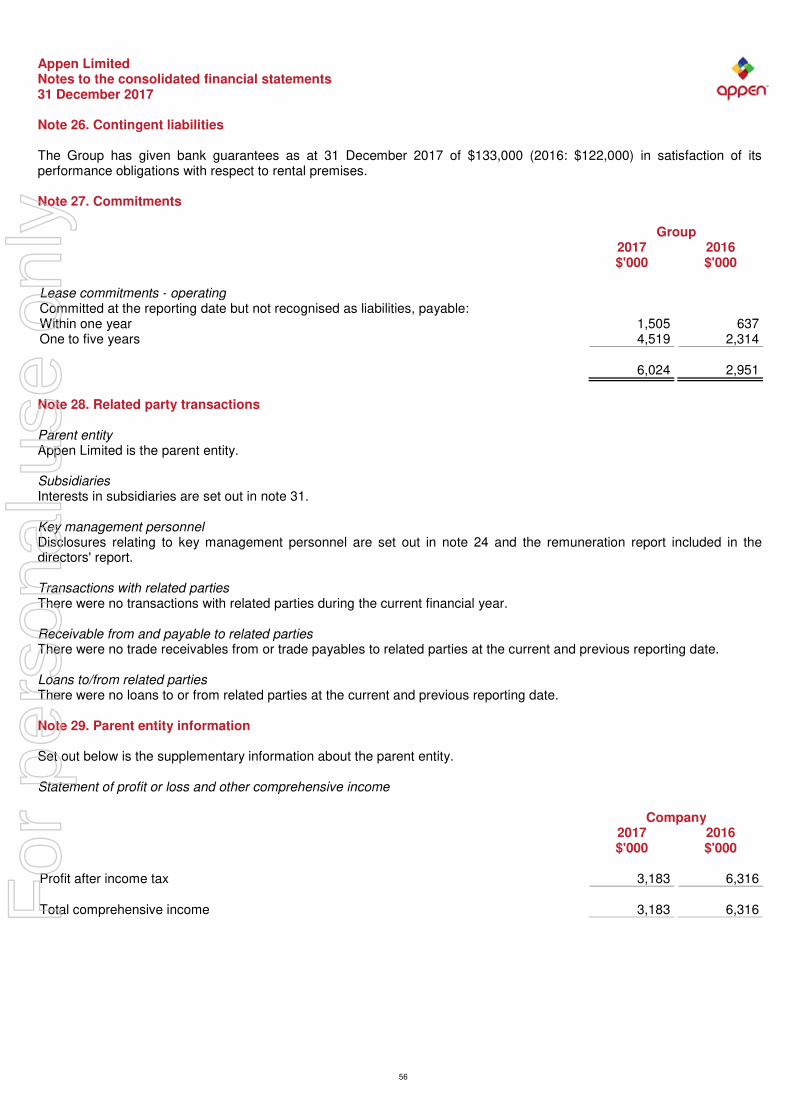
Appen Limited Notes to the consolidated financial statements 31 December 2017
56
Note 26. Contingent liabilities The Group has given bank guarantees as at 31 December 2017 of $133,000 (2016: $122,000) in satisfaction of its performance obligations with respect to rental premises. Note 27. Commitments Group 2017 2016 $'000 $'000 Lease commitments - operating Committed at the reporting date but not recognised as liabilities, payable: Within one year 1,505 637 One to five years 4,519 2,314 6,024 2,951
Note 28. Related party transactions Parent entity Appen Limited is the parent entity. Subsidiaries Interests in subsidiaries are set out in note 31. Key management personnel Disclosures relating to key management personnel are set out in note 24 and the remuneration report included in the directors' report. Transactions with related parties There were no transactions with related parties during the current financial year. Receivable from and payable to related parties There were no trade receivables from or trade payables to related parties at the current and previous reporting date. Loans to/from related parties There were no loans to or from related parties at the current and previous reporting date. Note 29. Parent entity information Set out below is the supplementary information about the parent entity. Statement of profit or loss and other comprehensive income Company 2017 2016 $'000 $'000 Profit after income tax 3,183 6,316 Total comprehensive income 3,183 6,316 F
or p
erso
nal u
se o
nly

Appen Limited Notes to the consolidated financial statements 31 December 2017
Note 29. Parent entity information (continued)
57
Statement of financial position Company 2017 2016 $'000 $'000 Total current assets 68,705 41 Total assets 80,712 28,878 Total current liabilities 3,991 - Total liabilities 4,337 - Equity
Issued capital 69,569 19,510 Share-based payments reserve 1,980 1,569 Profits reserve 8,572 11,545 Other reserves 1,859 1,859 Accumulated losses (5,605) (5,605)
Total equity 76,375 28,878
Guarantees entered into by the parent entity in relation to the debts of its subsidiaries The parent entity had a deed of cross guarantee in relation to the debts of its subsidiaries as at 31 December 2017 and 31 December 2016. Contingent liabilities The parent entity had no contingent liabilities as at 31 December 2017 and 31 December 2016. Capital commitments - Property, plant and equipment The parent entity had no capital commitments for property, plant and equipment at as 31 December 2017 and 31 December 2016. Significant accounting policies The accounting policies of the parent entity are consistent with those of the Group, as disclosed in note 2, except for the following: ● Investments in subsidiaries are accounted for at cost, less any impairment, in the parent entity. ● Dividends received from subsidiaries are recognised as other income by the parent entity and its receipt may be an
indicator of an impairment of the investment.
For
per
sona
l use
onl
y

Appen Limited Notes to the consolidated financial statements 31 December 2017
58
Note 30. Business combinations 2016 On 30 September 2016, Appen (Europe) Limited acquired 100% of the ordinary shares of Mendip Media Group Limited (MMG) for the total consideration transferred of $2,525,000. MMG is a leading provider of secure transcription services in the UK. This was a strategic acquisition to secure the services of MMG, a critical subcontractor to Appen for specialised government work and to provide a highly secure capability and platform to enable Appen to grow its position in secure transcription in the UK and Europe. The goodwill of $2,007,000 represents the difference in the fair value of assets acquired to consideration paid. The acquired business contributed revenues of $510,000 and loss after tax of $1,000 to the Group for the period from 30 September 2016 to 31 December 2016. If the acquisition occurred on 1 January 2016, the full year contributions would have been revenues of $2,267,000 and loss after tax of $10,000. The values identified in relation to the acquisition of Mendip Media Group Limited are final as at 31 December 2017. Details of the acquisition are as follows: Fair value $'000 Cash and cash equivalents 396 Trade receivables 182 Other receivables 50 Fixtures and fittings 20 Computer equipment 30 Trade payables (23)Other payables (96)Provision for income tax (32)Deferred tax liability (3)Provisions (6) Net assets acquired 518 Goodwill 2,007 Acquisition-date fair value of the total consideration transferred 2,525
Representing: Cash paid or payable to vendor 2,525
Acquisition costs expensed to profit or loss 131
Cash used to acquire business, net of cash acquired: Acquisition-date fair value of the total consideration transferred 2,525 Less: cash and cash equivalents (396) Net cash used 2,129
For
per
sona
l use
onl
y
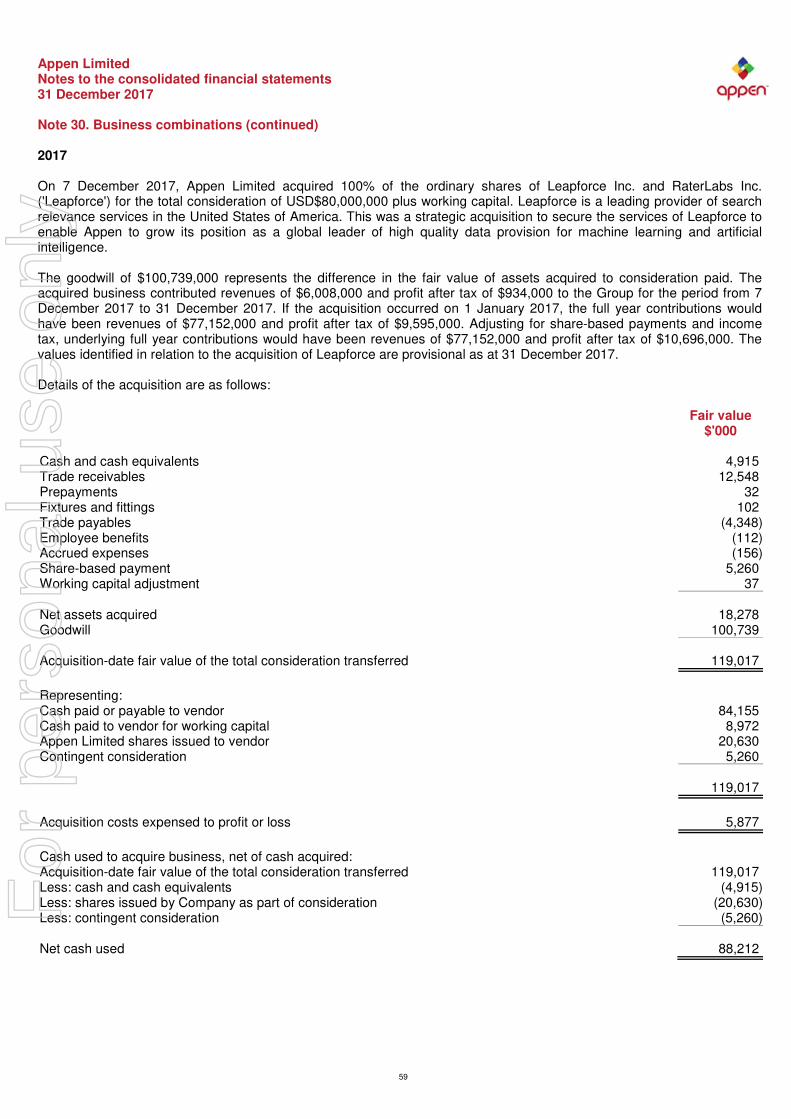
Appen Limited Notes to the consolidated financial statements 31 December 2017
Note 30. Business combinations (continued)
59
2017 On 7 December 2017, Appen Limited acquired 100% of the ordinary shares of Leapforce Inc. and RaterLabs Inc. ('Leapforce') for the total consideration of USD$80,000,000 plus working capital. Leapforce is a leading provider of search relevance services in the United States of America. This was a strategic acquisition to secure the services of Leapforce to enable Appen to grow its position as a global leader of high quality data provision for machine learning and artificial intelligence. The goodwill of $100,739,000 represents the difference in the fair value of assets acquired to consideration paid. The acquired business contributed revenues of $6,008,000 and profit after tax of $934,000 to the Group for the period from 7 December 2017 to 31 December 2017. If the acquisition occurred on 1 January 2017, the full year contributions would have been revenues of $77,152,000 and profit after tax of $9,595,000. Adjusting for share-based payments and income tax, underlying full year contributions would have been revenues of $77,152,000 and profit after tax of $10,696,000. The values identified in relation to the acquisition of Leapforce are provisional as at 31 December 2017. Details of the acquisition are as follows: Fair value $'000 Cash and cash equivalents 4,915 Trade receivables 12,548 Prepayments 32 Fixtures and fittings 102 Trade payables (4,348)Employee benefits (112)Accrued expenses (156)Share-based payment 5,260 Working capital adjustment 37 Net assets acquired 18,278 Goodwill 100,739 Acquisition-date fair value of the total consideration transferred 119,017
Representing: Cash paid or payable to vendor 84,155 Cash paid to vendor for working capital 8,972 Appen Limited shares issued to vendor 20,630 Contingent consideration 5,260 119,017
Acquisition costs expensed to profit or loss 5,877
Cash used to acquire business, net of cash acquired: Acquisition-date fair value of the total consideration transferred 119,017 Less: cash and cash equivalents (4,915)Less: shares issued by Company as part of consideration (20,630)Less: contingent consideration (5,260) Net cash used 88,212
For
per
sona
l use
onl
y

Appen Limited Notes to the consolidated financial statements 31 December 2017
60
Note 31. Interests in subsidiaries The consolidated financial statements incorporate the assets, liabilities and results of the following subsidiaries in accordance with the accounting policy described in note 2: Ownership interest Principal place of business / 2017 2016 Name Country of incorporation % % Appen Butler Hill Pty Limited Australia 100.00% 100.00% Appen Butler Hill Inc. * United States of America 100.00% 100.00% Appen (Europe) Limited * United Kingdom 100.00% 100.00% Mendip Media Group Limited United Kingdom 100.00% 100.00% Appen (Hong Kong) Limited * Hong Kong 100.00% 100.00% Beijing Appen Technology Co., Ltd * China 100.00% - Leapforce Inc. United States of America 100.00% - RaterLabs Inc. United States of America 100.00% - Appen Financial Services Pty Ltd Australia 100.00% - * Wholly-owned subsidiaries of Appen Butler Hill Pty Limited Note 32. Deed of cross guarantee The following entities are party to a deed of cross guarantee under which each company guarantees the debts of the others: Appen Limited Appen Butler Hill Pty Limited Appen Financial Services Pty Ltd By entering into the deed, the wholly-owned entities have been relieved from the requirement to prepare financial statements and directors' report under Corporations Instrument 2016/785 issued by the Australian Securities and Investments Commission. The above companies represent a 'Closed Group' for the purposes of the Corporations Instrument, and as there are no other parties to the deed of cross guarantee that are controlled by Appen Limited, they also represent the 'Extended Closed Group'.
For
per
sona
l use
onl
y

Appen Limited Notes to the consolidated financial statements 31 December 2017
Note 32. Deed of cross guarantee (continued)
61
Set out below is a consolidated statement of profit or loss and other comprehensive income and statement of financial position of the 'Closed Group'. 2017 2016 Statement of profit or loss and other comprehensive income $'000 $'000 Revenue 42,082 33,916 Services purchased - data collection (7,844) (8,325) Employee benefits expense (14,141) (10,794) Depreciation and amortisation expense (339) (285) Travel expense (575) (865) Professional fees (994) (785) Rental expense (504) (322) Communication expense (748) (230) Transaction costs (3,873) - Other expenses (1,599) (1,049) Finance costs (1) (282) Profit before income tax expense 11,464 10,979 Income tax expense (2,871) (3,318) Profit after income tax expense 8,593 7,661 Other comprehensive income Foreign currency translation 66 - Other comprehensive income for the year, net of tax 66 - Total comprehensive income for the year 8,659 7,661
2017 2016 Equity - retained profits $'000 $'000 Retained profits at the beginning of the financial year - - Profit after income tax expense 8,593 7,661 Transfer to Profits reserve (8,593) (7,661) Retained profits at the end of the financial year - -
For
per
sona
l use
onl
y

Appen Limited Notes to the consolidated financial statements 31 December 2017
Note 32. Deed of cross guarantee (continued)
62
2017 2016 Statement of financial position $'000 $'000 Current assets Cash and cash equivalents 10,025 2,575 Trade and other receivables 9,783 22,699 Derivative financial instruments 123 - Prepayments 437 163 20,368 25,437 Non-current assets Investments accounted for using the equity method 6,337 18,241 Property, plant and equipment 1,363 466 Intangibles 328 200 Intercompany loan 55,070 - Other non-current assets 1,866 - 64,964 18,907 Total assets 85,332 44,344 Current liabilities Trade and other payables 5,888 3,059 Derivative financial instruments 46 199 Income tax 1,584 1,771 Provisions 606 545 Revenue received in advance 473 357 8,597 5,931 Non-current liabilities Borrowings 4 6 Deferred tax 343 1,091 Provisions 473 417 820 1,514 Total liabilities 9,417 7,445 Net assets 75,915 36,899
Equity Issued capital 69,569 19,510 Reserves 6,346 17,389 Total equity 75,915 36,899
For
per
sona
l use
onl
y
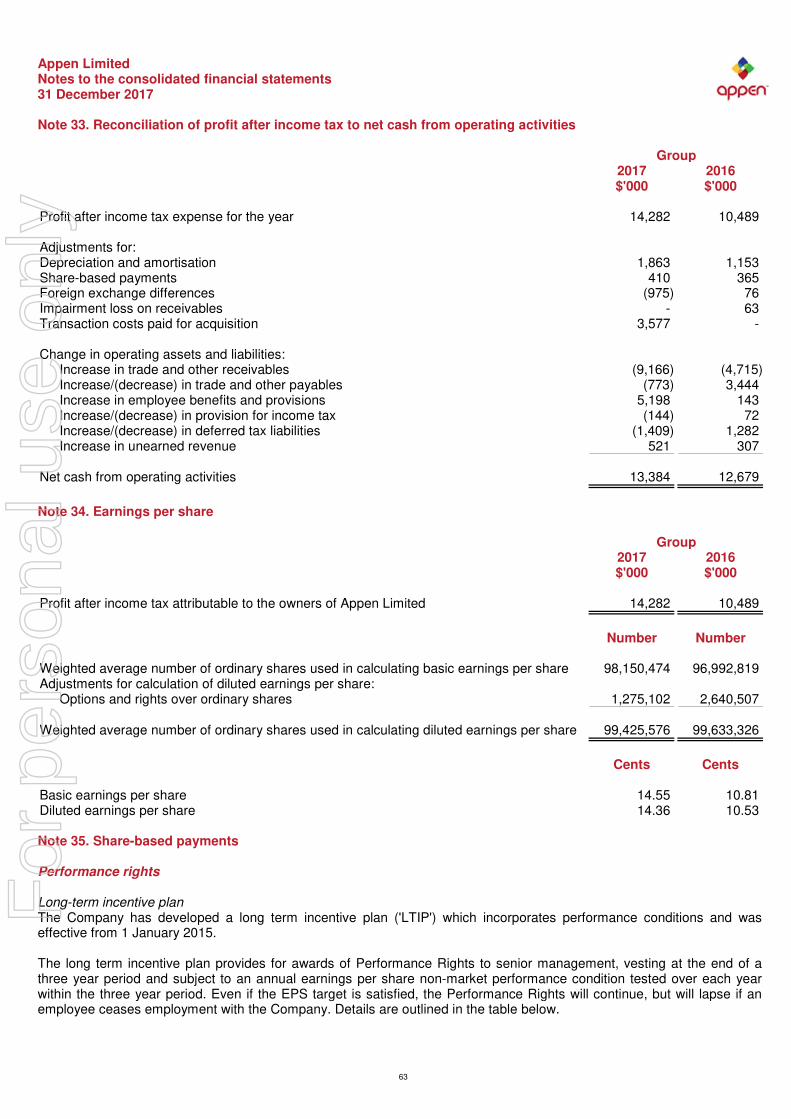
Appen Limited Notes to the consolidated financial statements 31 December 2017
63
Note 33. Reconciliation of profit after income tax to net cash from operating activities Group 2017 2016 $'000 $'000 Profit after income tax expense for the year 14,282 10,489 Adjustments for: Depreciation and amortisation 1,863 1,153 Share-based payments 410 365 Foreign exchange differences (975) 76 Impairment loss on receivables - 63 Transaction costs paid for acquisition 3,577 - Change in operating assets and liabilities:
Increase in trade and other receivables (9,166) (4,715) Increase/(decrease) in trade and other payables (773) 3,444 Increase in employee benefits and provisions 5,198 143 Increase/(decrease) in provision for income tax (144) 72 Increase/(decrease) in deferred tax liabilities (1,409) 1,282 Increase in unearned revenue 521 307
Net cash from operating activities 13,384 12,679
Note 34. Earnings per share Group 2017 2016 $'000 $'000 Profit after income tax attributable to the owners of Appen Limited 14,282 10,489
Number Number Weighted average number of ordinary shares used in calculating basic earnings per share 98,150,474 96,992,819 Adjustments for calculation of diluted earnings per share:
Options and rights over ordinary shares 1,275,102 2,640,507 Weighted average number of ordinary shares used in calculating diluted earnings per share 99,425,576 99,633,326
Cents Cents Basic earnings per share 14.55 10.81 Diluted earnings per share 14.36 10.53 Note 35. Share-based payments Performance rights Long-term incentive plan The Company has developed a long term incentive plan ('LTIP') which incorporates performance conditions and was effective from 1 January 2015. The long term incentive plan provides for awards of Performance Rights to senior management, vesting at the end of a three year period and subject to an annual earnings per share non-market performance condition tested over each year within the three year period. Even if the EPS target is satisfied, the Performance Rights will continue, but will lapse if an employee ceases employment with the Company. Details are outlined in the table below.
For
per
sona
l use
onl
y

Appen Limited Notes to the consolidated financial statements 31 December 2017
Note 35. Share-based payments (continued)
64
The fair value of the performance rights has been measured based on the share price at the date of the grant less the present value of the future dividend stream. The dividend stream has been based on a payout ratio of 40% - 46%, discounted at a discount rate of 2.25%. Set out below are summaries of performance rights granted under the plan: 2017 Balance at Expired/ Balance at the start of forfeited/ the end of Grant date Expiry date the year Granted Exercised other the year 25/02/2015 * 01/03/2018 677,880 - (9,398) (291,210) 377,272 29/07/2015 * 01/03/2018 142,768 - - - 142,768 01/03/2016 ** 01/03/2019 466,272 - - (113,930) 352,342 01/07/2016 ** 01/03/2019 78,303 - - (7,485) 70,818 01/03/2017 *** 01/03/2020 - 315,390 - - 315,390 1,365,223 315,390 (9,398) (412,625) 1,258,590 * Rights are performance based and participant needs to be employed at 1 January 2018 to be able to convert to shares. ** Rights are performance based and participant needs to be employed at 1 January 2019 to be able to convert to shares. *** Rights are performance based and participant needs to be employed at 1 January 2020 to be able to convert to shares. 2016 Balance at Expired/ Balance at the start of forfeited/ the end of Grant date Expiry date the year Granted Exercised other the year 25/02/2015 * 01/03/2018 677,880 - - - 677,880 29/07/2015 * 01/03/2018 142,768 - - - 142,768 01/03/2016 ** 01/03/2019 - 466,272 - - 466,272 01/07/2016 ** 01/03/2019 - 78,303 - - 78,303 820,648 544,575 - - 1,365,223 * Rights are performance based and participant needs to be employed at 1 January 2018 to be able to convert to shares. ** Rights are performance based and participant needs to be employed at 1 January 2019 to be able to convert to shares. The weighted average remaining contractual life of performance rights outstanding at the end of the financial year was 1.00 years (2016: 0.85 years). Options Subscription deeds The Options may be exercised for the exercise price specified on grant of the Option. The Options may only be exercised during the designated exercise period for the relevant tranche of Options. The Options may be exercised by lodging the option certificate, a signed exercise notice and an amount equal to the exercise price multiplied by the number of Options being exercised at the Company’s registered office. On exercise, the holder will be issued one ordinary share for each Option exercised. The Options lapse automatically: - if the Subscriber ceases to be a full-time employee of the Company, subject to the discretion of the Board; or - at the end of the designated exercise period for the relevant tranche of Options. In the event of a reconstruction of share capital, proportionate adjustments (as determined by the Board) will be made to the aggregate number of shares to be issued on the exercise of the Option, or to the exercise price, as appropriate. A holder cannot dispose, encumber or otherwise deal with its Options without the prior approval of the Board. The Company may, with 5 days’ written notice, elect to purchase all of the Options held by the holder for the “option value”, being the value of the shares that would be issued on exercise of the Options, less the relevant exercise price.
For
per
sona
l use
onl
y

Appen Limited Notes to the consolidated financial statements 31 December 2017
Note 35. Share-based payments (continued)
65
Employee Share Option Plan The Board may invite employees of the Group to participate in the Plan. The Options may be exercised for the exercise price specified in the relevant invitation. The Options may only be exercised during a specified exercise period, after the vesting conditions and any other exercise conditions specified in the invitation have been met. The Options may be exercised by delivering an exercise notice to the Company and paying the exercise price. On exercise, the holder will be issued one ordinary share for each Option exercised. Each share acquired on exercise of an Option ranks equally in all respects with all other Shares. All unvested Options lapse automatically if the holder ceases to be employed by the Company. Any vested Options lapse automatically: - if the holder leaves the Company in circumstances which make them a “non-qualifying leaver” including termination for a material breach of their employment agreement, non-performance, fraud, wilful or serious misconduct; or - on the earlier of the expiry date of the Options set out in the invitation and the fifth anniversary of the grant of the Options. In the event of a reconstruction of share capital prior to the exercise of the Options, the number of Shares to be issued on the exercise of the Option and/or the exercise price must be reconstructed accordingly. A holder cannot dispose of their Options without the prior written consent of the Board. Set out below are summaries of Options granted under the plans: 2017 Balance at Balance at Exercise the start of the end of Grant date Expiry date price the year Granted Exercised Forfeited * the year 31/08/2013 01/03/2018 $0.412 81,800 - (81,800) - - 31/08/2013 01/03/2019 $0.494 81,800 - - - 81,800 31/03/2014 01/03/2018 $0.432 20,450 - (20,450) - - 31/03/2014 01/03/2019 $0.489 20,450 - (20,450) - - 24/12/2014 01/03/2020 $0.500 119,531 - (106,250) - 13,281 24/12/2014 01/03/2021 $0.500 438,281 - (425,000) - 13,281 762,312 - (653,950) - 108,362 Weighted average exercise price $0.488 $0.000 $0.487 $0.000 $0.495 * Options forfeited due to participants leaving Appen All options above were granted under the terms of the Employee Share Option Plan. 2016 Balance at Balance at Exercise the start of the end of Grant date Expiry date price the year Granted Exercised Forfeited * the year 31/08/2013 01/03/2018 $0.412 173,825 - (92,025) - 81,800 31/08/2013 01/03/2019 $0.494 173,825 - (92,025) - 81,800 31/03/2014 01/03/2018 $0.432 132,925 - (112,475) - 20,450 31/03/2014 01/03/2019 $0.489 132,925 - (112,475) - 20,450 24/12/2014 01/03/2020 $0.500 610,937 - (491,406) - 119,531 24/12/2014 01/03/2021 $0.500 610,937 - - (172,656) 438,281 1,835,374 - (900,406) (172,656) 762,312 Weighted average exercise price $0.485 $0.000 $0.481 $0.500 $0.488 * Options forfeited due to participants leaving Appen
For
per
sona
l use
onl
y

Appen Limited Notes to the consolidated financial statements 31 December 2017
Note 35. Share-based payments (continued)
66
Set out below are the options exercisable at the end of the financial year: 2017 2016 Grant date Expiry date Number Number 31/08/2013 01/03/2018 - 20,450 31/08/2013 01/03/2019 81,800 20,450 31/03/2014 01/03/2018 - 81,800 31/03/2014 01/03/2019 - 81,800 24/12/2014 01/03/2020 13,281 119,531 24/12/2014 01/03/2021 13,281 - 108,362 324,031
The weighted average share price during the financial year was $4.872 (2016: $2.646). The weighted average remaining contractual life of options outstanding at the end of the financial year was 1.54 years (2016: 3.34 years). Note 36. Events after the reporting period Apart from the dividend declared as disclosed in note 21, no other matter or circumstance has arisen since 31 December 2017 that has significantly affected, or may significantly affect the Group's operations, the results of those operations, or the Group's state of affairs in future financial years.
For
per
sona
l use
onl
y

Appen Limited Directors' declaration 31 December 2017
67
In the directors' opinion: ● the attached financial statements and notes comply with the Corporations Act 2001, the Accounting Standards, the
Corporations Regulations 2001 and other mandatory professional reporting requirements; ● the attached financial statements and notes comply with International Financial Reporting Standards as issued by the
International Accounting Standards Board as described in note 2 to the financial statements; ● the attached financial statements and notes give a true and fair view of the Group's financial position as at 31
December 2017 and of its performance for the financial year ended on that date; ● there are reasonable grounds to believe that the Company will be able to pay its debts as and when they become due
and payable; and ● at the date of this declaration, there are reasonable grounds to believe that the members of the Extended Closed
Group will be able to meet any obligations or liabilities to which they are, or may become, subject by virtue of the deed of cross guarantee described in note 32 to the financial statements.
The directors have been given the declarations required by section 295A of the Corporations Act 2001. Signed in accordance with a resolution of directors made pursuant to section 295(5)(a) of the Corporations Act 2001. On behalf of the directors
___________________________ Christopher Vonwiller Director 21 February 2018 Sydney
For
per
sona
l use
onl
y

Independent Auditor’s Report
To the shareholders of Appen Limited
Report on the audit of the Financial Report
Opinion
We have audited the Financial Report of
Appen Limited (the Company).
In our opinion, the accompanying
Financial Report of the Company is in
accordance with the Corporations Act
2001, including:
• giving a true and fair view of the
Group’s financial position as at 31
December 2017 and of its financial
performance for the year ended on
that date; and
• complying with Australian Accounting
Standards and the Corporations
Regulations 2001.
The Financial Report comprises:
• Consolidated statement of financial position as at 31
December 2017;
• Consolidated statement of profit or loss and other
comprehensive income, consolidated statement of
changes in equity, and consolidated statement of
cash flows for the year then ended
• Notes including a summary of significant accounting
policies
• Directors’ Declaration.
The Group consists of the Company and the entities it
controlled at the year-end or from time to time during
the financial year.
Basis for opinion
We conducted our audit in accordance with Australian Auditing Standards. We believe that the audit
evidence we have obtained is sufficient and appropriate to provide a basis for our opinion.
Our responsibilities under those standards are further described in the Auditor’s responsibilities for
the audit of the Financial Report section of our report.
We are independent of the Group in accordance with the Corporations Act 2001 and the ethical
requirements of the Accounting Professional and Ethical Standards Board’s APES 110 Code of Ethics
for Professional Accountants (the Code) that are relevant to our audit of the Financial Report in
Australia. We have fulfilled our other ethical responsibilities in accordance with the Code.
68
For
per
sona
l use
onl
y
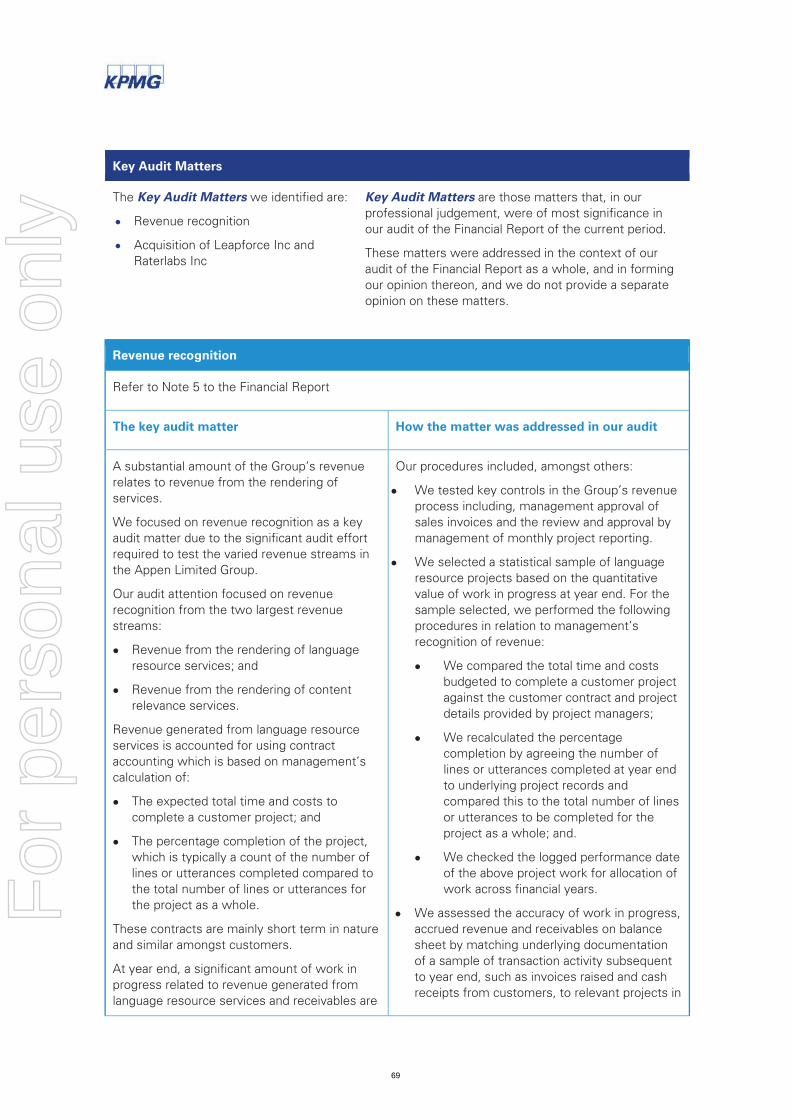
Key Audit Matters
The Key Audit Matters we identified are:
• Revenue recognition
• Acquisition of Leapforce Inc and
Raterlabs Inc
Key Audit Matters are those matters that, in our
professional judgement, were of most significance in
our audit of the Financial Report of the current period.
These matters were addressed in the context of our
audit of the Financial Report as a whole, and in forming
our opinion thereon, and we do not provide a separate
opinion on these matters.
Revenue recognition
Refer to Note 5 to the Financial Report
The key audit matter How the matter was addressed in our audit
A substantial amount of the Group’s revenue
relates to revenue from the rendering of
services.
We focused on revenue recognition as a key
audit matter due to the significant audit effort
required to test the varied revenue streams in
the Appen Limited Group.
Our audit attention focused on revenue
recognition from the two largest revenue
streams:
• Revenue from the rendering of language
resource services; and
• Revenue from the rendering of content
relevance services.
Revenue generated from language resource
services is accounted for using contract
accounting which is based on management’s
calculation of:
• The expected total time and costs to
complete a customer project; and
• The percentage completion of the project,
which is typically a count of the number of
lines or utterances completed compared to
the total number of lines or utterances for
the project as a whole.
These contracts are mainly short term in nature
and similar amongst customers.
At year end, a significant amount of work in
progress related to revenue generated from
language resource services and receivables are
Our procedures included, amongst others:
• We tested key controls in the Group’s revenue
process including, management approval of
sales invoices and the review and approval by
management of monthly project reporting.
• We selected a statistical sample of language
resource projects based on the quantitative
value of work in progress at year end. For the
sample selected, we performed the following
procedures in relation to management’s
recognition of revenue:
• We compared the total time and costs
budgeted to complete a customer project
against the customer contract and project
details provided by project managers;
• We recalculated the percentage
completion by agreeing the number of
lines or utterances completed at year end
to underlying project records and
compared this to the total number of lines
or utterances to be completed for the
project as a whole; and.
• We checked the logged performance date
of the above project work for allocation of
work across financial years.
• We assessed the accuracy of work in progress,
accrued revenue and receivables on balance
sheet by matching underlying documentation
of a sample of transaction activity subsequent
to year end, such as invoices raised and cash
receipts from customers, to relevant projects in
69
For
per
sona
l use
onl
y

recognised on the balance sheet due to a high
volume of projects spanning across year end.
Revenue generated from content relevance
services involved a high volume of transactions
with customers, which are recognised as
services are completed and approved by the
customer. Our audit effort reflects the volume
of projects and transactions for these revenue
types.
work in progress, accrued revenue and
receivables at year end.
• We performed analytical procedures over
revenue from language resource and content
relevance to compare revenue received as
cash receipts to revenue recognised during the
year.
• We selected a statistical sample of revenue
transactions in the months of December 2017
and January 2018 and vouched to underlying
records to check that the revenue was
recognised in the period that the service was
provided.
Acquisition of Leapforce Inc and Raterlabs Inc
Refer to Note 30 to the Financial Report
The key audit matter How the matter was addressed in our audit
The Group completed the acquisition of
Leapforce Inc and Raterlabs Inc. during the
year.
We determined that the accounting for the
business combination was a key audit matter
due to the size of the transaction and the level
of judgement in the calculations.
The key areas of judgement included:
• Determination of purchase consideration
• The fair value of the acquired assets and
liabilities recognised at acquisition date
• Disclosure of the acquisition in the financial
statements
Our procedures included but were not limited to:
• Obtaining the Purchase Agreement to
understand the structure, key terms and
conditions and nature of certain payments. We
evaluated the accounting treatment of the
acquisition consideration and transaction costs
against the criteria in the Accounting Standards
to determine whether the acquisition had been
appropriately accounted for.
• We tested acquisition date opening balances
and checked to underlying documentation
including assessment of fair values as at
acquisition date.
• Assessing the mathematical accuracy of the
Group's calculation of goodwill arising on
acquisition.
• Assessing the appropriateness of the business
combination disclosure in the financial
statements.
70
For
per
sona
l use
onl
y

Other Information
Other Information is financial and non-financial information in Appen Limited’s annual reporting which
is provided in addition to the Financial Report and the Auditor’s Report. The Directors are responsible
for the Other Information.
The Other Information we obtained prior to the date of this Auditor’s Report was the Chairman’s
Report and the CEO’s Report.
Our opinion on the Financial Report does not cover the Other Information and, accordingly, we do not
express an audit opinion or any form of assurance conclusion thereon, with the exception of the
Remuneration Report.
In connection with our audit of the Financial Report, our responsibility is to read the Other
Information. In doing so, we consider whether the Other Information is materially inconsistent with
the Financial Report or our knowledge obtained in the audit, or otherwise appears to be materially
misstated.
We are required to report if we conclude that there is a material misstatement of this Other
Information, and based on the work we have performed on the Other Information that we obtained
prior to the date of this Auditor’s Report we have nothing to report.
Responsibilities of the Directors for the Financial Report
The Directors are responsible for:
• preparing the Financial Report that gives a true and fair view in accordance with Australian
Accounting Standards and the Corporations Act 2001
• implementing necessary internal control to enable the preparation of a Financial Report that gives
a true and fair view and is free from material misstatement, whether due to fraud or error
• assessing the Group’s ability to continue as a going concern and whether the use of the going
concern basis of accounting is appropriate. This includes disclosing, as applicable, matters related
to going concern and using the going concern basis of accounting unless they either intend to
liquidate the Group or to cease operations, or have no realistic alternative but to do so.
Auditor’s responsibilities for the audit of the Financial Report
Our objective is:
• to obtain reasonable assurance about whether the Financial Report as a whole is free from
material misstatement, whether due to fraud or error; and
• to issue an Auditor’s Report that includes our opinion.
Reasonable assurance is a high level of assurance, but is not a guarantee that an audit conducted in
accordance with Australian Auditing Standards will always detect a material misstatement when it
exists.
Misstatements can arise from fraud or error. They are considered material if, individually or in the
aggregate, they could reasonably be expected to influence the economic decisions of users taken on
the basis of this Financial Report.
71
For
per
sona
l use
onl
y

A further description of our responsibilities for the audit of the Financial Report is located at the
Auditing and Assurance Standards Board website at:
http://www.auasb.gov.au/auditors_responsibilities/ar2.pdf. This description forms part of our
Auditor’s Report.
Report on the Remuneration Report
Opinion
In our opinion, the Remuneration Report
of Appen Limited for the year ended 31
December 2017 complies with Section
300A of the Corporations Act 2001.
Directors’ responsibilities
The Directors of the Company are responsible for the
preparation and presentation of the Remuneration
Report in accordance with Section 300A of the
Corporations Act 2001.
Our responsibilities
We have audited the Remuneration Report included in
pages 8 to 17 of the Directors’ report for the year ended
31 December 2017.
Our responsibility is to express an opinion on the
Remuneration Report, based on our audit conducted in
accordance with Australian Auditing Standards.
KPM_INI_01
KPMG Tony Nimac
Partner
Sydney
21 February 2018
72
For
per
sona
l use
onl
y

Appen Limited Shareholder information 31 December 2017
73
Additional information required under ASX Listing Rule 4.10 and not shown elsewhere in this Annual Report is as follows. This information is current as at 7 February 2018. Distribution of equitable securities Analysis of number of equitable security holders by size of holding: Number Number of holders Number Number of options of holders of holders over of of ordinary ordinary performance shares shares* rights** 1 to 1,000 3,633 - - 1,001 to 5,000 3,838 - 13 5,001 to 10,000 666 - 7 10,001 to 100,000 546 3 8 100,001 and over 44 - 4 8,727 3 32
Holding less than a marketable parcel 139 - -
* The options on issue are unquoted and have been issued under an employee incentive scheme. ** The performance rights are unquoted and have been issued under an employee incentive scheme. Equity security holders Twenty largest quoted equity security holders The names of the twenty largest security holders of quoted equity securities are listed below: Ordinary shares % of total shares Number held issued J P MORGAN NOMINEES AUSTRALIA LIMITED 17,104,526 16.17 C & J VONWILLER PTY LIMITED 13,060,083 12.34 HSBC CUSTODY NOMINEES (AUSTRALIA) LIMITED 11,177,700 10.56 CITICORP NOMINEES PTY LIMITED 10,463,735 9.89 NATIONAL NOMINEES LIMITED 5,220,515 4.93 CS THIRD NOMINEES PTY LIMITED 3,501,018 3.31 CITIBANK NA 2,787,826 2.63 UBS NOMINEES PTY LTD 2,358,057 2.23 NEW GREENWICH PTY LTD 1,800,495 1.70 CS FOURTH NOMINEES PTY LIMITED 1,692,238 1.60 BNP PARIBAS NOMS PTY LTD 1,608,619 1.52 ANACACIA PTY LIMITED 1,000,000 0.95 GINGA PTY LTD 925,494 0.87 BRISPOT NOMINEES PTY LTD 778,872 0.74 BNP PARIBAS NOMINEES PTY LTD 525,700 0.50 SIDMOUTH PTY LTD 400,000 0.38 NAMAL (L) LTD 300,000 0.28 MR WILLIAM JOHN LAUKKA & MRS ELIZABETH ANNE LAUKKA 250,229 0.24 MIJON INVESTMENTS PTY LTD 250,229 0.24 BNP PARIBAS NOMINEES PTY LTD 245,515 0.23 75,450,851 71.31
For
per
sona
l use
onl
y
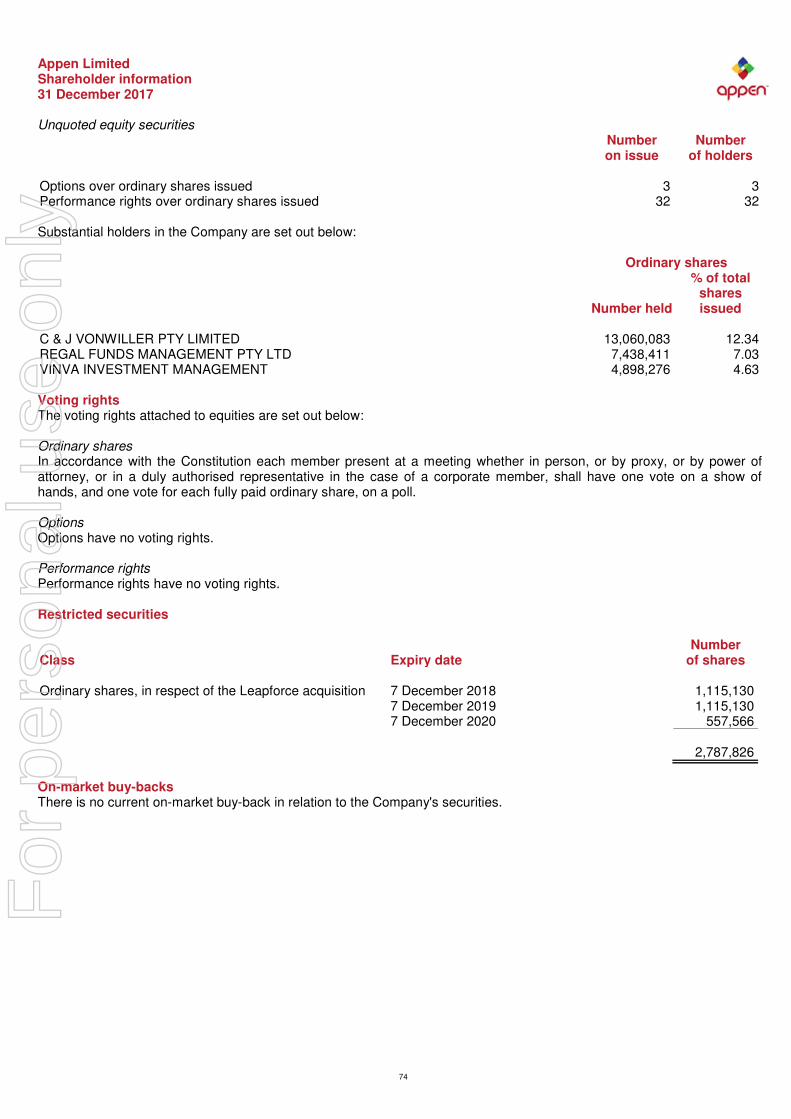
Appen Limited Shareholder information 31 December 2017
74
Unquoted equity securities Number Number on issue of holders Options over ordinary shares issued 3 3 Performance rights over ordinary shares issued 32 32 Substantial holders in the Company are set out below: Ordinary shares % of total shares Number held issued C & J VONWILLER PTY LIMITED 13,060,083 12.34 REGAL FUNDS MANAGEMENT PTY LTD 7,438,411 7.03 VINVA INVESTMENT MANAGEMENT 4,898,276 4.63 Voting rights The voting rights attached to equities are set out below: Ordinary shares In accordance with the Constitution each member present at a meeting whether in person, or by proxy, or by power of attorney, or in a duly authorised representative in the case of a corporate member, shall have one vote on a show of hands, and one vote for each fully paid ordinary share, on a poll. Options Options have no voting rights. Performance rights Performance rights have no voting rights. Restricted securities Number Class Expiry date of shares Ordinary shares, in respect of the Leapforce acquisition 7 December 2018 1,115,130 7 December 2019 1,115,130 7 December 2020 557,566 2,787,826
On-market buy-backs There is no current on-market buy-back in relation to the Company's securities.
For
per
sona
l use
onl
y